Abstract
The increasing incidence of epilepsy has led to the need for automatic systems that can provide accurate diagnoses in order to improve the life quality of people suffering from this neurological disorder. This paper proposes a method to automatically classify epilepsy types using EEG recordings from two databases. This approach uses the spectral power density of intrinsic mode functions (IMFs) that are obtained through the empirical mode decomposition (EMD) of EEG signals. The spectral power density of IMFs has been applied as features for the classification of focal and non-focal, as well as of focal and generalized EEG signals. The data are then classified using K-nearest Neighbor (KNN) and Naïve Bayes (NB) classifiers. The focal and non-focal data were classified with high accuracy, with KNN and NB classifiers achieving a maximum classification rate of 99.90% and 99.80%, respectively. Focal and generalized epilepsy data were classified with high rates of accuracy during wakefulness and sleep stages, with KNN achieving a maximum rate of 99.49% and NB achieving 99.20%. This method shows significant improvements in the classification of EEG signals in epilepsy compared to previous studies. It could potentially aid clinical decisions for epilepsy patients.
1. Introduction
Epilepsy is a neurological disease that causes a group of neurons in the brain to release excessive electrical impulses known as seizures, which indicate a quick fluctuation with potential changes in the EEG recordings of the affected patients [1]. In order to identify the type of seizures experienced by epileptic patients, neurologists have to investigate and visually analyze EEG recordings, which implicate many hours of work, and this interpretation could be subjective, time-consuming, and inefficient, particularly in the case of long-term EEG recordings [1].
According to the latest World Health Organization (WHO) report, nearly 50 million people suffer from epilepsy worldwide. It is worth noting that the number of people affected by epilepsy is likely to be underestimated as many people with epilepsy might not be diagnosed [2].
Epilepsy can be controlled with a combination of medications and lifestyle changes, and it can be treated by surgical treatment. The first step in the surgical treatment of epileptic patients is the identification of the epileptogenic areas. That is why it is very important to correctly classify the type of epilepsy. Therefore, it is imperative to develop reliable classification methods to aid in accurate diagnosis.
Electroencephalography (EEG) is a non-invasive medical test that can be used to evaluate the electrical activity of the brain and to monitor the electrical activity of the brain over time. It is a commonly used diagnostic tool in the assessment of epilepsy. By measuring the electrical activity of the brain, EEG can help diagnose epilepsy and determine the type of seizures a person is experiencing. It can also provide important information to help in the development of a treatment plan and to monitor treatment effectiveness [3].
According to the International League Against Epilepsy (ILAE), epilepsy can be classified into focal epilepsy, focal epilepsy with secondary generalization, and generalized primary epilepsy. The type of epilepsy is indicated and characterized by analyzing EEG signals. The EEG signals of patients with different types of epilepsy, such as focal, non-focal, or generalized epilepsy, have distinct patterns allowing for differentiation between the types [4].
Focal epilepsy is represented by the onset of seizures only in one brain area. More than 60% of patients have focal epilepsy, also known as partial epilepsy [4]. Focal epilepsy with secondary generalization means that the seizures initially appear in one brain area but then are extended to other lobes/ brain areas. EEG focal signals are collected from that restricted brain area where normal brain activity is disturbed. In [5], a new type of signal collected from the brain was mentioned, that is, non-focal (NF) EEG signals, which are recorded from brain regions that do not contribute to seizure onset.
In cases of focal epilepsy, seizures cannot be controlled by medications alone, and therefore, it may be useful to elaborate signal processing methods to recognize and locate the epileptic areas in order to be surgically rejected [6].
Primary generalized epilepsy is characterized by interictal epileptiform discharges with a generalized, highest distribution on both sides of the brain (described by spikes and polyspike waves with a frequency greater than 3 Hz), reflecting the involvement of both cerebral hemispheres [7]. More than 20% of patients have generalized epilepsy [4]. EEG recordings are collected from the entire brain [7].
Several algorithms have been proposed for processing EEG signals to extract relevant features that are related to epilepsy seizures and classify different types of epilepsy.
Signal processing methods used for analyzing EEG signal frequency components include Fourier Transform, Discrete Wavelet Transform, Continuous Wavelet Transform, Principal Component Analysis (PCA), Independent Component Analysis (ICA), and Adaptive Mode Decomposition. Machine learning-based classifying methods such as K-nearest Neighbor (KNN), Support vector machine (SVM), Linear discriminant analysis (LDA) [8], Decision Tree, Random Forest, Sparse Bayesian learning [9], and Naïve Bayes (NB) are likewise employed for epilepsy detection [10,11].
Researchers have also focused on nonlinear methods such as Lyapunov exponents, fractal dimension, central tendency measures (CTM), Renyi, Shannon, Fuzzy, sample, phase, permutation entropies, and Correlation Dimension [4,12]. An increasing trend in using Adaptive Mode Decomposition (AMD) methods such as Empirical Mode Decomposition (EMD), Empirical Wavelet Transform (EWT), and Variational Mode Decomposition (VMD) has been developed in recent years [13,14].
In [15], an automatic learning algorithm based on the extreme gradient boosting (XGB) method was used to identify patients with generalized epilepsy from EEG data. The following features: detrended fluctuation analysis, approximate entropy, Hurst exponent, Higuchi, Lyapunov exponent, and EEG band power were extracted in order to automatically identify generalized epilepsy and generalized seizures.
A method based on the EMD of EEG signals is presented in [16]. The used features are average sample entropies and show an average variance of instantaneous frequency for the intrinsic mode functions (IMFs). These features were fed into a least squares support vector machine (LS–SVM) classifier with a radial basis function (RBF) as a kernel for the classification of focal and non-focal EEG signals. This technique was applied to 50 recordings of focal and 50 recordings of non–focal EEG signals and achieved an accuracy of 85%.
In [17], entropy measures were applied to IMFs obtained from the EMD of EEG signals. This method led to an average classification accuracy of 87%. In [18], orthogonal wavelet filter banks and entropy features were used. The method was applied to the Bern database [19] and attained a high accuracy of 94.25% with an LS–SVM classifier.
The empirical mode decomposition method proposed in [20] can decompose non-stationary signals recursively with a high resolution based on signal features. Some researchers have extended this method in their research, such as the local mean decomposition method and the Ensemble Empirical Mode Decomposition method (EEMD). By contrast, some researchers have used time domain features, including frequency, line length, and the power of raw EEG signals, as relevant features to effectively detect epilepsy seizures [21,22].
From the above-mentioned studies, it can be observed that extracting appropriate features from EEG signals represents an essential step in the detection of epilepsy type. A signal processing method could be developed to discriminate between different types of epileptic EEG signals, enabling the localization of the epileptogenic area [19].
The current research proposes an EMD-based method and power spectral density feature extraction for discrimination between focal and non-focal EEG signals and between focal and generalized EEG signals. Firstly, EMD was used to decompose the EEG signals into IMFs. The power spectral density of each extracted IMFs was computed and proposed as features to classify two different classes of EEG epileptic signals. The data were classified with KNN and NB classifiers, and the performances of these classifiers were assessed by means of classification rate, sensitivity, specificity, F1-Score, Matthews Correlation Coefficient (MCC), and Kappa Coefficient.
This work provides a new perspective for data classification compared to the state-of-the-art, achieving high performance in identifying the type of EEG epileptic signals.
The article is organized as follows. Section 2 describes the databases and the methods used in this study. Section 3 presents the results and compares the performance of the classifiers. Section 4 discusses the implications of our outcomes and compares them to previous approaches. Finally, Section 5 provides the conclusions and suggests future directions.
2. Materials and Methods
2.1. Databases
In order to validate the proposed method, two databases were used in this work. The first one is a common and free database from the Department of Neurology, University of Bern, Barcelona [23]. The database contains 3750 focal and 3750 non–focal intracranial EEG recordings from five epileptic patients collected from the and zones. Signals from the zone were collected randomly from any of the five patients and any channel that detected the first ictal EEG signal. The signals from the zone corresponded to neighboring focal channels. The sampling rate was either 512 Hz or 1024 Hz, depending on whether the number of acquisition channels was greater or smaller than 64.
In this work, we used an initial 1000 EEG signals of focal epilepsy and 1000 EEG signals of non–focal epilepsy. The signals underwent digital band-pass filtering between the frequency range of 0.5 to 150 Hz using a fourth-order Butterworth filter. Each signal was recorded for 20 s, including 10,240 samples, which were obtained at a sampling rate of 512 Hz [19]. The developed method was applied only to the area corresponding to the channels that detected the first seizure-related EEG changes in the neocortex [24].
A second database was created in the EEG Epilepsy and Monitoring Center in Cluj-Napoca, Romania. The acceptance of the Ethics Committee was obtained through the patient’s informed consent, with access to anonymized raw data. EEG signals were recorded from the scalp with a Nicolet Clinical EEG Natus System using 21 channels. The ictal EEG recordings were considered optimal in the diagnosis of epilepsy; however, it can be challenging to acquire these recordings in real-life scenarios. As a result, interictal epileptiform activities, which are associated with epilepsy, were used as diagnostic tools [25].
The database consists of interictal epileptiform recordings collected from 50 epileptic patients, 34 female and 16 male patients, aged between 2 and 66 years. The EEG recordings were acquired during wakefulness, during nap sleep (with an approximate duration of 1 h), and during sleep (with an approximate duration of 8 h).
Patients fall into one of the epilepsy types: focal/partial epilepsy or generalized primary epilepsy. Among the 50 subjects, 18 were confirmed to have generalized epilepsy by the neurologist after identifying interictal epileptiform activity in their EEG signals, 31 were confirmed to have focal epilepsy, and 1 case was confirmed to have a potentially epileptic syndrome. The database contained 17 recordings from sleep time, 5 recordings from nap/siesta sleep, and 31 recordings captured during wakefulness.
In this study, we used 30 EEG recordings that were collected during wakefulness and 16 EEG recordings collected during sleep. We selected the most representative cases based on the diagnoses provided by a neurologist. The sampling rate was 1000 Hz, and each recording contained 242900 samples that were recorded for approximately 234 s.
We loaded focal (F), non–focal (NF), and generalized (G) EEG signals from the databases and presented examples of their graphical representations in Figure 1 and Figure 2.
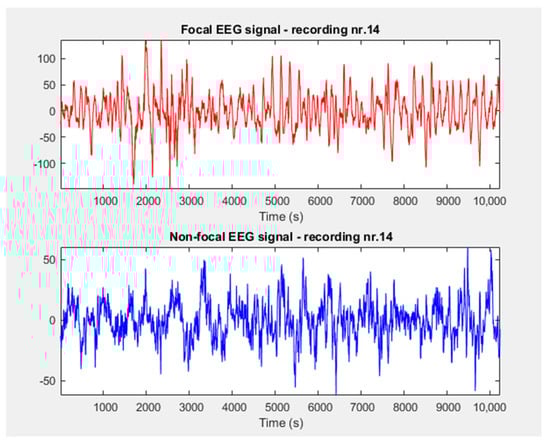
Figure 1.
Focal and non–focal signals extracted from Bern database.
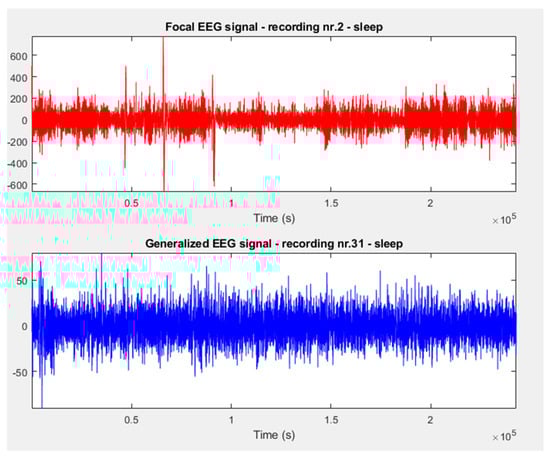
Figure 2.
Focal and generalized signals extracted from Cluj–Napoca database.
2.2. Method
2.2.1. Empirical Mode Decomposition
The empirical mode decomposition technique, also named Hilbert–Huang transform (HHT), has gained considerable attention and has been widely applied in a diverse range of time-frequency analyses [20].
The EMD method is intuitive and adaptable and has been commonly employed in the analysis of non-stationary signals, particularly in EEG recordings [22].
The EMD algorithm, first introduced by Huang et al. in 1998 [21], is a technique that makes use of an iterative sifting process to decompose a given signal into a finite set of “modes”, known as IMFs. These modes exhibit both the amplitude modulation (AM) and the frequency modulation (FM) of signal components.
This algorithm recurrently detects local minima/maxima in a signal, creates lower and upper envelopes by connecting these extrema, subtracts the average of these envelopes as a “low-pass” centerline, thereby separating high-frequency oscillations as a “mode” of the signal, and continues the process iteratively on a residual “low-pass” central line until a satisfactory decomposition is obtained [20].
To decompose a signal by the EMD method, the achieved band-limited IMFs must fulfill the following two conditions:
- The number of extrema and zero-crossings should differ by no more than one.
- The mean of the envelopes defined by the minima and maxima must be zero for each IMF.
The signal decomposed by EMD can be expressed as the sum of a finite number of IMFs and a residual value:
where is the number of IMFs, is the ith IMF and is the final residual value.
The original signal can be recovered by summing the IMF components and the residual value [26]. The IMFs are typically arranged according to their frequency content, starting with the highest frequency and ending with the lowest frequency, which allows for the examination of the signal at various frequency ranges. Firstly, oscillations in the gamma band (>30 Hz)—IMF1 were estimated, followed by oscillations in the beta band (14–30 Hz)—IMF2, oscillations in the alpha band (8–14 Hz)—IMF3, oscillations in the theta band (4–8 Hz)—IMF 4, and finally, oscillations in the delta band (0.5–4 Hz)—IMF5, IMF6 [27].
The proposed method for EEG signals classification was based on the application of the EMD method, the selection of the number of IMFs, and the application of power spectral density on each IMF. Further, an efficient feature vector from spectral characteristics was formed, and the corresponding labels (F/NF and F/G) were assigned. The data were classified using KNN and NB classifiers.
Figure 3 presents a flowchart for the proposed method.
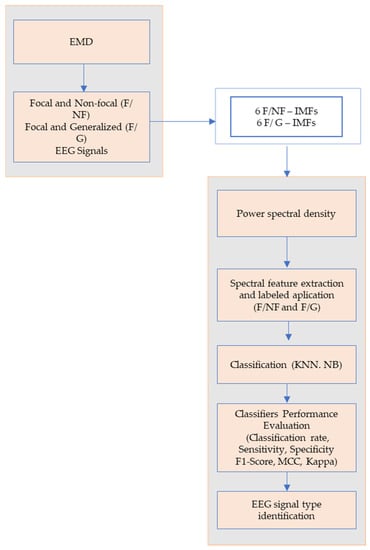
Figure 3.
The flowchart for the proposed epileptic EEG signal classification method.
2.2.2. Feature Extraction
In order to extract spectral characteristics of epileptic signals, the most common types of EEG analysis are based on the analysis of the signal frequency. The spectral analysis of the EEG signal is essential since epileptic activity interrupts normal brain functionality [28].
In this work, we computed the power spectral density (PSD) of each IMF extracted from the EEG recordings.
The spectral features obtained were used as input to the classifiers.
While there are other time-frequency methods that can provide more detailed information about EEG signals, power spectral density (PSD) estimate is a valuable feature for EEG signal classification due to its ease of computation and ability to capture changes in frequency content [29].
Although the Welch method is commonly used for estimating PSD due to its robustness, the Yule–Walker has several advantages. The Welch method typically requires windowing, which can introduce spectral leakage [30]. This is not a concern with the Yule–Walker method which provides a better frequency resolution [31] and does not require windowing. In addition, the Yule–Walker method is a parametric method that models the data using a linear combination of autoregressive coefficients, providing a more accurate estimation of the true PSD and does not require data segmentation compared to the non-parametric Welch method which involves data segmentation with the cost of the trade-off between time and frequency resolution [30]. EEG spectral analysis is based on a collection of frequency sub-bands that cover a range of frequencies that are typically present in the EEG signal. Medically, it is widely acknowledged that brainwaves are split into sub-bands based on their frequency, including delta (0–4 Hz), theta (4–8 Hz), alpha (8–13 Hz), beta (13–30 Hz), and gamma (30–80 Hz) rhythms [28].
2.2.3. Classification
In this research, the data were classified using the K-nearest neighbors and Naïve Bayes classifiers. A ten-fold cross-validation procedure was used to assess the performance of the classifiers.
Previous studies [24,32] have tested several classifiers and demonstrated that the KNN and NB classifiers were most appropriate for distinguishing between two different classes of EEG data. We chose these classifiers because KNN is a simple yet effective classifier that works well with EEG signals and can handle nonlinear decision boundaries. NB, on the other hand, is a probabilistic classifier that works well with high-dimensional datasets and can handle missing data [33].
The KNN classifier is a type of instance-based learning or non-parametric method that can be used for the classification of signals. The classifier works by finding the K number of closest training examples in feature space and determining the majority class among those K-nearest neighbors [4]. The Euclidean distance metric is used in this study, with a selected value of 5 for K.
The naïve Bayes classifier is a probabilistic algorithm based on Bayes’ theorem. It is a simple but powerful algorithm that can make class predictions based on the probability of a given feature set belonging to each class. The Naïve Bayes classifier makes a strong assumption about the independence of the features, hence the name “naïve” [34].
For epileptic signal classification, KNN and NB classifiers have been used in various studies as a technique to classify EEG signals. The algorithms have been applied to classify normal and abnormal [15], focal and non-focal EEG signals, and ictal, interictal, or postictal stages of seizures [33].
2.2.4. Performance Evaluation of the Proposed Classifiers
Six performance parameters have been used to evaluate the classifiers: sensitivity or recall, specificity, classification rate, F1-Score, Matthews Coefficient Correlation (MCC), and Kappa Coefficient.
The sensitivity or recall of a seizure diagnosis test indicates the capability to correctly identify the focal EEG signals.
The specificity of a seizure diagnosis test indicates a capability to correctly identify non–focal and generalized EEG signals, respectively.
Classification rates correspond to the proportion of EEG signals that have been correctly classified.
Precision represents the ratio between the number of positive samples and the sum of true positive and false positive samples.
The F1-Score is a parameter that computes the average of precision and recall [35]. The F1-Score formula is:
MCC generates a high score if the classifier is able to correctly predict the most cases of positive data and the most cases of negative data.
The Kappa coefficient can be used in classification as a measure of agreement between observed and predicted or inferred classes, for instance, in the test data set [36].
The confusion matrix used to evaluate the classification performance includes four metrics:
True Positives (TP) represent the number of focal EEG signals that can be correctly classified as focal. False Positives (FP) represent the number of focal EEG signals classified as non–focal and generalized EEG signals. True Negatives (TN) represent the number of non–focal and generalized EEG signals, respectively, which can be correctly classified as non-focal and generalized. False Negatives (FN) represent the number of focal EEG signals classified as non–focal and generalized [37]. Together, these metrics allowed us to assess the accuracy of the classifiers.
3. Results
The offline method was implemented in the MATLAB programming environment using an AMD Ryzen 7 2700X CPU and a Windows 11 PRO 64–bit Operating System.
Firstly, the method was applied to 1000 focal and 1000 non–focal EEG recordings, respectively, from the Bern public database. Only the signals from the -zone were used, with features extracted for the focal/non–focal zone to discriminate and classify the two types of epileptic signals: focal (F) and non–focal (NF).
The recordings had a length of 10,240 samples with a sampling rate of 512 Hz. The EEG signals were decomposed using the EMD method, and only the first 6 IMFs were maintained for further analysis. The frequency content in the IMF decreased from the first to the sixth IMF. The choice of using only 6 IMFs was based on the statement that the brain signals typically contain dominant frequency components in the delta, theta, alpha, beta, and gamma frequency bands. In our study, based on the previous literature [38] and signal characteristics, using 6 IMFs was deemed sufficient for the classification of epileptic EEG signals.
By decomposing the EEG signal into IMFs, which correspond to specific frequency bands, the EMD method could indirectly filter out some of the noise (such as the motion artifacts) present in the original signal [39].
Empirically decomposed IMFs of a focal and of a non–focal EEG signal, randomly selected from the Bern dataset, are shown in Figure 4a,b. In other words, the figures show the frequency components of the original signal represented by each IMF.
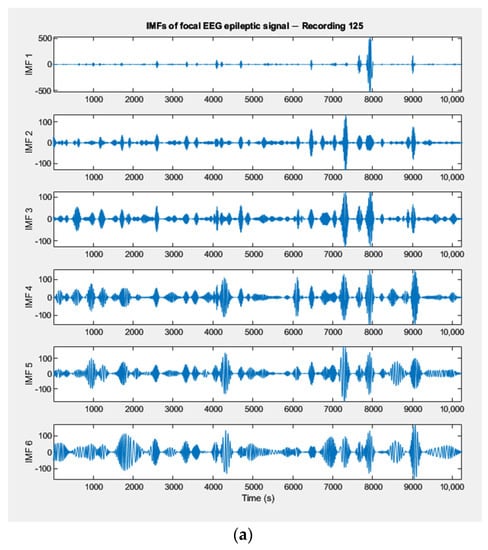
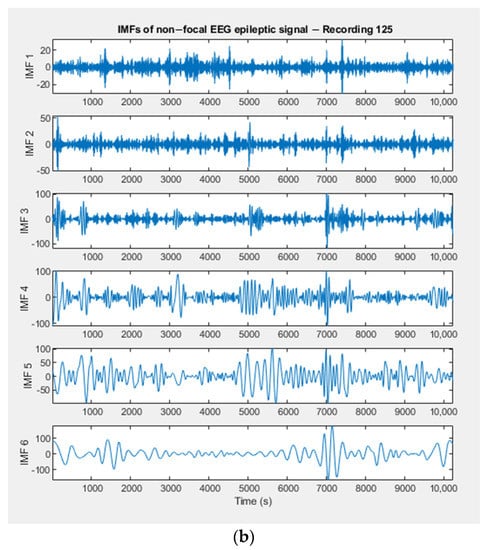
Figure 4.
(a) IMFs extracted by the EMD method from a focal EEG recording (Bern Database). (b) IMFs extracted by the EMD method from a non–focal EEG recording (Bern Database).
The power spectral density of each IMF was extracted from a focal and non-focal EEG signal and was computed using the Yule–Walker method [31]. The distribution of power in the IMFs of the EEG signal across different frequency bands was employed as a feature vector in the classification stage. Figure 5a,b displays the PSD representations of the extracted IMFs from focal and non-focal EEG signals, respectively, which were estimated using the Yule–Walker method.
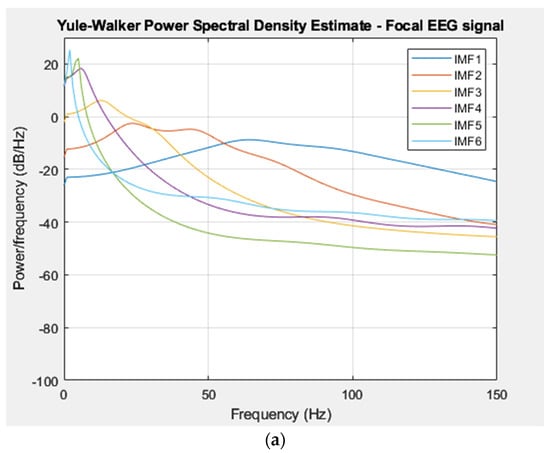
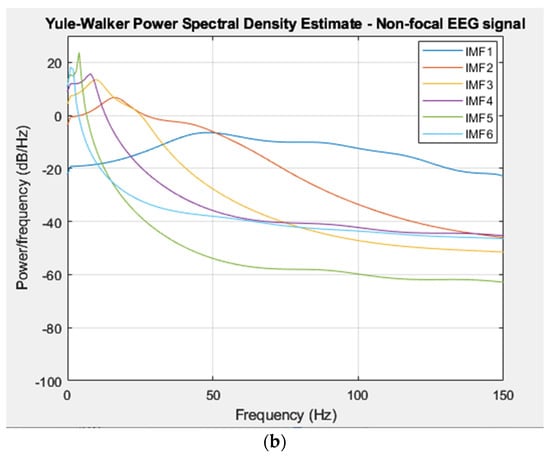
Figure 5.
(a) PSD of IMFs for a focal EEG recording (Bern Database). (b) PSD of IMFs for a non–focal EEG recording (Bern Database).
PSDs were normalized, and then a feature vector was composed of spectral features extracted from focal and non-focal signals, resulting in a feature vector of 1026 × 6 sizes. The EEG signals were classified with the chosen classifiers based on the extracted features.
The performance of the classifiers was evaluated by calculating the metrics mentioned above. The formulas for these metrics, which are based on the positive, negative, false negative, and false positive classes, were implemented in the MATLAB programming environment using Statistics and Machine Learning Toolbox [40].
The current method was also applied to the Cluj–Napoca database, using signals that were recorded during the wakefulness and sleep stages. The signals recorded during siesta sleep were excluded due to limited data. The study used 30 EEG recordings captured during wakefulness, comprising 18 focal signals and 12 generalized signals, resulting in 216 situations to classify. Similarly, 16 EEG recordings obtained during sleep were also used, consisting of 12 focal signals and 4 generalized signals, resulting in a total of 48 unique classification situations.
The recordings consisting of 242,900 samples were sampled at a rate of 1000 Hz. The focal and generalized EEG signals were decomposed using the empirical mode decomposition method, and the first 6 IMFs were extracted. The relevance of the brain rhythms was covered by the frequency ranges of IMF1–IMF6. Figure 6a,b illustrates the extracted IMFs for a focal and generalized signal, respectively, as well as the signals collected during sleep.
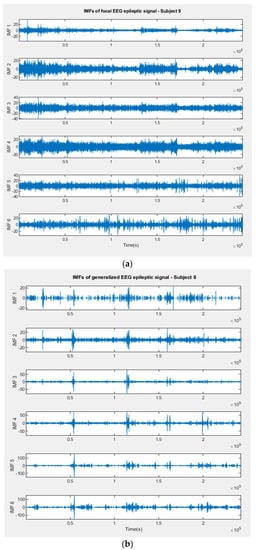
Figure 6.
(a) IMFs extracted by EMD method from a focal EEG recording (Cluj–Napoca Database). (b) IMFs extracted by EMD method from a generalized EEG recording (Cluj–Napoca Database).
The PSD was calculated for each extracted IMF from focal and generalized EEG signals using the Yule–Walker method. The PSD was then used as a feature in the classification process. The PSD representations in Figure 7a,b show the Yule–Walker estimation outcomes for IMFs of focal signals (Subject9) and generalized EEG signals, respectively (Subject8).
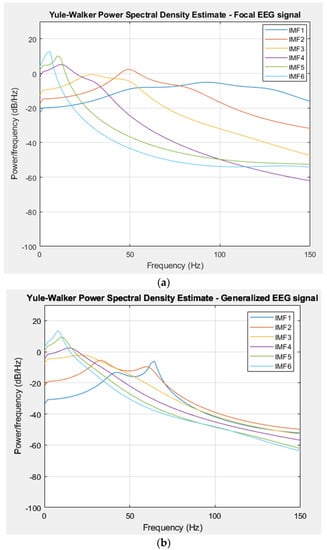
Figure 7.
(a) PSD of IMFs for a focal EEG recording (Cluj–Napoca Database). (b) PSD of IMFs for a generalized EEG recording (Cluj–Napoca Database).
The normalization of the PSD results was carried out and employed to form a 1026 × 6 feature vector, operating spectral features from both focal and generalized signals. The effectiveness of the used classifiers was measured by evaluating the previously mentioned metrics.
The following tables present the results obtained through the proposed method for classifying EEG epileptic signals, which were focal or non–focal and focal or generalized. Descriptive statistics, including minimum, maximum, mean, and median values, were computed using standard formulas to summarize the performance of the method.
The EEG signals were classified into two categories, focal and non–focal signals, using KNN and NB classifiers.
According to Table 1 and Table 2, the classification rate of the classification results using the KNN classifier ranged from 73.95% to 99.90%, with 597 classification cases exceeding a 90% classification rate value. The classification rates ranged from 74.70% to 99.80% using the NB classifier, with 592 classification cases exceeding 90%.

Table 1.
The results with the KNN classifier for discrimination between focal and non–focal epilepsy—Bern database.
Table 2.
The results with the NB classifier for discrimination between focal and non–focal epilepsy—Bern database.
The KNN classifier has the capability to recognize focal EEG data with a maximum sensitivity of 100%, with 605 values out of a total of 1000 cases that were classified as greater than 90%. When the data were classified using the NB classifier, the range of sensitivity varied from 74.85% to 100%, with 609 values higher than 90%. The results of the specificity for the EEG signals using the KNN classifier lay from 73.18% to 100%, with 576 values exceeding 90%. The same was observed for the NB classifier, with a range from 73.32% to 100% and 576 values greater than 90%.
The classifiers’ performances were also evaluated using the F1-Score, MCC, and Kappa Coefficient metrics. Table 3 and Table 4 show similar F1-Score results for both KNN and NB classifiers—these signals were classified with a maximum F1-Score value of one. The KNN classifier achieved F1-Scores greater than 0.5 for 921 of the classified recordings, while the NB classifier achieved F1-Scores greater than 0.5 for 911 of the recordings.
Table 3.
Performances of KNN classifiers based on the F1-Score, MCC, and Kappa Coefficient—Bern database.
Table 4.
Performances of NB classifiers based on F1-Score, MCC, and Kappa Coefficient—Bern database.
Reference [36] states that when the results of the Matthews Correlation Coefficient and the Kappa Coefficient were close, it showed that the classifiers could effectively distinguish epilepsy EEG signals. Both classifiers achieved maximum values of one for both MCC and Kappa Coefficient, which indicates a perfect agreement between the predicted and actual values.
The EEG data recorded in the wakefulness stage was classified into two categories: focal and generalized signals with KNN and NB classifiers. The results of this classification are presented in Table 5, Table 6, Table 7 and Table 8.
Table 5.
The results with the KNN classifier for discrimination between focal and generalized epilepsy—Cluj–Napoca database.
Table 6.
The results with the NB classifier for discrimination between focal and generalized epilepsy—Cluj–Napoca database.
Table 7.
Performances of KNN classifier based on F1-Score, MCC, and Kappa Coefficient—Cluj–Napoca database.
Table 8.
Performances of NB classifiers based on F1-Score, MCC, and Kappa Coefficient—Cluj–Napoca database.
According to Table 5 and Table 6, the KNN classifier achieved a classification rate ranging from 85.64% to 99.47%. The classifier achieved a classification rate greater than 90% in 211 out of 216 classification cases. The NB classifier exhibited classification rates ranging from 83.30% to 99.20% for the 216 cases that were classified, with 213 of these cases achieving a classification rate greater than 90%.
The KNN classifier showed sensitivity values ranging from 85.74% to 99.89%. The NB classifier showed sensitivity values from 76.47% to 99.61%. In both classifiers, 214 cases were classified with a sensitivity exceeding 90%.
The specificity attained was from 85.84% to 99.52%, with 209 values greater than 90% for the KNN classifier, and from 72.55% to 99.22%, with 210 values greater than 90% for the NB classifier.
Table 7 and Table 8 indicate that both KNN and NB classifiers achieved a maximum F1-Score of one for wakefulness data classification. Furthermore, in 210 classification situations, both classifiers attained an F1-Score greater than 0.5. MCC and Kappa had values of one for both KNN and NB classifiers.
The data recorded during sleep were classified into focal and generalized signals. The results obtained with the proposed classifiers were also presented in Table 5, Table 6, Table 7 and Table 8. The sleep state data were categorized with a classification rate ranging from 89.14% to 98% using the KNN classifier and from 87.95% to 98.4% using the NB classifier. It is worth noting that both classifiers achieved a classification rate greater than 90% for 47 out of 48 cases that were classified, indicating that the estimated power spectral density of IMFs has a higher discrimination performance for focal and generalized epilepsy signals in the sleep state compared to the awake state.
The KNN classifier achieved a sensitivity range from 88.95% to 100%, with 47 out of 48 classified case results exceeding 90% sensitivity. The NB classifier had a sensitivity range from 87.95% to 100%, with 46 classified case values greater than 90%.
The KNN classifier had a specificity range from 89.33% to 99.81%. The NB classifier had a specificity range from 88.33% to 99.61%. Both classifiers achieved specificity values greater than 90% for 47 out of 48 classified situations.
For the signals collected during sleep, the data were classified with a maximum F1-score of one for both classifiers. These results are presented in Table 7 and Table 8. The F1-Score exceeded a 0.5 value in 46 and 44 classification cases with KNN and NB, respectively, indicating that the model’s precision and recall were both correctly estimated.
The KNN and NB classifiers had a high performance in classifying the signals, with maximum values of one for both MCC and the Kappa Coefficient. An MCC score of one indicates a perfect classification, while a Kappa Coefficient score of one indicates a complete agreement between the predicted and actual labels [36].
The accuracy of the classification may vary depending on external factors during the EEG recordings, the patient’s age, their activity during the recording, and other factors related to signal processing. Some recordings may have a lower F1-Score, MCC, and Kappa Coefficient due to these factors. However, overall, the proposed method showed significant improvements compared to alternative methods used in signal classification for the Bern, Barcelona database [41,42].
The classification results obtained for the Cluj–Napoca database showed that data collected during sleep was classified as focal and generalized EEG epilepsy signals with a higher sensitivity and specificity compared to the data collected during wakefulness. This could be due to the cerebral activity associated with different states of consciousness.
4. Discussion
The data from the University of Bern, as used in this work, are commonly found in many studies due to their large amount of recorded epilepsy data. Table 9 presents a comparison between our study and other works that employ different methods to classify focal and non-focal EEG epilepsy signals using the Bern database. The methods and classifiers used are further reported, and the results are presented according to the maximum values obtained.
The purpose of this study was to accurately classify EEG data from patients with epilepsy and then to determine the type of epilepsy. This is important because, as stated by medical professionals, correctly diagnosing epilepsy plays a crucial role in determining appropriate antiepileptic treatment and in planning surgical intervention for seizure focus resection [43]. The aim of the study was successfully achieved through the proposed method, resulting in higher data classification accuracy being attained compared to the results reported in Table 9.
Table 9.
Comparisons with other works using the Bern database.
Table 9.
Comparisons with other works using the Bern database.
| Work | Method/ Feature Extracted | Classifiers | Results |
|---|---|---|---|
| [16] | EMD/ | ||
| The average sample entropy of the IMFs | Least square support vector machine (LS–SVM) | Classification Rate: 85% | |
| The average variance of the instantaneous frequencies of the IMFs | |||
| [44] | EMD/ Average Renyi entropy and average negentropy | Neural Network | Classification Rate: 98.33% |
| [45] | EMD–DWT/ Log–energy entropy | SVM KNN city–block distance | Classification Rate: 89.4% (KNN) Sensitivity: 90.7% (KNN) |
| [46] | Approximate Entropy, Sample Entropy and Fuzzy Entropy | Non–Nested Generalized Exemplars | Classification Rate: 99% Sensitivity: 99% Specificity: 99% |
| [41] | Flexible Analytic Wavelet Transform/ Log energy entropy (LEE) and Fuzzy distribution entropy | General regression neural network/SVM/LS-SVM/KNN/Fuzzy–KNN | Classification Rate: 98.40% (LS-SVM) |
| [24] | Higher order spectral analysis/ 10% bispectrum and 90% bicoherence | KNN | Classification Rate: 99.55% Sensitivity: 100% Specificity: 99.09% |
| [42] | Continuous Wavelet Transform/ Two–dimensional (2D) convolutional neural networks (CNNs) | AlexNet, InceptionV3, Inception–ResNetV2, ResNet50 and VGG16 | Classification Rate: 92.27% (InceptionV3) |
| This work (Bern Database) | EMD/ Spectral features | KNN NB | Classification Rate: 99.90% (KNN)/99.80% (NB) Sensitivity: 100% Specificity: 100% |
The reported results demonstrate that the proposed method achieved significant improvements in signal discrimination when compared to the results of state-of-the-art methods applied to the same database. The improvements consist of achieving a maximum classification rate of 99.90% and 99.80% with KNN and NB classifiers, respectively, along with a 100% sensitivity and 100% specificity for the Bern database classification.
The results obtained from the Cluj–Napoca database can be compared to those of the Bern database since the methodology used is the same, and classification was performed similarly on two different classes of epilepsy EEG signals, even if the data were recorded differently.
To address the differences in the datasets, it should be noted that the University of Bern database contained a smaller number of subjects and shorter recording times compared to the Cluj–Napoca database [47]. These might have led to lower classification performances compared to the Cluj–Napoca database.
The criteria of signal length, the number of channels, and the number of subjects have a significant impact on the results and conclusions of this study. For example, if the signal length is too short or the number of channels is too low, important information could be missed, leading to incomplete or inaccurate results. Similarly, if the sample size is too small, the study may lack statistical power, and the results may not be generalized to a larger population [47]. In our study, shorter data means the probability of eliminating certain frequency features that could play a defining role in the discrimination of the epilepsy type. While we acknowledge the potential impact of these factors on classification performance, our outcomes provide valuable insights into the feasibility of using this method in real–world scenarios.
Based on these reports, new techniques and combinations of classifiers could be used to enhance the accuracy of identifying areas where seizures occur and to develop automated intelligent systems for identifying the type of epilepsy.
It is important to note that the proposed method is not immune to potential limitations. One such limitation is indirectly generated by the EEG recordings, which could be affected by factors such as the quality of contact between the electrodes and the scalp, subject movement, and external factors.
The accuracy and effectiveness of the EMD algorithm may not always be optimal in practice, and mode mixing can lead to inaccurate feature extraction and classification results. To combat this limitation, in the future, we should use an improvement to the EMD algorithm and other techniques such as ensemble empirical mode decomposition (EEMD) and multivariate empirical mode decomposition (MEMD) [48,49].
5. Conclusions
The obtained results demonstrate the effectiveness and potential utility of the method in order to accurately identify and classify different types of epileptic signals. This offers a valuable tool for neurologists in localizing the epileptic foci, which could lead to more targeted and effective surgical treatment for patients with epilepsy.
Compared to the existing classification methods of focal and non–focal EEG signals for the Bern database, as reported in Table 9, the results show that the developed method achieved higher classification rates, sensitivity, and specificity than state-of-the-art approaches.
The method adeptly discriminates between focal and non–focal data with a maximum classification rate of 99.90% and a sensitivity and specificity of 100% using the KNN classifier. The NB classifier also exhibited notable performances, achieving a maximum classification rate of 99.80% and a sensitivity and specificity of 100%.
Focal and generalized epilepsy data were recorded during both wakefulness and sleep stages and were classified with high accuracy rates. The signals captured during wakefulness were discriminated with a maximum classification rate of 99.80% with KNN and 99.47% with the NB classifier. This method attained high classification rates for 211 out of 216 of the classified cases exceeding 90%.
Focal signals were identified with a maximum sensitivity of 99.89% with KNN and 99.61% with NB. Generalized signals were identified with a maximum specificity of 99.52% with KNN and 99.22% with NB.
The signals collected during sleep were classified as focal and generalized with a maximum classification rate of 98% and 98.40% with KNN and NB, respectively. Furthermore, this method led to a maximum sensitivity of 100% with both classifiers. These signals were identified as generalized, with a maximum specificity of 99.81% with KNN and 99.61% with NB. Out of 48 classified situations, 47 cases achieved classification rates higher than 90%.
The study results indicate that classifying sleep EEG signals is more straightforward than classifying wakefulness EEG signals. The increased variability and dynamism of brain activity during wakefulness can make it harder to accurately measure and classify EEG signals and identify consistent patterns in the EEG power spectral density of IMFs. However, during sleep, the brain is in a relatively stable state, enabling more accurate and reliable measurements of EEG signal power spectral density, thus making it easier to identify and classify EEG signals.
In addition, the effectiveness of the proposed method is supported by the F1-Score, the Matthews Correlation Coefficient, and the Kappa Coefficient metrics. The results demonstrate that the mentioned parameters can achieve maximum values of one for all signals classification situations, including focal and non–focal, as well as focal and generalized signals.
The results obtained from the Cluj–Napoca database were superior to those obtained from the Bern database. This conclusion can be attributed to the difference in data length, as shorter data contain less information. In our case, shorter data means the possibility of eliminating certain frequency features that could play a defining role in the discrimination of signal types.
Future work should address other empirical methods, such as ensemble empirical mode decomposition and multivariate empirical mode decomposition, and additional features to improve epileptic seizure detection classification.
Author Contributions
Conceptualization, M.-G.M. and D.T.; Methodology, M.-G.M. and D.T.; Analysis, M.-G.M., D.T. and F.-R.D.; Data validation: F.-R.D. and D.T.; Writing—original draft, M.-G.M.; Writing—review and editing, M.-G.M. and D.T. All authors have read and agreed to the published version of the manuscript.
Funding
This research received no external funding.
Data Availability Statement
Epileptic EEG data were sourced from an open dataset which can be downloaded at https://www.upf.edu/web/ntsa/downloads/ (accessed on 20 September 2021). The data underlying the results presented in this paper are publicly available at: https://github.com/MadalinaMurariu/Electronics2023 (accessed on 17 March 2023).
Acknowledgments
The authors are grateful to the EEG Epilepsy and Monitoring Center, from Cluj–Napoca, Romania for providing access to build the Cluj–Napoca database used in this study.
Conflicts of Interest
The authors declare no conflict of interest.
References
- Chakraborty, M.; Mitra, D. Epilepsy Seizure Detection Using Kurtosis Based VMD’s Parameters Selection and Bandwidth Features. Biomed. Signal Process. Control 2021, 64, 102255. [Google Scholar] [CrossRef]
- Epilepsy. Available online: https://www.who.int/news-room/fact-sheets/detail/epilepsy (accessed on 24 February 2023).
- Kumar, G.; Chander, S.; Almadhor, A. An Intelligent Epilepsy Seizure Detection System Using Adaptive Mode Decomposition of EEG Signals. Phys. Eng. Sci. Med. 2022, 45, 261–272. [Google Scholar] [CrossRef] [PubMed]
- Gupta, V.; Priya, T.; Yadav, A.K.; Pachori, R.B.; Rajendra Acharya, U. Automated Detection of Focal EEG Signals Using Features Extracted from Flexible Analytic Wavelet Transform. Pattern Recognit. Lett. 2017, 94, 180–188. [Google Scholar] [CrossRef]
- Steriade, C.; Sperling, M.R.; DiVentura, B.; Lozano, M.; Shellhaas, R.A.; Kessler, S.K.; Dlugos, D.; French, J. Proposal for an Updated Seizure Classification Framework in Clinical Trials. Epilepsia 2022, 63, 565–572. [Google Scholar] [CrossRef]
- Hosseini, S.A. Epilepsy Recognition by Higher Order Spectra Analysis of EEG Signals. In Encyclopedia of Information Science and Technology; IGI Global: Hershey, PA, USA, 2015; pp. 5534–5541. ISBN 978-1-4666-5888-2. [Google Scholar]
- Foldvary-Schaefer, N.; Malow, B.; Montagna, P.; Chokroverty, S. Chapter 5—Video Recordings and Video Polysomnography. In Handbook of Clinical Neurology; Sleep Disorders Part I; Elsevier: Amsterdam, The Netherlands, 2011; Volume 98, pp. 65–70. [Google Scholar]
- Hua, X.; Peng, L.; Liu, W.; Cheng, Y.; Wang, H.; Sun, H.; Wang, Z. LDA-MIG Detectors for Maritime Targets in Nonhomogeneous Sea Clutter. IEEE Trans. Geosci. Remote Sens. 2023, 61, 1–15. [Google Scholar] [CrossRef]
- Saha, S.; Hoog, F.; Nesterets, Y.; Rana, R.; Tahtali, M.; Gureyev, T. Sparse Bayesian Learning for EEG Source Localization. arXiv 2015, arXiv:1501.04621. [Google Scholar]
- Panda, S.; Das, A.; Mishra, S.; Mohanty, M.N. Epileptic seizure detection using Deep Ensemble Network with Empirical Wavelet Transform. Meas. Sci. Rev. 2021, 21, 110–116. [Google Scholar] [CrossRef]
- Subasi, A.; Ismail Gursoy, M. EEG Signal Classification Using PCA, ICA, LDA and Support Vector Machines. Expert Syst. Appl. 2010, 37, 8659–8666. [Google Scholar] [CrossRef]
- Pachori, R.B. Discrimination between Ictal and Seizure-Free EEG Signals Using Empirical Mode Decomposition. J. Electr. Comput. Eng. 2008, 293056. [Google Scholar] [CrossRef]
- Lian, J.; Liu, Z.; Wang, H.; Dong, X. Adaptive Variational Mode Decomposition Method for Signal Processing Based on Mode Characteristic. Mech. Syst. Signal Process. 2018, 107, 53–77. [Google Scholar] [CrossRef]
- Bhattacharyya, A.; Sharma, M.; Pachori, R.B.; Sircar, P.; Acharya, U.R. A Novel Approach for Automated Detection of Focal EEG Signals Using Empirical Wavelet Transform. Neural Comput. Appl. 2018, 29, 47–57. [Google Scholar] [CrossRef]
- Escobar-Ipuz, F.A.; Torres, A.M.; García-Jiménez, M.A.; Basar, C.; Cascón, J.; Mateo, J. Prediction of Patients with Idiopathic Generalized Epilepsy from Healthy Controls Using Machine Learning from Scalp EEG Recordings. Brain Res. 2023, 1798, 148131. [Google Scholar] [CrossRef] [PubMed]
- Sharma, R.; Pachori, R.B.; Gautam, S. Empirical Mode Decomposition Based Classification of Focal and Non-Focal EEG Signals. In Proceedings of the 2014 International Conference on Medical Biometrics, Shenzhen, China, 30 May–1 June 2014; pp. 135–140. [Google Scholar]
- Sharma, R.; Pachori, R.B.; Acharya, U.R. Application of Entropy Measures on Intrinsic Mode Functions for the Automated Identification of Focal Electroencephalogram Signals. Entropy 2015, 17, 669–691. [Google Scholar] [CrossRef]
- Sharma, M.; Dhere, A.; Pachori, R.B.; Acharya, U.R. An Automatic Detection of Focal EEG Signals Using New Class of Time–Frequency Localized Orthogonal Wavelet Filter Banks. Knowl-Based Syst. 2017, 118, 217–227. [Google Scholar] [CrossRef]
- Andrzejak, R.G.; Schindler, K.; Rummel, C. Nonrandomness, Nonlinear Dependence, and Nonstationarity of Electroencephalographic Recordings from Epilepsy Patients. Phys. Rev. E Stat. Nonlin. Soft Matter Phys. 2012, 86, 046206. [Google Scholar] [CrossRef] [PubMed]
- Huang, N.E.; Shen, Z.; Long, S.R.; Wu, M.C.; Shih, H.H.; Zheng, Q.; Yen, N.C.; Tung, C.C.; Liu, H.H. The Empirical Mode Decomposition and the Hilbert Spectrum for Nonlinear and Non-Stationary Time Series Analysis. Proc. R. Soc. Lond. Ser. A 1998, 454. [Google Scholar] [CrossRef]
- Guerrero-Mosquera, C.; Malanda Trigueros, A.; Iriarte Franco, J.; Navia-Vázquez, Á. New Feature Extraction Approach for Epileptic EEG Signal Detection Using Time-Frequency Distributions. Med. Biol. Eng. Comput. 2010, 48, 321–330. [Google Scholar] [CrossRef]
- Chen, D.; Wan, S.; Xiang, J.; Bao, F.S. A High-Performance Seizure Detection Algorithm Based on Discrete Wavelet Transform (DWT) and EEG. PLoS ONE 2017, 12, e0173138. [Google Scholar] [CrossRef]
- The Bern-Barcelona EEG Database—Nonlinear Time Series Analysis (UPF). Available online: https://www.upf.edu/web/ntsa/downloads/-/asset_publisher/xvT6E4pczrBw/content/2012-nonrandomness-nonlinear-dependence-and-nonstationarity-of-electroencephalographic-recordings-from-epilepsy-patients (accessed on 24 February 2023).
- Murariu, M.G.; Tărniceriu, D.; Hrișcă-Eva, O.D.; Lazăr, A.M. An Approach to Identify Different Types of EEG Epileptic Signals Based on Higher-Order Spectra (HOS) Features. In Proceedings of the 2022 14th International Conference on Electronics, Computers and Artificial Intelligence (ECAI), Ploiesti, Romania, 30 June–1 July 2022; pp. 1–5. [Google Scholar]
- Zubcevic, S.; Milos, M.; Catibusic, F.; Uzicanin, S.; Krdzalic, B. Interictal Electroencephalography (EEG) Findings in Children with Epilepsy and Bilateral Brain Lesions on Magnetic Resonance Imaging (MRI). Acta Inform. Med. 2015, 23, 343–346. [Google Scholar] [CrossRef]
- Aslan, Z. An Empirical Mode Decomposition Approach for Automated Diagnosis of Migraine. Biomed. Signal Process. Control 2022, 73, 103413. [Google Scholar] [CrossRef]
- Tsipouras, M.G. Spectral Information of EEG Signals with Respect to Epilepsy Classification. EURASIP J. Adv. Signal Process. 2019, 2019, 10. [Google Scholar] [CrossRef]
- Oliva, J.T.; Rosa, J.L.G. Binary and Multiclass Classifiers Based on Multitaper Spectral Features for Epilepsy Detection. Biomed. Signal Process. Control 2021, 66, 102469. [Google Scholar] [CrossRef]
- Tzallas, A.T.; Tsipouras, M.G.; Fotiadis, D.I. Epileptic Seizure Detection in EEGs Using Time–Frequency Analysis. IEEE Trans. Inf. Technol. Biomed. 2009, 13, 703–710. [Google Scholar] [CrossRef]
- Books-Library.Net-02182115Nk1L2.Pdf. Available online: https://books-library.website/files/books-library.net-02182115Nk1L2.pdf (accessed on 4 April 2023).
- Alkan, A.; Yilmaz, A.S. Frequency Domain Analysis of Power System Transients Using Welch and Yule–Walker AR Methods. Energy Convers. Manag. 2007, 48, 2129–2135. [Google Scholar] [CrossRef]
- Mădălina-Giorgiana, M.; Daniela, T. Discrimination of Focal and Non-Focal Epileptic EEG Signals Using Different Types of Classifiers. Bul. Inst. Politeh. Din Iaşi 2022, 68. [Google Scholar]
- Wang, Z.; Na, J.; Zheng, B. An Improved KNN Classifier for Epilepsy Diagnosis. IEEE Access 2020, 8, 100022–100030. [Google Scholar] [CrossRef]
- Pavithra, O.; Padmapriya, G.; Karthikeyan, R. Prediction of Early Stage of Fatty Liver Disease in Patients Using Logistic Regression and Naive Bayes Algorithm. In Proceedings of the 2022 International Conference on Cyber Resilience (ICCR), Dubai, United Arab Emirates, 6–7 October 2022; pp. 01–05. [Google Scholar]
- Delgado, R.; Tibau, X.A. Why Cohen’s Kappa Should Be Avoided as Performance Measure in Classification. PLoS ONE 2019, 14, e0222916. [Google Scholar] [CrossRef]
- DeVries, Z.; Locke, E.; Hoda, M.; Moravek, D.; Phan, K.; Stratton, A.; Kingwell, S.; Wai, E.K.; Phan, P. Using a National Surgical Database to Predict Complications Following Posterior Lumbar Surgery and Comparing the Area under the Curve and F1-Score for the Assessment of Prognostic Capability. Spine J. 2021, 21, 1135–1142. [Google Scholar] [CrossRef] [PubMed]
- Chicco, D.; Jurman, G. The Advantages of the Matthews Correlation Coefficient (MCC) over F1 Score and Accuracy in Binary Classification Evaluation. BMC Genom. 2020, 21, 6. [Google Scholar] [CrossRef]
- Li, S.; Zhou, W.; Yuan, Q.; Geng, S.; Cai, D. Feature Extraction and Recognition of Ictal EEG Using EMD and SVM. Comput. Biol. Med. 2013, 43, 807–816. [Google Scholar] [CrossRef] [PubMed]
- Gaur, P.; Pachori, R.B.; Wang, H.; Prasad, G. An Empirical Mode Decomposition Based Filtering Method for Classification of Motor-Imagery EEG Signals for Enhancing Brain-Computer Interface. In Proceedings of the 2015 International Joint Conference on Neural Networks (IJCNN), Killarney, Ireland, 12–15 July 2015; pp. 1–7. [Google Scholar]
- Statistics and Machine Learning Toolbox. Available online: https://www.mathworks.com/products/statistics.html (accessed on 6 April 2023).
- You, Y.; Chen, W.; Li, M.; Zhang, T.; Jiang, Y.; Zheng, X. Automatic Focal and Non-Focal EEG Detection Using Entropy-Based Features from Flexible Analytic Wavelet Transform. Biomed. Signal Process. Control 2020, 57, 101761. [Google Scholar] [CrossRef]
- Narin, A. Detection of Focal and Non-Focal Epileptic Seizure Using Continuous Wavelet Transform-Based Scalogram Images and Pre-Trained Deep Neural Networks. IRBM 2022, 43, 22–31. [Google Scholar] [CrossRef]
- Sone, D.; Beheshti, I. Clinical Application of Machine Learning Models for Brain Imaging in Epilepsy: A Review. Front. Neurosci. 2021, 15, 684825. [Google Scholar] [CrossRef] [PubMed]
- Rai, K.; Bajaj, V.; Kumar, A. Features Extraction for Classification of Focal and Non-Focal EEG Signals. In Proceedings of the Information Science and Applications; Kim, K.J., Ed.; Springer: Berlin/Heidelberg, Germany, 2015; pp. 599–605. [Google Scholar]
- Das, A.B.; Bhuiyan, M.I.H. Discrimination and Classification of Focal and Non-Focal EEG Signals Using Entropy-Based Features in the EMD-DWT Domain. Biomed. Signal Process. Control 2016, 29, 11–21. [Google Scholar] [CrossRef]
- Arunkumar, N.; Ram Kumar, K.; Venkataraman, V. Entropy Features for Focal EEG and Non Focal EEG. J. Comput. Sci. 2018, 27, 440–444. [Google Scholar] [CrossRef]
- de Cheveigné, A.; Nelken, I. Filters: When, Why, and How (Not) to Use Them. Neuron 2019, 102, 280–293. [Google Scholar] [CrossRef]
- Gupta, A.; Kumar, D.; Verma, H.; Tanveer, M.; Javier, A.P.; Lin, C.T.; Prasad, M. Recognition of multi-cognitive tasks from EEG signals using EMD methods. Neural Comput. Appl. 2022. [Google Scholar] [CrossRef]
- Zahra, A.; Kanwal, N.; ur Rehman, N.; Ehsan, S.; McDonald-Maier, K.D. Seizure Detection from EEG Signals Using Multivariate Empirical Mode Decomposition. Comput. Biol. Med. 2017, 88, 132–141. [Google Scholar] [CrossRef]
Disclaimer/Publisher’s Note: The statements, opinions and data contained in all publications are solely those of the individual author(s) and contributor(s) and not of MDPI and/or the editor(s). MDPI and/or the editor(s) disclaim responsibility for any injury to people or property resulting from any ideas, methods, instructions or products referred to in the content. |
© 2023 by the authors. Licensee MDPI, Basel, Switzerland. This article is an open access article distributed under the terms and conditions of the Creative Commons Attribution (CC BY) license (https://creativecommons.org/licenses/by/4.0/).