
Optimal Placement and Sizing of D-STATCOMs in Electrical Distribution Networks Using a Stochastic Mixed-Integer Convex Model


Abstract
1. Introduction
- i.
- The description of a stochastic mixed-integer convex (SMIC) model for the optimal placement and sizing of D-STATCOMs in electrical distribution networks. The proposed SMIC model considers nine scenarios involving low-, medium-, and high-load-generation levels.
- ii.
- The addition of binary-polynomial constraints to the proposed SMIC model in order to model the power transfer losses of D-STATCOMs. These constraints are convexified using second-order cone relaxation.
- iii.
- The objective function of the proposed SMIC model is composed of two terms: minimizing the annual energy loss costs and the annualized investment costs related to installing a new D-STATCOM, which implies a multi-objective problem. A weight factor is used to solve the problem, as these terms are in conflict.
- iv.
- Three simulation cases are proposed to demonstrate the effectiveness of the stochastic convex model, and it is compared to three solvers available in the General Algebraic Modeling System (GAMS) software.
2. Mathematical Model
2.1. Objective Function
2.2. Set of Constraints
2.2.1. Grid-Connected D-STATCOMs
2.2.2. Power Balance Equation
2.2.3. Power Flow Equation
2.2.4. Operating Regulation
2.3. Interpretation of the Mathematical Model
3. Convex Reformulation
3.1. Approximation to a Linear Function for D-STATCOM Costs
3.2. Conic Representation of the Power Flow Equations
3.3. Conic Representation of VSC Power Losses
3.4. Proposed Mixed-Integer Convex Model
3.5. Stochastic Mixed-Integer Convex Model
4. Test System
4.1. Modified IEEE 33-Bus Test System
4.2. Modified IEEE 69-Bus Test System
4.3. Modified IEEE 85-Bus Test System
4.4. Load-Generation Scenario
5. Numerical Implementation
- C1:
- The proposed model was compared with GAMS, only considering the installation of three D-STATCOMs.
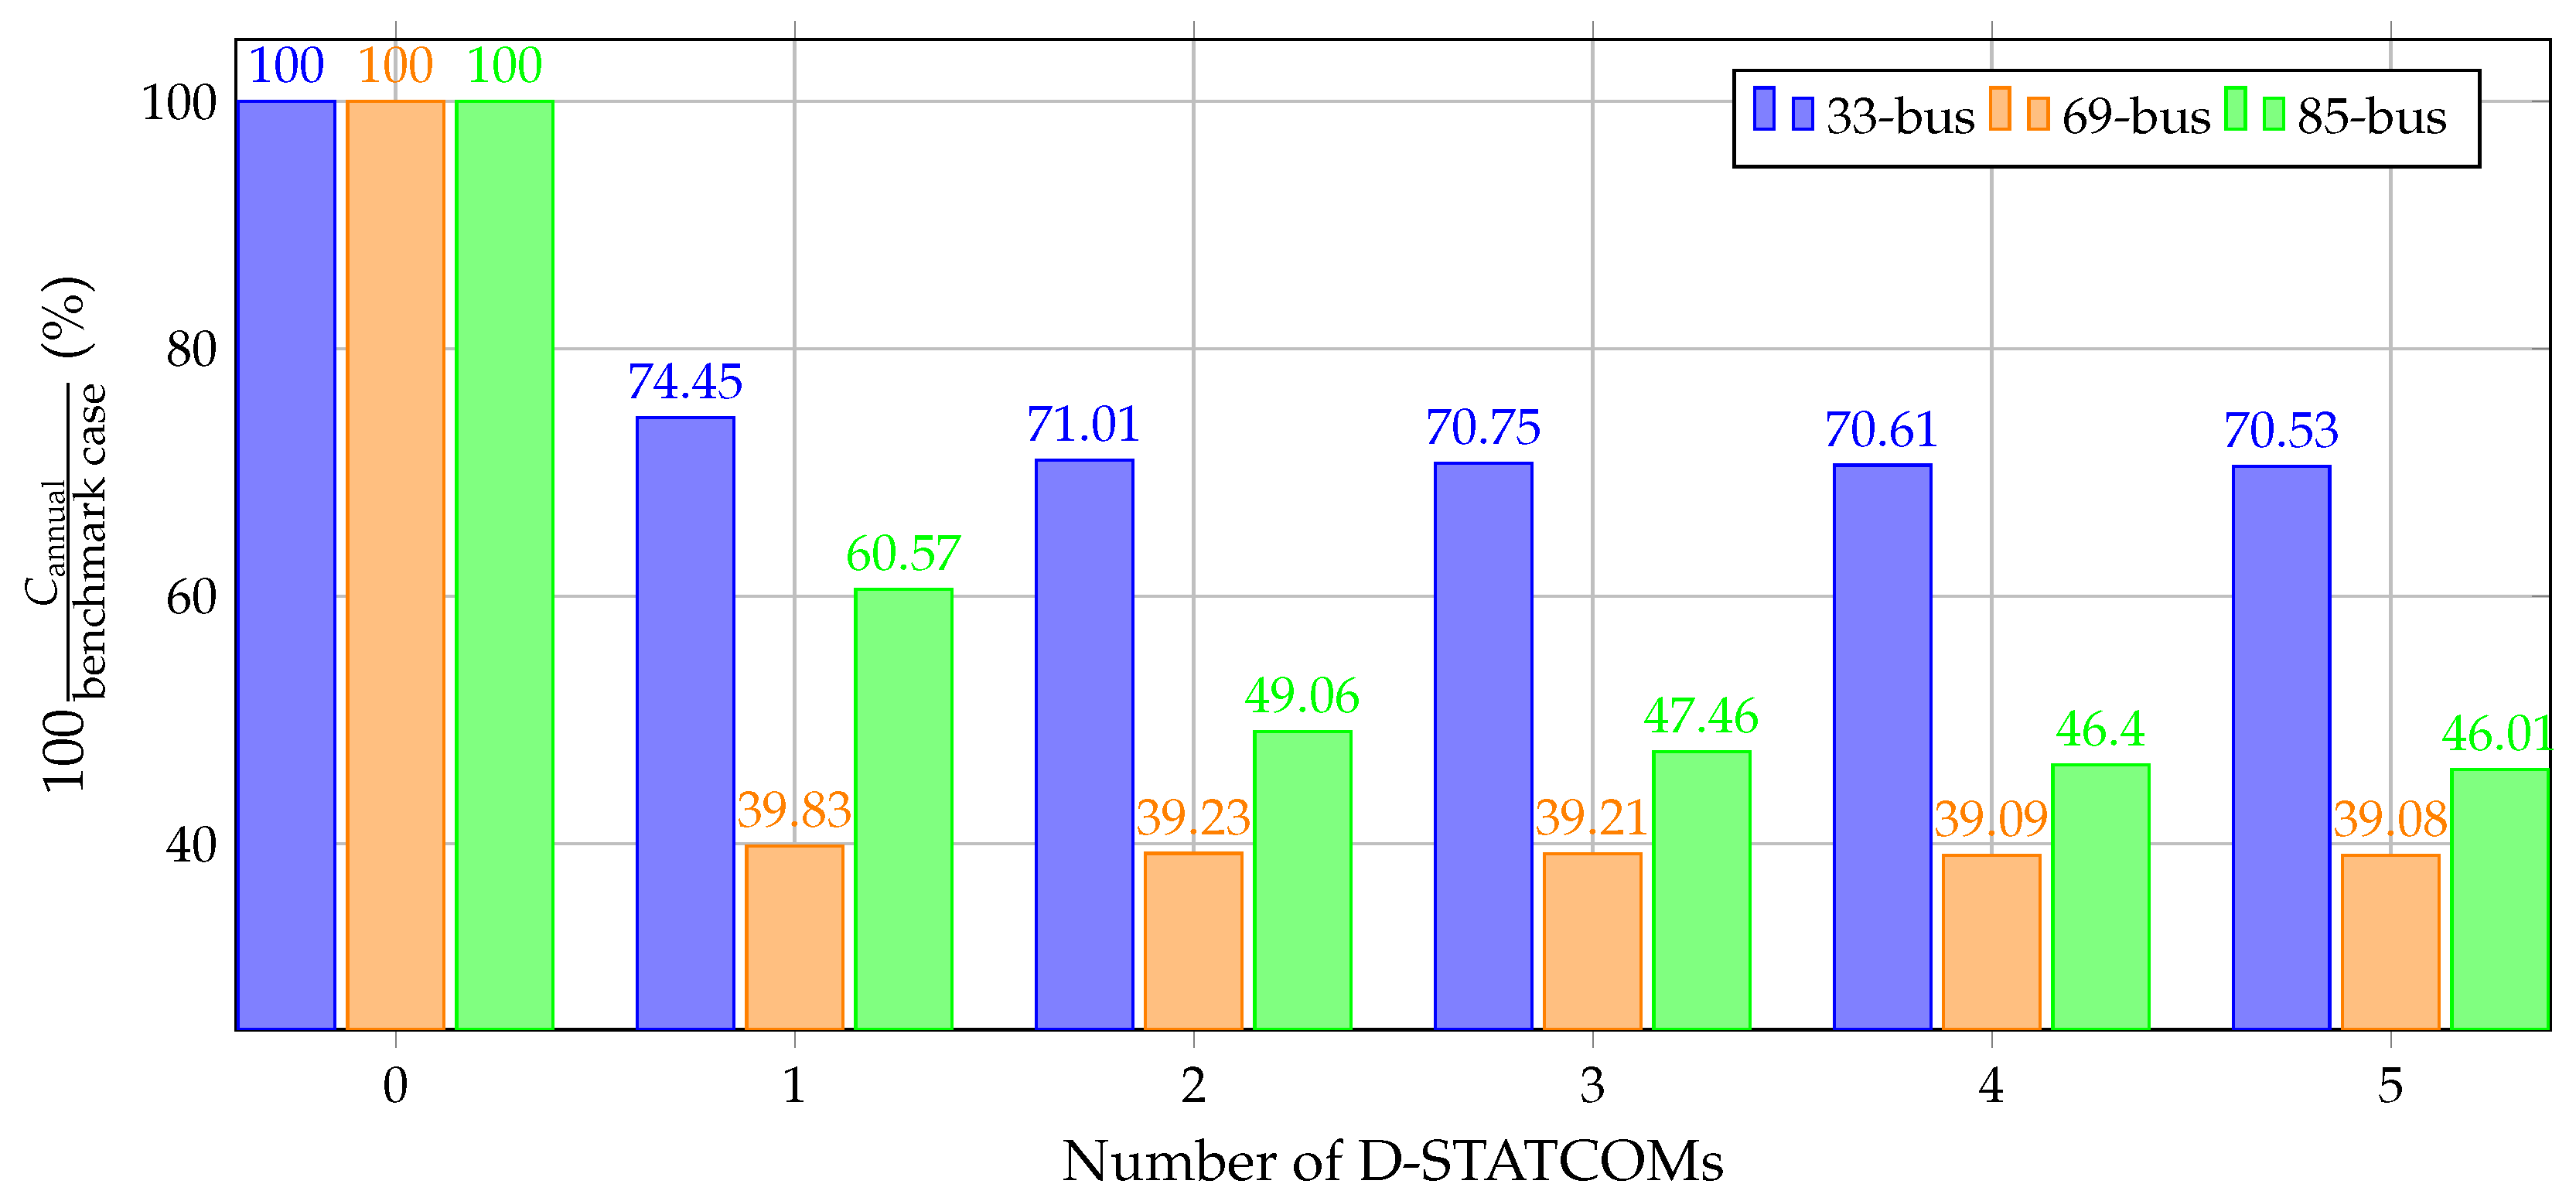
- C2:
- The impact on the total annual operating costs of the number of D-STATCOMs available for installation was assessed by varying the number of devices from 0 to 5.
- C3:
- The Pareto front was formed by analyzing the trade-off between the costs of the D-STATCOMs and the annual energy loss costs, which are conflicting objectives.
5.1. Analysis of Case 1 (C1)
- The proposed SMIC model for the three test systems finds the best solutions (global optima) with objective function values of USD 46,212.30, USD 44,082.85, and USD 48,581.90. These solutions were obtained from the exact costs function (1). Comparing the benchmark cases to the best solutions revealed significant reductions of 29.25%, 60.89%, and 52.54% for the modified IEEE 33-, 69-, and 85-bus test systems, respectively.
- For the modified IEEE 33-bus test system, it can be noted that the BONMIN solver reached the same solution as the proposed SMIC model. In contrast, the CONOPT and GUROBI solvers achieved the worst solutions (local optima), reducing the annual operating costs by 25.81% and 29.21%, respectively.
- As for the modified IEEE 69-bus test system, the BONMIN solver did not yield any feasible solution due to convergence issues. On the other hand, the GUROBI solver found the same solution as the proposed SMIC model, and the CONOPT solver reached a local optimum, reducing the annual operating cost by 59.79%.
- For the modified IEEE 85-bus test system, it is evident that none of the solvers could attain the global optimum of the problem, and only local optima were found. In this case, the CONOPT solver reported a better solution than other solvers, which indicates that none of the solvers outperformed the other.
5.2. Analysis of Case 2 (C2)
5.3. Analysis of Case 3 (C3)
- There is a trade-off between the annual costs of energy losses and those associated with investment costs in D-STATCOMs, as improving one objective leads to the deterioration of the other and vice versa. Specifically, the two extreme solutions are characterized by: (i) annual energy losses costs of USD , USD , and USD per year for the modified IEEE 33-, 69-, and 85-bus test systems, respectively, with zero investments (i.e., ); and (ii) increased investments of USD , USD , and USD per year of operation (i.e., ), which results in the lowest cost of energy losses for the three test systems.
- The optimal solution for each test system in Table 4 is achieved via the proposed SMIC model, which corresponds to the minimum cost reported in the multi-objective case (i.e., when ). This indicates that the scaling factor of the objective function for the single-objective case does not significantly affect the final result of the convex model. However, the main advantage of having a Pareto front is that it offers a range of possibilities in order for a utility company to choose the most suitable option based on its investment capabilities.
6. Conclusions and Future Works
Funding
Institutional Review Board Statement
Informed Consent Statement
Data Availability Statement
Conflicts of Interest
References
- Jardini, J.; Tahan, C.; Gouvea, M.; Ahn, S.; Figueiredo, F. Daily load profiles for residential, commercial and industrial low voltage consumers. IEEE Trans. Power Deliv. 2000, 15, 375–380. [Google Scholar] [CrossRef]
- Rahimzadeh, S.; Bina, M.T. Looking for optimal number and placement of FACTS devices to manage the transmission congestion. Energy Convers. Manag. 2011, 52, 437–446. [Google Scholar] [CrossRef]
- Tuzikova, V.; Tlusty, J.; Muller, Z. A novel power losses reduction method based on a particle swarm optimization algorithm using STATCOM. Energies 2018, 11, 2851. [Google Scholar] [CrossRef]
- Abba, S.; Najashi, B.G.; Rotimi, A.; Musa, B.; Yimen, N.; Kawu, S.; Lawan, S.; Dagbasi, M. Emerging Harris Hawks Optimization based load demand forecasting and optimal sizing of stand-alone hybrid renewable energy systems– A case study of Kano and Abuja, Nigeria. Results Eng. 2021, 12, 100260. [Google Scholar] [CrossRef]
- Yunus, A.S.; Abu-Siada, A.; Mosaad, M.I.; Albalawi, H.; Aljohani, M.; Jin, J.X. Application of SMES Technology in Improving the Performance of a DFIG-WECS Connected to a Weak Grid. IEEE Access 2021, 9, 124541–124548. [Google Scholar] [CrossRef]
- Mosaad, M.I.; Sabiha, N.A.; Abu-Siada, A.; Taha, I.B. Application of Superconductors to Suppress Ferroresonance Overvoltage in DFIG-WECS. IEEE Trans. Energy Convers. 2021, 37, 766–777. [Google Scholar] [CrossRef]
- Yuvaraj, T.; Ravi, K.; Devabalaji, K. DSTATCOM allocation in distribution networks considering load variations using bat algorithm. Ain Shams Eng. J. 2017, 8, 391–403. [Google Scholar] [CrossRef]
- Gupta, A.R.; Kumar, A. Optimal placement of D-STATCOM using sensitivity approaches in mesh distribution system with time variant load models under load growth. Ain Shams Eng. J. 2018, 9, 783–799. [Google Scholar] [CrossRef]
- Téllez, A.Á.; López, G.; Isaac, I.; González, J. Optimal reactive power compensation in electrical distribution systems with distributed resources. Review. Heliyon 2018, 4, e00746. [Google Scholar] [CrossRef]
- Tolabi, H.B.; Ali, M.H.; Rizwan, M. Simultaneous reconfiguration, optimal placement of DSTATCOM, and photovoltaic array in a distribution system based on fuzzy-ACO approach. IEEE Trans. Sustain. Energy 2014, 6, 210–218. [Google Scholar] [CrossRef]
- Gupta, A.R.; Kumar, A. Energy savings using D-STATCOM placement in radial distribution system. Procedia Comput. Sci. 2015, 70, 558–564. [Google Scholar] [CrossRef]
- Sirjani, R.; Jordehi, A.R. Optimal placement and sizing of distribution static compensator (D-STATCOM) in electric distribution networks: A review. Renew. Sustain. Energy Rev. 2017, 77, 688–694. [Google Scholar] [CrossRef]
- Rezaeian Marjani, S.; Talavat, V.; Galvani, S. Optimal allocation of D-STATCOM and reconfiguration in radial distribution network using MOPSO algorithm in TOPSIS framework. Int. Trans. Electr. Energy Syst. 2019, 29, e2723. [Google Scholar] [CrossRef]
- Montoya, O.D.; Gil-González, W.; Hernández, J.C. Efficient operative cost reduction in distribution grids considering the optimal placement and sizing of D-STATCOMs using a discrete-continuous VSA. Appl. Sci. 2021, 11, 2175. [Google Scholar] [CrossRef]
- Montoya, O.D.; Chamorro, H.R.; Alvarado-Barrios, L.; Gil-González, W.; Orozco-Henao, C. Genetic-Convex Model for Dynamic Reactive Power Compensation in Distribution Networks Using D-STATCOMs. Appl. Sci. 2021, 11, 3353. [Google Scholar] [CrossRef]
- Samimi, A.; Golkar, M.A. A novel method for optimal placement of STATCOM in distribution networks using sensitivity analysis by DIgSILENT software. In Proceedings of the 2011 Asia-Pacific Power and Energy Engineering Conference, Washington, DC, USA, 25–28 March 2011; IEEE: Piscataway, NJ, USA, 2011. [Google Scholar]
- Tanti, D.; Verma, M.; Singh, D.B.; Mehrotra, O. Optimal Placement of Custom Power Devices in Power System Network to Mitigate Voltage Sag under Faults. Int. J. Power Electron. Drive Syst. 2012, 2, 267–276. [Google Scholar] [CrossRef]
- Taher, S.A.; Afsari, S.A. Optimal location and sizing of DSTATCOM in distribution systems by immune algorithm. Int. J. Electr. Power Energy Syst. 2014, 60, 34–44. [Google Scholar] [CrossRef]
- Devi, S.; Geethanjali, M. Optimal location and sizing of Distribution Static Synchronous Series Compensator using Particle Swarm Optimization. Int. J. Electr. Power Energy Syst. 2014, 62, 646–653. [Google Scholar] [CrossRef]
- Gupta, A.R.; Kumar, A. Optimal placement of D-STATCOM in distribution network using new sensitivity index with probabilistic load models. In Proceedings of the 2015 2nd International Conference on Recent Advances in Engineering & Computational Sciences (RAECS), Chandigarh, India, 21–22 December 2015; pp. 1–6. [Google Scholar] [CrossRef]
- Yuvaraj, T.; Devabalaji, K.; Ravi, K. Optimal Placement and Sizing of DSTATCOM Using Harmony Search Algorithm. Energy Procedia 2015, 79, 759–765. [Google Scholar] [CrossRef]
- Muthukumar, K.; Jayalalitha, S. Optimal placement and sizing of distributed generators and shunt capacitors for power loss minimization in radial distribution networks using hybrid heuristic search optimization technique. Int. J. Electr. Power Energy Syst. 2016, 78, 299–319. [Google Scholar] [CrossRef]
- Sedighizadeh, M.; Eisapour-Moarref, A. The imperialist competitive algorithm for optimal multi-objective location and sizing of DSTATCOM in distribution systems considering loads uncertainty. INAE Lett. 2017, 2, 83–95. [Google Scholar] [CrossRef]
- Sannigrahi, S.; Acharjee, P. Implementation of crow search algorithm for optimal allocation of DG and DSTATCOM in practical distribution system. In Proceedings of the 2018 International Conference on Power, Instrumentation, Control and Computing (PICC), Thrissur, India, 18–20 January 2018; pp. 1–6. [Google Scholar] [CrossRef]
- Amin, A.; Kamel, S.; Selim, A.; Nasrat, L. Optimal Placement of Distribution Static Compensators in Radial Distribution Systems Using Hybrid Analytical-Coyote optimization Technique. In Proceedings of the 2019 21st International Middle East Power Systems Conference (MEPCON), Cairo, Egypt, 17–19 December 2019; pp. 982–987. [Google Scholar] [CrossRef]
- Dash, S.K.; Mishra, S. Simultaneous Optimal Placement and Sizing of D-STATCOMs Using a Modified Sine Cosine Algorithm. In Proceedings of the Advances in Intelligent Computing and Communication: Proceedings of ICAC 2020; Springer: Berlin/Heidelberg, Germany, 2021; pp. 423–436. [Google Scholar]
- Montoya, O.D.; Fuentes, J.E.; Moya, F.D.; Barrios, J.Á.; Chamorro, H.R. Reduction of annual operational costs in power systems through the optimal siting and sizing of STATCOMs. Appl. Sci. 2021, 11, 4634. [Google Scholar] [CrossRef]
- Gil-González, W.; Montoya, O.D.; Grisales-Noreña, L.F.; Trujillo, C.L.; Giral-Ramírez, D.A. A mixed-integer second-order cone model for optimal siting and sizing of dynamic reactive power compensators in distribution grids. Results Eng. 2022, 15, 100475. [Google Scholar] [CrossRef]
- Montoya, O.D.; Garces, A.; Gil-González, W. Minimization of the distribution operating costs with D-STATCOMS: A mixed-integer conic model. Electr. Power Syst. Res. 2022, 212, 108346. [Google Scholar] [CrossRef]
- Garces, A. Convex Optimization: Applications in Operation and Dynamics of Power Systems (in Spanish), 1st ed.; Universidad Tecnológica de Pereira: Pereira, Colombia, 2020. [Google Scholar]
- Saravanan, M.; Slochanal, S.M.R.; Venkatesh, P.; Abraham, P.S. Application of PSO technique for optimal location of FACTS devices considering system loadability and cost of installation. In Proceedings of the 2005 International Power Engineering Conference, Singapore, 29 November–2 December 2005; IEEE: Picataway, NJ, USA, 2005; pp. 716–721. [Google Scholar]
- Saravanan, M.; Slochanal, S.M.R.; Venkatesh, P.; Abraham, J.P.S. Application of particle swarm optimization technique for optimal location of FACTS devices considering cost of installation and system loadability. Electr. Power Syst. Res. 2007, 77, 276–283. [Google Scholar] [CrossRef]
- Cai, L.J.; Erlich, I.; Stamtsis, G. Optimal choice and allocation of FACTS devices in deregulated electricity market using genetic algorithms. In Proceedings of the IEEE PES Power Systems Conference and Exposition, Kunming, China, 13–17 October 2004; IEEE: Piscatway, NJ, USA, 2004; pp. 201–207. [Google Scholar]
- Sarantakos, I.; Peker, M.; Zografou-Barredo, N.M.; Deakin, M.; Patsios, C.; Sayfutdinov, T.; Taylor, P.C.; Greenwood, D. A robust mixed-integer convex model for optimal scheduling of integrated energy storage—soft open point devices. IEEE Trans. Smart Grid 2022, 13, 4072–4087. [Google Scholar] [CrossRef]
- Patsios, C.; Wu, B.; Chatzinikolaou, E.; Rogers, D.J.; Wade, N.; Brandon, N.P.; Taylor, P. An integrated approach for the analysis and control of grid connected energy storage systems. J. Energy Storage 2016, 5, 48–61. [Google Scholar] [CrossRef]
- BS EN 62751-1:2014+A1:2018; Power Losses in Voltage Sourced Converter (VSC) Calves for High-Voltage Direct Current (HVDC) Systems. Technical Report; British Standards Institution: Loughborough, UK, 2018.
- Bierhoff, M.H.; Fuchs, F.W. Semiconductor losses in voltage source and current source IGBT converters based on analytical derivation. In Proceedings of the 2004 IEEE 35th Annual Power Electronics Specialists Conference (IEEE Cat. No. 04CH37551), Aachen, Germany, 20–25 June 2004; IEEE: Piscataway, NJ, USA, 2004; Volume 4, pp. 2836–2842. [Google Scholar]
- Zohrizadeh, F.; Josz, C.; Jin, M.; Madani, R.; Lavaei, J.; Sojoudi, S. A survey on conic relaxations of optimal power flow problem. Eur. J. Oper. Res. 2020, 287, 391–409. [Google Scholar] [CrossRef]
- Lavaei, J.; Tse, D.; Zhang, B. Geometry of Power Flows and Optimization in Distribution Networks. IEEE Trans. Power Syst. 2014, 29, 572–583. [Google Scholar] [CrossRef]
- Verweij, B.; Ahmed, S.; Kleywegt, A.J.; Nemhauser, G.; Shapiro, A. The sample average approximation method applied to stochastic routing problems: A computational study. Comput. Optim. Appl. 2003, 24, 289–333. [Google Scholar] [CrossRef]
- Gil-González, W.; Garces, A.; Montoya, O.D.; Hernández, J.C. A mixed-integer convex model for the optimal placement and sizing of distributed generators in power distribution networks. Appl. Sci. 2021, 11, 627. [Google Scholar] [CrossRef]
- Montoya, O.D.; Gil-González, W.; Grisales-Noreña, L. An exact MINLP model for optimal location and sizing of DGs in distribution networks: A general algebraic modeling system approach. Ain Shams Eng. J. 2020, 11, 409–418. [Google Scholar] [CrossRef]
- Montoya, O.D.; Grisales-Noreña, L.F.; Alvarado-Barrios, L.; Arias-Londoño, A.; Álvarez-Arroyo, C. Efficient reduction in the annual investment costs in AC distribution networks via optimal integration of solar PV sources using the newton metaheuristic algorithm. Appl. Sci. 2021, 11, 11525. [Google Scholar] [CrossRef]
- Grant, M.; Boyd, S. Graph implementations for nonsmooth convex programs. In Recent Advances in Learning and Control; Blondel, V., Boyd, S., Kimura, H., Eds.; Lecture Notes in Control and Information Sciences; Springer: Berlin/Heidelberg, Germany, 2008; pp. 95–110. [Google Scholar] [CrossRef]
- Gurobi Optimization, LLC. Gurobi Optimizer Reference Manual; Gurobi Optimization, LLC.: Beaverton, OR, USA, 2022. [Google Scholar]


| Methodology | Objective Function | Year | Ref. |
|---|---|---|---|
| Genetic algorithm | Minimization of power losses | 2011 | [16] |
| Artificial neural networks | Mitigation of voltage sags under faults | 2012 | [17] |
| Immune algorithm | Minimization of power losses and reduction of investment and operating costs | 2014 | [18] |
| Particle swarm optimization | Minimization of power losses and voltage profile improvement | 2014 | [19] |
| Ant colony optimization | Minimization of power losses and voltage profile improvement | 2015 | [10] |
| Sensitivity indices | Minimization of power losses and voltage profile improvement | 2015 | [20] |
| Harmony search algorithm | Minimization of power losses | 2015 | [21] |
| Heuristic search algorithm | Minimization of power losses | 2016 | [22] |
| Imperialist competitive algorithm | Minimization of energy costs and voltage profile improvement | 2017 | [23] |
| Discrete-continuous vortex search algorithm | Investment and operating costs reduction | 2017 | [15] |
| Modified crow search algorithm | Reducing line losses, maximizing economic benefits, improving voltage profiles, and reducing pollution levels | 2018 | [24] |
| Hybrid analytical-coyote | Minimization of active power losses and voltage profile improvement | 2019 | [25] |
| Modified sine-cosine algorithm | Minimization of power losses and voltage profile improvement | 2020 | [26] |
| GAMS software for the solution of the exact MINLP model | Reduction in investment and operating costs | 2021 | [27] |
| Scenario | Load-Generation | Probability () |
|---|---|---|
| 1 | Low/low | 0.2210 |
| 2 | Low/medium | 0.0443 |
| 3 | Low/high | 0.0676 |
| 4 | Medium/low | 0.2767 |
| 5 | Medium/medium | 0.0554 |
| 6 | Medium/high | 0.0845 |
| 7 | High/low | 0.0845 |
| 8 | High/medium | 0.0332 |
| 9 | High/high | 0.0507 |
| Par. | Value | Unit | Par. | Value | Unit |
|---|---|---|---|---|---|
| 0.1390 | USD/kWh | T | 365 | Days | |
| 0.50 | h | 0.30 | USD/MVAr | ||
| −305.10 | USD/MVAr | 127,380 | USD/MVAr | ||
| 6/2190 | 1/Days | 10 | Years |
| Method | Location (Bus) | Size (k) | (USD/year) | (USD/year) | (USD/year) |
|---|---|---|---|---|---|
| IEEE 33-bus test system | |||||
| Ben. case | 65,324.25 | 65,324.25 | 0.00 | ||
| CONOPT | 48,464.31 | 39,803.98 | 8660.33 | ||
| BONMIN | 46,212.30 | 36,115.04 | 10,097.26 | ||
| GUROBI | 46,243.04 | 36,105.07 | 10,137.98 | ||
| SMIC | 46,212.30 | 36,115.04 | 10,097.26 | ||
| IEEE 69-bus test system | |||||
| Ben. case | 112,740.90 | 112,740.90 | 0.00 | ||
| CONOPT | 45,329.51 | 39,803.98 | 9223.70 | ||
| GUROBI | 44,082.85 | 33,810.49 | 10,272.36 | ||
| SMIC | 44,082.85 | 33,810.49 | 10,272.36 | ||
| IEEE 89-bus test system | |||||
| Ben. case | 102,369.39 | 102,369.39 | 0.00 | ||
| CONOPT | 49,062.63 | 33,795.46 | 15,267.17 | ||
| BONMIN | 51,045.58 | 36,882.55 | 14,163.03 | ||
| GUROBI | 66,816.56 | 56,144.56 | 10,672.00 | ||
| SMIC | 48,581.90 | 32,853.47 | 15,728.43 | ||
| Factor () | (USD/year) | (USD/year) | (USD/year) |
|---|---|---|---|
| IEEE 33-bus test system | |||
| 0.0 | 65,324.25 | 65,324.25 | 0 |
| 0.1 | 65,324.25 | 65,324.25 | 0 |
| 0.2 | 47,707.61 | 37,002.80 | 9005.45 |
| 0.3 | 46,341.15 | 36,390.38 | 9950.77 |
| 0.4 | 46,276.73 | 36,252.71 | 10,024.01 |
| 0.5 | 46,212.31 | 36,115.05 | 10,097.26 |
| 0.6 | 46,379.65 | 36,172.90 | 10,206.75 |
| 0.7 | 46,395.17 | 36,172.01 | 10,223.16 |
| 0.8 | 46,410.70 | 36,171.13 | 10,239.57 |
| 0.9 | 46,412.49 | 36,272.77 | 10,339.72 |
| 1.0 | 104,613.34 | 32,121.99 | 72,491.35 |
| IEEE 69-bus test system | |||
| 0.0 | 112,740.90 | 112,740.90 | 0 |
| 0.1 | 112,740.90 | 112,740.90 | 0 |
| 0.2 | 44,757.04 | 35,202.5 | 9554.54 |
| 0.3 | 44,754.02 | 34,336.33 | 10,417.69 |
| 0.4 | 46,332.37 | 33,331.98 | 13,000.39 |
| 0.5 | 44,082.85 | 33,810.49 | 10,272.36 |
| 0.6 | 44,101.20 | 33,577.67 | 10,523.53 |
| 0.7 | 44,119.56 | 33,344.86 | 10,774.70 |
| 0.8 | 44,230.72 | 33,501.36 | 10,729.36 |
| 0.9 | 48,705.06 | 30,205.07 | 18,499.99 |
| 1.0 | 50,821.03 | 30,109.31 | 20,711.72 |
| IEEE 85-bus test system | |||
| 0.0 | 102,369.39 | 102,369.39 | 0 |
| 0.1 | 102,369.39 | 102,369.39 | 0 |
| 0.2 | 90,641.97 | 88,022.15 | 2619.82 |
| 0.3 | 56,682.66 | 47,597.36 | 9085.30 |
| 0.4 | 51,604.91 | 39,705.79 | 11,899.12 |
| 0.5 | 48,581.90 | 32,853.47 | 15,728.43 |
| 0.6 | 49,777.82 | 32,370.34 | 17,407.48 |
| 0.7 | 49,701.84 | 28,554.90 | 21,146.94 |
| 0.8 | 52,111.75 | 28,893.70 | 23,218.05 |
| 0.9 | 52,287.42 | 28,302.63 | 23,984.79 |
| 1.0 | 66,766.11 | 27,425.10 | 39,341.01 |
Disclaimer/Publisher’s Note: The statements, opinions and data contained in all publications are solely those of the individual author(s) and contributor(s) and not of MDPI and/or the editor(s). MDPI and/or the editor(s) disclaim responsibility for any injury to people or property resulting from any ideas, methods, instructions or products referred to in the content. |
© 2023 by the author. Licensee MDPI, Basel, Switzerland. This article is an open access article distributed under the terms and conditions of the Creative Commons Attribution (CC BY) license (https://creativecommons.org/licenses/by/4.0/).
Share and Cite
Gil-González, W. Optimal Placement and Sizing of D-STATCOMs in Electrical Distribution Networks Using a Stochastic Mixed-Integer Convex Model. Electronics 2023, 12, 1565. https://doi.org/10.3390/electronics12071565
Gil-González W. Optimal Placement and Sizing of D-STATCOMs in Electrical Distribution Networks Using a Stochastic Mixed-Integer Convex Model. Electronics. 2023; 12(7):1565. https://doi.org/10.3390/electronics12071565
Chicago/Turabian StyleGil-González, Walter. 2023. "Optimal Placement and Sizing of D-STATCOMs in Electrical Distribution Networks Using a Stochastic Mixed-Integer Convex Model" Electronics 12, no. 7: 1565. https://doi.org/10.3390/electronics12071565
APA StyleGil-González, W. (2023). Optimal Placement and Sizing of D-STATCOMs in Electrical Distribution Networks Using a Stochastic Mixed-Integer Convex Model. Electronics, 12(7), 1565. https://doi.org/10.3390/electronics12071565