Article

Analysis of a Personalized Provision of Service Level Agreement (SLA) Algorithm

1
School of Computing, Ulster University, Belfast BT15 1AP, UK
2
Applied Research, BT Group PLC, Martlesham IP5 3RE, UK
*
Author to whom correspondence should be addressed.
Electronics 2023, 12(5), 1231; https://doi.org/10.3390/electronics12051231
Submission received: 31 January 2023 / Revised: 25 February 2023 / Accepted: 28 February 2023 / Published: 4 March 2023
(This article belongs to the Section Artificial Intelligence)

Abstract

:
The existence of restricted Service Level Agreement (SLA) choices, which typically correspond with a couple of service tiers, can result in a customer accepting a service that may not effectively respond to their needs. From a service provider perspective, it is also a less than optimum business model, with capacity being reserved for customers who will not use it and subsequently being unavailable for customers who would. We, therefore, advocate the use of personalized SLAs to avoid such situations, which can ideally be set up without the assistance of a human operator. We suggest classifying customers according to their distinguishing features, one of which includes a customer’s propensity to have online devices in their home. Through the results presented in this paper, we are confident about the accuracy of our classification results; however, we recognize that there are opportunities for latency improvements in the efficiency of the process.

1. Introduction

Applicable to any paid-for service, a Service Level Agreement (SLA) describes the terms and conditions (T&Cs) associated with the service for which a customer pays. If the service provided does not comply with the T&Cs to which the customer agreed, they will be compensated. SLA provisioning processes for online services from an Internet Service Provider (ISP) are relatively basic in terms of the configuration and personalization options—services are often characterized by the platform uptime, in the sense that the service should be available for a pre-defined percentage of time; otherwise, a customer will be compensated for the service provider’s non-compliance with the SLA. The cost for relying on a service with this platform uptime will be dependent on a service tier selected by a customer; a few tiers on offer will correspond with a bronze, silver, and gold type of offering. While this provides some degree of service differentiation and the ability to propose a service that will respond to a customer’s needs, the existence of such restricted sets of SLA choices can result in a customer accepting a service that may not effectively and efficiently respond to their needs. A customer may, for example, agree to a service tier that provides more capacity than they need in the form of more bandwidth as one example. This may not appear to be a significant problem; however, it also has the negative consequence of a customer paying for more of a service than they will use. From a service provider perspective, it is also a less than optimum business model, with capacity being reserved for customers who will not use it and subsequently being unavailable for customers who would.
To contextualize this using a few exemplar SLAs available in practice: EE offers a six-tier home broadband service, with a monthly cost ranging from GBP 24 to GBP 48.50 [1]. Characteristics that distinguish between the services include average download speed (31 Mb/s to 900 Mb/s) and guaranteed minimum speed (18 to 450 Mb/s). Sky offers a three-tier home broadband set [2] with monthly charges from GBP 28 to GBP 39. As with EE, these are largely distinguished based on the average upload and download speeds, ranging from 59 Mb/s to 500 Mb/s for download and 16 to 60 Mb/s for upload. TalkTalk offers four service tiers for home broadband, from GBP 26 to GBP 49 [3]. Services are distinguishable according to their monthly price (GBP 26 to GBP 49), average download speed (77 Mb/s to 944 Mb/s), and the typical number of devices that can be connected (5 to 75+).
In support of the initial service setup and to provide services that are reflective of the way in which they are used in practice, we recognize that there may be a need (1) for the customer to have and use the necessary technical knowledge to define a service which more closely meets their needs, and (2) to communicate with a human operator, which is a task some customers are reluctant to perform. While some customers may be able to do this, such a situation may be disadvantageous for others and can restrict the extent to which a service is accessible—some customers will not feel comfortable taking either or both of these actions.
In an attempt to overcome this, we propose automating the process of purchasing a service and have made recommendations in relation to the ways in which a customer can access network services that more closely meet their needs in our previous work [4]. The process of doing so involves a customer responding to several non-technical questions, which do not need to involve interaction with a human operator and which we assume all members of society will be able to answer without a need for technical knowledge. The questions supporting this task have been constructed to indicate the extent to which a customer can be expected to use an online service, the technical competence with which they will do so, and their financial ability to pay for it. The goal of this paper is to present the way in which this service automation takes place and to examine the effectiveness and efficiency of the classification process. The process which we are describing in this paper is essentially a component of an SLA management framework; therefore, we examine this broader concept in more detail here, with a view to recognizing where our contribution may feasibly ‘plug in’.
SLA management frameworks are not a new concept, and end-to-end infrastructures over which network services are provisioned have adapted over time. Early-stage management frameworks, e.g., [5,6], are now evolving towards the direction of IoT SLA management frameworks, which, today, are the more novel application of this research area, e.g., [7,8,9]. In relation to earlier stage SLA management frameworks, the authors of [5] consider the exchange of management information in an approach that supports operation in a multi-domain way. This recommendation is made in recognition of the fact that there is an absence of a standardized approach to service management, and in an attempt to achieve that, the framework proposed in [5] includes an SLA manager, a contract manager, a network manager, and a policy database. In [6], the authors similarly focus on a multi-domain approach, with a view to managing the processes and relationships between service providers, customers, and suppliers, to provide an optimum process. There is less of a formal framework proposed in comparison to [5]; however, these discuss the challenges of achieving such an approach, which include providing a standardized approach and accommodating requirements across domains. However, in spite of the attention given to carefully designed contributions in this area, it is interesting that even today, a standardized core service to IoT SLA management still does not exist.
Bringing SLA management to the modern day, Alzubaidi et al. (2019) propose an IoT SLA management framework that uses blockchain technology to ensure the security of the process [7]. As an SLA provides a guaranteed service level to a customer for an agreed financial charge, this provides a fertile landscape for attacks to occur, both from the perspective of disrupting the SLA provision and, therefore, the service provider’s reputation and the monthly payment for a customer. An alternative blockchain-based SLA management approach is proposed by Battula et al. (2022), further verifying the utility of this general approach to managing SLAs [8]. Sahoo et al. (2021) propose SLA definitions that secure resources on the edge for time-sensitive applications [9]. This strategy demands knowledge of the typical application workflows for a user base, specifically their time sensitivity, to be able to deliver latency-aware just-in-time services. The authors do not, however, describe how this information will be gathered and acknowledge that the scheme depends on the data center operator knowing the proportion of time-sensitive and time-insensitive applications running. Singh et al. (2020) recognize the challenges of guaranteeing SLAs in the Internet of Things (IoT), specifically in terms of ensuring the resources are available on demand [10]. They present an SLA-aware autonomic resource management (STAR) tool designed to reduce the SLA violation rate and optimize the quality of service parameters to ensure efficient cloud service delivery. The operation is examined in terms of the failure rate, SLA cost, resource costs, penalty costs, and deadlines; resource provision decisions are subsequently made once these are evaluated in parallel.
Accommodating the range of metrics that vary dynamically and rapidly in the IoT, SLA management becomes more challenging in this domain. In an IoT system, the challenge is to accommodate the SLA across all layers of the infrastructure, a task complicated by the variety of devices and applications running in this environment. The framework proposed by the authors accommodates the capability to specify and monitor the SLA. Customer preferences may be captured, resource availability can be characterized, and services may be provisioned via microservices. Service level objective (SLO) parameters will be observed and violations flagged.
As noted above, in our past work, we proposed a set of steps to be followed by a user on their journey to securing a personalized SLA, allowing a more bespoke service to be accessed. Optimized resource provisions will be allocated in this way at a cost that is more representative of service needs [4]. Using a selection of customer classification categories from the Acorn Guide [11], a customer classification guide that describes customer behavior and purchasing ability, the questions we propose are asked to determine the service needs of a telecommunication customer. The questions are non-technical in nature and help to infer the extent to which a customer will use an online service, in addition to their ability to pay for it. As this is a more thorough process than is carried out at present, there is an opportunity to examine its effectiveness by an implementation in Python.
The process which is executed is dependent on the answers which are given to each question. As an initial question, the process seeks to identify if a customer owns a smartphone. If they do, the line of questioning will explore the extent to which they utilize an online service. If they do not own a smartphone, the goal will be to seek information on their ability to pay for a service. The conclusion of the process requires determining the time involved in classifying a customer according to their responses to non-technical questions, which are captured in an event log. We also examine the impact of a change in an attribute value entered—which may occur due to a misinterpretation of the question asked, a keyboard/mouse error, or an attempt to mask user service characteristics with a view to benefiting from it—on the customer classification and its suitability for the customer’s needs. A service assignment is dependent on the user score, with the service provisions, and therefore the cost, increasing as the score increases. A delay in processing customer metadata will not lead to an SLA violation—the SLA will not yet be active at this stage—however, it can lead to an unsatisfactory service uptake process, thereby undoing some of the benefits of personalized service. If it takes an unsatisfactory amount of time to make it available, does this undo the benefit of having it? It is, therefore, not the process of identifying an SLA failure that is the focus of this paper, but rather the effectiveness of the customer classification process and subsequent customer satisfaction from the perspective of the score assigned and the subsequent SLA provisions which is examined.
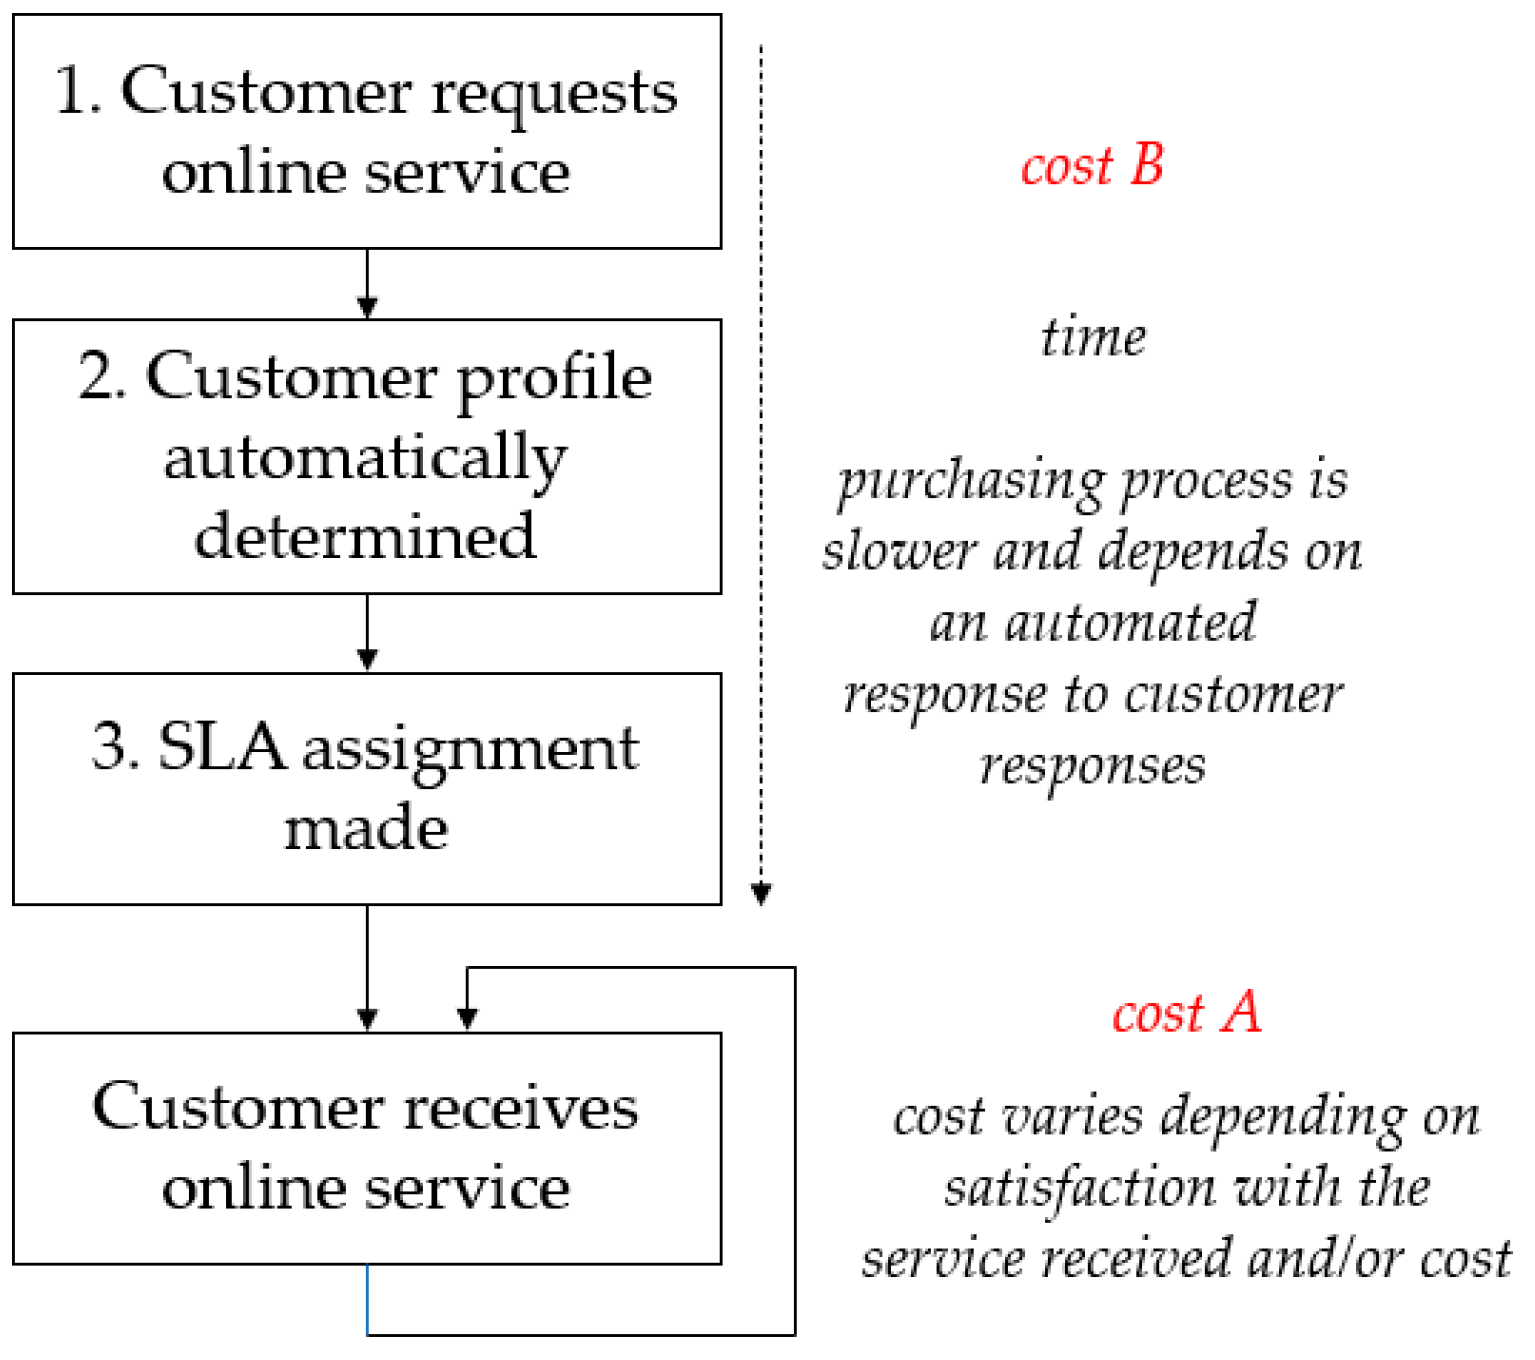
Currently, a customer can purchase a service without needing to interact with anyone (Figure 1), relying only on their own knowledge. The benefit of being able to access a service quickly and easily in this scenario may be superseded by the cost embodied through customer satisfaction. We argue that this scenario has the risk of customers paying for a service that does not closely respond to their service needs resulting either in higher cost, which does not reflect the way in which the service is used, or inappropriate resource provisions being reserved for a customer who will not use them.
The customer may be satisfied with the rapid availability of a service and the ability to manage the service uptake without needing to interact with anyone from the ISP; however, the benefit of being able to access a service quickly can be outdone by the risk of purchasing a service that does not closely meet the service needs, which may also result in paying a more excessive service charge than is representative of service use.
On the other hand, Scenario A can be compared to the process executed when customer service needs are determined automatically in response to questions answered in Scenario B (Figure 2). Cost in this context is measured according to the time to execute the process on behalf of the ISP when making the assignment, in addition to the financial cost incurred. The goal is to avoid having a negative satisfaction cost in relation to the service received, only the benefit, and therefore only a financial and not a customer satisfaction cost. The financial cost incurred should also be proportionate to the service required.
While it is not possible to avoid the extra time involved with the process of establishing the service that most closely meets customer needs, the goal is to ensure that cost B has less impact on a customer than cost A. In Scenario B, our aim is that Cost A is negligible, and that Cost B in Scenario B is less than Cost A in Scenario A. In achieving this, we argue that the process of service uptake is more effective when proposing a personalized and bespoke SLA assignment process for a telecommunications customer. This is the over-arching goal of the strategy that we are proposing, and in order to optimize the effectiveness of the service assignment, we seek to examine the efficiency of steps 1, 2, and 3 in Scenario B. It is, therefore, this examination that is presented in this paper.
The remainder of this paper continues as follows: In Section 2, the Materials and Methods section discusses the methodology of assessing resource needs for customers dependent on their personal characteristics. This includes consideration of the questions which are asked as part of the process of defining customer service, together with the rationale for their asking. The implementation of the SLA assignment process in Python follows in Section 3, which also includes examples of an event log captured as a consequence of executing the SLA assignment process. In Section 4, the results are discussed from the perspective of the discovery, conformance, and enhancement of our SLA process and are presented together with our conclusion and consideration of further work.

2. Materials and Methods

The process presented in this paper involves customer classification by an ISP so that online service needs can autonomously be determined and a service that more closely responds to customer needs is provisioned. As noted earlier, the process begins by asking a customer if they own a smartphone, with a view to recognizing the user’s exposure to accessing online services. We might assume that those without a smartphone will be less exposed to online services in general and less predisposed to wanting to access online services than those with a smartphone. This idea is verified by the details provided in the Acorn Guide [11], which classifies customers according to distinguishing features, one of which includes a customer’s propensity to have online devices in their homes and the ways in which they use them. To consider one customer group as an example to contextualize the assumption we are making around customer practices: ‘Elderly singles in purpose-built accommodation’ are described as having “little expenditure on technology or expensive phone or broadband contracts … They may have Internet connectivity available but rarely access the web to any great degree” [11]. Therefore, in examining the nature of sophistication in relation to the technology available at home, this allows assumptions to be reached in association with the resource provision needs of an online service and response time to service problems, with a higher need for support more likely and less resource allocation requirements for customers without sophisticated technology.
The suite of questions used to examine the service needs of a customer is presented in Table 1, alongside the rationale for the question and support for the rationale from [11].
A score assigned to a customer is an addition of the scores assigned to several attributes used to characterize their service needs. Each attribute is scored from 1 to 5, with 5 indicating that the attribute plays a more significant role in the customer’s life than a score of 1.
Income: A customer with a score of 5 for Income receives a higher rate of income than a customer with a score of 1 for Income.
Education: A customer with a score of 5 for Education has a higher educational achievement than a customer with a score of 1 for Education.
Technology: A customer with a score of 5 for Technology has greater access to technology than a customer with a score of 1 for Technology.
Internet: A customer with a score of 5 for Internet has access to a more sophisticated Internet service than a customer with a score of 1 for Internet.
Employment: A customer with a score of 5 for Employment has a more professional job than a customer with a score of 1 for Employment.
House Type: A customer with a score of 5 for House Type has a home of greater value than a customer with a score of 1 for House Type.
Average Technology Age: A customer with a score of 5 for Average Technology Age has more modern technology than a customer with a score of 1 for Average Technology Age.
These attributes have been selected as indicators of a customer’s SLA requirements, in line with the descriptions provided for each customer classification in [11]. The average age of technology, however, does not come from the Acorn Guide and is a novel aspect of our recommender proposal.
A comparison of the score assignments to the attributes described above on a per-customer category is presented in Table 2. It is on the basis of the scores assigned in Table 2 that the SLA assignments are made. To consider the relevance of the scores in relation to the characteristics of customers belonging to each category: The highest score is assigned to customers with Executive Wealth, with a consequence that the greatest volume of resources will be provisioned for this customer group, in addition to having the most expensive SLA. This is a reasonable expectation, given the detail captured in Table 1 in relation to this category, e.g., more likely to own smartphones, incomes are good, and many have savings.
Due to the fact that there are no equivalent approaches to SLA provisioning available, it is not possible to access a real dataset to examine the effectiveness of our process. We have, therefore, created a randomly-generated dataset using the range of attribute values in Table 1. We appreciate that the synthetically-generated dataset may have reduced accuracy when compared against one that may be captured from live customers due to the dependencies between attribute values, e.g., dependency of income on education and dependency of average technology age on employment. However, we also argue that there is every possibility that a customer could enter their personal data into the system inaccurately, possibly by mistake or for intentional reasons to mask their characteristics, perhaps for a misbelief in relation to the impact that doing so may have on their SLA.
We aim to avoid making any assumptions about a customer’s technical ability when answering questions in support of characterizing their service needs. We also wish to avoid being unnecessarily intrusive. Therefore, customers can indicate the extent to which they are associated with any individual category using a Likert scale of yes or no, old or not old, and below average, average, and above average. The list of 11 attributes in Table 1 can then be matched against the seven attributes in Table 2 for scoring purposes, with each attribute individually having an impact on the classification process, in addition to attribute combinations having a further impact when considered together (Table 3).
As described above, the suggested customer categories used to characterize customers are gathered from the Acorn Guide [11]. The categories most relevant to our service assignment problem have been used, as summarized in Table 4; however, this list is not exhaustive in terms of the categories defined in [11]. The customer classification categories which we use in our work are the umbrella terms for several sub-categories. We exploit the fact in our mechanism that there are more significant variations between the umbrella terms when compared against each other than there are between the sub-categories of each umbrella term. This, therefore, explains the detail which is entered within the Classification Description in column 2 of Table 5 for each customer classification.
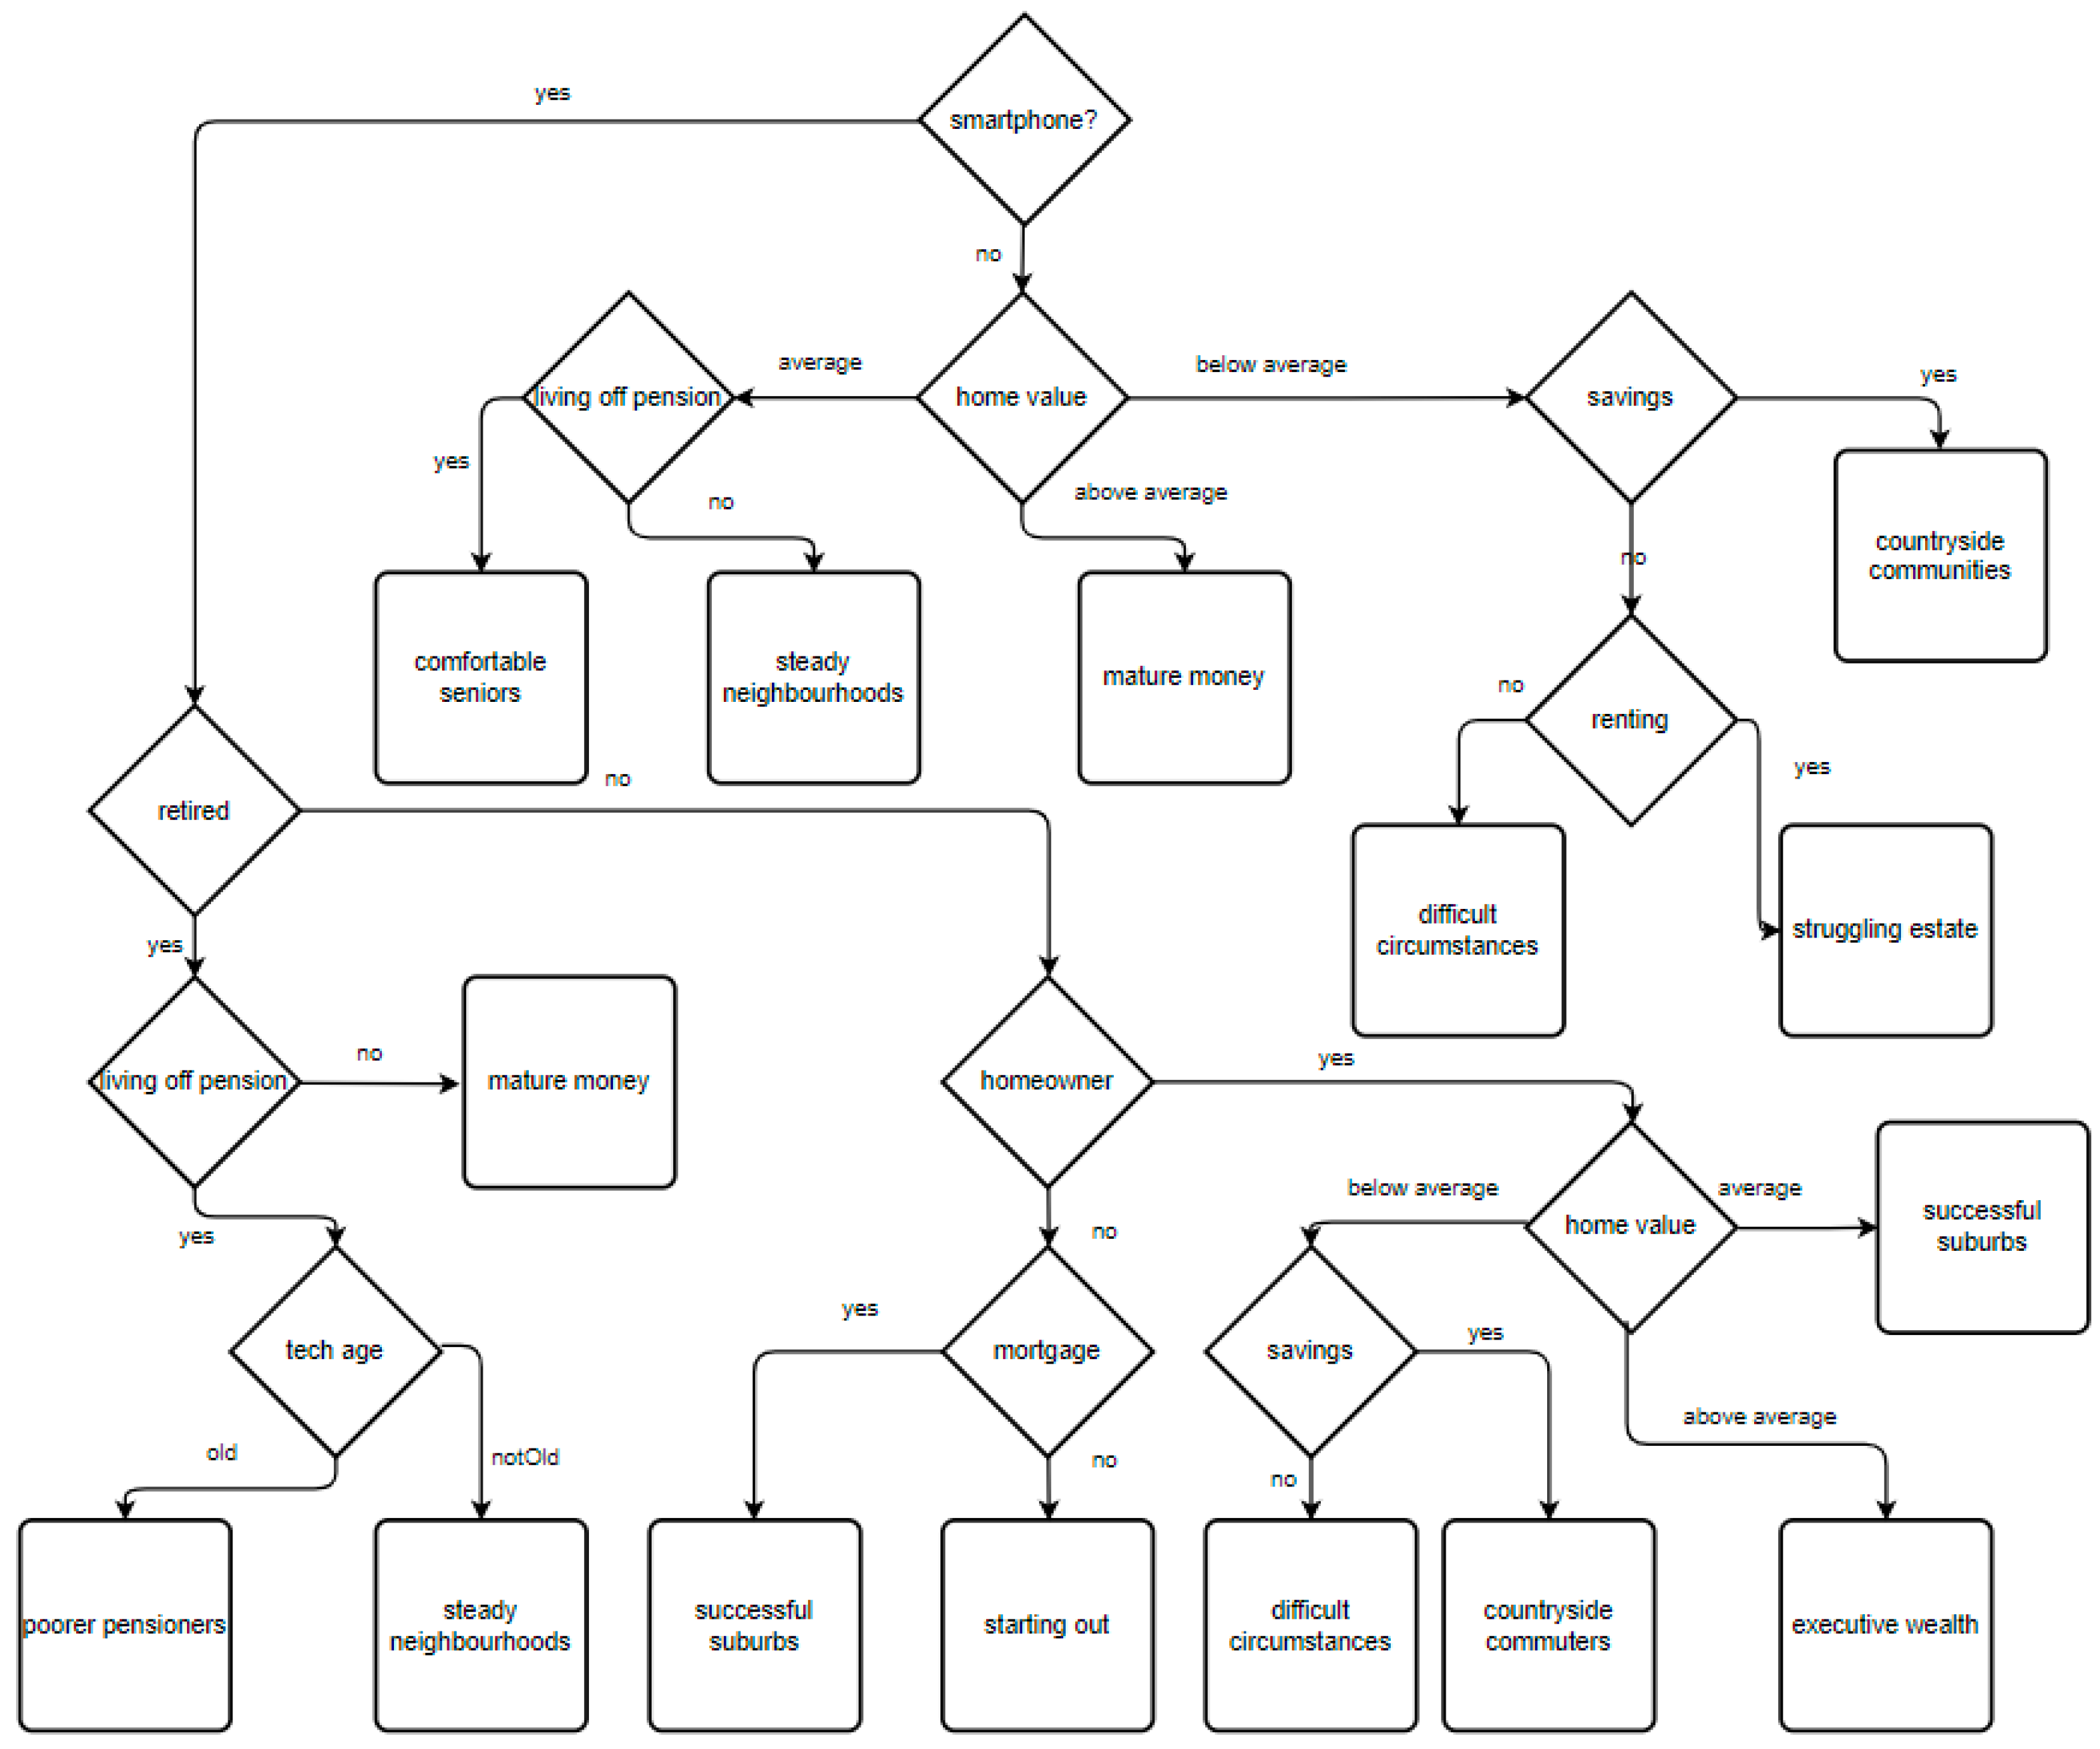
The classification of customers into the categories defined in Table 2 is presented in Figure 3.
As described above, the primary detail on which a customer classification is made depends on a customer having a smartphone, with the specific process taken dependent on smartphone ownership or not. When a customer indicates that they have a smartphone, the process then examines their likelihood of accessing online services through the fact of having a status of being retired or not. The Acorn Guide [11] indicates that those who are retired are less likely to use online services than those who are not. In the event that they are not retired, the examination then takes the path of home ownership and home value. When a customer is retired, the process seeks to examine the extent to which they have modern technology.
A score is assigned alongside a classification and is used to influence SLA resource allocations. Resource allocations will increase in parallel with the score. Time within the context of the process refers to the delay to classify a customer in response to the responses to questions asked by the service provider.

3. Results

Table 6 captures a customer’s classification and the time taken to perform the classification once responses are provided to determine their service needs. This investigation is particularly interested in the time involved in reaching this decision, the way in which this varies depending on the customer classification, and the bottlenecks in the process for any particular user group. The goal is to support continuous improvement of the service quality offered to the customer.
Based on the synthetic dataset produced using the random generator, the classifications in Table 7 are made. Every record in the dataset has been classified, with the greatest propensity being to allocate the Mature Money and Steady Neighborhood categories. The least commonly allocated classifications include the Executive Wealth and Struggling Estate categories.
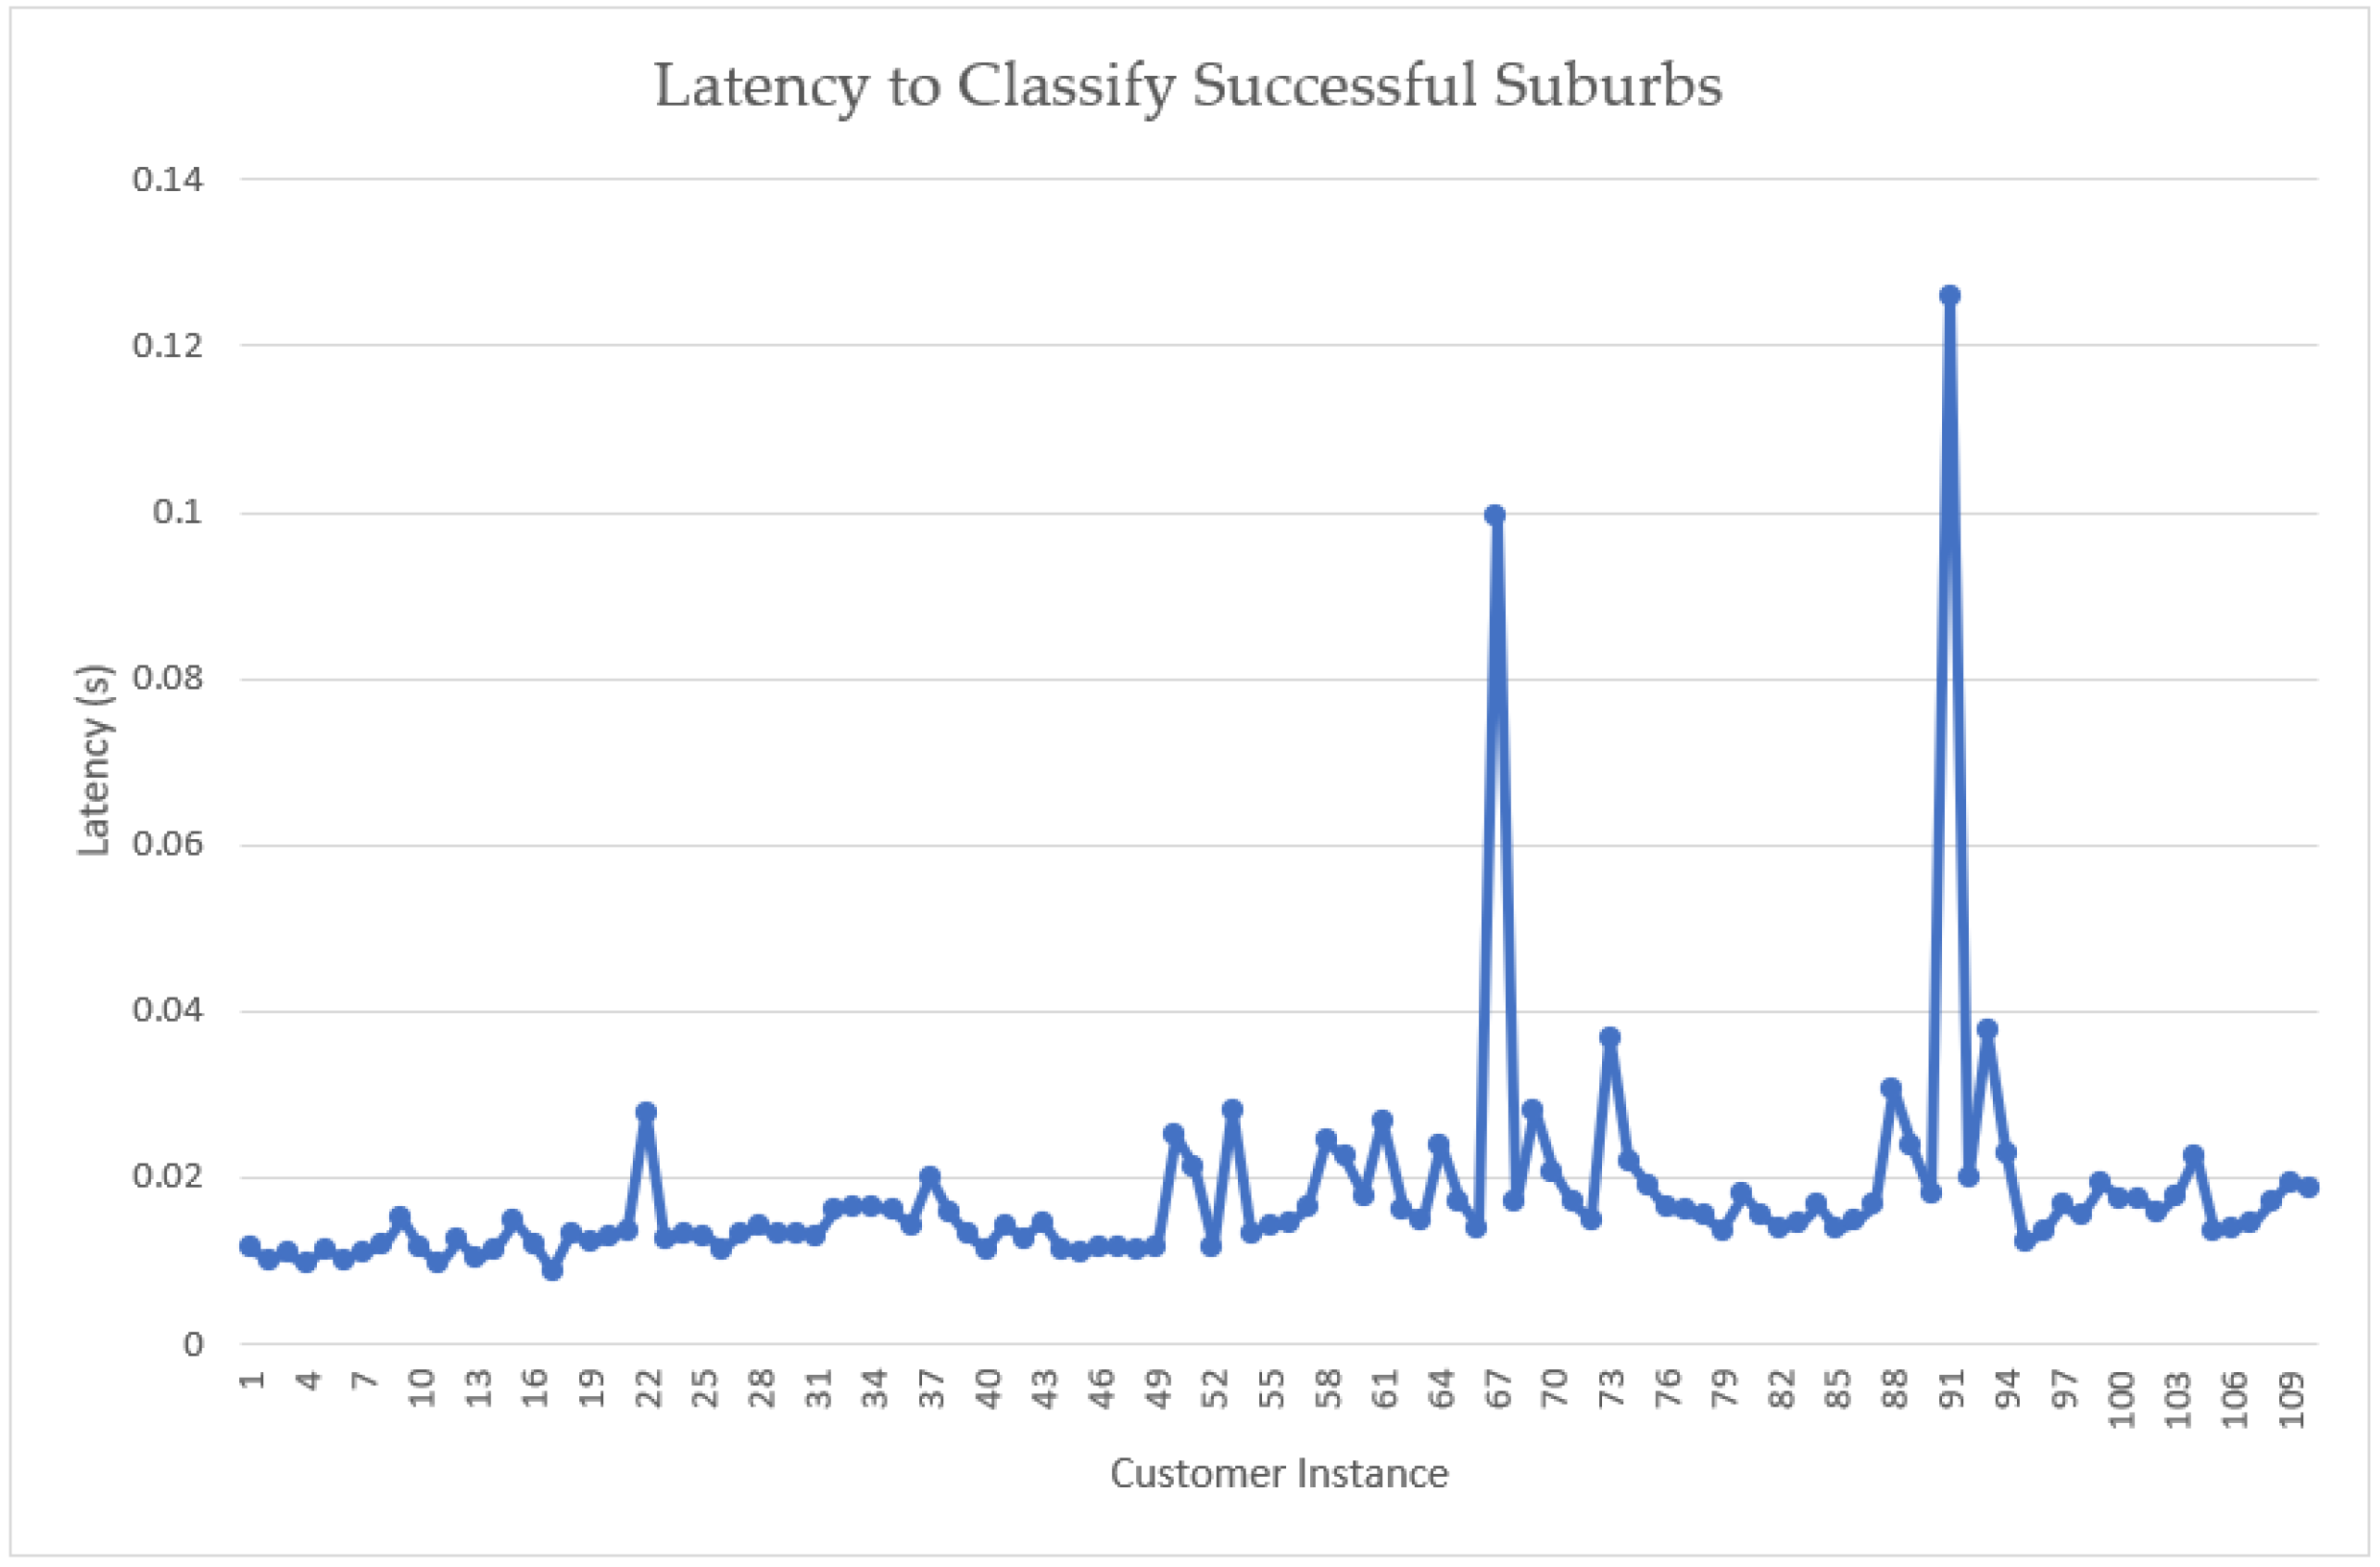
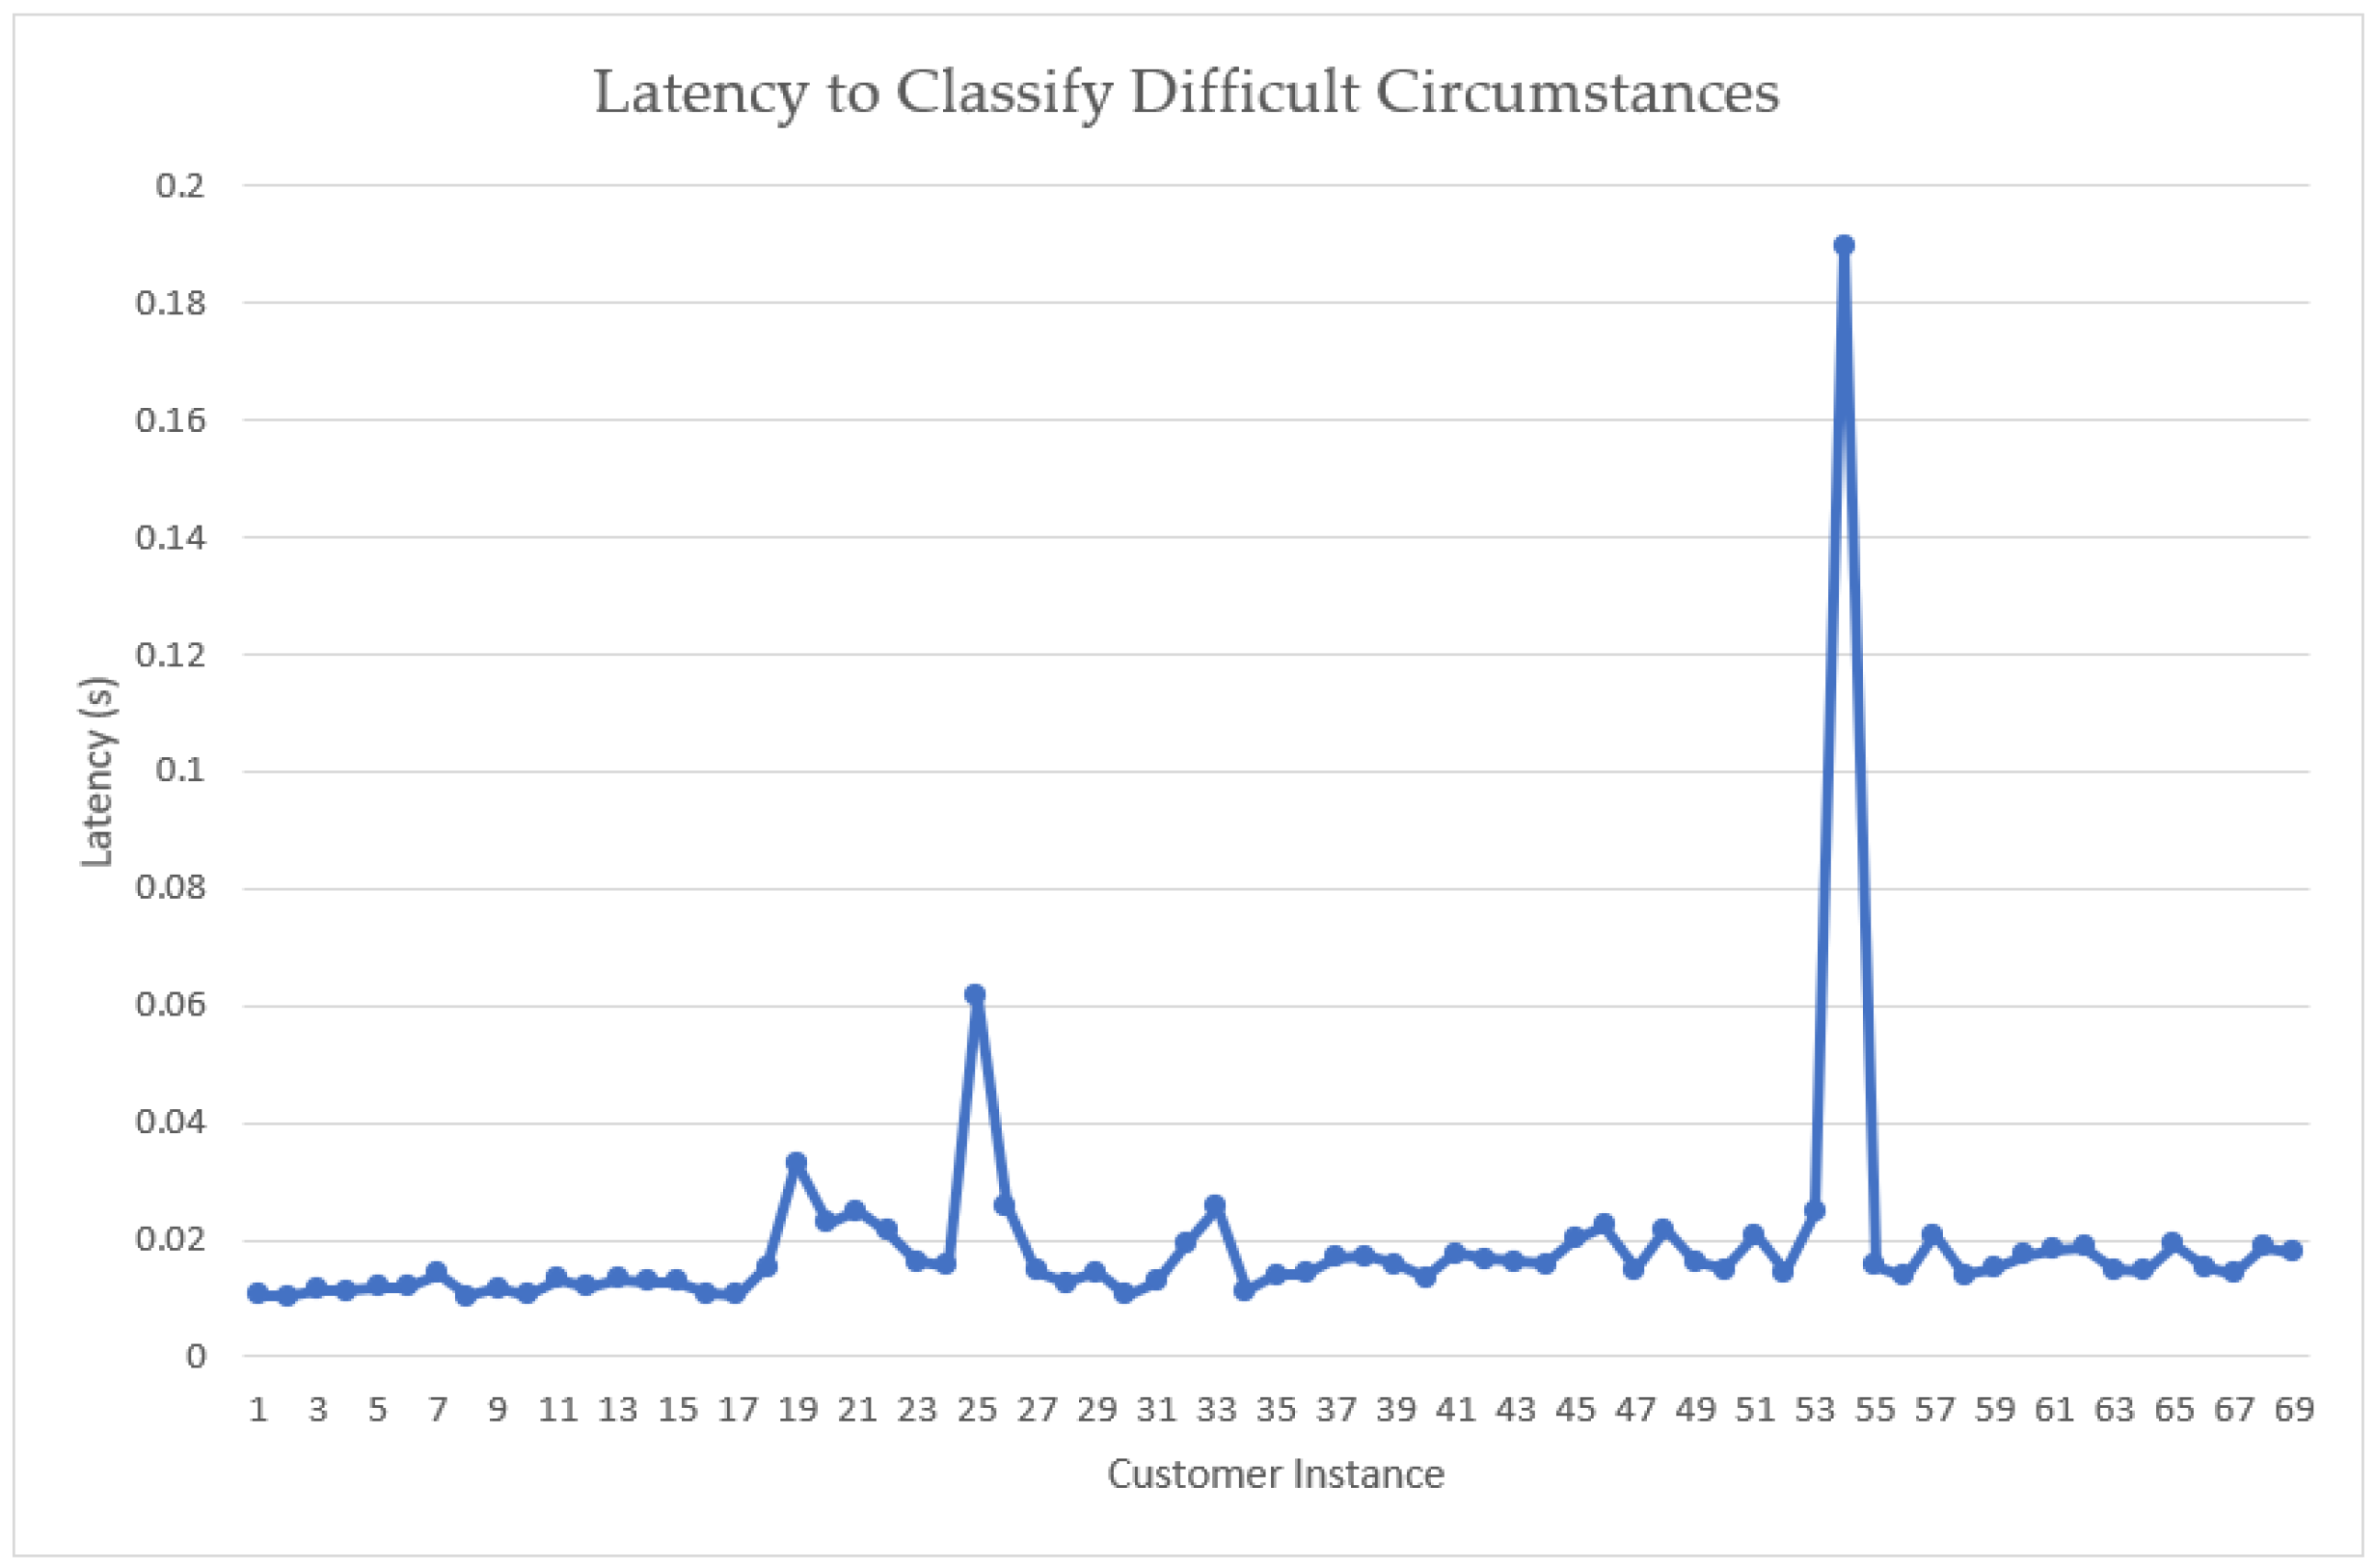
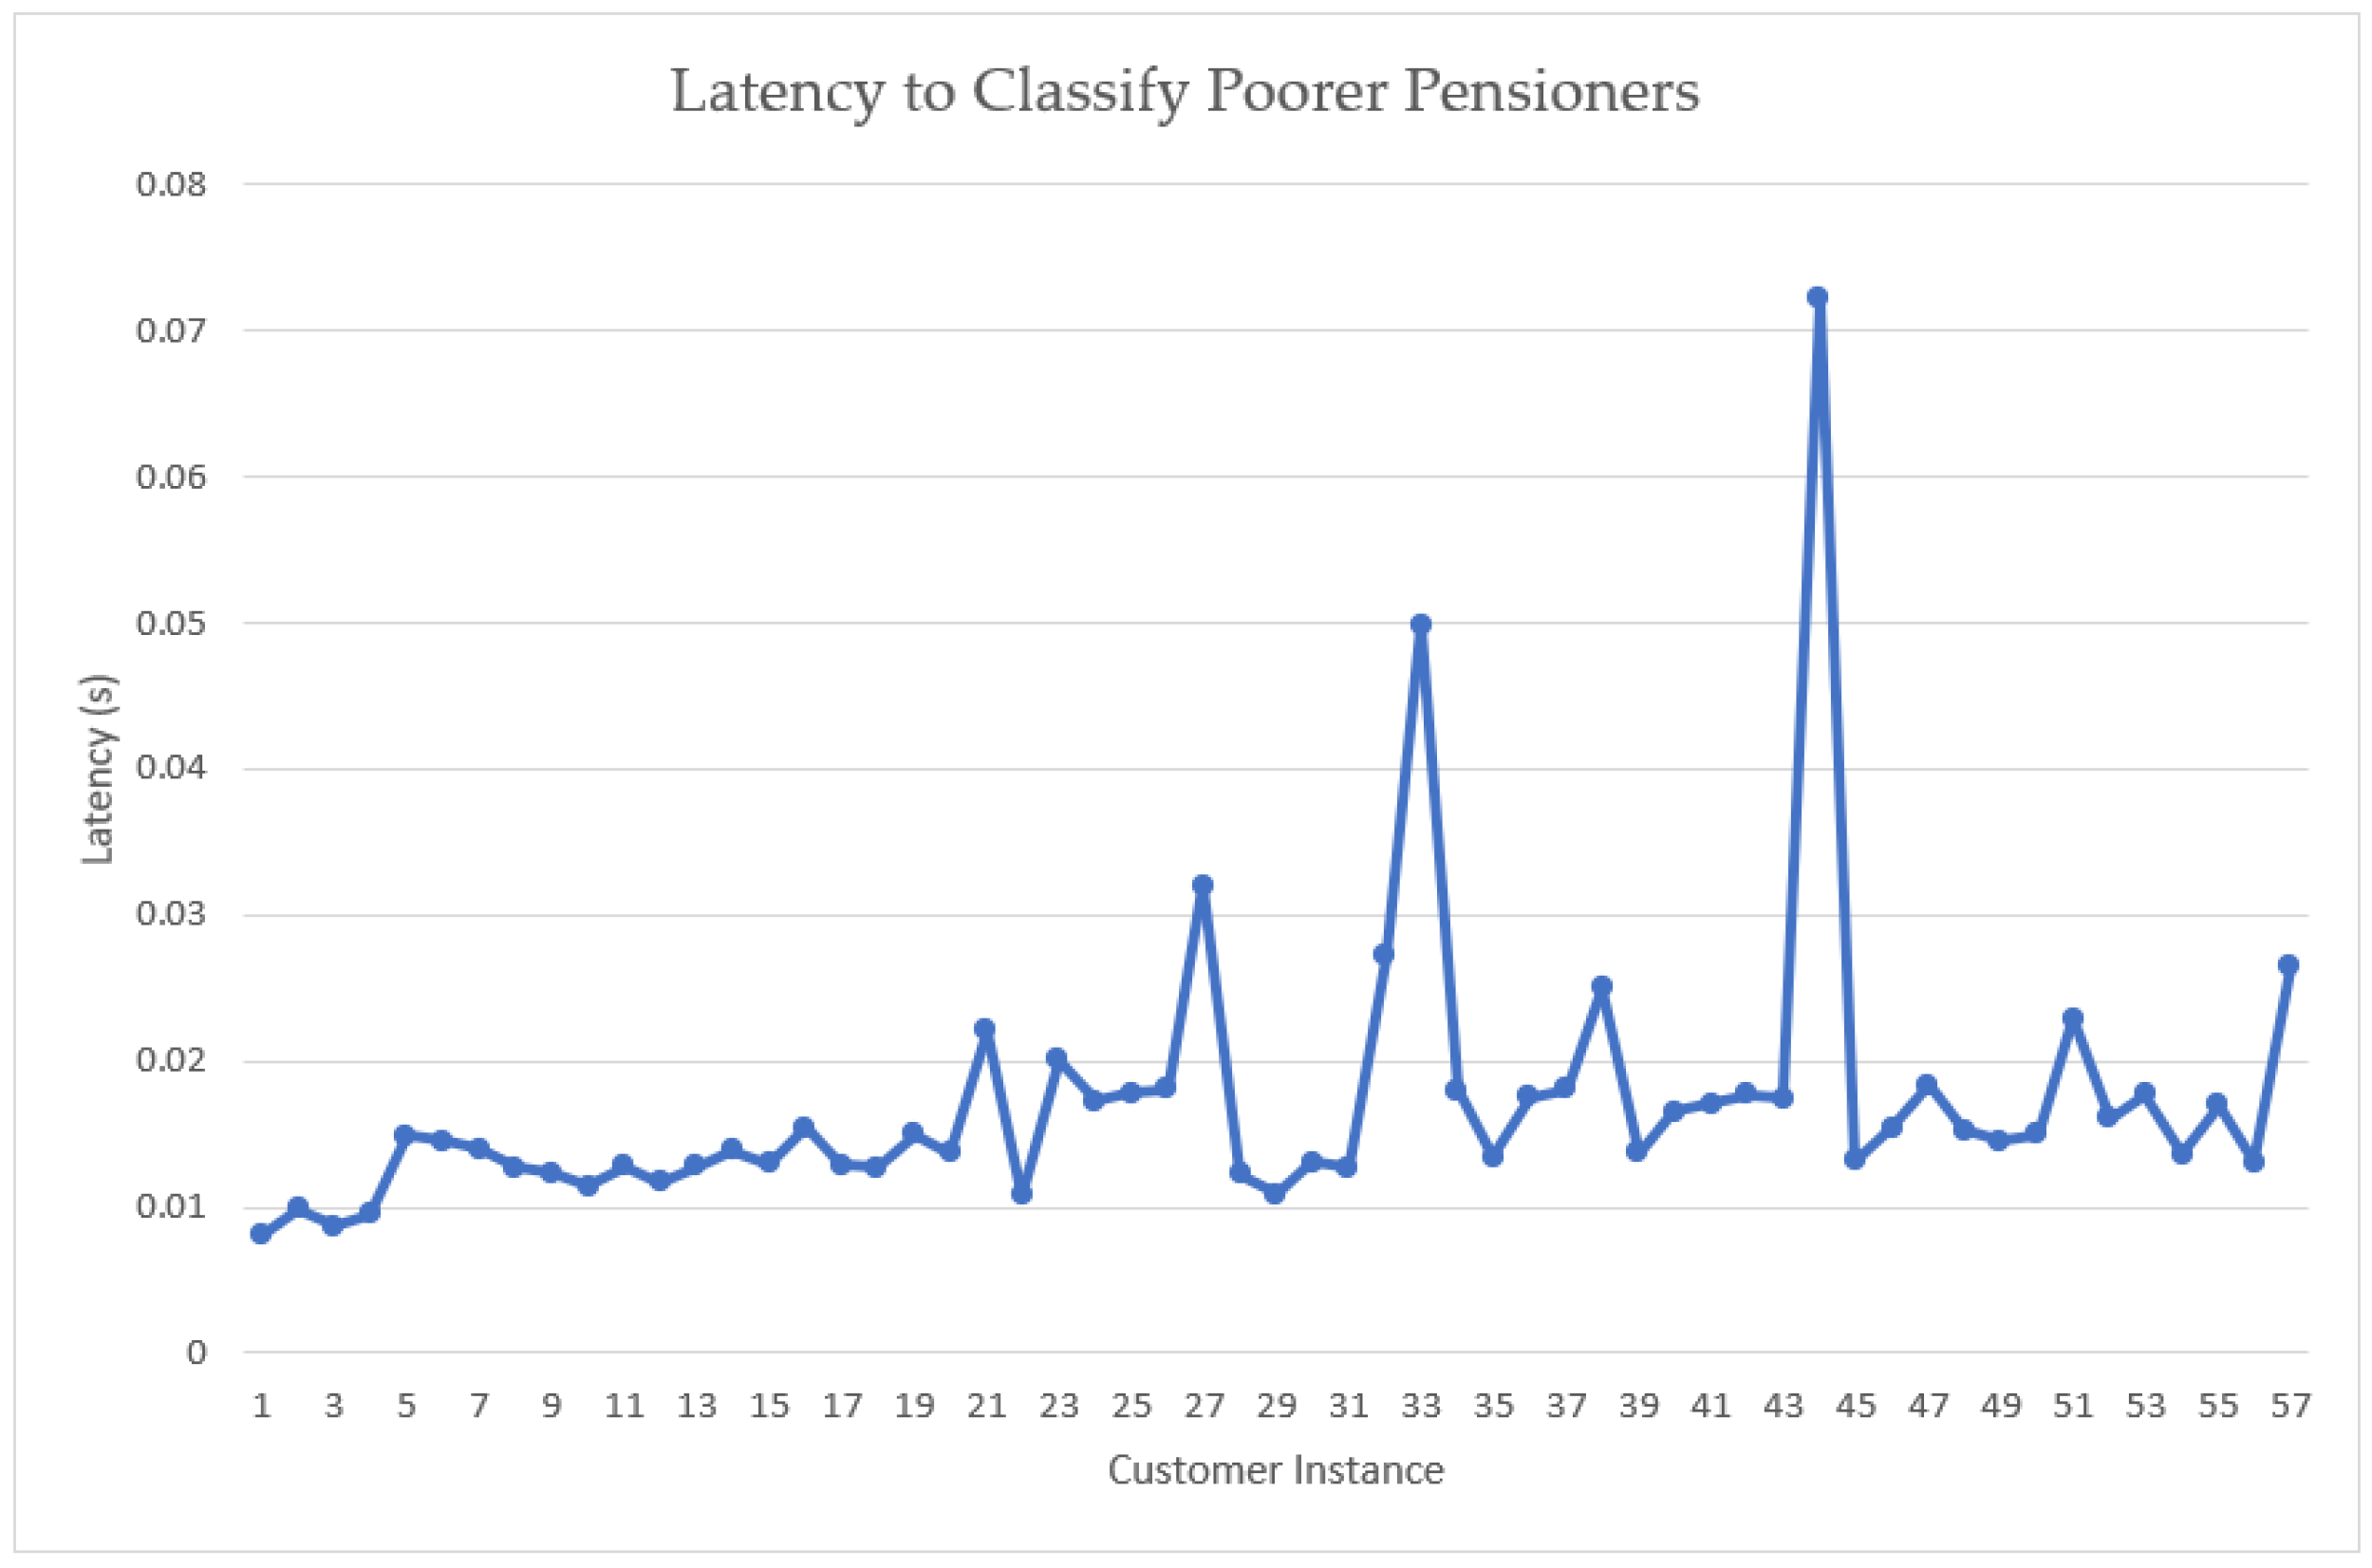
The latencies involved in assigning customers to their classifications are presented in Figure 4. These can be used to examine the efficiency of the classification process. Latencies incurred per customer instance for a selection of categories are considered in Figure 5, Figure 6, Figure 7 and Figure 8.
The classification latencies reveal that the most amount of time is required when classifying customers with the lowest score—Difficult Circumstances customers. The next highest latency is incurred for Starting Out customers. These higher-than-average latencies are incurred when customers have a smartphone and are not retired. The fact of being a homeowner or not is examined, in addition to having a mortgage for the former or the home value and savings for the latter. This process is part of the deeper process tree in Figure 3; therefore, the higher classification latencies are not unexpected. However, this poses an opportunity for attempts to improve the efficiency of the process. Given the fact that Difficult Circumstance and Starting Out customers do not represent the majority of the customer base (Figure 4, we can conclude that the process for classifying the majority of customers is effective; however, these remain areas for improvement in further work.

Examining the Impact of Inaccuracies in the Dataset on the Classification Process

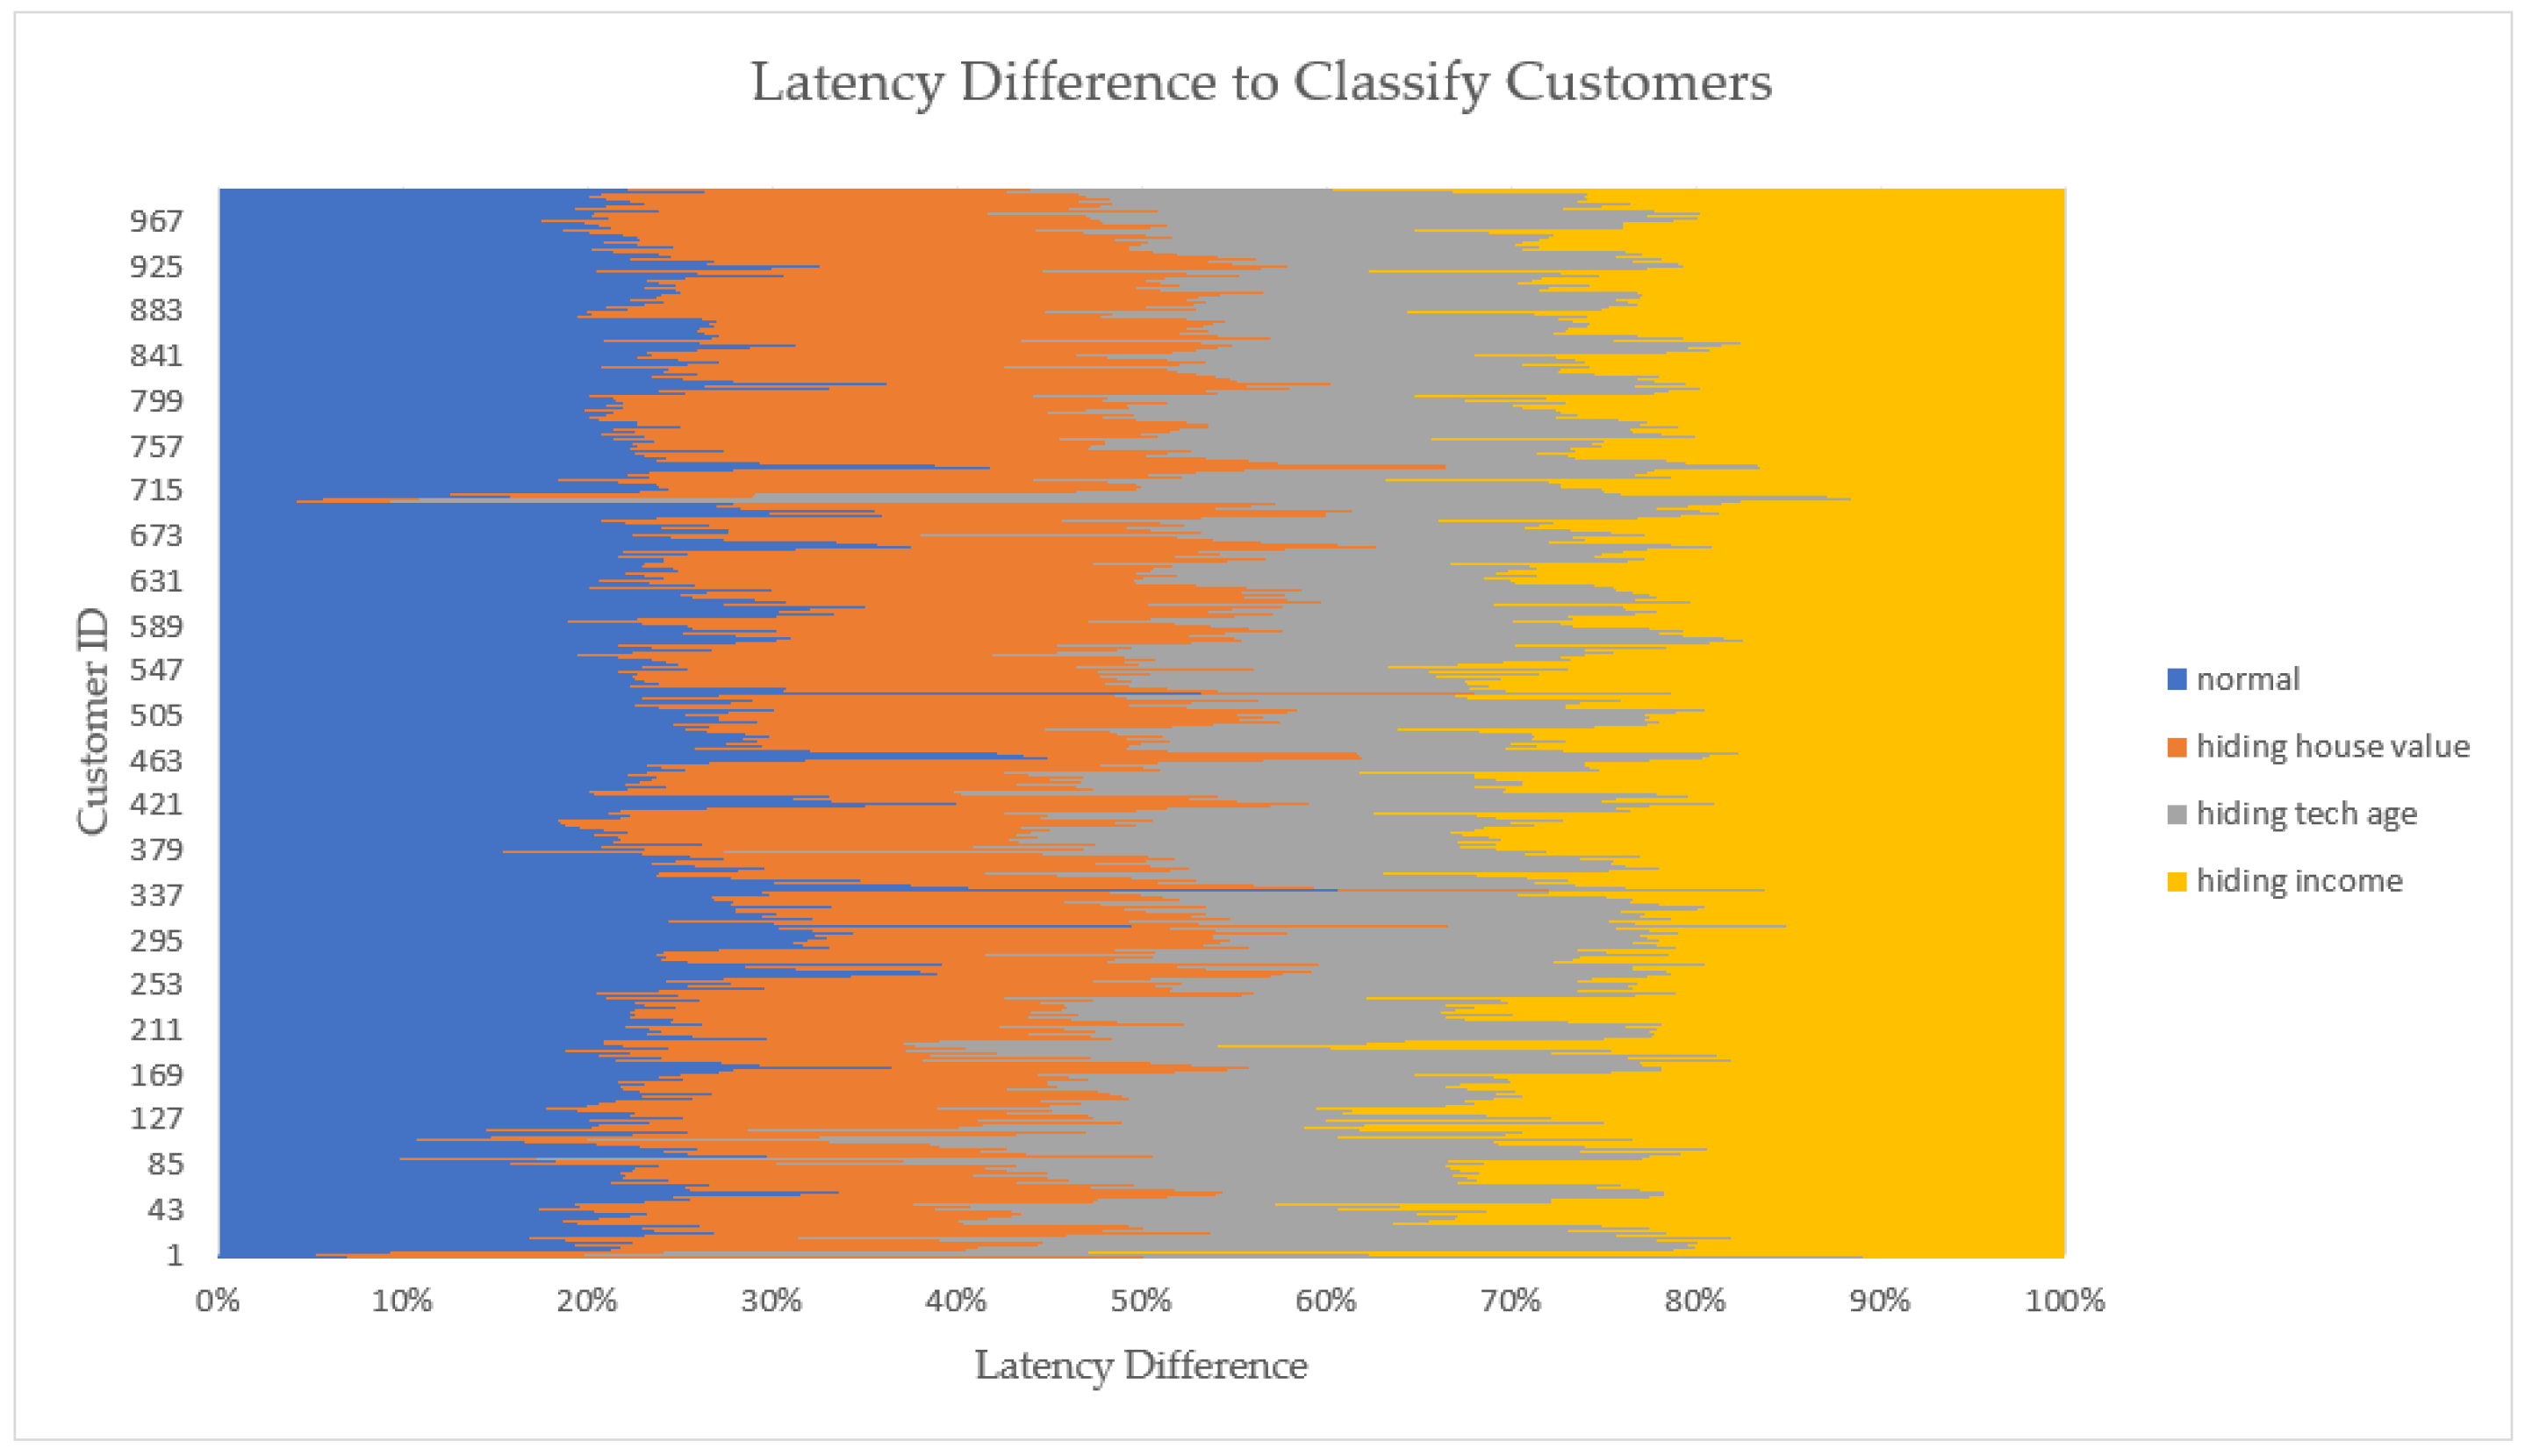
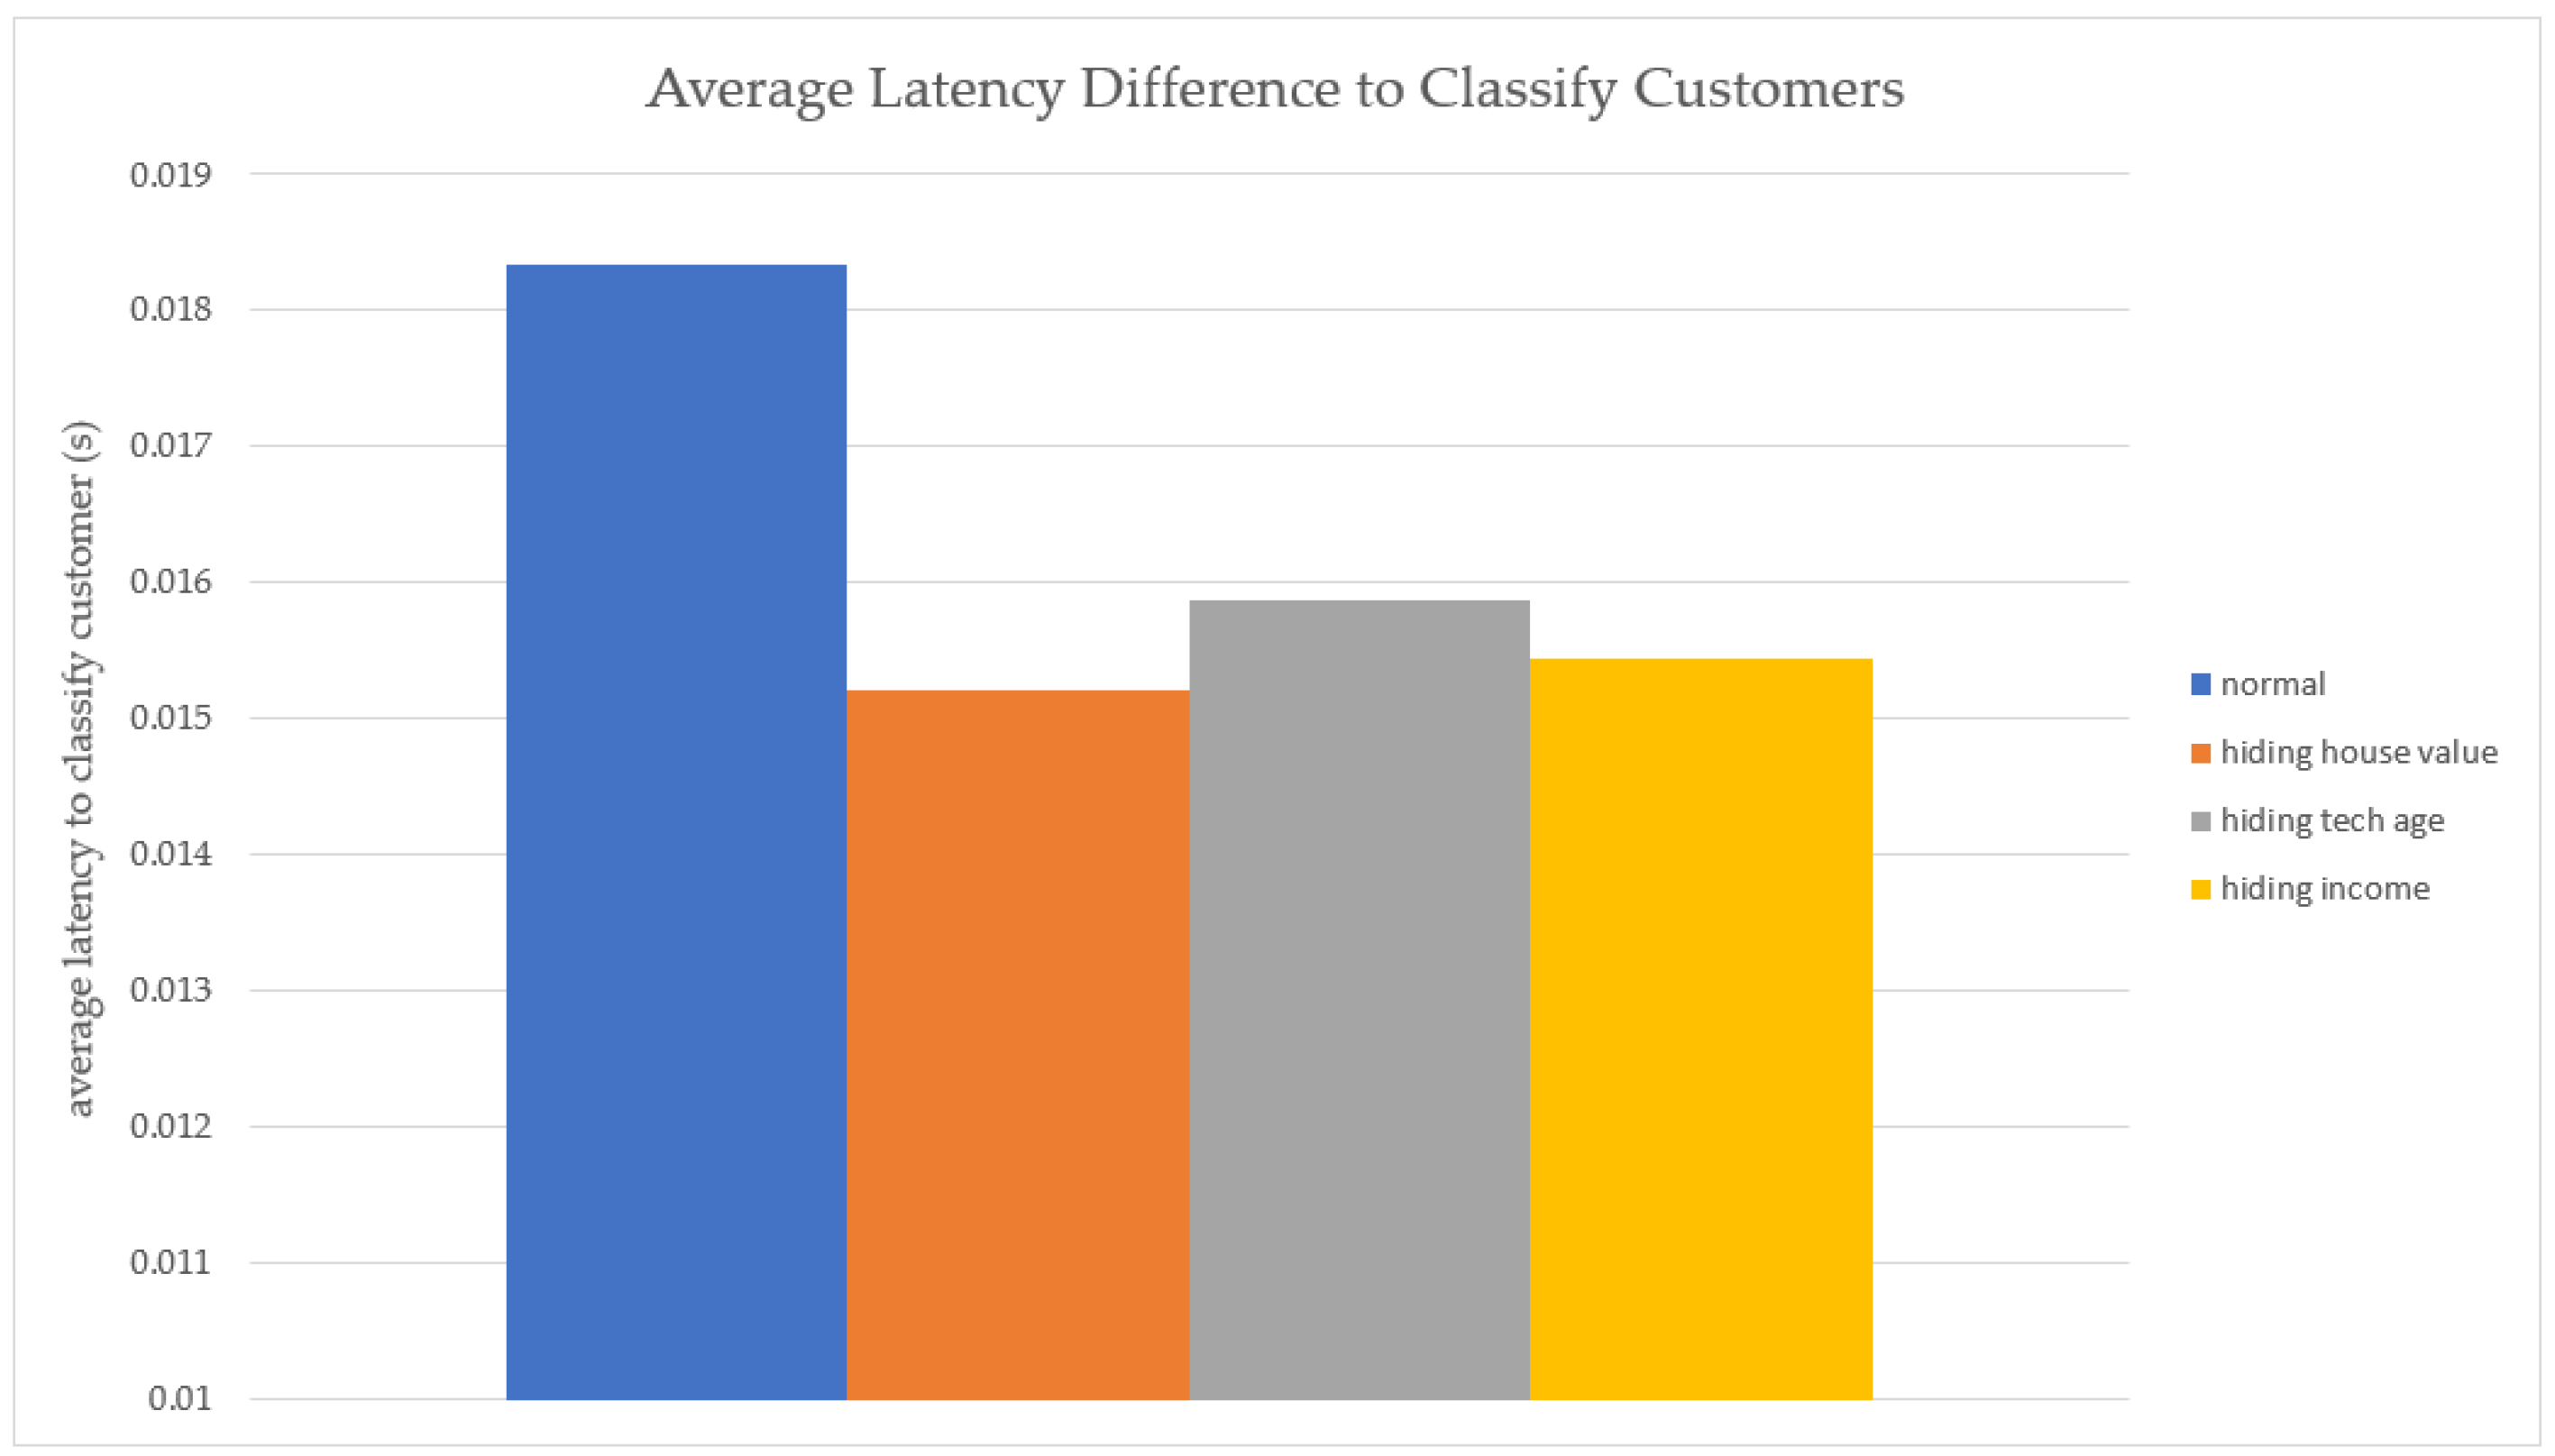
In recognition of the fact that customers may enter incorrect information, either intentionally or by mistake, it is relevant to examine the accuracy of the classification process and the impact that incorrect data entry has on the classification latency. To examine this, the classification process has been run for situations where the home value, technology age, and income have been hidden individually. Figure 9 and Figure 10 reveal that classification latency is greatest when all data are used to influence the classification process, with latency being lowest when the house value is hidden.
Latency to classify is not the only impact of certain data attributes being unavailable but additionally, the category to which a customer is assigned is also impacted. As shown in Table 8, once any of the house value, income, or average technology age information becomes unavailable, customers are no longer assigned to the Executive Wealth category. Furthermore, fewer customers are assigned to the Mature Money category. On the other hand, more are assigned to the Successful Suburbs and the Steady Neighborhood classifications.
To examine the profiles of customers assigned to the Executive Wealth category in the presence of a full data record, with a view of identifying the reason(s) why they are no longer assigned to this category once any attribute detail is missing, a selection of records is presented in Table 9. A score of 34 is assigned for Executive Wealth customers.
In the event of any of their datasets being missing, these customers are then assigned to the Successful Suburbs category, with a score of 25. With a lower SLA score, fewer resources will be provisioned as part of the SLA at a lower cost. Satisfaction may, therefore, be negatively impacted from the perspective of performance.
When customers who would otherwise be assigned to the Mature Money category (Table 10) mask their house value, their score declines from 25 to 20 through assignment to the Steady Neighborhoods category (Table 11), again with the potential of a reduction in their satisfaction with the service performance.
It is our opinion that this is an acceptable situation. Once discovered, service adjustments can be made in response to a customer indicating that their service is unacceptable. We believe this to be preferable to a customer being unsatisfied because their service cost was too high.

4. Discussion

There is a cost to examine with our process in that, for some customer profiles, only a few of the attributes which are collected are used to support the profile assignment, and the other data are then collected redundantly. Some circumstances of classifying a customer include a minority of attributes when making decisions using the tree. For example, a Mature Money customer can be classified as such because they do not own a smartphone and their home is above the average home value; this decision is, therefore, made using only two attributes. In other circumstances, however, a customer can be classified as a Difficult Circumstances customer in the event that they do not have a smartphone, they are not retired, they are a homeowner, their home value is below average, and they do not have savings, a decision which requires the maximum of five attributes. As rationalized earlier, we will continue to examine the opportunities for optimizing the process depending on the early responses to questions asked, with a view to more quickly realizing the efficiencies of the classification process, which can be exploited for the latency benefits of doing so. For the time being, however, we believe that the current approach achieves its goal in a satisfactory manner, given that the Difficult Circumstance customers are a minority of customers.
The mechanics of the approach presented in this paper goes beyond the process presented in our earlier work [4] based on the limitations identified. In [4], the approach is dependent on the customer providing responses to the following points:
-
Location;
-
Number of people in household;
-
Age of oldest;
-
Age of youngest;
-
Any residents in the 10–20 age bracket;
-
Number of devices;
-
Service priority.
We recognize that significant assumptions were made in this approach by forming conclusions based on the proximity with which a user resides in relation to the closest city. The answers to the other questions can be inferred (e.g., number of people in the household, age of youngest, age of oldest, residents in the 10–20 age bracket, number of devices, and service priority) from the responses to questions that we now consider to change less dynamically. However, we hope to have accommodated these questions by explicitly trying to characterize a customer according to the categories presented in this paper.
When attempting to characterize a household through autonomous means and making assumptions regarding situations inside a home, there is always a risk that incorrect conclusions will be drawn. This consideration also has relevance given that significant variations can be identified once drilling down into the sub-groups belonging to each classification category. With the category of Executive Wealth, for example, while the majority include wealthy families in large homes, some Executive Wealth customers are retired and empty nesters. We have made a decision in this work to optimize the process by not drilling down into this additional layer of detail. While we recognize the benefits of doing so, we also recognize the costs. To overcome this particular example of assigning a customer to a category of higher resource provisions, and therefore cost, than they need in the event that they typically belong to the Executive Wealth category, we instead avoid making any assignments to Executive Wealth in the event that the customer indicates that they are retired. Such bespoke configurations represent the complexity of this service assignment process for the benefit of being able to offer a personalized SLA.
In light of these customer characteristics presented in the Acorn Guide [11], on which our process is based, and the significant variations between customer characteristics within an individual category, we seek in our further work to define a customer classification guide relevant to those who are purchasing from an ISP. One of the more significant attributes in this process will be the type of technologies owned and the average age of technologies within the household. Based on our experience of examining customer profiles, we believe that these attributes, at a minimum, provide sufficient context regarding online service needs within a household. We are, therefore, confident about the classifications which are assigned to customers; however, we recognize that there remain opportunities to optimize the latency of the classification process, which we will examine in our future work. We will explore the opportunities to do so by examining the order in which questions are asked in an attempt to minimize the latency in the classification. This may involve modifying the order dynamically based on the responses to questions already asked.

5. Conclusions, Limitations, and Further Work

In this paper, we have presented an analysis of the process executed when automating the task of assigning a customer SLA. Through analyzing the classification made in line with the customer’s profile, we are confident about the suitability of the classification reached during the automated process. However, we recognize that there are opportunities to optimize the efficiency with which the process is executed. This takes into account the number of attributes used to support the classification, which varies depending on the customer type. We will continue to explore this for the efficiencies we may introduce in our future work.
We will also endeavor to work with a live customer dataset in the future. One limitation of the research presented in this paper is the fact that we are working with a synthetic dataset. This was necessary due to the fact that an SLA provisioning approach such as that presented in this paper is not yet available within telecommunication companies, limiting the accessibility to live data. For the purpose of the investigation presented here, we are confident about the utility of the findings made; however, we recognize that further certainty could be achieved in the presence of realistic customer data.

Author Contributions

Conceptualization, C.P., Z.T., N.G. and A.M.; methodology, C.P.; software, C.P. and Z.T.; validation, Z.T.; formal analysis, C.P., Z.T. and N.G.; investigation, C.P. and Z.T.; data curation, C.P. and Z.T; writing—original draft preparation, C.P. and Z.T.; writing—review and editing, N.G. and A.M.; visualization, C.P. and Z.T.; supervision, N.G. and A.M. All authors have read and agreed to the published version of the manuscript.

Funding

This research received no external funding.

Data Availability Statement

Not applicable.

Acknowledgments

This research is supported by the BTIIC (BT Ireland Innovation Centre) project, funded by BT and Invest Northern Ireland.

Conflicts of Interest

The authors do not have any conflicts of interest to declare.

References

  1. EE. Broadband Deals Available in Your Area. Available online: https://broadband.ee.co.uk/select-your-speed (accessed on 22 February 2023).
  2. Sky. No Upfront Fees on Superfast Broadband. Switch Today. Available online: https://www.sky.com/broadband#Comparison-table-BB (accessed on 22 February 2023).
  3. TalkTalk. Fast Broadband for Every Home. Available online: https://new.talktalk.co.uk/broadband/ (accessed on 22 February 2023).
  4. Peoples, C.; Tariq, Z.; Moore, A.; Zoualfaghari, M.; Reeves, A. Using Process Mining to Formalise Service Level Agreement (SLA) Allocation. In Proceedings of the 2021 IEEE SmartWorld, Ubiquitous Intelligence & Computing, Advanced & Trusted Computing, Scalable Computing & Communications, Internet of People and Smart City Innovation (SmartWorld/SCALCOM/UIC/ATC/IOP/SCI), Atlanta, GA, USA, 18–21 October 2021; pp. 671–676. [Google Scholar] [CrossRef]
  5. Baek, J.W.; Park, J.-T.; Seo, D.-I. End-to-end Internet/intranet service management in multi-domain environment using SLA concept. In Proceedings of the NOMS 2000. 2000 IEEE/IFIP Network Operations and Management Symposium ’The Networked Planet: Management Beyond 2000’ (Cat. No.00CB37074), Honolulu, HI, USA, 10–14 April 2000; pp. 989–990. [Google Scholar] [CrossRef]
  6. Bagchi, A.; Caruso, F.; Mayer, A.; Roman, R.; Kumar, P.; Kowtha, S. Framework to achieve multi-domain service management. In Proceedings of the 2009 IFIP/IEEE International Symposium on Integrated Network Management, New York, NY, USA, 1–5 June 2009; pp. 287–290. [Google Scholar] [CrossRef]
  7. Alzubaidi, A.; Solaiman, E.; Patel, P.; Mitra, K. Blockchain-Based SLA Management in the Context of IoT. IT Prof. 2019, 21, 33–40. [Google Scholar] [CrossRef] [Green Version]
  8. Battula, S.K.; Garg, S.; Naha, R.; Amin, M.B.; Kang, B.; Aghasian, E. A blockchain-based framework for automatic SLA management in fog computing environments. J. Supercomput. 2022, 78, 16647–16677. [Google Scholar] [CrossRef]
  9. Sahoo, S.; Bigo, S.; Benzaoui, N. Introducing Best-in-Class Service Level Agreement for Time-Sensitive Edge Computing. In Proceedings of the 2021 European Conference on Optical Communication (ECOC), Bordeaux, France, 13–16 September 2021; pp. 1–4. [Google Scholar] [CrossRef]
  10. Li, X.; Chiasserini, C.F.; Mangues-Bafalluy, J.; Baranda, J.; Landi, G.; Martini, B.; Costa-Perez, X.; Puligheddu, C.; Valcarenghi, L. Automated Service Provisioning and Hierarchical SLA Management in 5G Systems. IEEE Trans. Netw. Serv. Manag. 2021, 18, 4669–4684. [Google Scholar] [CrossRef]
  11. CACI. Acorn Guide. 2014. Available online: https://acorn.caci.co.uk/downloads/Acorn-User-guide.pdf (accessed on 2 July 2022).
Figure 1. Cost of the Current SLA Provisioning Process—Scenario A.
Electronics 12 01231 g001
Figure 2. Cost of the Proposed SLA Provisioning Process—Scenario B.
Electronics 12 01231 g002
Figure 3. Customer Classification Decision Tree.
Electronics 12 01231 g003
Figure 4. Average Latency to Classify Customers Belonging to the Range of Categories.
Electronics 12 01231 g004
Figure 5. Latency to Classify Successful Suburb Customers.
Electronics 12 01231 g005
Figure 6. Latency to Classify Difficult Circumstance Customers.
Electronics 12 01231 g006
Figure 7. Latency to Classify Poorer Pensioner Customers.
Electronics 12 01231 g007
Figure 8. Latency to Classify Struggling Estate Customers.
Electronics 12 01231 g008
Figure 9. Latency Difference when Classifying Customers using Variable Dataset Information.
Electronics 12 01231 g009
Figure 10. Average Latency to Classify Customers with Variable Dataset Information Available.
Electronics 12 01231 g010
Table 1. Questions Asked in the Process of Defining a Customer Service.
QuestionValue RangeRationale for QuestionSupport for Rationale from [11]
1. Do you have a smartphone?Yes
No
This question seeks to examine the extent to which a customer has more sophisticated technology available at their home.Executive Wealth customers are “more likely” to own smartphones and are described as being “high income people”. Mature Money customers are “less likely than average to have a smartphone” and these “older, affluent people have the money and the time to enjoy life.” For Starting Out customers, “New technology including smartphones and tablet computers might be popular.”
2. Are you retired?Yes
No
The volume of resource provision associated with a service is assumed to decline once customers can be characterized as being retired.Executive Wealth customers include “empty nesters and better off retired couples.” Comfortable Communities include “comfortably off pensioners, living in retirement areas around the coast.”
3. Do you have a mortgage?Yes
No
The fact of a customer having a mortgage can be used to influence understanding around a customer’s disposable income on the basis that those customers with a mortgage are more likely to have less disposable income than customers without.A number of customers may be continuing to “be repaying a mortgage”; however, many may also own a second home. Many Mature Money customers will not have a mortgage. The majority of Comfortable Senior customers “will have paid off their mortgage.”
4. Do you have debt?Yes
No
With a similar rationale to the consideration for customers with a mortgage (question 3), customers with debt are more likely to have less disposable income than customers without. While customers with debt may be more inclined to spend than customers without, this is not a trait that we wish to exploit.One in ten customers who belong to the Difficult Circumstances category might have a level of debt greater than their annual income. More than double the average of customers belonging to the Struggling Estates classification will have difficulty with debts
5. Age of your technology?Old
Not Old
With a similar rationale to the consideration for customers with a smartphone (question 1), customers with newer technology are more likely to be more prolific telecommunication service users than those with older technology.Poorer Pensioners are not interested in new technology, and many will have never used the Internet. Mature Money customers own modern technologies, and those with children will own game consoles.
6. Are you a homeowner?Yes
No
Customers who own their own homes are more likely to have higher purchasing power for an online service than those who do not.In Countryside Communities, housing is largely owner-occupied. Successful Suburbs primarily have home-owning families. Steady Neighborhoods include home-owning families.
7. What is your home value?Below Average
Average
Above Average
As the value of a home increases, it is likely that purchasing power and usage of online services will similarly increase.Homes for Steady Neighborhood customers are lower priced and have been occupied for many years.
8. What is your average income?Below Average
Average
Above Average
With a similar rationale as for Question 7, as average income increases, it is likely that purchasing power and usage of online services will similarly increase.For Executive Wealth customers, “Incomes are good,” and they are “high income people”. Mature Money are also “high income households”.
9. Are you living off a pension?Yes
No
When customers are living off a pension, we draw a conclusion that they are likely to have less intensive SLA requirements in comparison to customers who are not.Executive Wealth customers are likely to have personal pensions. Many customers belonging to the Successful Suburbs category will “have pensions through their employer and others will have private pensions”.
10. Do you have savings?Yes
No
With a similar rationale as for Question 9, customers with savings are assumed to have greater resource requirements from their SLA than customers without.Many Executive Wealth customers have “significant levels of savings”. Poorer Pensioners are “unlikely to have much savings”.
11. Are you renting accommodation?Yes
No
Similar to Question 9, customers renting their accommodation are assumed to have fewer resource requirements from their SLA than customers who own their homes.Two-thirds of customers from Struggling Estates rent accommodation from the council.
Table 2. Scoring per Customer Classification.
Customer ClassificationIncomeEducationTechnologyInternetEmploymentHouse TypeAverage Tech. AgeTotal
Mature Money553215425
Steady Neighborhoods342233320
Comfortable Seniors321202515
Countryside Communities233344524
Difficult Circumstances01111037
Struggling Estate112222313
Poorer Pensioners111111511
Successful Suburbs443344325
Executive Wealth555555434
Starting Out445543328
Table 3. Mapping between Attributes used to Score Customer Categories.
Attributes Used to Score a Customer CategoryAttributes Used to Query a Customer about Their Service Needs
Incomeaverage income, debt, savings, pension
Educationaverage income, savings
Technologysmartphone, technology age
Internetsmartphone, technology age
Employmentaverage income
House Typehomeowner, home value, renting
Average Technology Agetechnology age
Table 4. Synthetic Data Capturing Potential Customer Responses to Questions Asked for the Purpose of Determining Online Service Needs.
Customer IDSmartphoneRetiredMortgageDebtTechnology AgeHomeownerHome ValueAverage IncomeLiving off PensionSavingsRenting
1noyesnoyesnotoldyesbelowaverageaveragenonono
2nonoyesyesoldyesbelowaveragebelowaverageyesyesno
3yesnoyesyesnotoldyesaboveaveragebelowaverageyesyesno
4yesyesnonooldnoaverageaboveaveragenoyesno
5yesnoyesnonotoldyesaverageaverageyesnoyes
6yesnoyesnonotoldnobelowaverageaboveaveragenonoyes
7yesyesnononotoldyesaveragebelowaverageyesyesno
8nononoyesoldnoaverageaverageyesyesno
9noyesyesyesoldnoaveragebelowaveragenoyesyes
10nonoyesnooldyesaverageaboveaverageyesnono
11yesnoyesyesoldnoaveragebelowaveragenonono
12yesyesnoyesoldyesaboveaveragebelowaveragenonoyes
13nononononotoldnoaboveaverageaveragenoyesno
14yesnoyesyesnotoldyesbelowaverageaboveaveragenonoyes
15yesnoyesyesnotoldyesaverageaboveaveragenoyesno
16yesyesyesnonotoldnobelowaverageaverageyesnono
17yesyesyesnooldnoaboveaverageaverageyesnono
18yesyesyesnonotoldyesbelowaverageaveragenoyesno
19yesnonononotoldnobelowaverageaveragenoyesyes
20yesnoyesyesnotoldyesaboveaverageaverageyesnoyes
21yesyesnoyesoldyesaboveaverageaveragenonoyes
22noyesyesnonotoldnoaverageaboveaverageyesnoyes
23yesyesnononotoldyesbelowaverageaboveaverageyesyesyes
Table 5. Classifications used to Characterise SLA Customers.
Customer Classification [11]Classification Description [11]
Countryside CommunitiesAreas of low population densities in farming areas. Agricultural employment, in addition to skilled occupations and professional people. An older demographic than the average. Sub-categories include:
  • Farms and cottages;
  • Larger families in rural areas;
  • Owner-occupiers in small towns and villages.
Difficult CircumstancesStreets with a high proportion of youth. Many single parents. Accommodation is mainly rented flats. Deprived neighborhoods. Sub-categories include:
  • Social rented flats, families and single parents;
  • Singles and young families, some receiving benefits;
  • Deprived areas and high-rise flats.
Executive WealthWealthy families in large detached or semi-detached properties in family areas. Some empty nesters and retired couples. Incomes are good. Sub-categories include:
  • Asset-rich families;
  • Wealthy countryside commuters;
  • Financially comfortable families;
  • Affluent professionals;
  • Prosperous suburban families;
  • Well-off edge of towners.
Mature MoneyOlder empty nesters and retired couples. Live in detached or semi-detached properties. Many have two cars. High-income households. Sub-categories include:
  • Better-off villagers;
  • Settled suburbia, older people;
  • Retired and empty nesters;
  • Upmarket downsizers.
Starting OutYounger couples in their first home. Early career professionals. Incomes above average. Spend more time online than average. Sub-categories include:
  • Educated families in terraces, young children;
  • Smaller houses and starter homes.
Steady NeighborhoodMiddle-aged home-owning families living in older, lower-priced homes. Some have degrees. Incomes around the national average. Use the Internet but not in an extensive way. Sub-categories include:
  • Suburban semis, conventional attitudes;
  • Owner-occupied terraces, average income;
  • Established suburbs, older families.
Struggling EstateLow-income families. Majority rent their homes from council. High proportion of children and single-parent households. Low incomes with a high proportion claiming benefits. Sub-categories include:
  • Poorer families, many children, terraced housing;
  • Low-income terraces;
  • Multi-ethnic, purpose-built estates;
  • Deprived and ethnically diverse in flats;
  • Low-income large families in social rented semis.
Successful SuburbsHome-owning families living comfortably in homes of average value for the area. Children may be young or include young adults who have not left home. Incomes of at least the national average. Sub-categories include:
  • Comfortably-off families in modern housing;
  • Larger family homes, multi-ethnic areas;
  • Semi-professional families, owner-occupied neighborhoods.
Comfortable SeniorsIn two and three bedroom semi-detached houses and bungalows, typically below the average value for the area. Incomes are modest, with many living off their pension.
Sub-categories include:
  • Older people, neat and tidy neighbourhoods
  • Elderly singles in purpose-built accommodation
Poorer PensionersRent social housing, many without educational qualiications, with higher than the average claiming benefits.
Sub-categories include:
  • Pensioners in social housing, semis and terraces
  • Elderly people in social rented flats
  • Low income older people in smaller semis
  • Pensioners and singles in social rented flats
Table 6. Customer Classifications and Scores.
Customer IDCustomer ClassificationCustomer ScoreLatency to Assign Classification
1DifficultCircumstances70.018334034
2CountrysideCommunities240.010890007
3ExecutiveWealth340.010039806
4MatureMoney250.008650064
5SuccessfulSuburbs250.011470079
6SuccessfulSuburbs250.010050058
7SteadyNeighbourhoods200.009649992
8SteadyNeighbourhoods200.00951004
9SteadyNeighbourhoods200.011419773
10SteadyNeighbourhoods200.011350155
11SuccessfulSuburbs250.010799885
12MatureMoney250.009190083
13MatureMoney250.010370016
14DifficultCircumstances70.010540009
15SuccessfulSuburbs250.009579897
16SteadyNeighbourhoods200.010859966
17PoorerPensioners110.008020163
18MatureMoney250.010799885
19StartingOut280.010460138
20ExecutiveWealth340.010509968
21MatureMoney250.010020018
22SteadyNeighbourhoods200.008859873
23SteadyNeighbourhoods200.011610031
24SteadyNeighbourhoods200.011650085
Table 7. Number of Randomly-Generated Customer Profiles Assigned to each Category.
Customer CategoryNumber of Cases
Difficult Circumstances70
Countryside Communities113
Executive Wealth35
Mature Money278
Successful Suburbs110
Steady Neighbourhoods248
Poorer Pensioners57
Starting Out49
Struggling Estate40
1000
Table 8. Customer Assignment to Categories in the Presence of Missing Data.
Unavailable Attributes
Full DatasetHouse ValueTech AgeIncome
Difficult Circumstances70707070
Countryside Communities113113113113
Executive Wealth35000
Mature Money278103103103
Successful Suburbs110145145145
Steady Neighbourhoods248423423423
Poorer Pensioners57575757
Starting Out49494949
Struggling Estate40404040
Total 1000100010001000
Table 9. Profiles of Customers Assigned to the Executive Wealth Category.
Customer IDSmartphoneRetiredMortgageDebtTechnology AgeHomeownerHome ValueAverage IncomeLiving off PensionSavingsRenting
3yesnoyesyesnotoldyesaboveaveragebelowaverageyesyesno
20yesnoyesyesnotoldyesaboveaverageaverageyesnoyes
45yesnonoyesnotoldyesaboveaveragebelowaveragenoyesno
70yesnonononotoldyesaboveaverageaboveaverageyesyesno
Table 10. Profiles of Customers Assigned to the Mature Money Category.
Customer IDSmartphoneRetiredMortgageDebtTechnology AgeHomeownerHome ValueAverage IncomeLiving off PensionSavingsRenting
31noyesnonooldnoaboveaverageaverageyesnoyes
32yesyesnonooldnobelowaveragebelowaveragenonoyes
Table 11. Category Assignment Differences when Dataset Availability Changes.
Customer IDClassification with Full Datasetex House Valueex Tech Ageex Income
31Mature MoneySteady NeighbourhoodsMature MoneyMature Money
32Mature MoneyMature MoneyMature MoneyMature Money
Disclaimer/Publisher’s Note: The statements, opinions and data contained in all publications are solely those of the individual author(s) and contributor(s) and not of MDPI and/or the editor(s). MDPI and/or the editor(s) disclaim responsibility for any injury to people or property resulting from any ideas, methods, instructions or products referred to in the content.