
XTM: A Novel Transformer and LSTM-Based Model for Detection and Localization of Formally Verified FDI Attack in Smart Grid

 , , , and
Abstract
:1. Introduction
- We have introduced a novel data-driven Transformer and LSTM-based model named XTM to detect and localize FDI attacks in the smart grid. XTM is the first model that utilizes the Transformer algorithm in this particular research field.
- The proposed XTM algorithm is able to forecast sensor measurements in real time due to its independent nature of system parameters. So, it can be used as a tool to mitigate FDI attack in case of an intrusion in the power grid.
- Comparative analysis of four distinct deep learning models along with our proposed XTM is studied to determine the best multi-label classifier to detect the exact location of FDI attack. All of the tests were conducted using the IEEE 14 bus test system, where our proposed model outperforms others.
- We have discussed the data set and attack vector in detail, which is missing in most of the research works. We have used three different types of data sets: one benign hourly basis, one benign minute basis and one is attack vector data set. The hourly dataset used in this project was adopted from Shahriar et al.’s work [17] and the attack vector was taken from [18]. Then based on this, we have made our dataset which is minute based. The proposed model is intensively tested on both of these data sets, where it shows better performance than the other methodologies. The attack vector, hourly and minutely datasets are made publicly available in the Github repository (https://github.com/gcsarker/XTM, accessed on 16 December 2022).
2. Related Works
3. Preliminaries
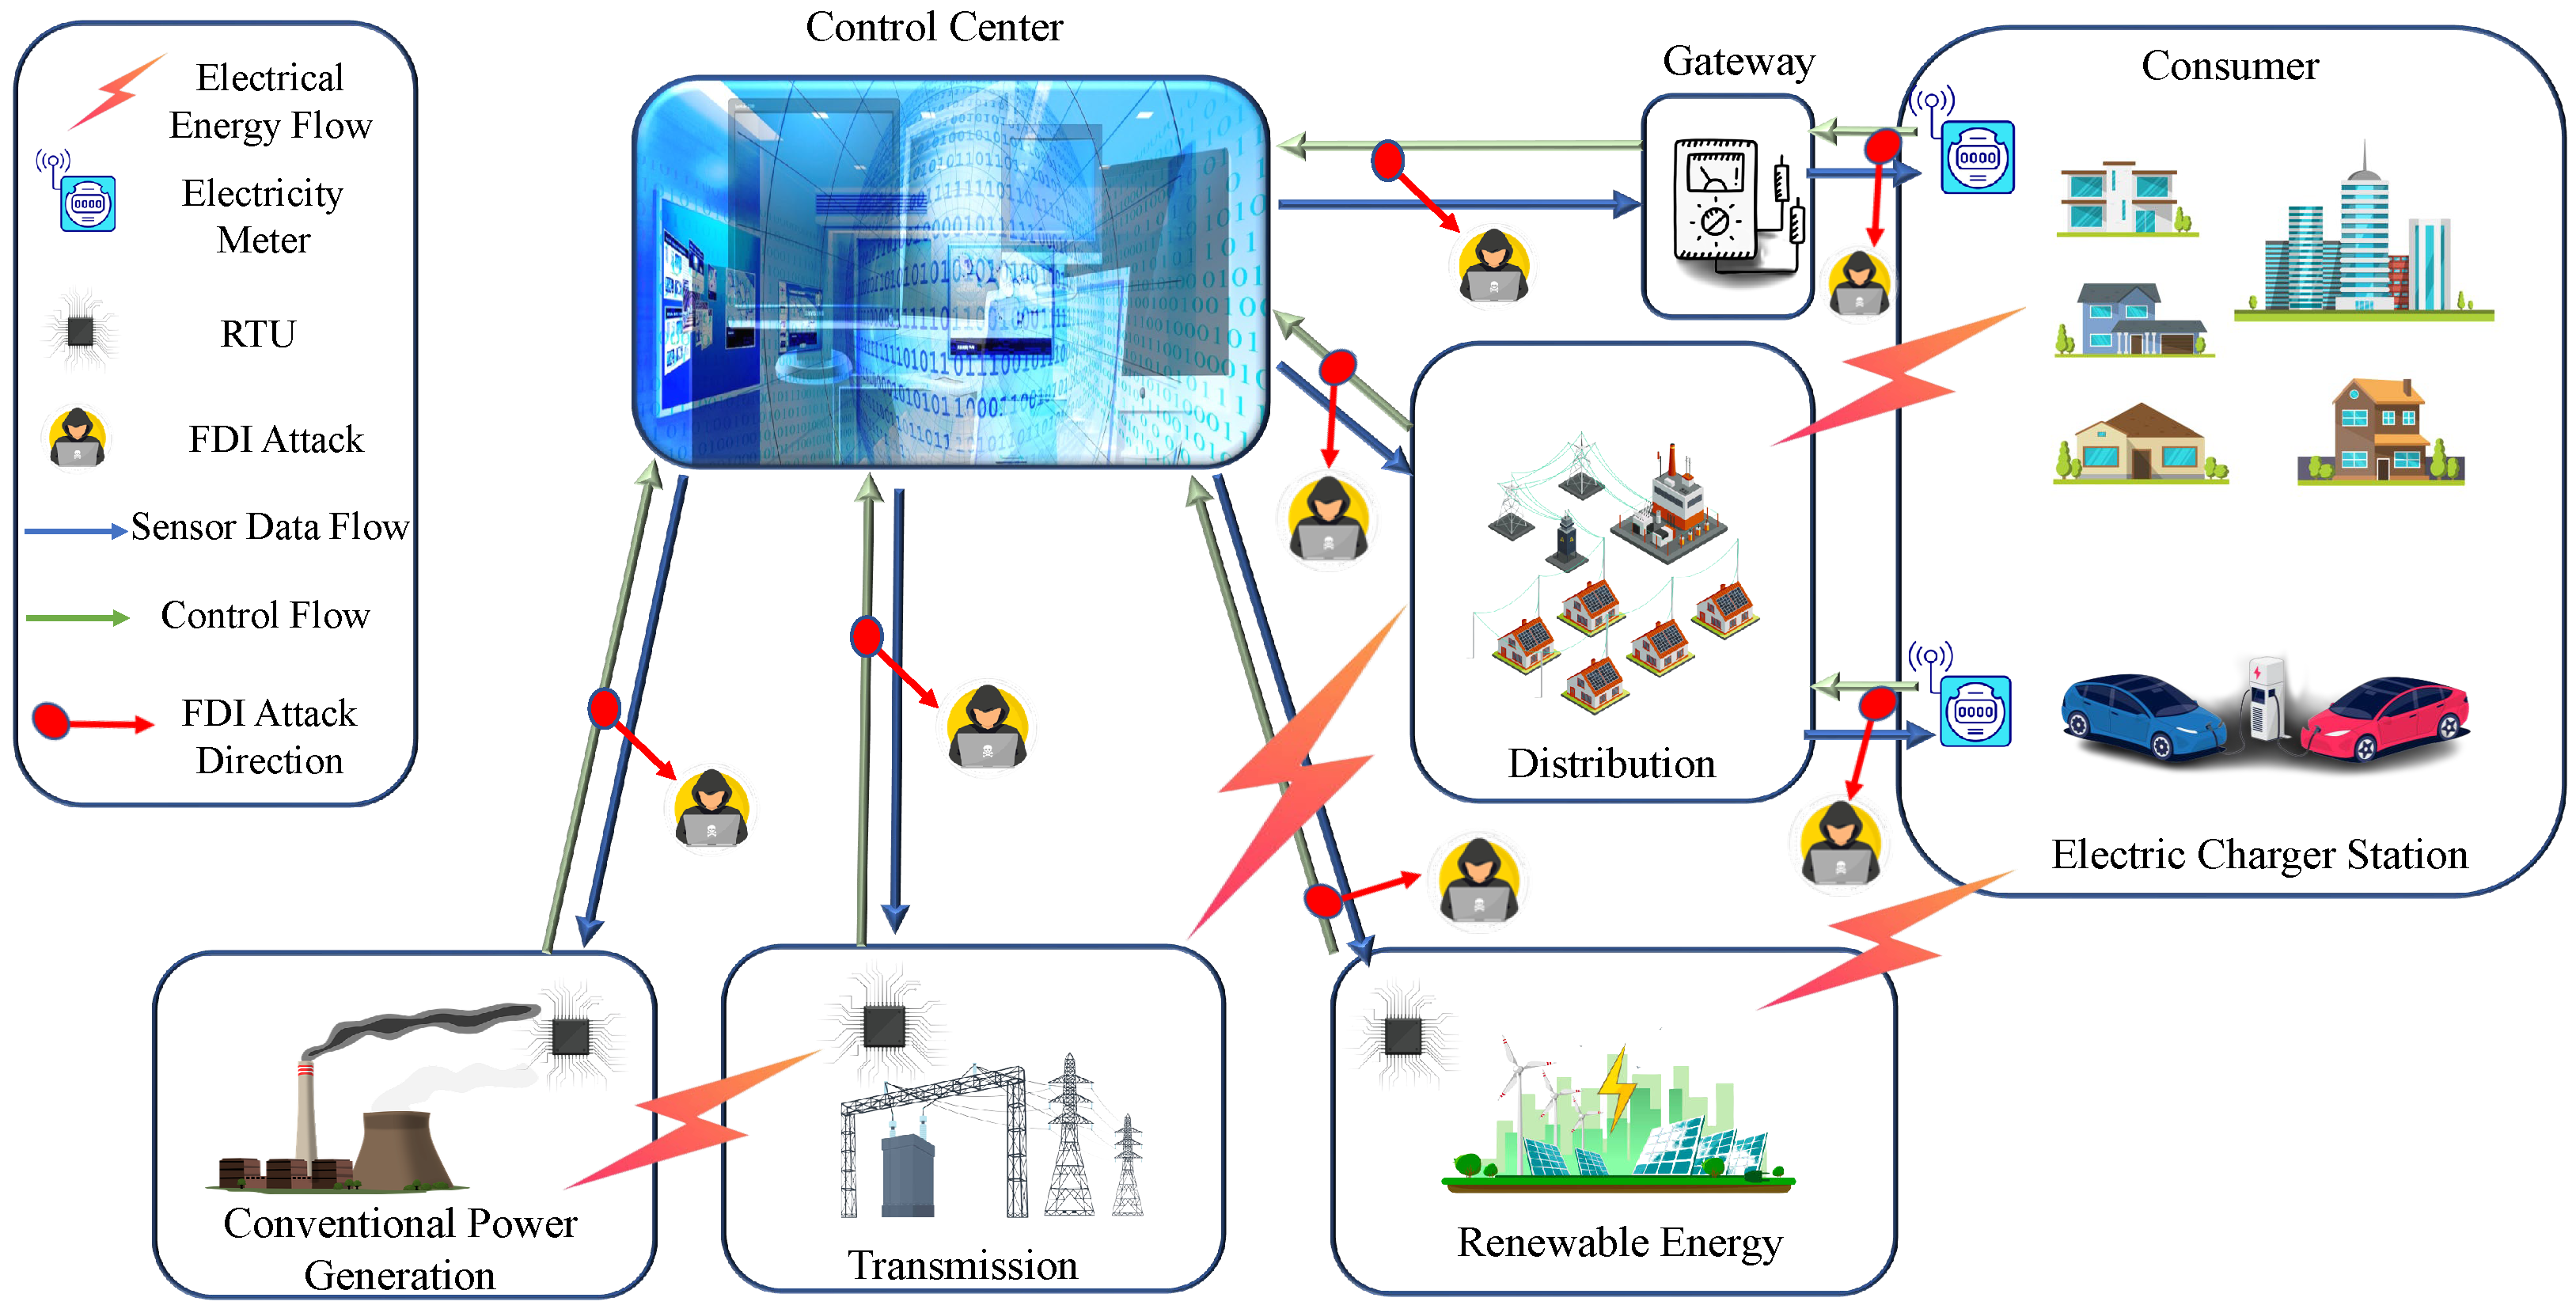
3.1. Power System Model
3.2. FDI Attack
3.3. CNN
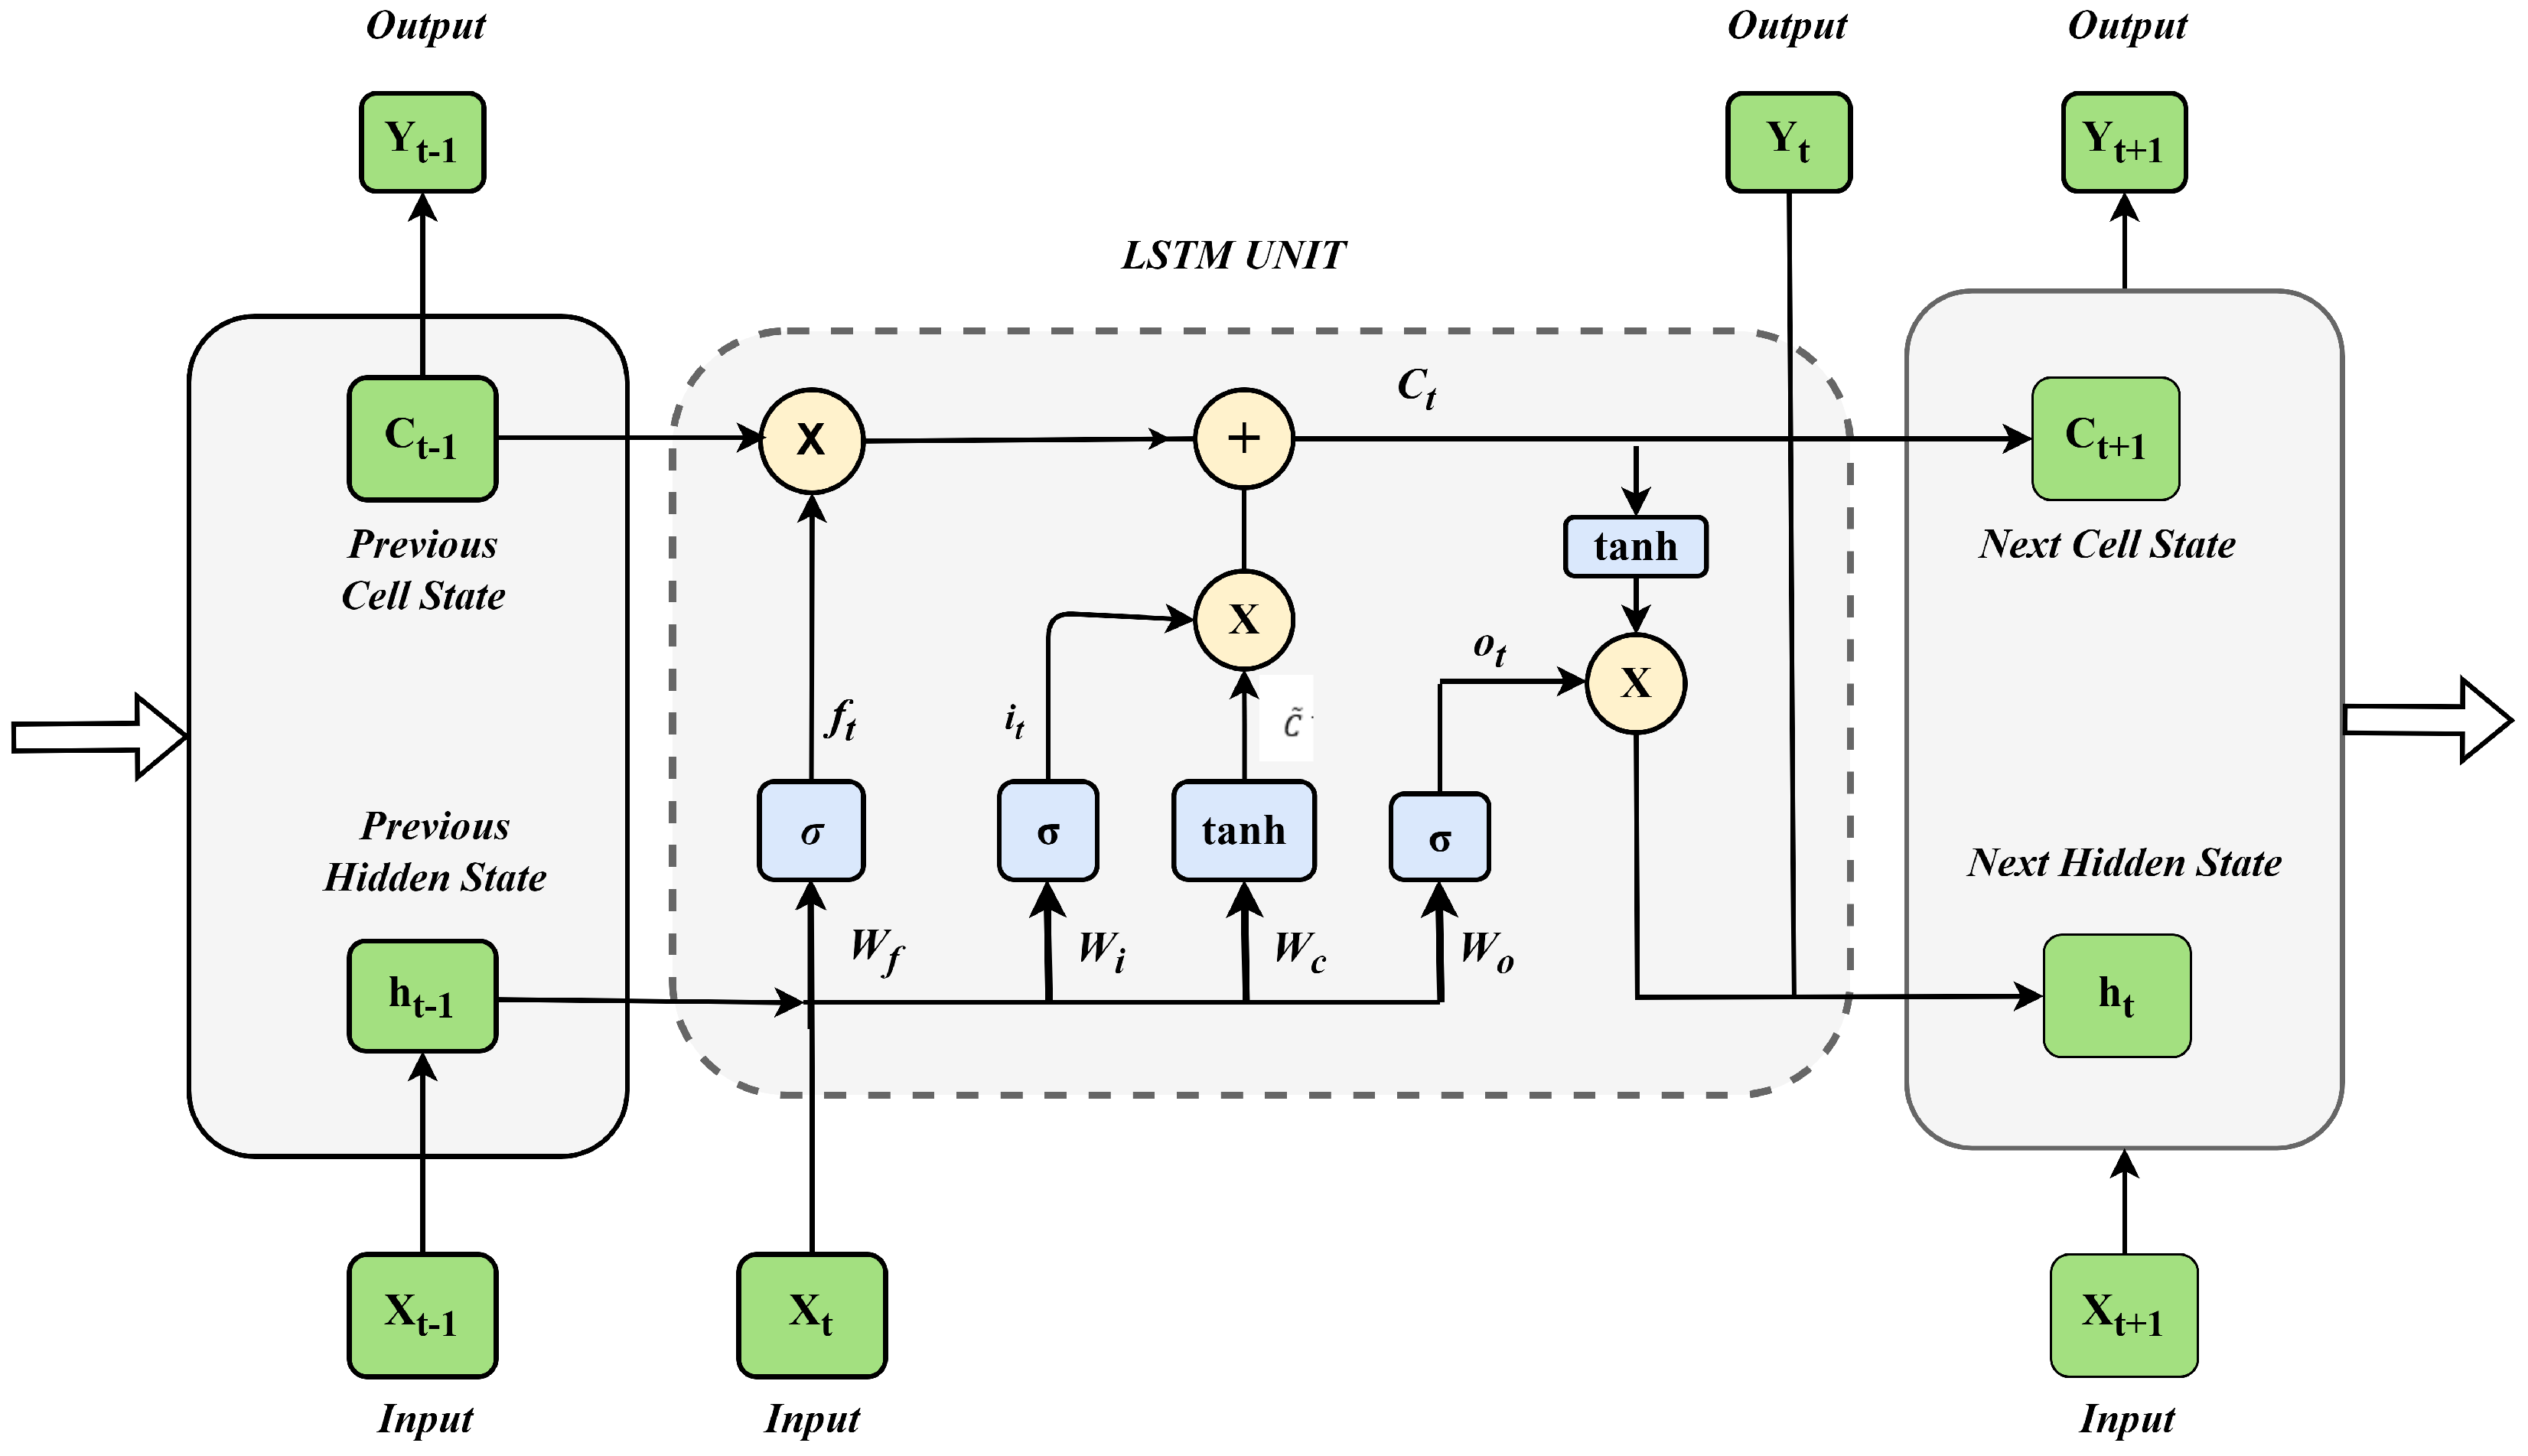
3.4. LSTM
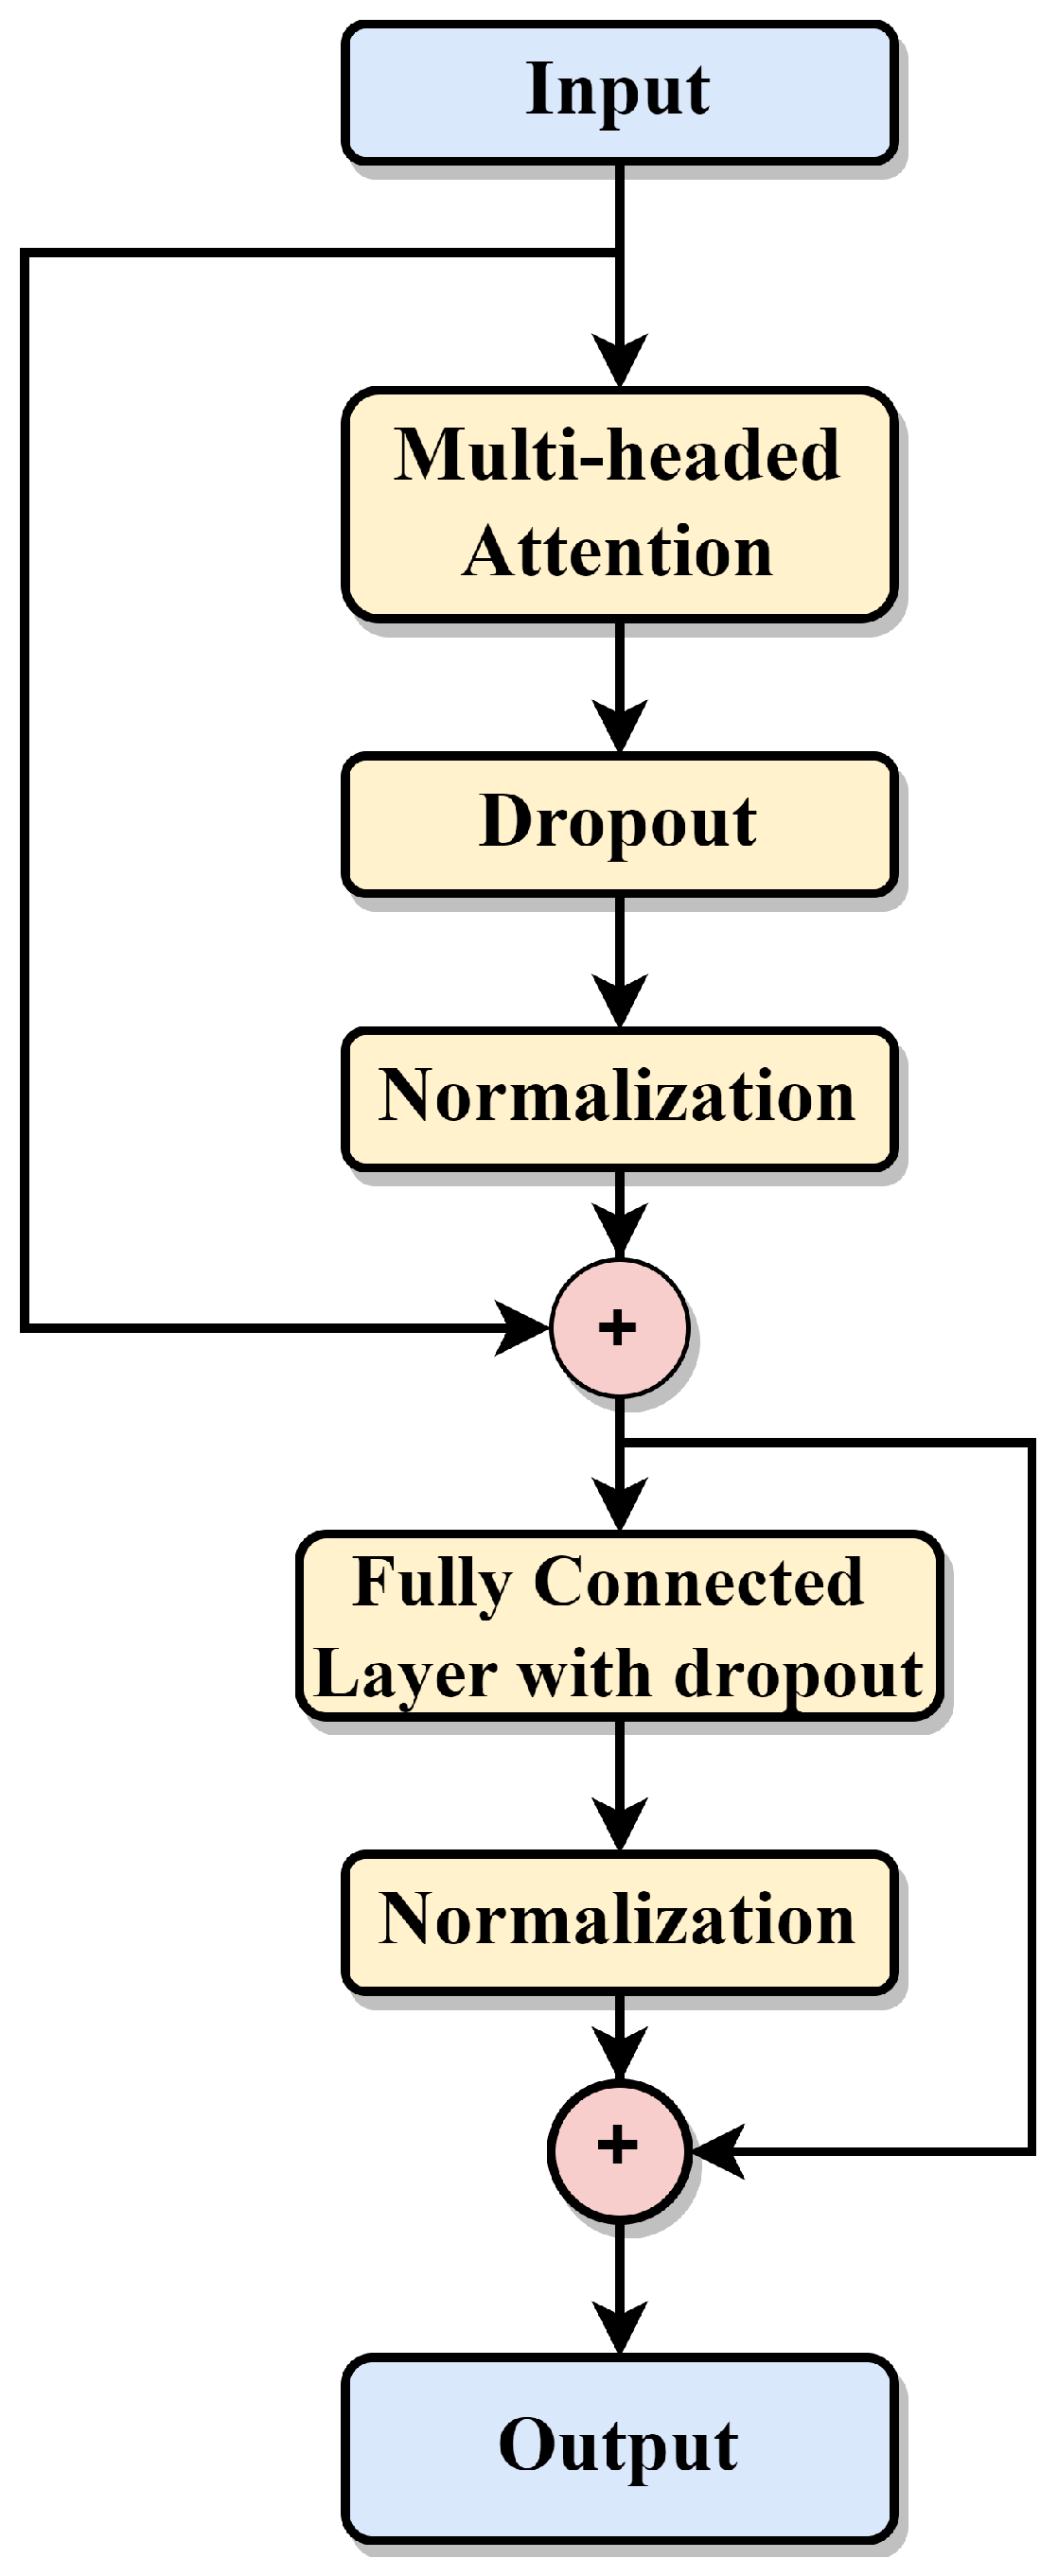
3.5. Transformer
4. Technical Details
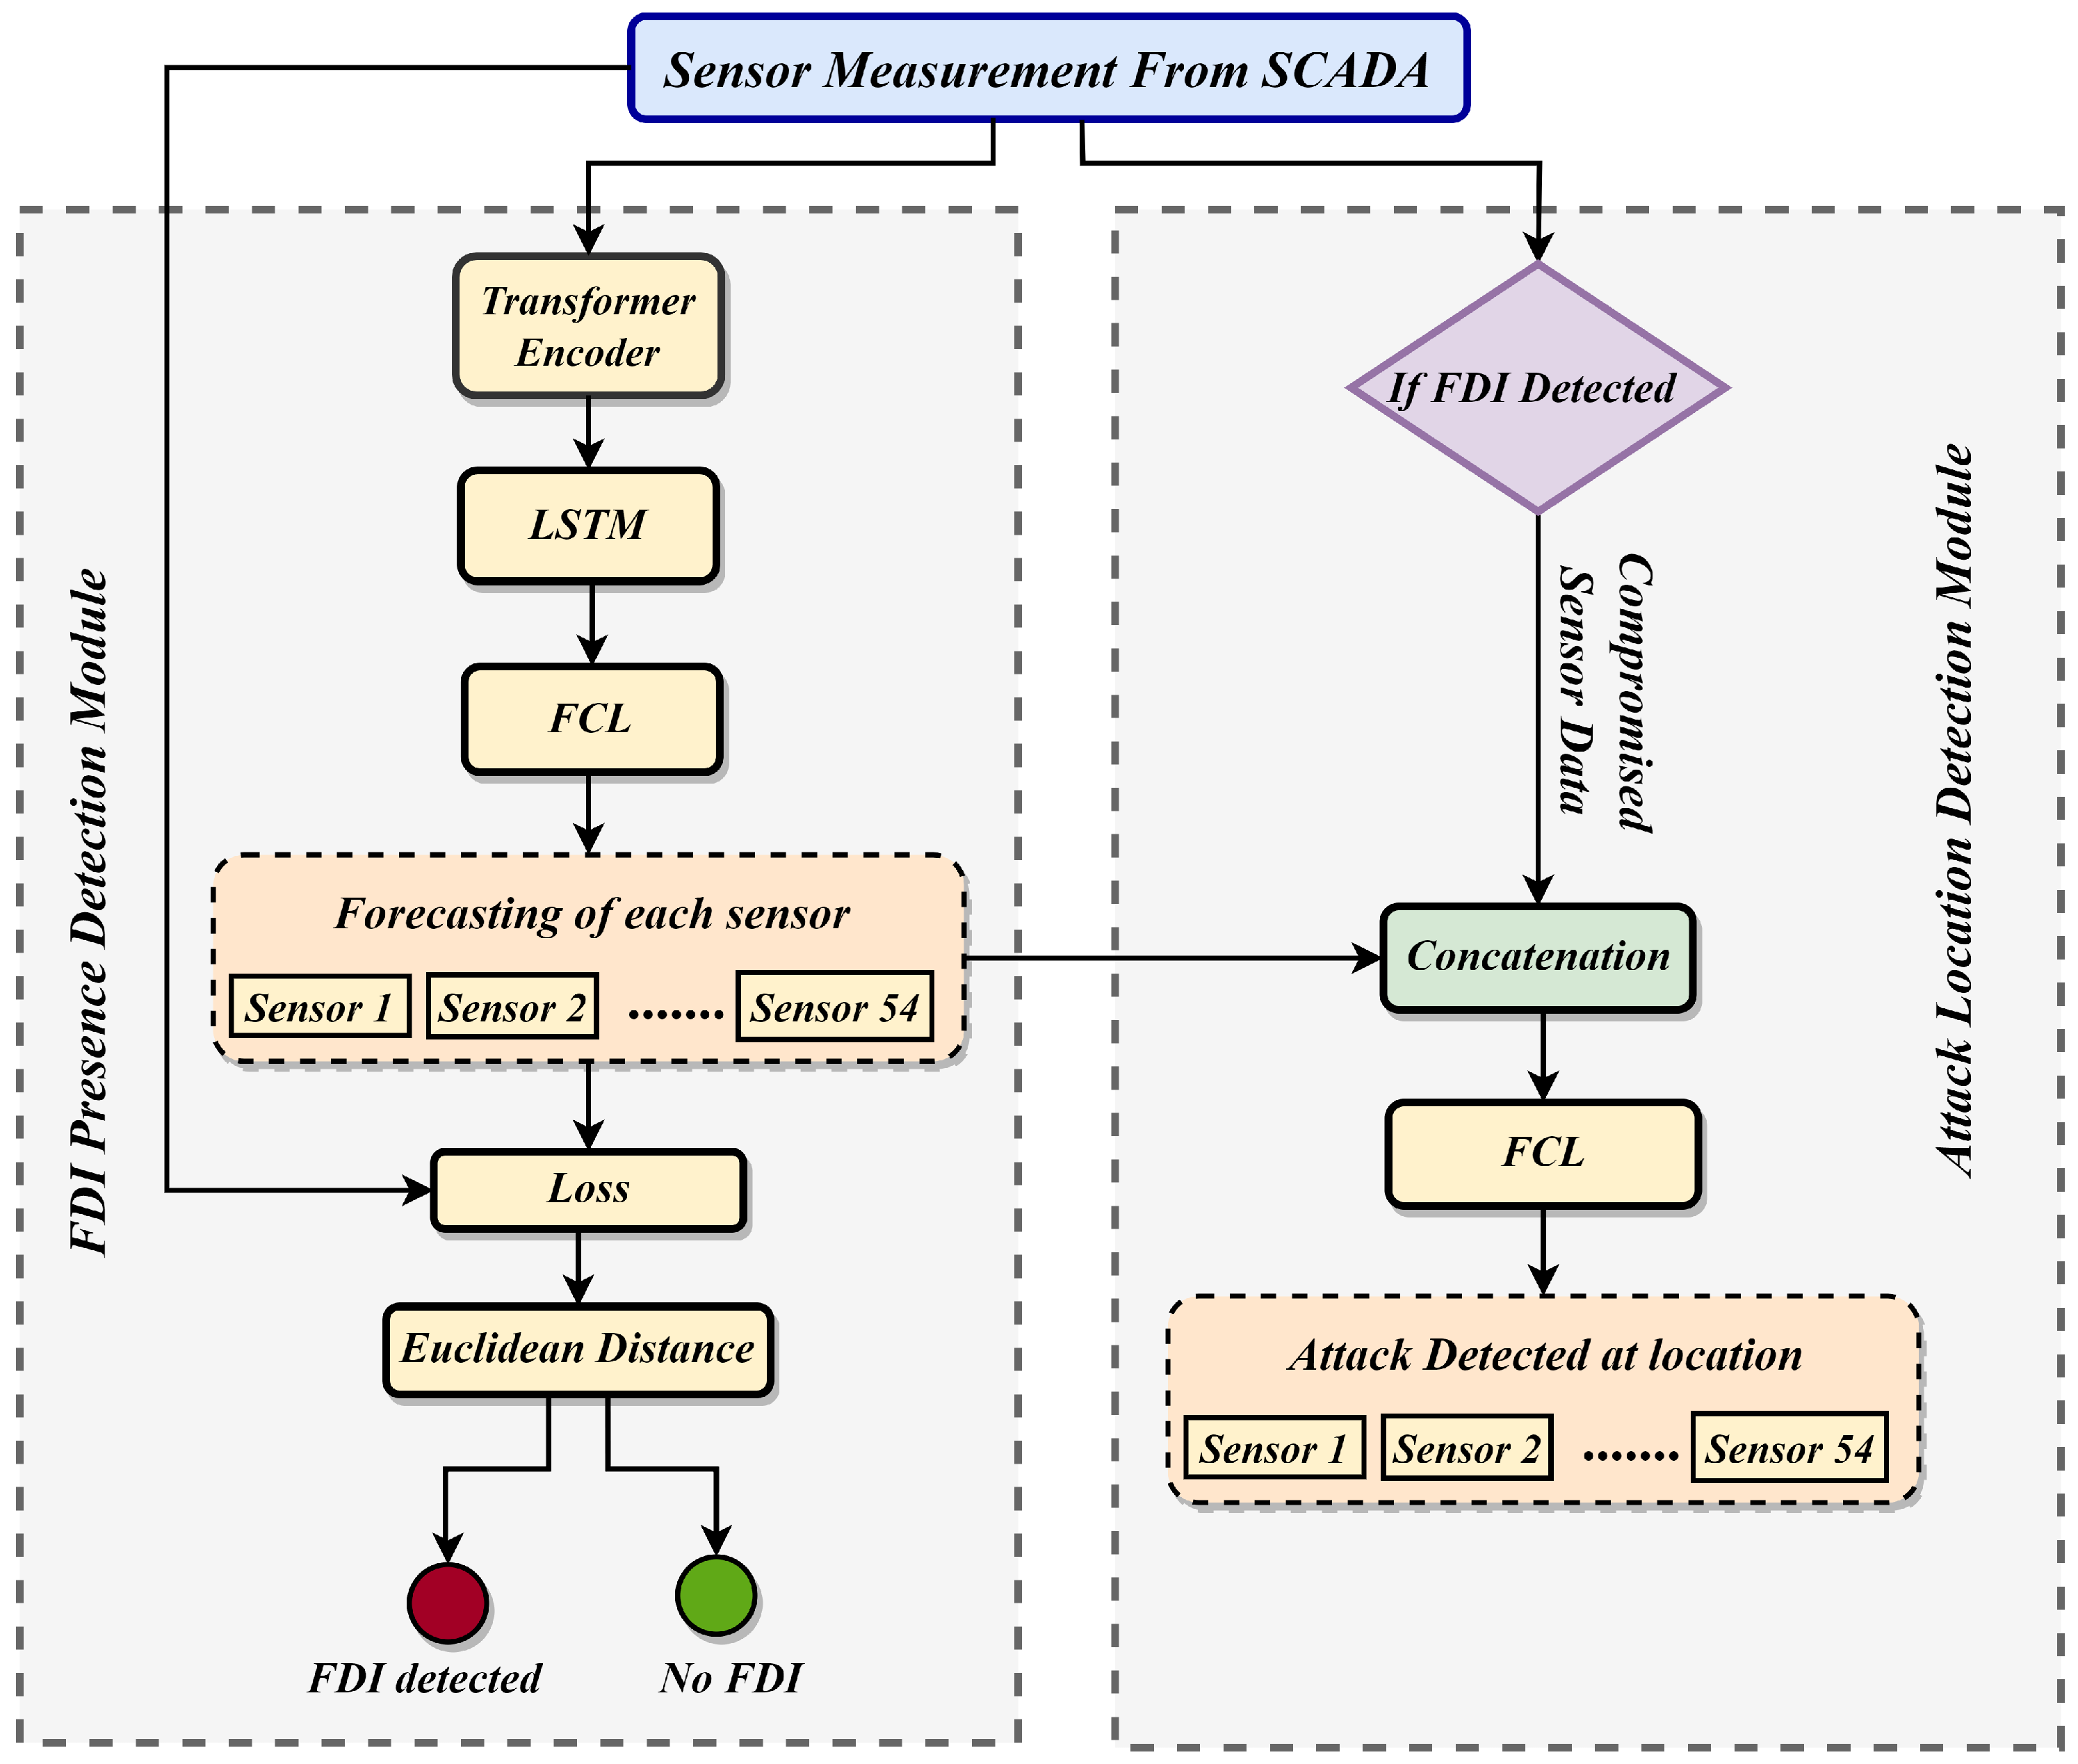
4.1. Formal Module
- Is the measurement taken or recorded?
- Is the measurement secured?
- Does the attacker have the accessibility to manipulate the measurement?
- Both the forward line and backward line power flows on each transmission line be equally compromised.
- The net power of a bus should be zero.
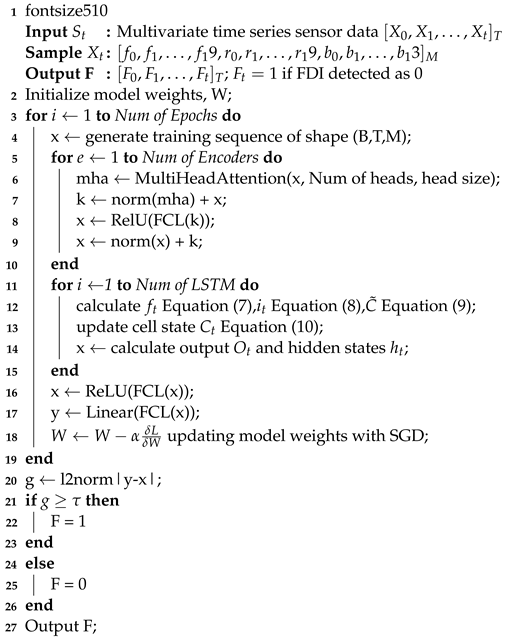
4.2. FDI Presence Detection Module (FPDM)
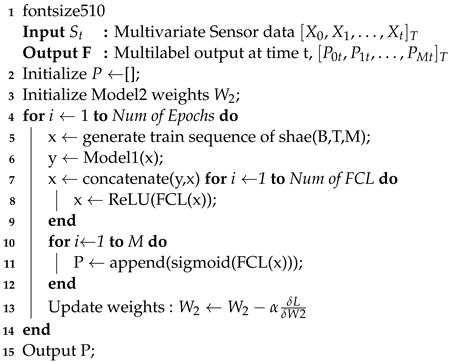
4.3. Location Detection Module (LDM)
5. Evaluation Setup
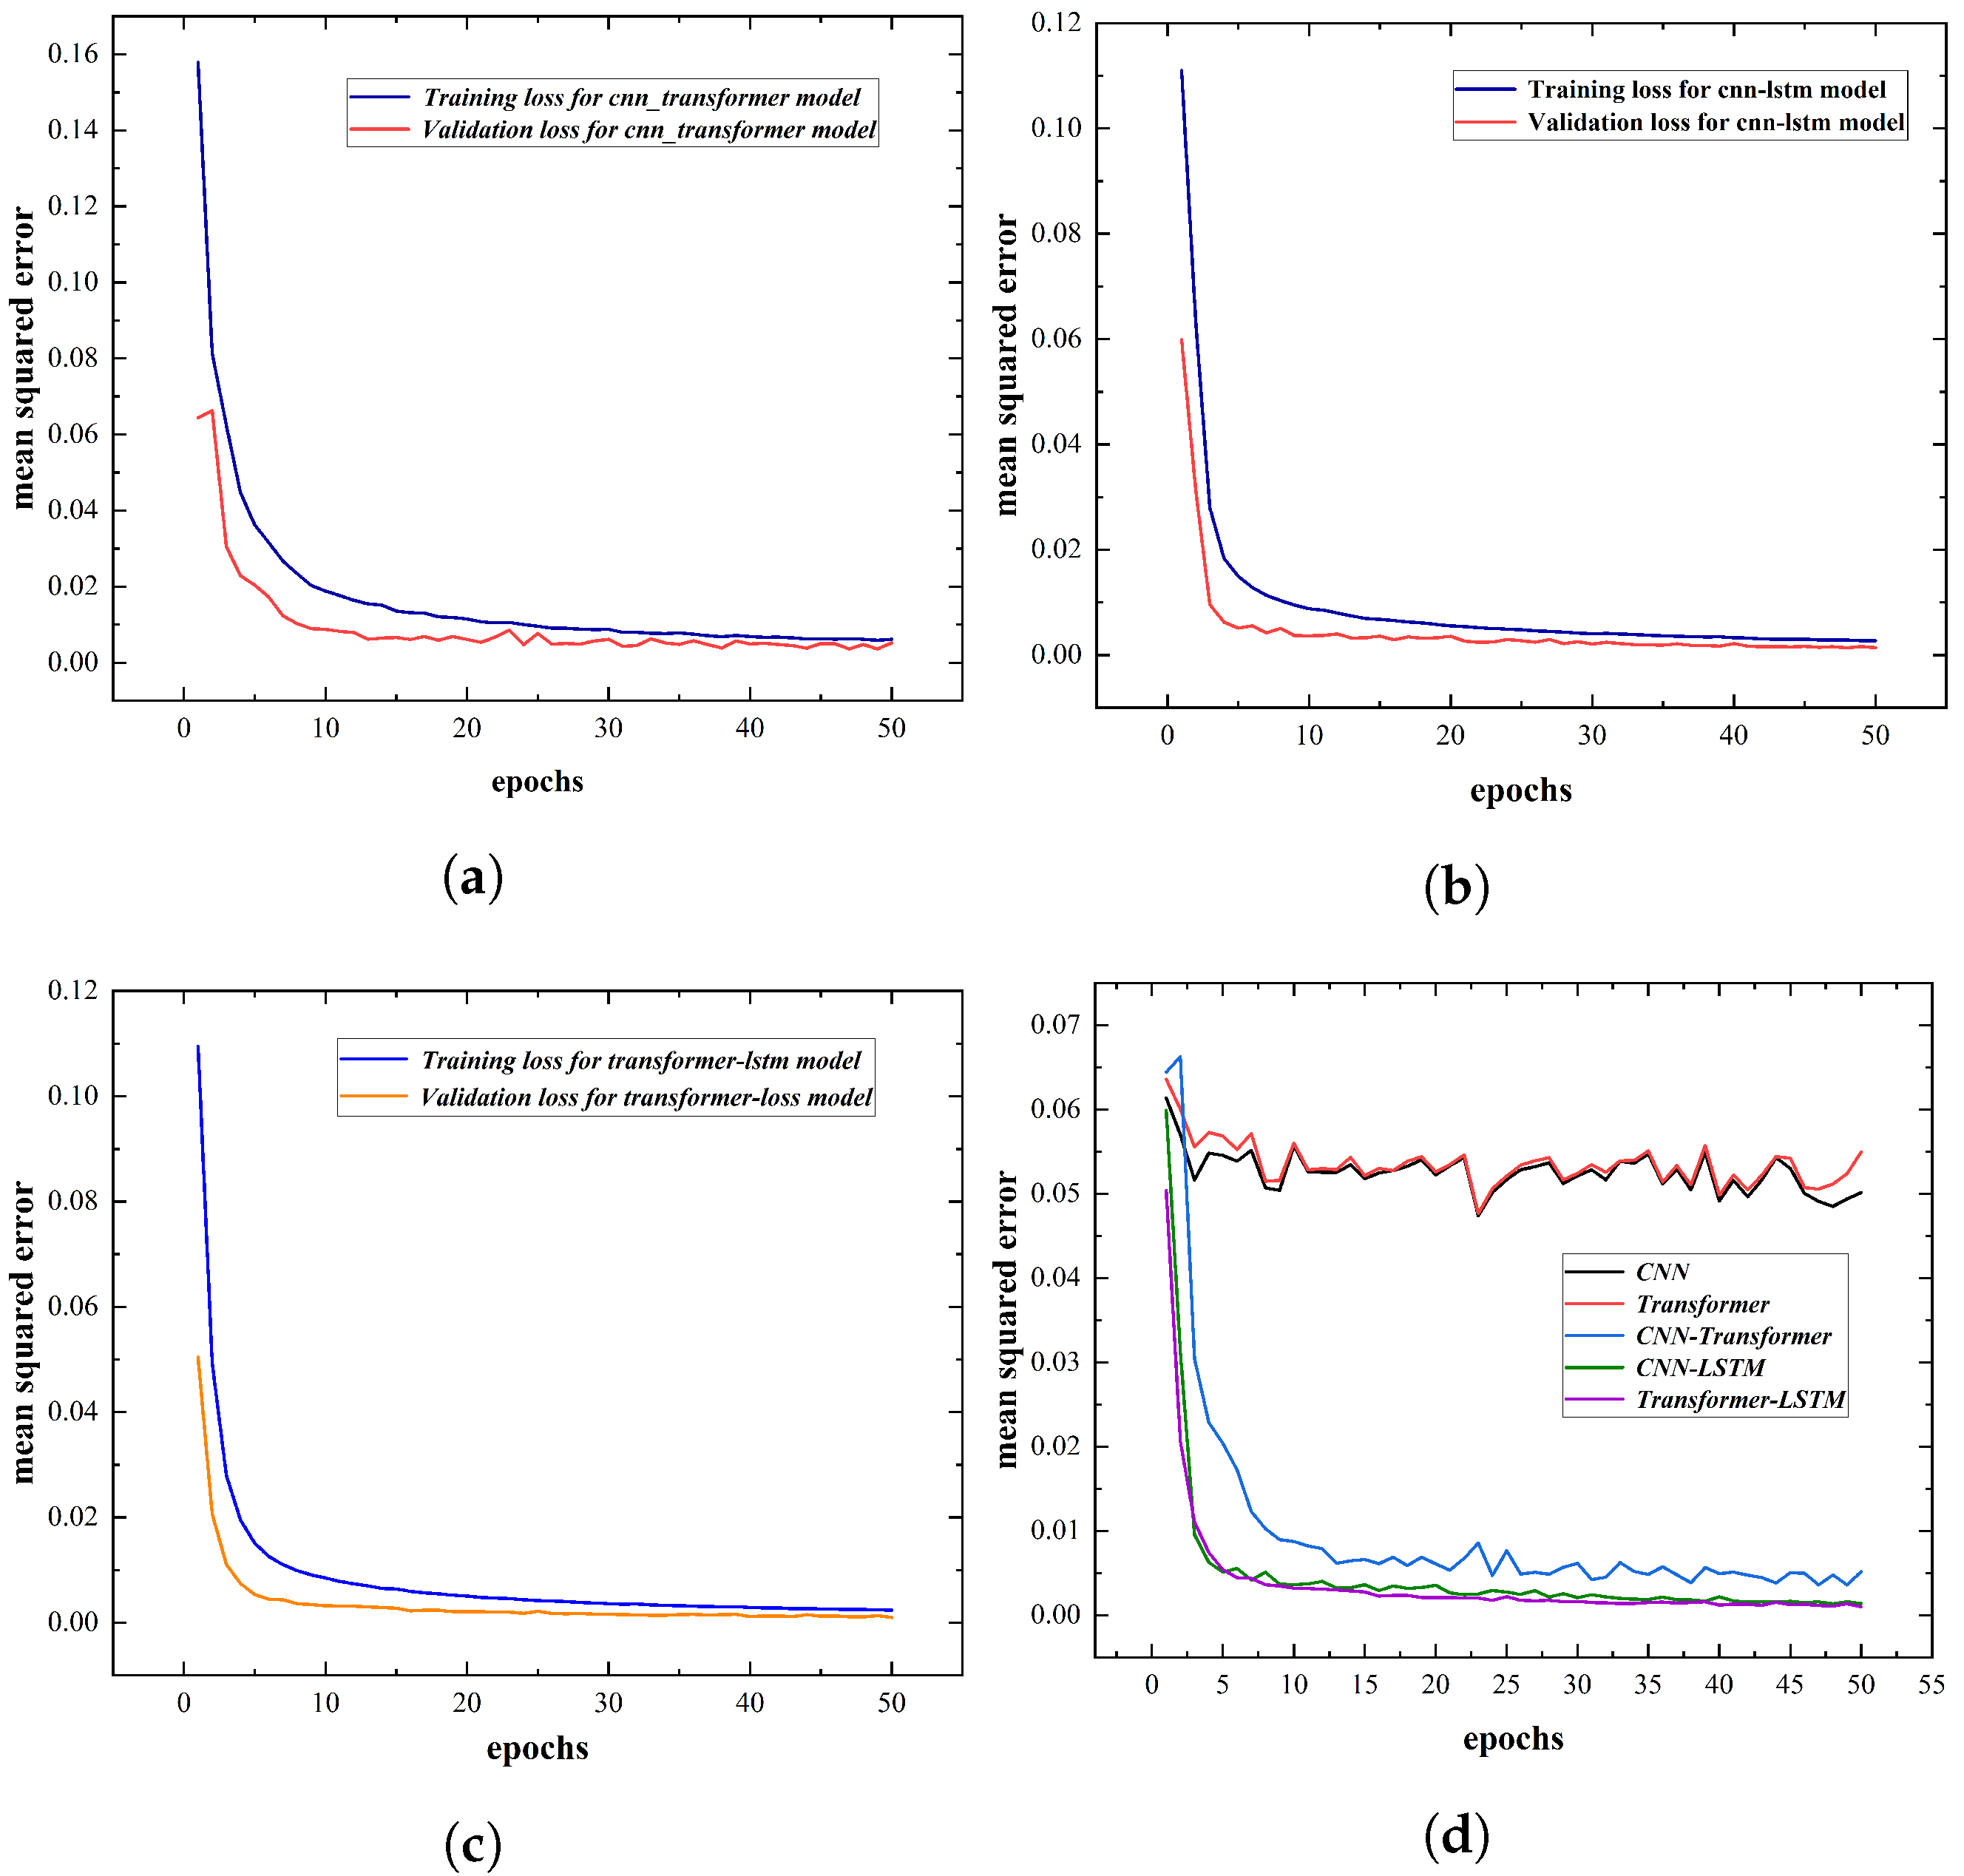
5.1. Model Training
| Algorithm 1: FDIA presence detection algorithm |
 |
| Algorithm 2: location detection module algorithm |
 |
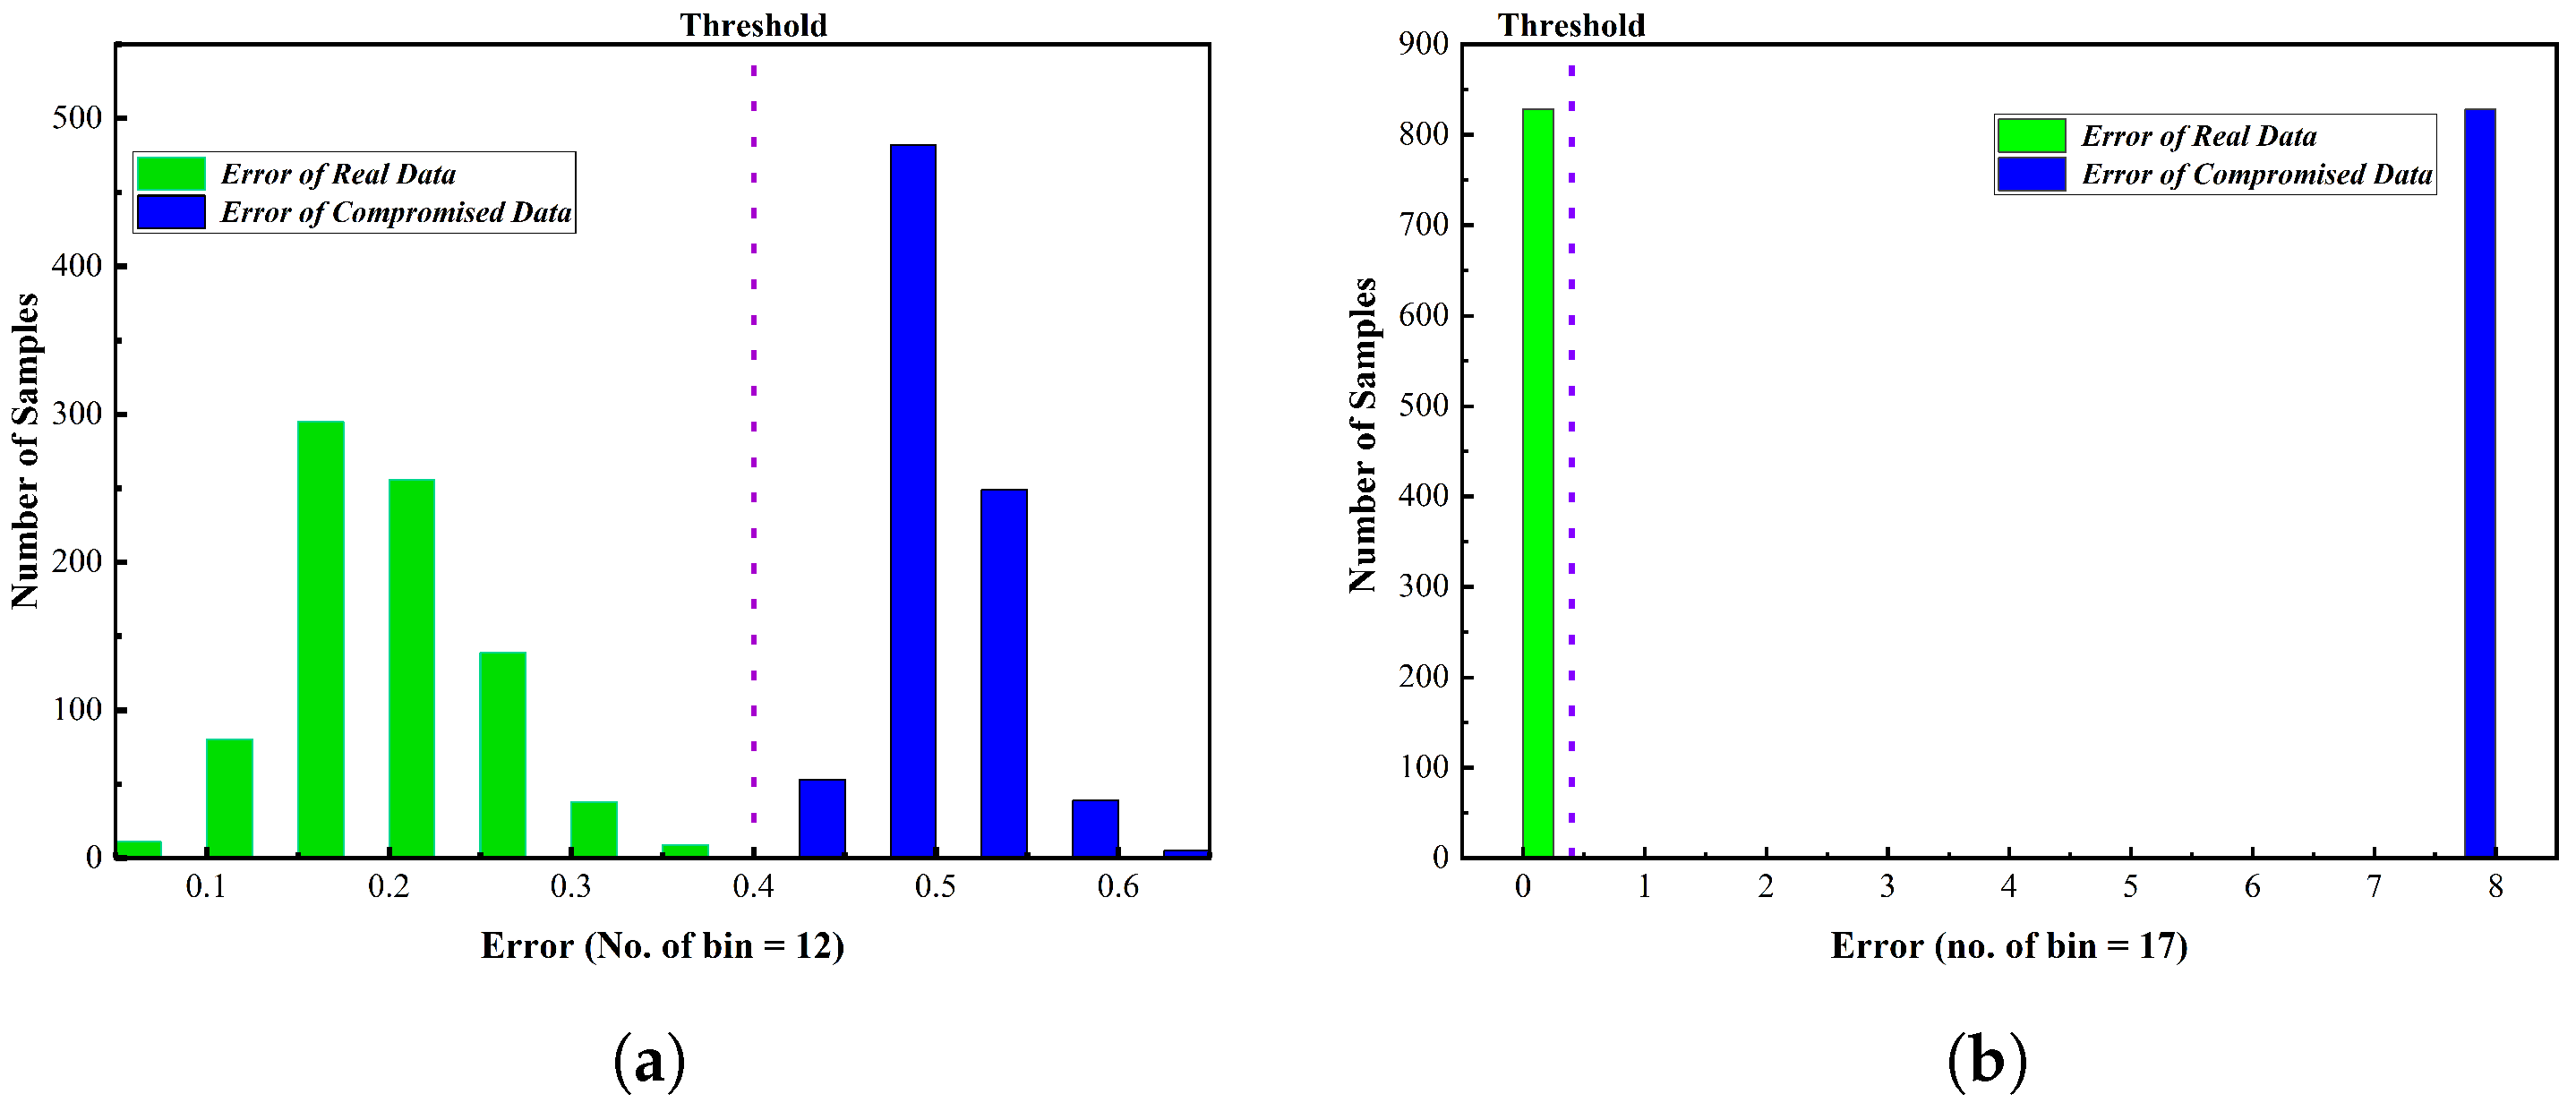
5.2. Threshold Selection
- error 1 = predicted data - real sensor data
- error 2 = predicted data - compromised sensor data
5.3. Minibatch and Cross-Validation
5.4. Loss Function
6. Experiments and Results
6.1. Dataset
6.2. Performance Evaluation Metrics
- TP: Number of all correctly predicted compromised instances.
- FP: Number of incorrect predictions of uncompromised instances.
- TN: number of correctly predicted uncompromised instances.
- FN: number of incorrectly predicted compromised instances.
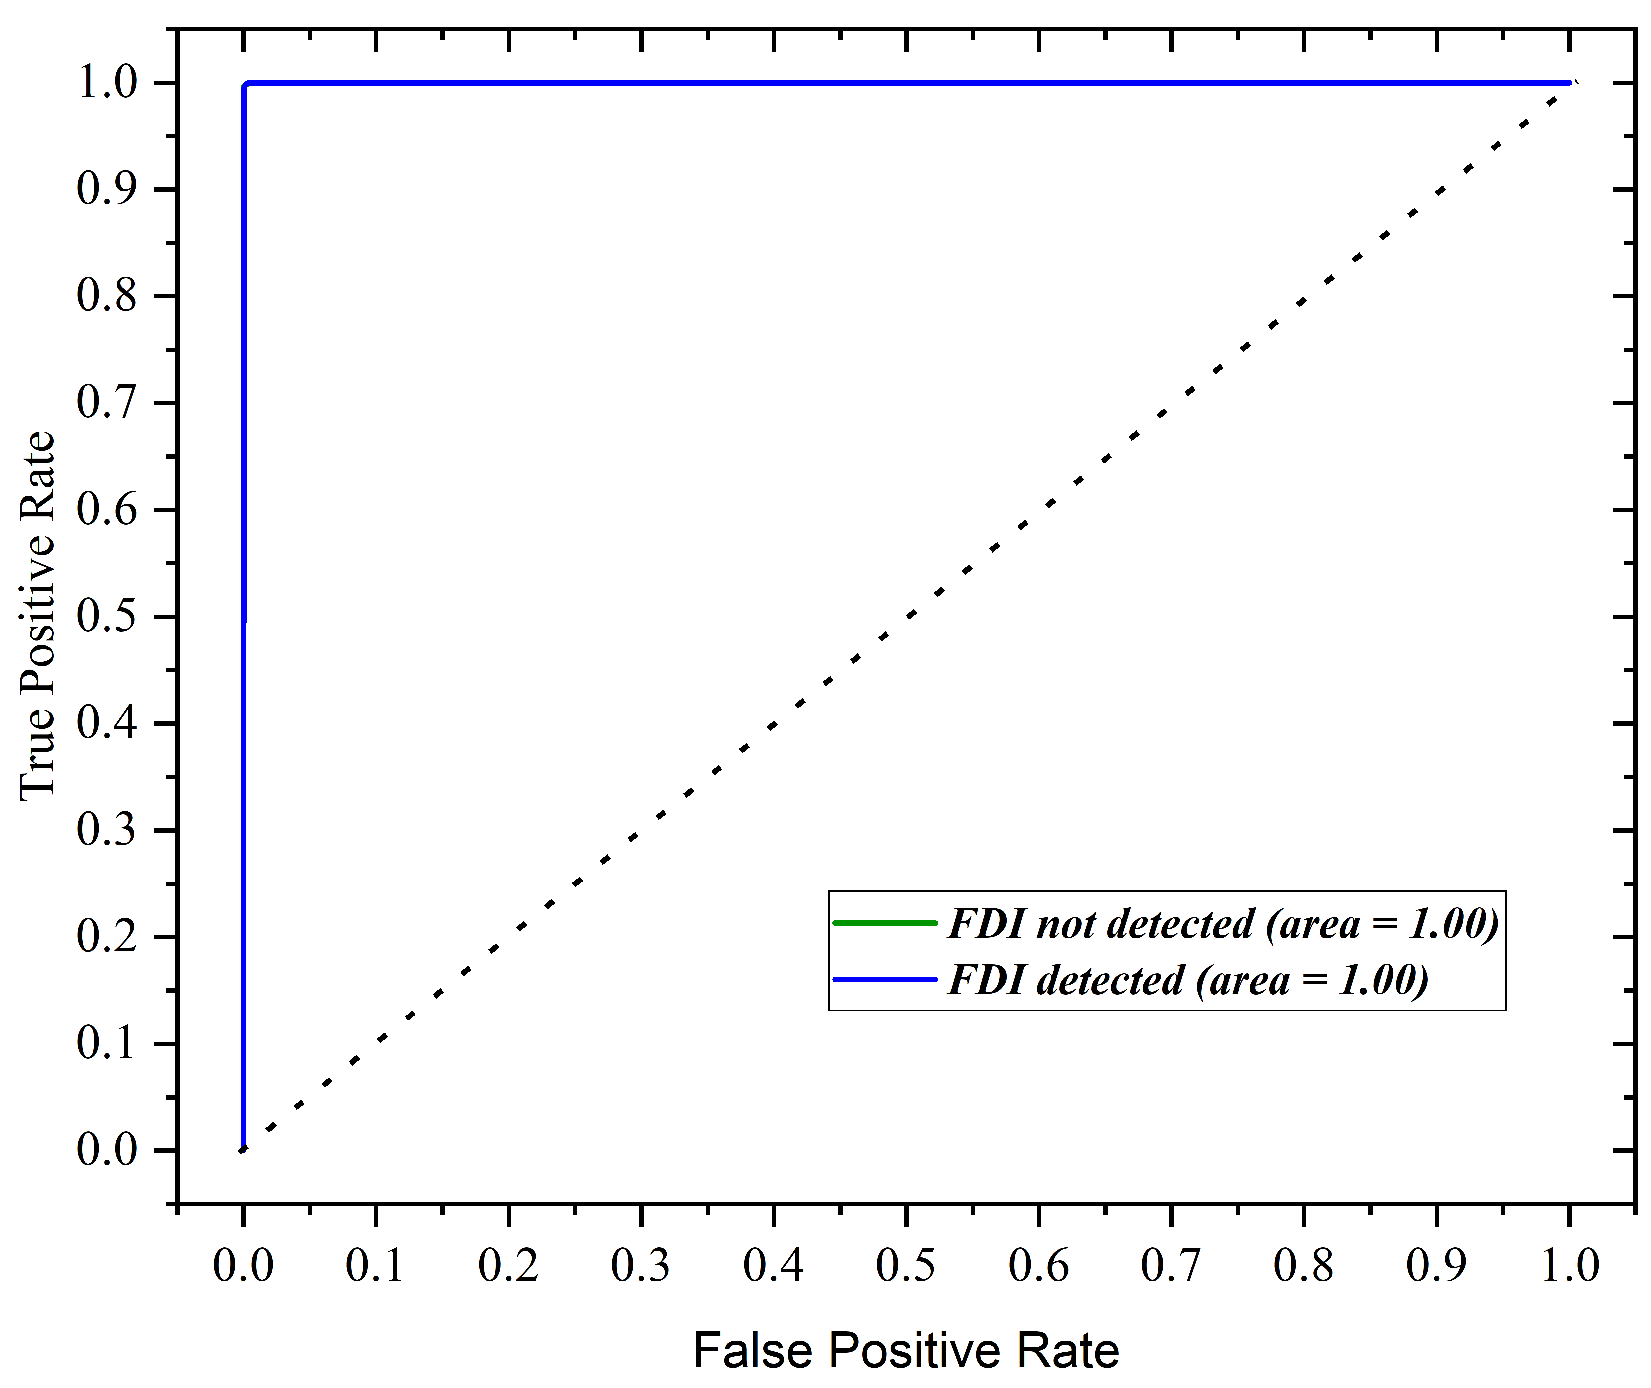
6.3. FPDM Accuracy
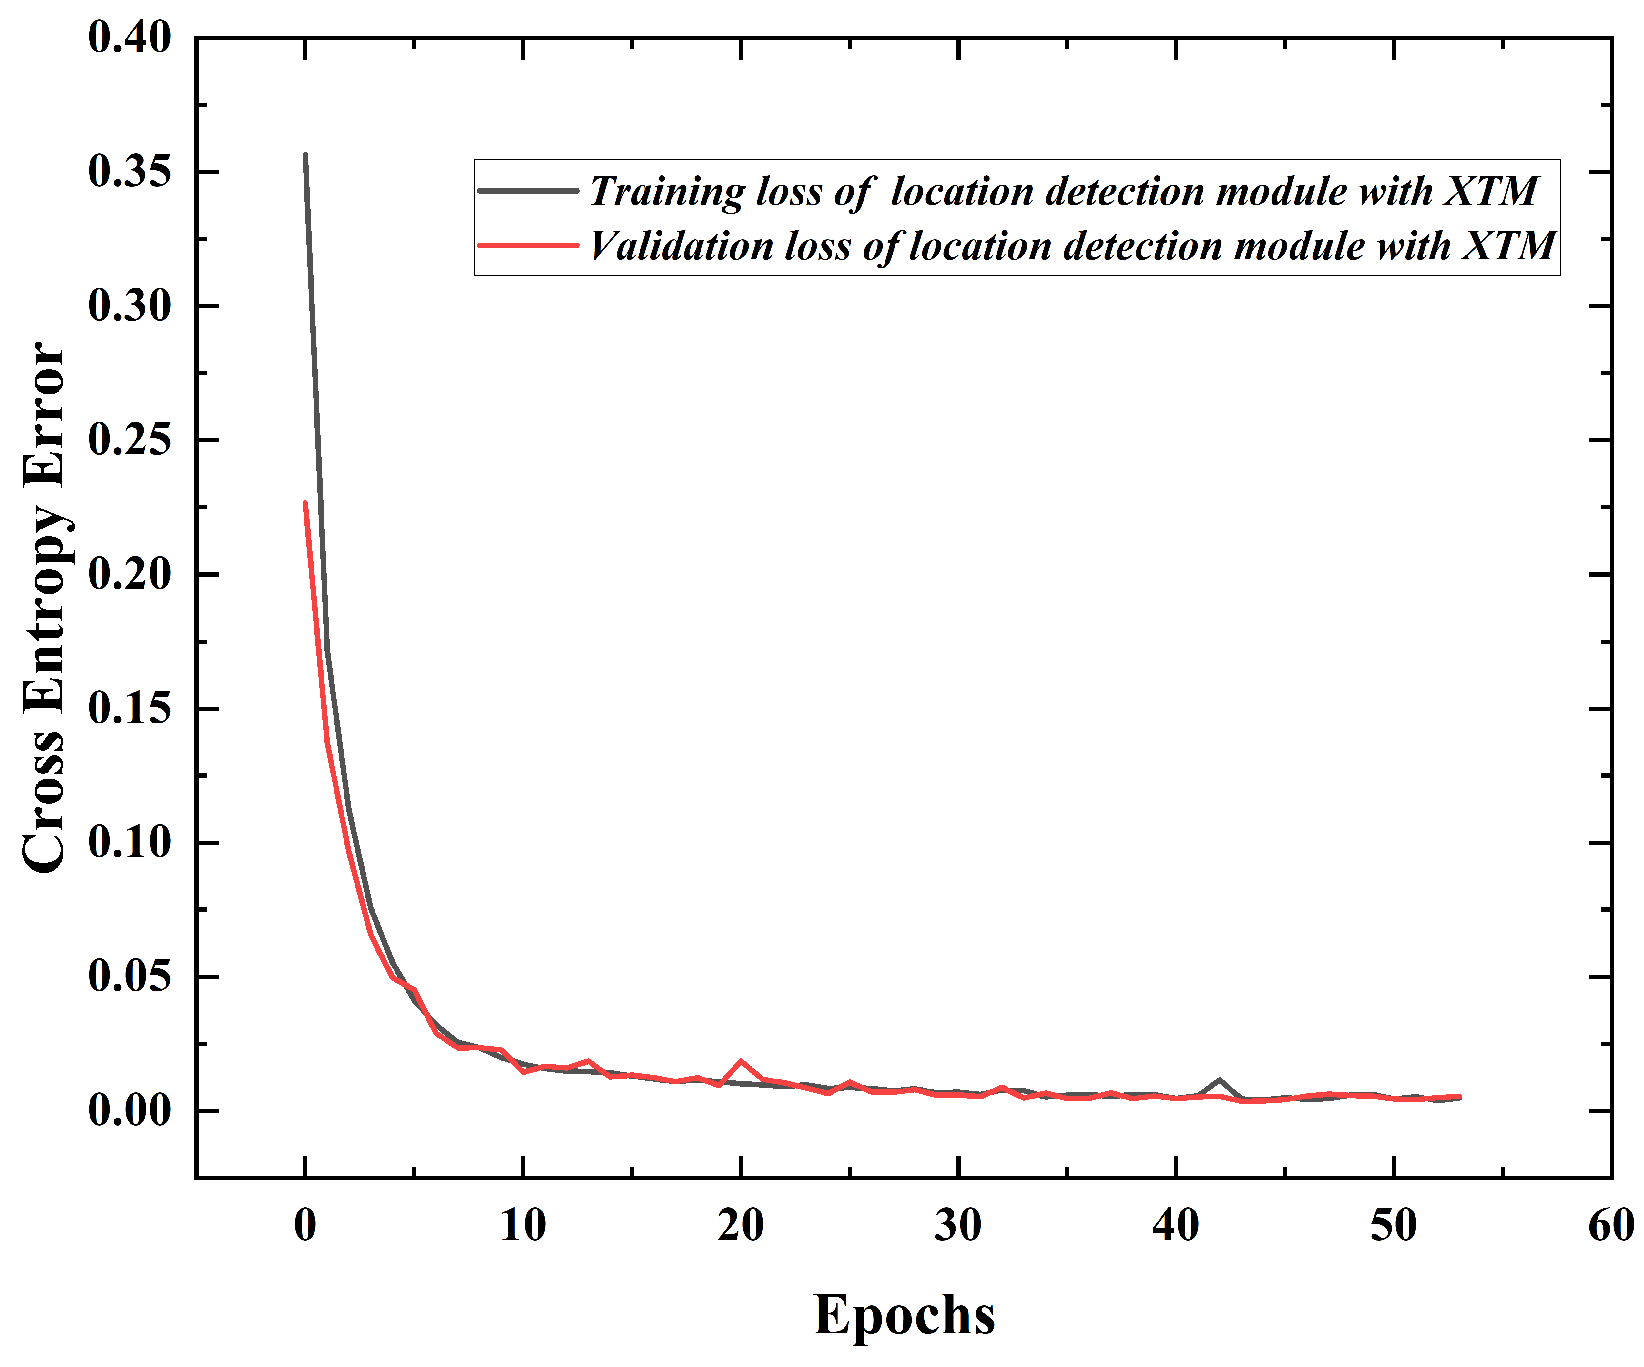
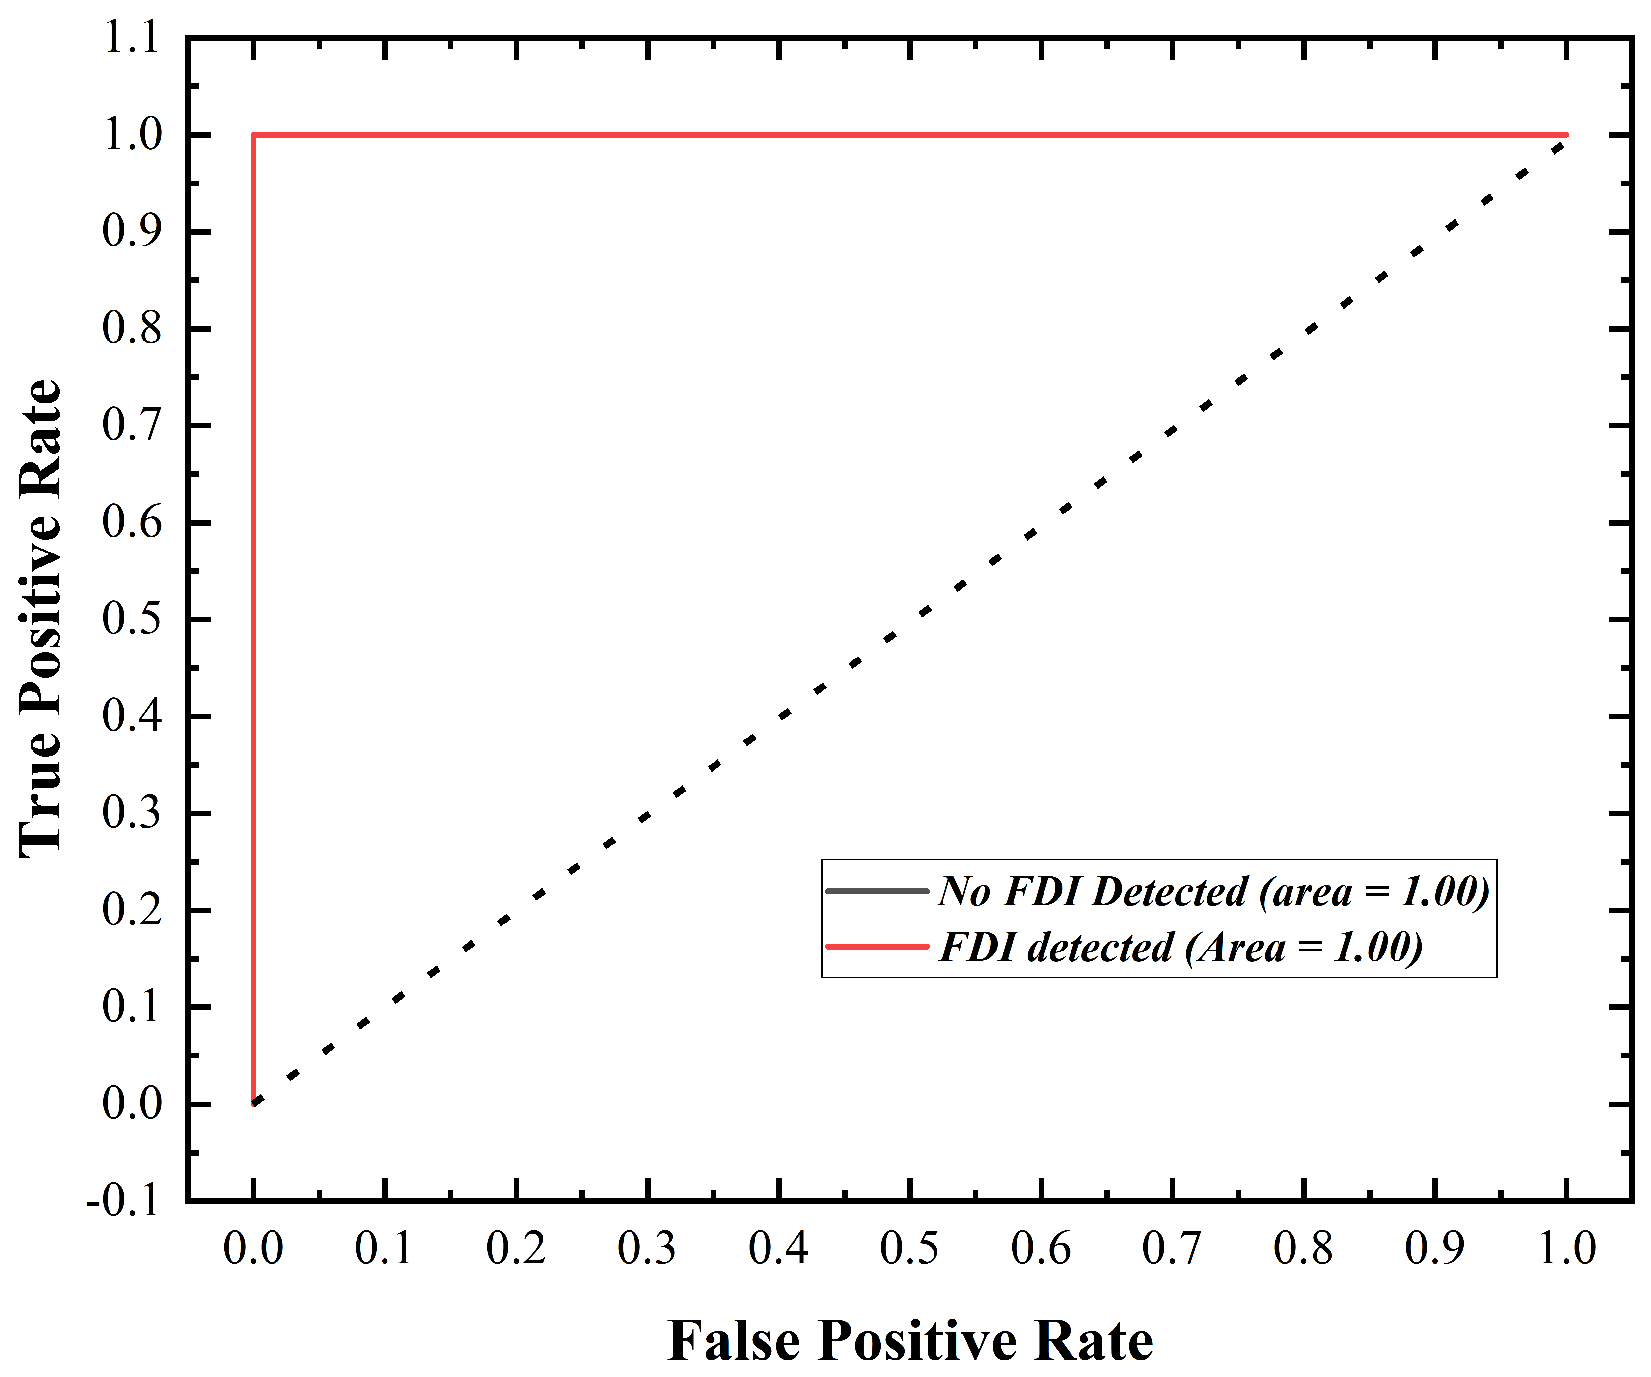
6.4. Location Detection Module Accuracy
6.5. Performance Evaluation on Minute Dataset
7. Case Study
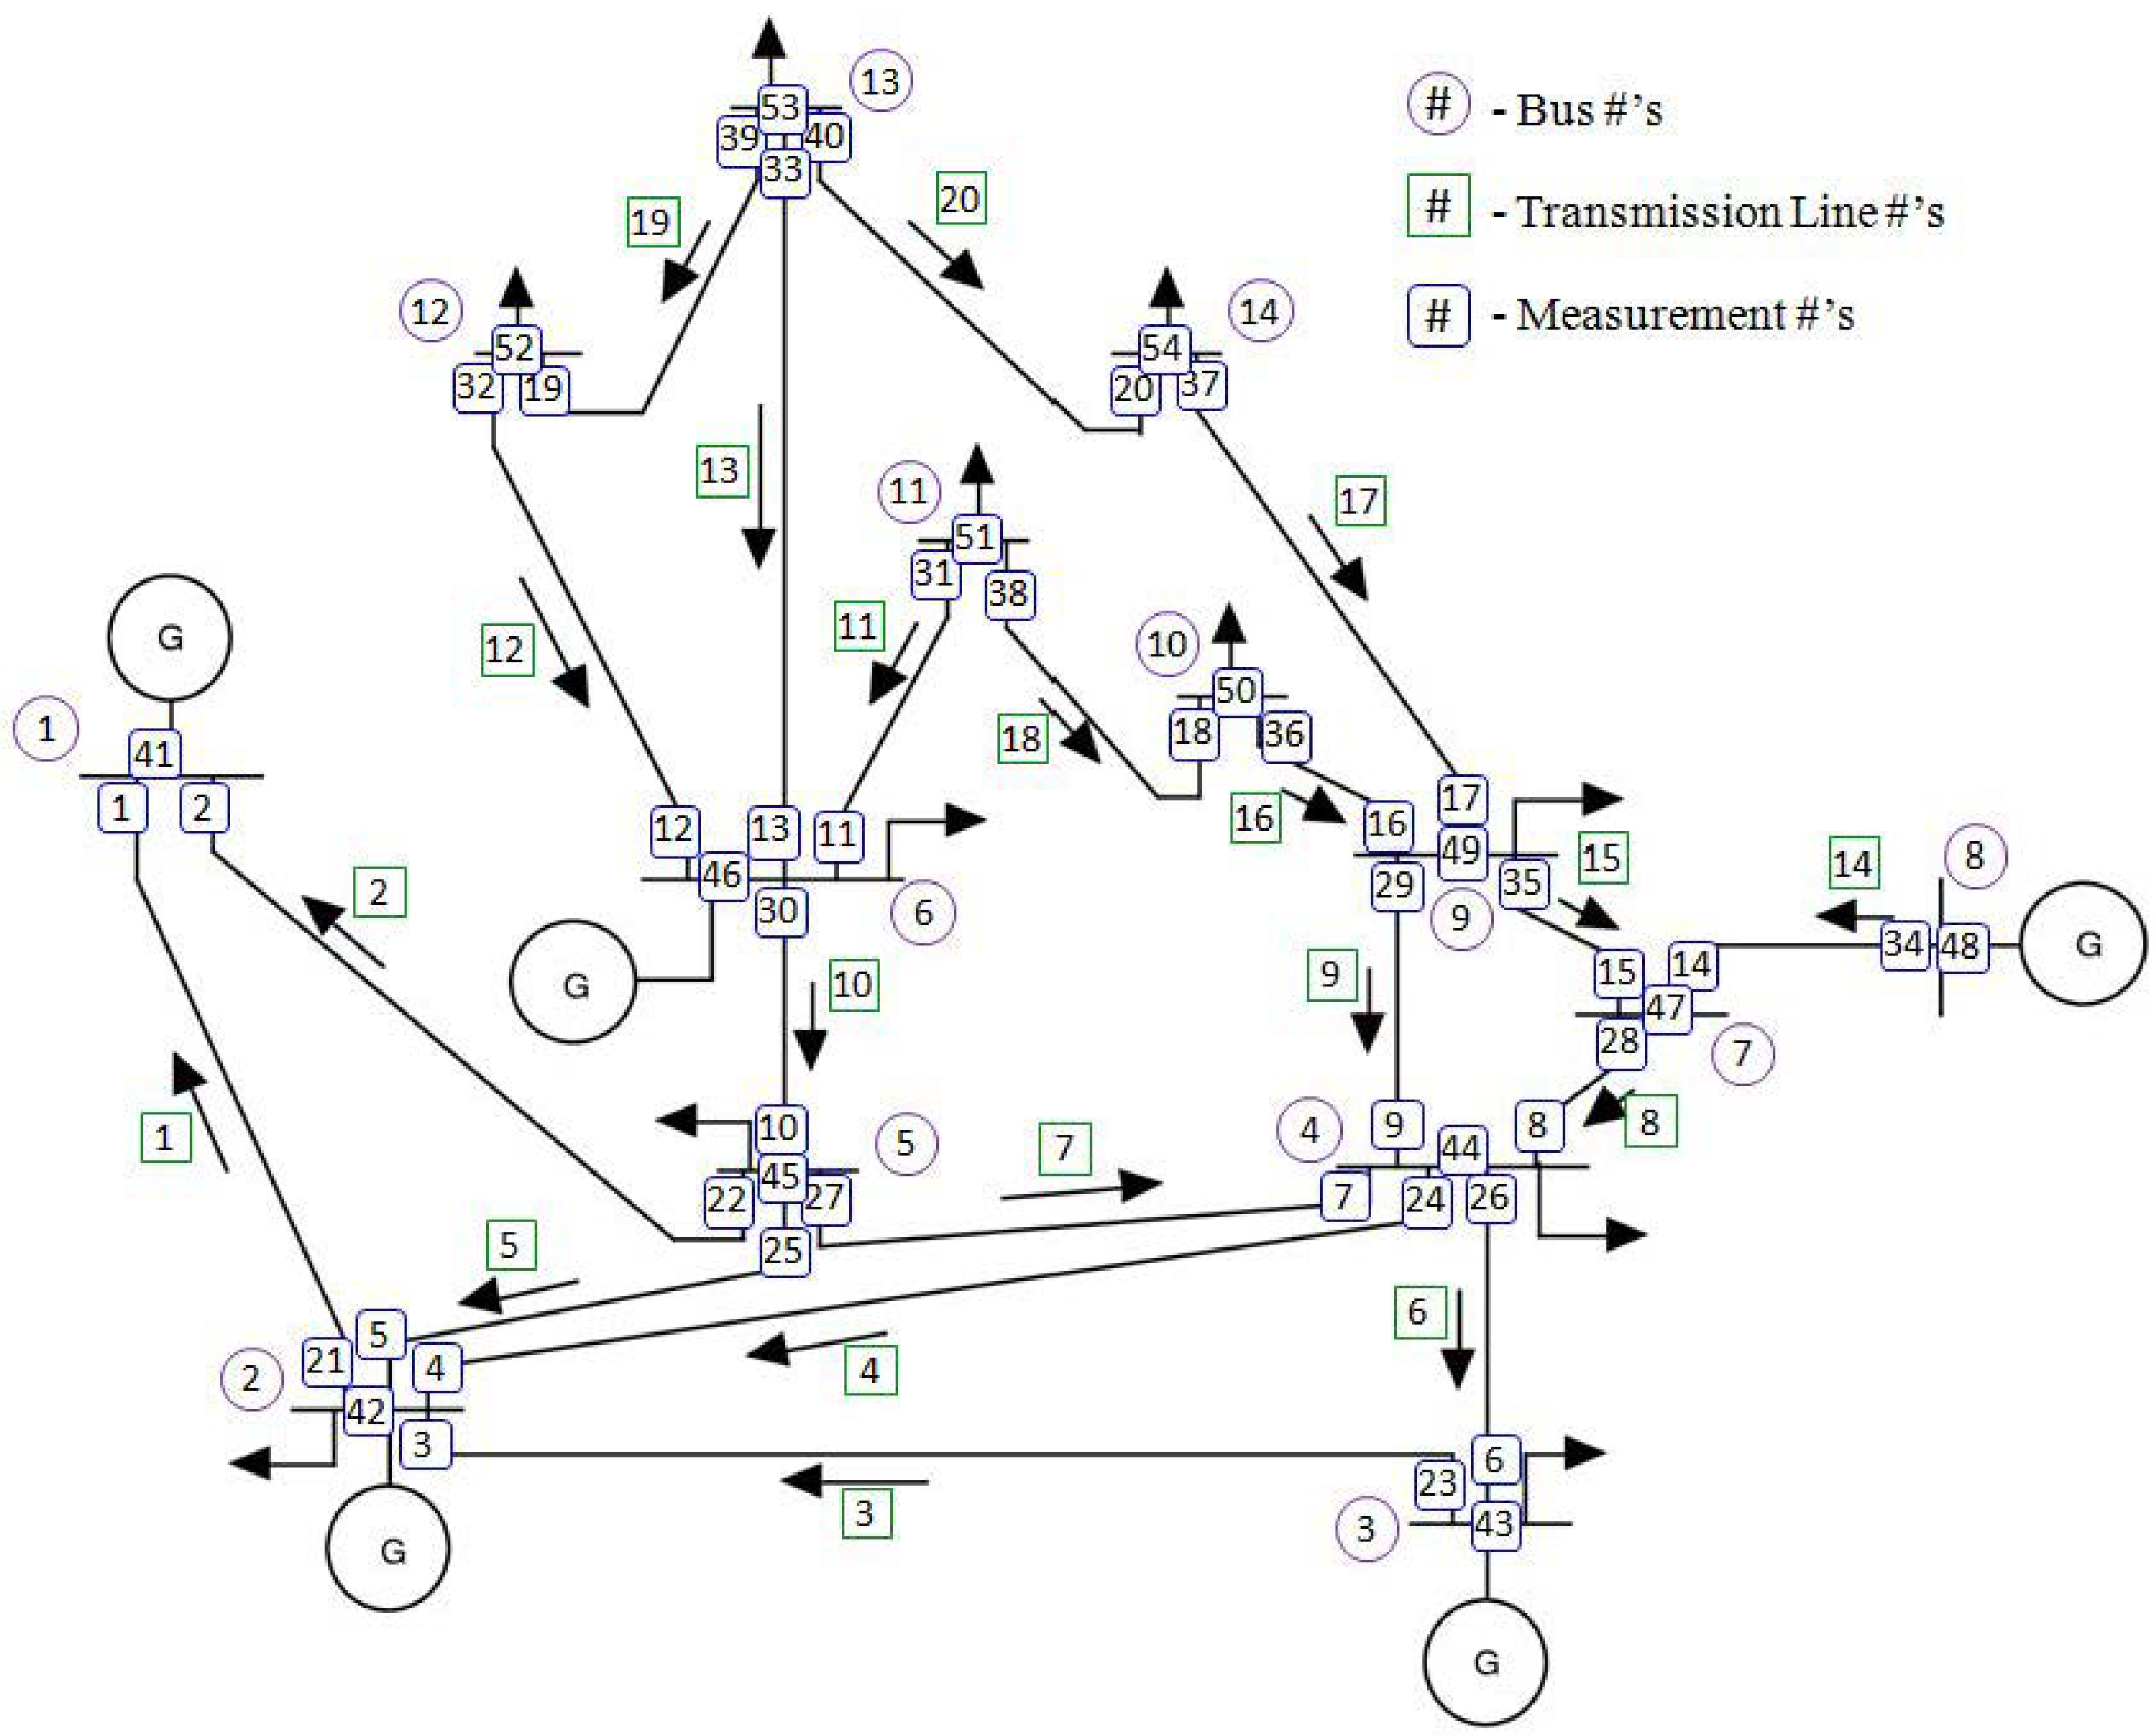
- Total number of lines = 20
- Total number of buses = 14
- Maximum number of measurements/sensors = 54 (i.e., 2 * 20 + 14)
7.1. Case Study 1
- It is necessary to conduct a FDI attack on buses 12 and 13 in order to accomplish the attacker’s objectives.
- Measurements 12, 13, 19, 20, 32, 33, 39, 40, 46, 52, 53 and 54 must be altered to prevent the attack from being detected by BDD. Since they are all distributed among buses 6, 12, 13 and 14 the attacker must inject false data into those bus sensors.
- The attack vectors used in this study has the dimension of (128 × 54). Here, 54 is the feature size of attack vectors that represents the changes to be made in each 54 sensors. Only the measurements that needed to be changed have non-zero values in any attack vector. We use one particular attack vector that specifically alter the measurements mentioned earlier to target bus 12 and 13.
- The selected attack vector is injected with the benign hourly test set. To detect FDI, first the compromised dataset is passed through FPDM. The proposed XTM is able to detect FDI in all measurements effectively using the threshold defined in Section 5.2.
- To detect the exact intrusion point, in other words the measurements that are altered, we utilize LDM. The forecasted measurements are concatenated with the injected sensor values and passed through a multilabel classifier. The proposed architecture is able to achieve 100% accuracy, detecting all the compromised sensors simultaneously.
7.2. Case Study 2
- It is necessary to conduct a FDI attack on buses 12, 13 and 14 in order to fulfill the attacker’s goal.
- Measurements 12, 13, 17, 19, 20, 32, 33, 37, 39, 40, 46, 49, 52, 53 and 54 need to be changed to avoid the attack from being noticed. Since they are all distributed among buses 6, 9, 12, 13 and 14, the attacker should add malicious data into those measurements as well. The measurements in the benign hourly test data are changed accordingly to simulate this particular FDI attack.
- Similar to case study 1, FPDM is used to detect FDI for this particular attack case. XTM is able to detect intrusion with 100% accuracy even when the target buses increased.
- In the same way, the attacked measurements are detected through LDM utilizing the forecast from FPDM and current sensor readings. Similar to the previous example, the model is able to detect all measurements targeting bus 12, 13 and 14 effectively.
8. Conclusions
Author Contributions
Funding
Institutional Review Board Statement
Informed Consent Statement
Data Availability Statement
Conflicts of Interest
References
- Hasan, M.Z.; Baul, A.; Islam, M.A. State of the Art Implementation of Automated Fire Accident Detection with Robust Control by Utilizing Industry 4.0 Terminology. ASM Sci. J. 2021, 14, 1–11. [Google Scholar] [CrossRef]
- Sadhu, P.K.; Yanambaka, V.P.; Abdelgawad, A.; Yelamarthi, K. Prospect of Internet of Medical Things: A Review on Security Requirements and Solutions. Sensors 2022, 22, 5517. [Google Scholar] [CrossRef] [PubMed]
- Judge, M.A.; Khan, A.; Manzoor, A.; Khattak, H.A. Overview of smart grid implementation: Frameworks, impact, performance and challenges. J. Energy Storage 2022, 49, 104056. [Google Scholar] [CrossRef]
- Fouda, M.M.; Fadlullah, Z.M.; Kato, N.; Lu, R.; Shen, X.S. A lightweight message authentication scheme for smart grid communications. IEEE Trans. Smart Grid 2011, 2, 675–685. [Google Scholar] [CrossRef]
- Smadi, A.A.; Ajao, B.T.; Johnson, B.K.; Lei, H.; Chakhchoukh, Y.; Abu Al-Haija, Q. A Comprehensive survey on cyber-physical smart grid testbed architectures: Requirements and challenges. Electronics 2021, 10, 1043. [Google Scholar] [CrossRef]
- Alkuwari, A.N.; Al-Kuwari, S.; Qaraqe, M. Anomaly Detection in Smart Grids: A Survey From Cybersecurity Perspective. In Proceedings of the IEEE 2022 3rd International Conference on Smart Grid and Renewable Energy (SGRE), Doha, Qatar, 20–22 March 2022; pp. 1–7. [Google Scholar]
- Aoufi, S.; Derhab, A.; Guerroumi, M. Survey of false data injection in smart power grid: Attacks, countermeasures and challenges. J. Inf. Secur. Appl. 2020, 54, 102518. [Google Scholar] [CrossRef]
- Reda, H.T.; Anwar, A.; Mahmood, A. Comprehensive survey and taxonomies of false injection attacks in smart grid: Attack models, targets, and impacts. arXiv 2021, arXiv:2103.10594. [Google Scholar] [CrossRef]
- Lu, X.; Jing, J.; Wu, Y. False Data Injection Attack Location Detection Based on Classification Method in Smart Grid. In Proceedings of the IEEE 2020 2nd International Conference on Artificial Intelligence and Advanced Manufacture (AIAM), Manchester, UK, 15–17 October 2020; pp. 133–136. [Google Scholar]
- Badr, M.M.; Ibrahem, M.I.; Mahmoud, M.; Fouda, M.M.; Alsolami, F.; Alasmary, W. Detection of false-reading attacks in smart grid net-metering system. IEEE Internet Things J. 2021, 9, 1386–1401. [Google Scholar] [CrossRef]
- Liu, Y.; Ning, P.; Reiter, M.K. False data injection attacks against state estimation in electric power grids. ACM Trans. Inf. Syst. Secur. (TISSEC) 2011, 14, 1–33. [Google Scholar] [CrossRef]
- Lei, W.; Pang, Z.; Wen, H.; Hou, W.; Han, W. FDI Attack Detection at the Edge of Smart Grids based on Classification of Predicted Residuals. IEEE Trans. Ind. Informat. 2022, 18, 9302–9311. [Google Scholar] [CrossRef]
- Yan, Y.; Qian, Y.; Sharif, H.; Tipper, D. A survey on cyber security for smart grid communications. IEEE Commun. Surv. Tutorials 2012, 14, 998–1010. [Google Scholar] [CrossRef]
- Musleh, A.S.; Chen, G.; Dong, Z.Y. A survey on the detection algorithms for false data injection attacks in smart grids. IEEE Trans. Smart Grid 2019, 11, 2218–2234. [Google Scholar] [CrossRef]
- Leao, B.P.; Vempati, J.; Muenz, U.; Shekhar, S.; Pandey, A.; Hingos, D.; Bhela, S.; Wang, J.; Bilby, C. Machine Learning-based False Data Injection Attack Detection and Localization in Power Grids. In Proceedings of the 2022 IEEE Conference on Communications and Network Security (CNS), Austin, TX, USA, 3–5 October 2022; pp. 1–8. [Google Scholar] [CrossRef]
- Mahi-Al-rashid, A.; Hossain, F.; Anwar, A.; Azam, S. False data injection attack detection in smart grid using energy consumption forecasting. Energies 2022, 15, 4877. [Google Scholar] [CrossRef]
- Shahriar, M.H.; Rahman, M.A.; Haque, N.I.; Chowdhury, B.; Whisenant, S.G. iDDAF: An Intelligent Deceptive Data Acquisition Framework for Secure Cyber-Physical Systems. In Proceedings of the International Conference on Security and Privacy in Communication Systems, Virtual Event, 6–9 September 2021; Springer: Berlin/Heidelberg, Germany, 2021; pp. 338–359. [Google Scholar]
- Shahriar, M.H.; Khalil, A.A.; Rahman, M.A.; Manshaei, M.H.; Chen, D. iAttackGen: Generative Synthesis of False Data Injection Attacks in Cyber-physical Systems. In Proceedings of the 2021 IEEE Conference on Communications and Network Security (CNS), Tempe, AZ, USA, 4–6 October 2021; pp. 200–208. [Google Scholar]
- Farajzadeh-Zanjani, M.; Hallaji, E.; Razavi-Far, R.; Saif, M.; Parvania, M. Adversarial semi-supervised learning for diagnosing faults and attacks in power grids. IEEE Trans. Smart Grid 2021, 12, 3468–3478. [Google Scholar] [CrossRef]
- Majidi, S.H.; Hadayeghparast, S.; Karimipour, H. FDI attack detection using extra trees algorithm and deep learning algorithm-autoencoder in smart grid. Int. J. Crit. Infrastruct. Prot. 2022, 37, 100508. [Google Scholar] [CrossRef]
- Pei, C.; Xiao, Y.; Liang, W.; Han, X. A deviation-based detection method against false data injection attacks in smart grid. IEEE Access 2021, 9, 15499–15509. [Google Scholar] [CrossRef]
- Zhang, Y.; Wang, J.; Chen, B. Detecting false data injection attacks in smart grids: A semi-supervised deep learning approach. IEEE Trans. Smart Grid 2020, 12, 623–634. [Google Scholar] [CrossRef]
- Roy, S.D.; Debbarma, S. Deep Learning for Classification of FDIs on Time-Series Sensor Data in Cyber-Physical Power Systems. In Proceedings of the 2022 IEEE 21st Mediterranean Electrotechnical Conference (MELECON), Palermo, Italy, 14–16 June 2022; pp. 665–670. [Google Scholar]
- Yang, L.; Li, Y.; Li, Z. Improved-ELM method for detecting false data attack in smart grid. Int. J. Electr. Power Energy Syst. 2017, 91, 183–191. [Google Scholar] [CrossRef]
- Acosta, M.R.C.; Ahmed, S.; Garcia, C.E.; Koo, I. Extremely randomized trees-based scheme for stealthy cyber-attack detection in smart grid networks. IEEE Access 2020, 8, 19921–19933. [Google Scholar] [CrossRef]
- Nagaraj, K.; Zou, S.; Ruben, C.; Dhulipala, S.; Starke, A.; Bretas, A.; Zare, A.; McNair, J. Ensemble CorrDet with adaptive statistics for bad data detection. IET Smart Grid 2020, 3, 572–580. [Google Scholar] [CrossRef]
- Mukherjee, D.; Chakraborty, S.; Ghosh, S. Deep learning-based multilabel classification for locational detection of false data injection attack in smart grids. Electr. Eng. 2022, 104, 259–282. [Google Scholar] [CrossRef]
- Rashed, M.; Kamruzzaman, J.; Gondal, I.; Islam, S. False Data Detection in a Clustered Smart Grid Using Unscented Kalman Filter. IEEE Access 2022, 10, 78548–78556. [Google Scholar] [CrossRef]
- Hegazy, H.I.; Tag Eldien, A.S.; Tantawy, M.M.; Fouda, M.M.; TagElDien, H.A. Real-Time Locational Detection of Stealthy False Data Injection Attack in Smart Grid: Using Multivariate-Based Multi-Label Classification Approach. Energies 2022, 15, 5312. [Google Scholar] [CrossRef]
- Wang, S.; Bi, S.; Zhang, Y.J.A. Locational detection of the false data injection attack in a smart grid: A multilabel classification approach. IEEE Internet Things J. 2020, 7, 8218–8227. [Google Scholar] [CrossRef]
- Cao, Y.; Song, H.; Zhang, T.; Lu, P. Research on location detection method of power network false data injection based on FCN-GRU. In Proceedings of the 2nd International Conference on Mechanical, Electronics, and Electrical and Automation Control (METMS 2022), Guilin, China, 25 April 2022; Volume 12244, pp. 1242–1247. [Google Scholar]
- Aljabrine, A.A.; Smadi, A.A.; Chakhchoukh, Y.; Johnson, B.K.; Lei, H. Resiliency improvement of an AC/DC power grid with embedded LCC-HVDC using robust power system state estimation. Energies 2021, 14, 7847. [Google Scholar] [CrossRef]
- Rahman, M.A.; Al-Shaer, E.; Kavasseri, R.G. A formal model for verifying the impact of stealthy attacks on optimal power flow in power grids. In Proceedings of the 2014 ACM/IEEE International Conference on Cyber-Physical Systems (ICCPS), Berlin, Germany, 14–17 April 2014; pp. 175–186. [Google Scholar]
- Rahman, M.A.; Mohsenian-Rad, H. False data injection attacks with incomplete information against smart power grids. In Proceedings of the 2012 IEEE Global Communications Conference (GLOBECOM), Anaheim, CA, USA, 3–7 December 2012; pp. 3153–3158. [Google Scholar]
- Esmalifalak, M.; Nguyen, H.; Zheng, R.; Han, Z. Stealth false data injection using independent component analysis in smart grid. In Proceedings of the 2011 IEEE International Conference on Smart Grid Communications (SmartGridComm), Brussels, Belgium, 17–20 October 2011; pp. 244–248. [Google Scholar]
- Hochreiter, S.; Schmidhuber, J. Long short-term memory. Neural Comput. 1997, 9, 1735–1780. [Google Scholar] [CrossRef]
- Hochreiter, S. The vanishing gradient problem during learning recurrent neural nets and problem solutions. Int. J. Uncertainty Fuzziness Knowl.-Based Syst. 1998, 6, 107–116. [Google Scholar] [CrossRef]
- Understanding LSTM Networks. Available online: https://colah.github.io/posts/2015-08-Understanding-LSTMs/ (accessed on 30 January 2023).
- Vaswani, A.; Shazeer, N.; Parmar, N.; Uszkoreit, J.; Jones, L.; Gomez, A.N.; Kaiser, Ł.; Polosukhin, I. Attention is all you need. Adv. Neural Inf. Process. Syst. 2017, 30. Available online: https://proceedings.neurips.cc/paper/2017/hash/3f5ee243547dee91fbd053c1c4a845aa-Abstract.html (accessed on 30 January 2023).
- Wu, N.; Green, B.; Ben, X.; O’Banion, S. Deep transformer models for time series forecasting: The influenza prevalence case. arXiv 2020, arXiv:2001.08317. [Google Scholar]
- Zerveas, G.; Jayaraman, S.; Patel, D.; Bhamidipaty, A.; Eickhoff, C. A transformer-based framework for multivariate time series representation learning. In Proceedings of the 27th ACM SIGKDD Conference on Knowledge Discovery & Data Mining, Singapore, 14–18 August 2021; pp. 2114–2124. [Google Scholar]
- Choi, K.; Yi, J.; Park, C.; Yoon, S. Deep Learning for Anomaly Detection in Time-Series Data: Review, Analysis, and Guidelines. IEEE Access 2021, 9, 120043–120065. [Google Scholar] [CrossRef]
- Niu, Z.; Zhong, G.; Yu, H. A review on the attention mechanism of deep learning. Neurocomputing 2021, 452, 48–62. [Google Scholar] [CrossRef]
- Ashrafuzzaman, M.; Chakhchoukh, Y.; Jillepalli, A.A.; Tosic, P.T.; de Leon, D.C.; Sheldon, F.T.; Johnson, B.K. Detecting stealthy false data injection attacks in power grids using deep learning. In Proceedings of the IEEE 2018 14th International Wireless Communications & Mobile Computing Conference (IWCMC), Limassol, Cyprus, 25–29 June 2018; pp. 219–225. [Google Scholar]
- Van Hertem, D.; Verboomen, J.; Purchala, K.; Belmans, R.; Kling, W.L. Usefulness of DC power flow for active power flow analysis with flow controlling devices. In Proceedings of the 8th IEE International Conference on AC and DC Power Transmission, London, UK, 28–31 March 2006; pp. 58–62. [Google Scholar]
- Tan, R.; Nguyen, H.H.; Foo, E.Y.; Yau, D.K.; Kalbarczyk, Z.; Iyer, R.K.; Gooi, H.B. Modeling and mitigating impact of false data injection attacks on automatic generation control. IEEE Trans. Inf. Forensics Secur. 2017, 12, 1609–1624. [Google Scholar] [CrossRef]
- Sridhar, S.; Govindarasu, M. Model-based attack detection and mitigation for automatic generation control. IEEE Trans. Smart Grid 2014, 5, 580–591. [Google Scholar] [CrossRef]
- Ruder, S. An overview of gradient descent optimization algorithms. arXiv 2016, arXiv:1609.04747. [Google Scholar]


| Authors | Objectives | Model Used | Is Dataset Available? | Limitations |
|---|---|---|---|---|
| Lei et al. [12] | FDI presence detection | GRU with wavelet transform-CNN | Yes | • Attack location cannot be determined • Only attack magnitude is considered, did not discuss attack sparsity |
| Mahi et al. [16] | FDI presence detection | Auto-encoder + CNN-LSTM-based auto-encoder | No | • Attack location is not considered • Unable to handle power system with large number of features • Did not account the seasonal variation of measurements |
| Nagaraj et al. [26] | FDI presence detection | ensemble CorrDet with adaptive statistics (ECD-AS) | No | • Requires separate detector for each buses • Measurements taken from only one day |
| Camana et al. [25] | FDI presence detection | KPCA with Extra-Trees algorithm | No | • Attack sparsity is not considered • Cannot detect which measurement sensor is compromised |
| Roy et al. [23] | FDI presence detection | LSTM-based three models + Auto-encoder based two models | No | • Attack sparsity is not considered • Unable to handle the novel attacks • Detailed information about the data set and the attack vector lacking |
| Mukherjee et al. [27] | FDI location detection | CNN | No | • Did not account the seasonal variation of measurements • Attack case study targeting particular measurements did not consider the dependency with other measurements |
| Notationl | Defination |
|---|---|
| b | Total number of buses in the topology |
| l | Total number of lines in the topology |
| Starting bus of line i | |
| Ending bus of line i | |
| Admittance of line i | |
| Total power flow in line i | |
| Total power consumption in bus j | |
| The measurement of state value for bus j | |
| The incoming line sets towards bus j | |
| The outgoing line sets towards bus j | |
| Total power generated in bus j | |
| Total Load power flow in bus j |
| Stage | Type | Output Shape | Number of Params |
|---|---|---|---|
| 0 | Input | 48 × 54 | 0 |
| 1 | Multi-headed Attention | 48 × 54 | 11,880 |
| 2 | dropout | 48 × 54 | 0 |
| 3 | Normalize | 48 × 54 | 108 |
| 4 | Add with Input | 48 × 54 | 0 |
| 5 | FCL (ReLU) | 48 × 128 | 7040 |
| 6 | dropout | 48 × 128 | 0 |
| 7 | FCL (ReLU) | 48 × 54 | 6966 |
| 8 | Nomralize | 48 × 54 | 108 |
| 9 | Add with stage 4 output | 48 × 54 | 0 |
| 10 | LSTM (tanh) | 48 × 128 | 93,696 |
| 11 | LSTM (tanh) | 128 | 131,584 |
| 12 | FCL (ReLU) | 128 | 16,512 |
| 13 | Dropout | 128 | 0 |
| 14 | FCL (Linear) | 54 × 1 | 54 |
| Total Number of Parameters: 274,860 | |||
| Trainable Parameters: 274,860 | |||
| Non-trainable Parameters: 0 | |||
| Percentile (%) | Error Magnitude | f1-Score |
|---|---|---|
| 95 | 0.3041 | 0.9732 |
| 96 | 0.31575 | 0.9783 |
| 97 | 0.32 | 0.9831 |
| 98 | 0.32365 | 0.98774 |
| 99 | 0.35368 | 0.9927 |
| 100 | 0.39788 | 0.99565 |
| Proposed | 0.4 | 0.9964 |
| Model | RMSE | MSE | MAE |
|---|---|---|---|
| CNN | 12.1323 | 276.8111 | 10.2596 |
| CNN-Transformer | 3.1835 | 16.7532 | 2.5116 |
| Transformer | 12.2238 | 281.6116 | 10.2524 |
| CNN-LSTM | 1.9447 | 6.0333 | 1.5055 |
| XTM (Transformer-LSTM) | 1.2635 | 2.4992 | 0.9866 |
| Model | Threshold () | Precision | Recall | f1-Score |
|---|---|---|---|---|
| CNN | 1.25 | 0.7632 | 0.8129 | 0.7534 |
| CNN-Transformer | 1.00 | 0.9516 | 0.9547 | 0.9515 |
| Transformer | 1.25 | 0.7379 | 0.7989 | 0.7284 |
| CNN-LSTM | 0.4 | 0.9893 | 0.9893 | 0.9893 |
| XTM (Transformer-LSTM) | 0.4 | 0.9962 | 0.9962 | 0.9962 |
| Model | Precision | Recall | f1-Score | RACC |
|---|---|---|---|---|
| CNN | 0.9979 | 0.0.9981 | 0.0.9980 | 0.9227 |
| CNN-Transformer | 0.9989 | 0.9984 | 0.9986 | 0.9312 |
| Transformer | 0.9982 | 0.9981 | 0.9981 | 0.9396 |
| CNN-LSTM | 0.9983 | 0.9982 | 0.9982 | 0.9167 |
| Transformer-LSTM | 0.9984 | 0.9985 | 0.9984 | 0.9299 |
| Percentile (%) | Error Magnitude | f1-Score |
|---|---|---|
| 95 | 0.14308 | 0.97501 |
| 96 | 0.14545 | 0.97999 |
| 97 | 0.14914 | 0.98498 |
| 98 | 0.15309 | 0.99001 |
| 99 | 0.15893 | 0.99499 |
| 100 | 0.18707 | 0.99998 |
| Proposed | 0.2 | 1.00000 |
| Metrics | Scores |
|---|---|
| RMSE | 0.5912 |
| MSE | 0.5956 |
| MAE | 0.4888 |
| f1 score of presence detection module | 1.0 |
| f1 score of location detection module | 1.0 |
| Row Accuracy | 0.9999 |
| Case Study Number | Number of Attacked Buses | Targeted Buses | Measurements Need to Be Changed | The Buses at Which One or More Measurements Are Required to Alter | FDI Detection Accuracy | Location Detection Accuracy |
|---|---|---|---|---|---|---|
| 1 | 2 | 12, 13 | 12, 13, 19, 20, 32, 33, 39, 40, 46, 52, 53, 54 | 6, 12, 13, 14 | 1.0 | 1.0 |
| 2 | 3 | 12, 13, 14 | 12, 13, 17, 19, 20, 32, 33, 37, 39, 40, 46, 49, 52, 53, 54 | 6, 9, 12, 13, 14 | 1.0 | 1.0 |
Disclaimer/Publisher’s Note: The statements, opinions and data contained in all publications are solely those of the individual author(s) and contributor(s) and not of MDPI and/or the editor(s). MDPI and/or the editor(s) disclaim responsibility for any injury to people or property resulting from any ideas, methods, instructions or products referred to in the content. |
© 2023 by the authors. Licensee MDPI, Basel, Switzerland. This article is an open access article distributed under the terms and conditions of the Creative Commons Attribution (CC BY) license (https://creativecommons.org/licenses/by/4.0/).
Share and Cite
Baul, A.; Sarker, G.C.; Sadhu, P.K.; Yanambaka, V.P.; Abdelgawad, A. XTM: A Novel Transformer and LSTM-Based Model for Detection and Localization of Formally Verified FDI Attack in Smart Grid. Electronics 2023, 12, 797. https://doi.org/10.3390/electronics12040797
Baul A, Sarker GC, Sadhu PK, Yanambaka VP, Abdelgawad A. XTM: A Novel Transformer and LSTM-Based Model for Detection and Localization of Formally Verified FDI Attack in Smart Grid. Electronics. 2023; 12(4):797. https://doi.org/10.3390/electronics12040797
Chicago/Turabian StyleBaul, Anik, Gobinda Chandra Sarker, Pintu Kumar Sadhu, Venkata P. Yanambaka, and Ahmed Abdelgawad. 2023. "XTM: A Novel Transformer and LSTM-Based Model for Detection and Localization of Formally Verified FDI Attack in Smart Grid" Electronics 12, no. 4: 797. https://doi.org/10.3390/electronics12040797
APA StyleBaul, A., Sarker, G. C., Sadhu, P. K., Yanambaka, V. P., & Abdelgawad, A. (2023). XTM: A Novel Transformer and LSTM-Based Model for Detection and Localization of Formally Verified FDI Attack in Smart Grid. Electronics, 12(4), 797. https://doi.org/10.3390/electronics12040797