1. Introduction
This paper presents the implementation of a neural network that serves as the basis for the generation of a condition-based maintenance system for an anaerobic reactor, which is a complex process due to its nonlinear nature and that some of the variables involved in the process do not currently have commercial/professional sensors to be measured online, so it requires the implementation of virtual sensors to estimate the value of the same, in this case relying on a level sensor implemented in an anaerobic IFBR presented in [
1], where control, diagnosis and maintenance were not achieved.
Online fault detection and isolation (FDI) has become a major issue due to the increasing demand for reliability and safety in industrial processes, as well as economic and environmental constraints [
2]. When a fault occurs, it can affect the efficiency of the process, and if such a fault is not located at an early stage, it could lead to a catastrophic scenario including injury to personnel, environmental contamination and destruction of assets and equipment [
3].
Nowadays, industrial processes are becoming increasingly complex, which increases the difficulty of performing online fault diagnosis quickly and efficiently [
4], due to the nonlinear and highly coupled nature of the variables involved in these processes.
This last point is especially present in the case of anaerobic reactors, in which it is practically impossible to perform online measurement of all the variables involved in the process, thus fully justifying the need to develop an adequate fault diagnosis tool for this type of reactor [
5].
Anaerobic reactors present an interesting case study for fault detection methods because it is very difficult to detect what is happening inside the reactor at a given instant, as well as to know how the concentrations of the different bacterial groups and of the organic pollutant load are evolving as a function of time [
6]. In addition, given a set of indirect signals or measurements taken from a process, it can be difficult to identify whether the information coming from the process is reliable or not [
7]. Furthermore, in the event that the process is not behaving as it should, it can be very difficult to know which component is responsible for the irregularity [
8]. To solve this problem, the fault detection and isolation study presented below has been developed, which is based on a differential geometry approach for a class of nonlinear systems.
The observer-based approach to FDI [
9] is among the most important contributions to the area of analytical redundancy-based FDI. Basically, it consists of defining a function of the system outputs, for each fault signal or set of fault signals, that can only be affected by that particular fault (or set of faults). The redundancy of the system is provided by the comparison of the output function in question with its estimate [
10]. An observer-based FDI study can be found in [
11]. Most of the proposed contributions were developed for linear systems; however, many processes are nonlinear. It should be noted that, even if the process operates at a certain operating point, the occurrence of a fault can move it away from the operating point, thus generating errors in the model that leads to the generation of false alarms [
12].
A linear system is said to be observable at time t
0, if with the system in state x(t
0) it is possible to determine that state from the observation of the system output, during a finite time interval. Consider the linear system in continuous time, represented by:
where x(t) ∈ ℜ
n is the state vector, A ∈ ℜ
nxn is the state matrix, y(t) ∈ ℜ
n is the system matrix and C ∈ ℜ
mxn. The observability of the system (Equation (1)) is established according to the observability matrix
:
The system is observable if and only if the observability matrix has full rank, that is, rank .
For nonlinear systems, a concept related to observability is that of detectability or asymptotic observability, which establishes that a system is detectable if the difference between two trajectories with the same output history converges asymptotically to zero [
13].
The observability analysis for nonlinear systems can be performed, in an approximate way, by linearizing the equations representing the model around an equilibrium point and determining the observability matrix in order to establish the local observability of the system in the vicinity of the selected equilibrium point. Another alternative to evaluate the observability of nonlinear systems is based on the use of differential geometry tools, through the construction of the observation space assuming that the output depends only on the state variables [
14].
Biological processes, in most cases, are not completely observable, due to their nonlinear nature, so it is more appropriate to estimate some relationships between parameters, instead of estimating them individually [
15].
The estimation of states in biological reactors presents a critical drawback, due to the high uncertainty associated with the following factors [
16].
The variety of biological species present in the reactor makes it difficult to determine the role played by each of them in the process.
The measurement of the initial total biomass does not correspond to the concentration of the effective biomass.
The complexity of the system makes it difficult to describe the parameters associated with the kinetics of the biological reactions.
The growth rates of the bacterial groups are time-varying.
In the work presented by authors of [
17], a methodology for determining the global observability and detectability of biological reactors is explored. The method proposed in the article allows formalizing the design of the so-called asymptotic observers.
Recently, many efforts have been focused on the implementation of programmed sensors based on state observers, due to the advantages that the use of these sensors represents, compared to hardware sensors [
18]. Some of these advantages are mentioned below:
The maintenance cost of a programmed sensor is much less expensive than that of a hardware sensor.
Once a programmed sensor has been designed and tuned for a particular application, no periodic maintenance is required to recalibrate it (e.g., pH analyzers, oxygen analyzers, etc.).
Programmed sensors can be used to predict information that is difficult to obtain using traditional methods, either due to inherent measurement delays or due to process operating conditions.
Installation costs are cheaper in most cases compared to traditional methods of monitoring systems.
Programmed sensors are used in order to solve problems associated with the lack of sensors for real-time measurement of certain process variables. For example, authors of [
19] used a support vector regression algorithm for COD (chemical oxygen demand) estimation in a perfectly stirred anaerobic reactor. One of the main difficulties in implementing programmed sensors is that the design contemplates previously obtaining a predictive model for a given process. Consequently, the success of a programmed sensor strongly depends on the accuracy of the mathematical model obtained for that process.
Many empirical equations exist in the literature to model the porosity or expansion of an IFBR. Campos-Díaz et al., 2012 [
20], proposed the following model to estimate the porosity of the inverse fluidized bed, as a function of the Reynolds particle and Archimedes numbers:
where:
Authors of [
20] developed an empirical correlation for predicting bed expansion as a function of physical and dynamic variables of the system, calculated using the following equation:
where ϕ is the particle sphericity.
It is evident that at Re
p < 0.2, the correlation of the result of [
20] adequately predicts the porosity of the bed, while at Re
p > 0.7, the correlation of the result of [
21] is more in agreement with experimental data. However, both empirical correlations fail to provide a reasonable overall description at all evaluated operating conditions, and this might be associated with the experimental conditions in which they were fitted.
Therefore, taking into account that there are conductivity sensors placed inside the IFBR, which provide information on the expansion of the fluidized bed, it was decided to use the correlation of the result of [
21] as a starting point to train an artificial neural network capable of finding a relationship between pH, influent COD concentration, inflow to the bioreactor and the signal coming from each of the conductivity sensors installed inside the reactor, to estimate the effluent COD concentration, the bioreactor biogas production flow rate (the sum of methane and carbon dioxide production), the methane production flow rate, the carbon dioxide production flow rate and the concentration of volatile fatty acids in the reactor effluent.
The importance of the work presented resides in the considerations made and how the process is treated to ensure the correct functioning of a control strategy and fault diagnosis in the same, to maximize the production of biogas and serve as an aid system to a human operator for the maintenance of the same, through the use of artificial intelligence techniques.
2. Materials and Methods
2.1. Support Expansion Monitoring System
Figure 1 shows the block diagram of the bed expansion monitoring system. The expansion of the bed is produced by the flow generated by opening the control valve connected to the distribution tank. The flow is proportional to the valve opening and also dependent on the force of gravity. By circulating the fluid downward, the colonized bed, which has a lower conductivity than the effluent, begins to gradually expand.
Predevelopment measurements were carried out with a commercial conductivity sensor to validate the above. The values obtained from the measurements using a conductivity electrode, model DFR0300, are shown below in
Table 1. All conductivity measurements were performed at 25 °C.
The electrode array allows for detecting the substrate change, thus identifying the level of substrate expansion. A conditioning card was developed to obtain the necessary voltage signal, and an acquisition card was used to capture the measured values.
The electrode model used for the array is CON2136-13 with a constant K = 10 and construction material of polysulphone and platinum. It was chosen because the measurement of the variable of interest must be continuous, which represents a problem for many of the metallic materials available, such as copper or tin, since, over time, the environment inside a biodigester is corrosive and can be degraded. Likewise, it is advisable in wastewater treatment to use electrodes with a counter of 10, considering the conductivity levels of the substrates in wastewater treatment. Moreover, the electrode performed adequately in a previous investigation using synthetic wastewater [
1], where level measure was achieved, but a control and diagnosis systems were not achieved, conditions that are needed for a condition-based maintenance strategy.
A platinum conductivity probe is proposed at each point in the column. The material was chosen because the measurement of the variable of interest must be continuous, which represents a problem for many of the metallic materials available such as copper or tin, since, over time, the environment inside a biodigester becomes corrosive and can degrade them. Platinum, on the other hand, is immune to oxidation and to the biological activity of bacteria, making it one of the most suitable materials for this application.
The position of the electrodes is set at the bottom of the reactor column with a separation distance of 10 cm from each other and in diagonal position to avoid clogging. The voltage delivered by the conditioning circuit is calculated using Equation (6).
where:
Vout: is the output voltage of the conditioning circuit.
Vin: is the alternating excitation voltage applied to the electrode.
G: solution conductivity.
Rf: feedback resistance of the conditioning circuit.
The value of the proposed feedback resistance in the conditioning circuit is 8.2 KΩ due to the conductivity probe constant and the conductivity values present in the reactor solutions previously presented. Dynamic testing of the system was performed, replicating the expansion of the colonized support. The support material used was colonized (bacteria biofilm around the support media) and noncolonized.
Figure 2 shows the results obtained from the dynamic expansion test of the support bed. This test consisted of introducing colonized support media recirculating in the reactor at a downward velocity of 1.41 m/h. It can be observed how after 650 s (10 min), sensor 1 detects a voltage decrease, which means that it has come into contact with the colonized support media; then, at 950 s (16 min), sensor 2 also comes into contact with the substrate, so its voltage decreases. Finally, sensor 3 comes into contact with the expanded support at 1230 s (20 min). After half an hour of operation, the recirculation is turned off, so the voltage values of the sensors begin to increase, but in reverse order, i.e., the voltage first increases in sensor 3, then in sensor 2, and finally, sensor 1 returns to its initial values.
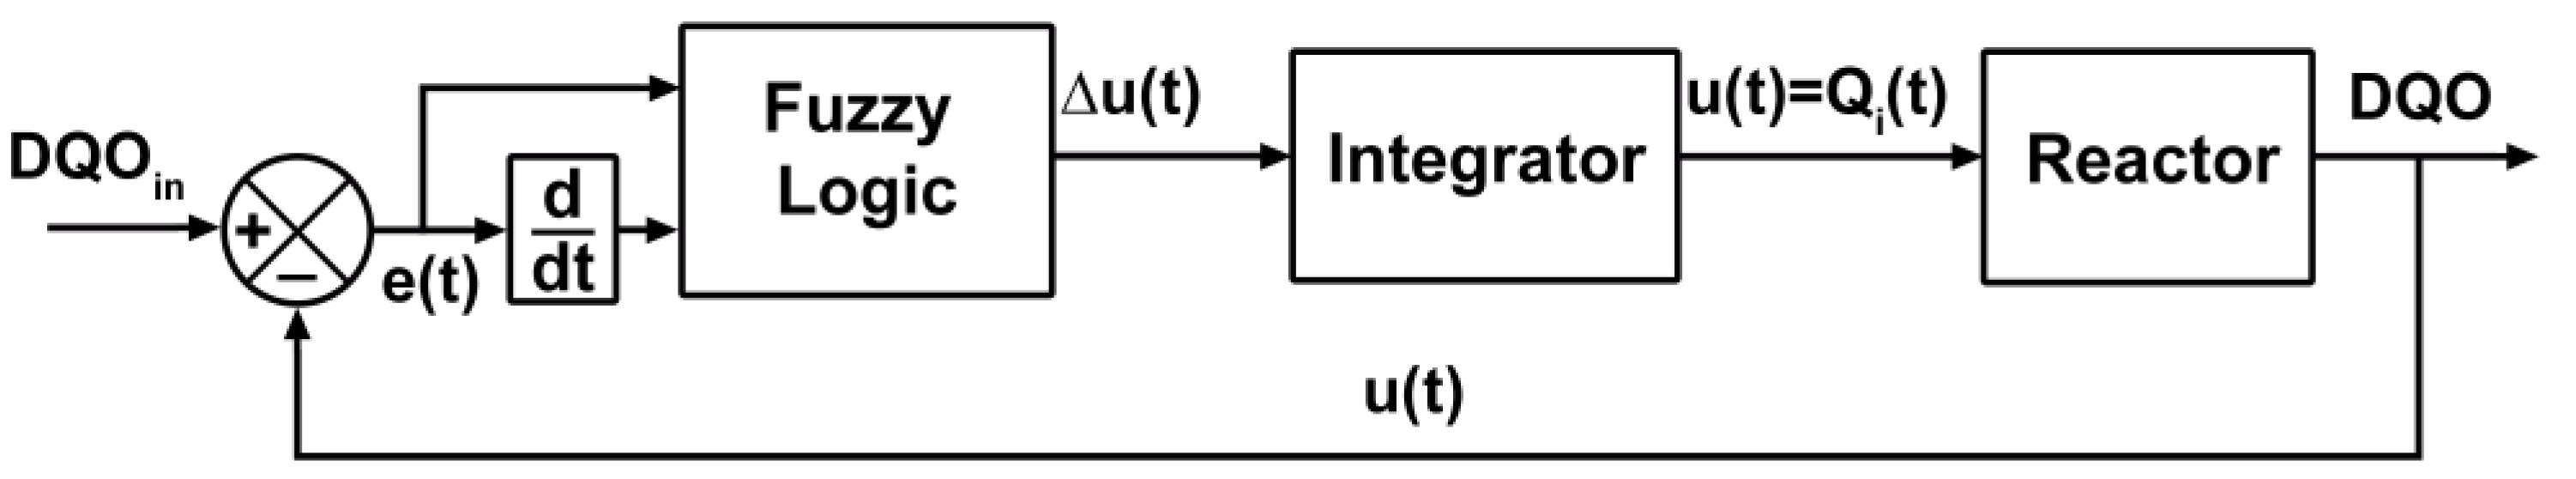
2.2. Description of the Fuzzy Logic PI Type Controller
The fuzzy logic PI-type controller is commonly used to design a robust controller for ensuring suppression of disturbances. In a fuzzy PI-type controller (
Figure 3), its nonlinear mapping between the control rules and the fuzzy reasoning can be represented as a function of the error e and the first-time derivative of the error ∆e as follows:
where ∆u is the first-time derivative of the output control action. ∆u can be expressed approximately as follows:
where −Se < e(t) < Se, −S∆e < ∆e(t) < S∆e, −S∆u < ∆u(t) < S∆u, or
where kp = S∆u /S∆e and ki = S∆u/Se.
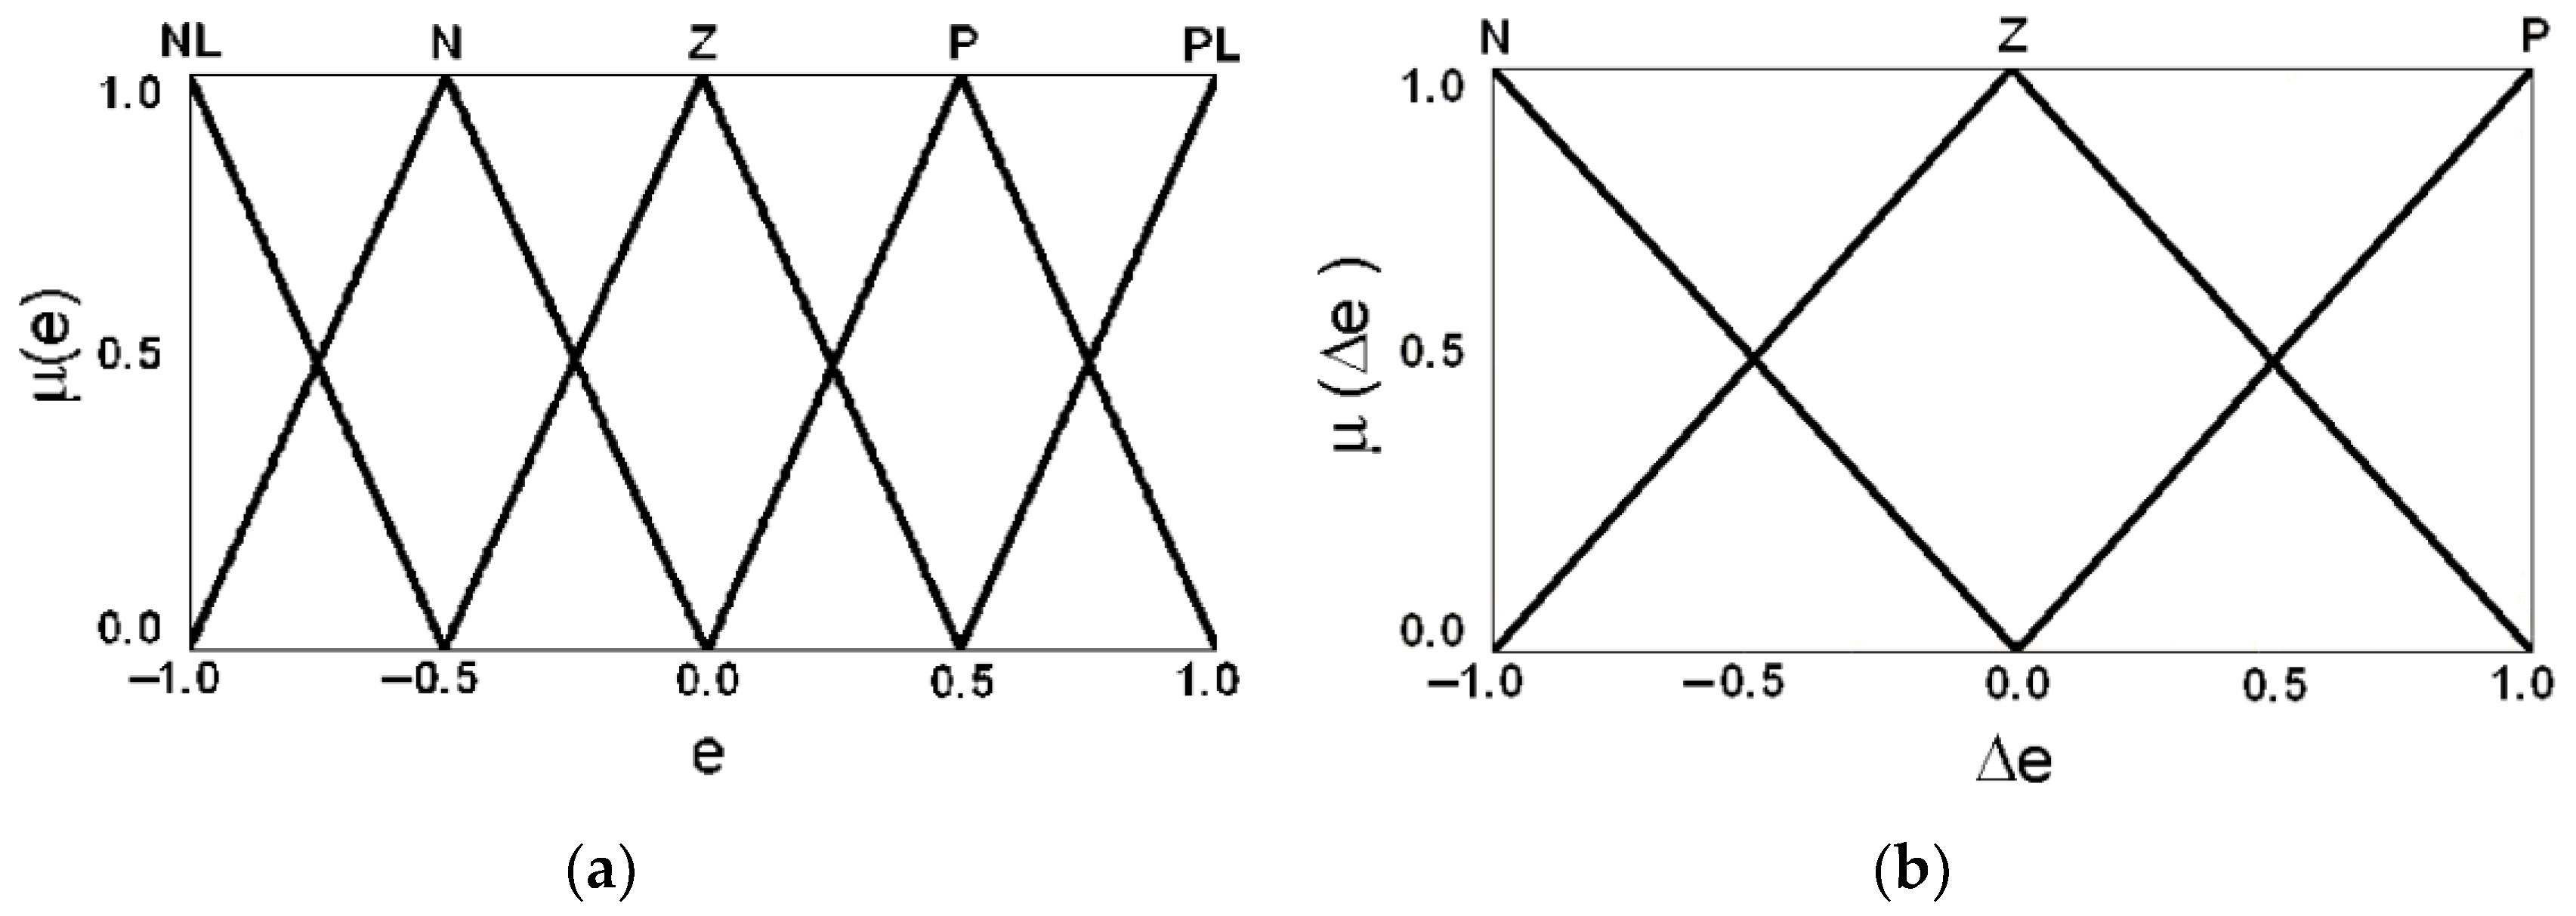
The membership functions for the inputs e and ∆e are defined in the range (−1, 1), see
Figure 4a,b, respectively. The fuzzy subsets are defined as follows: NL: negative large; N: negative; Z: zero; P: positive; and PL: positive large, for the input e. N: negative; Z: zero; and P: positive; for the input ∆e.
The membership functions for the output ∆u are defined in the range (−1, 1), see
Figure 5. The fuzzy subsets for the output ∆u are defined as follows: NL: negative large; NM: negative medium; NS: negative small; Z: zero; PS: positive small; PM: positive medium; PL: positive large; for the output ∆u.
2.3. Description of Software Sensor Based on Artificial Neural Networks
An artificial neural network was developed to find a relationship between pH, influent COD concentration, bioreactor inflow and the signal coming from each of the conductivity sensors installed inside the reactor to estimate the effluent COD concentration, the biogas production flow rate of the bioreactor (the sum of methane and carbon dioxide production), the methane production flow rate, the carbon dioxide production flow rate and the concentration of volatile fatty acids in the reactor effluent. The neural network was trained from hundreds of experimental tests performed on the bioreactor to relate biogas production to fluidized bed expansion, based on signals from each of the three bioreactor conductivity sensors.
The implementation of the artificial neural network was performed on an embedded electronic system (Raspberry Pi 4), both working together in real-time. This device was selected because it is a low-cost embedded system that does not require a computer to perform its work.
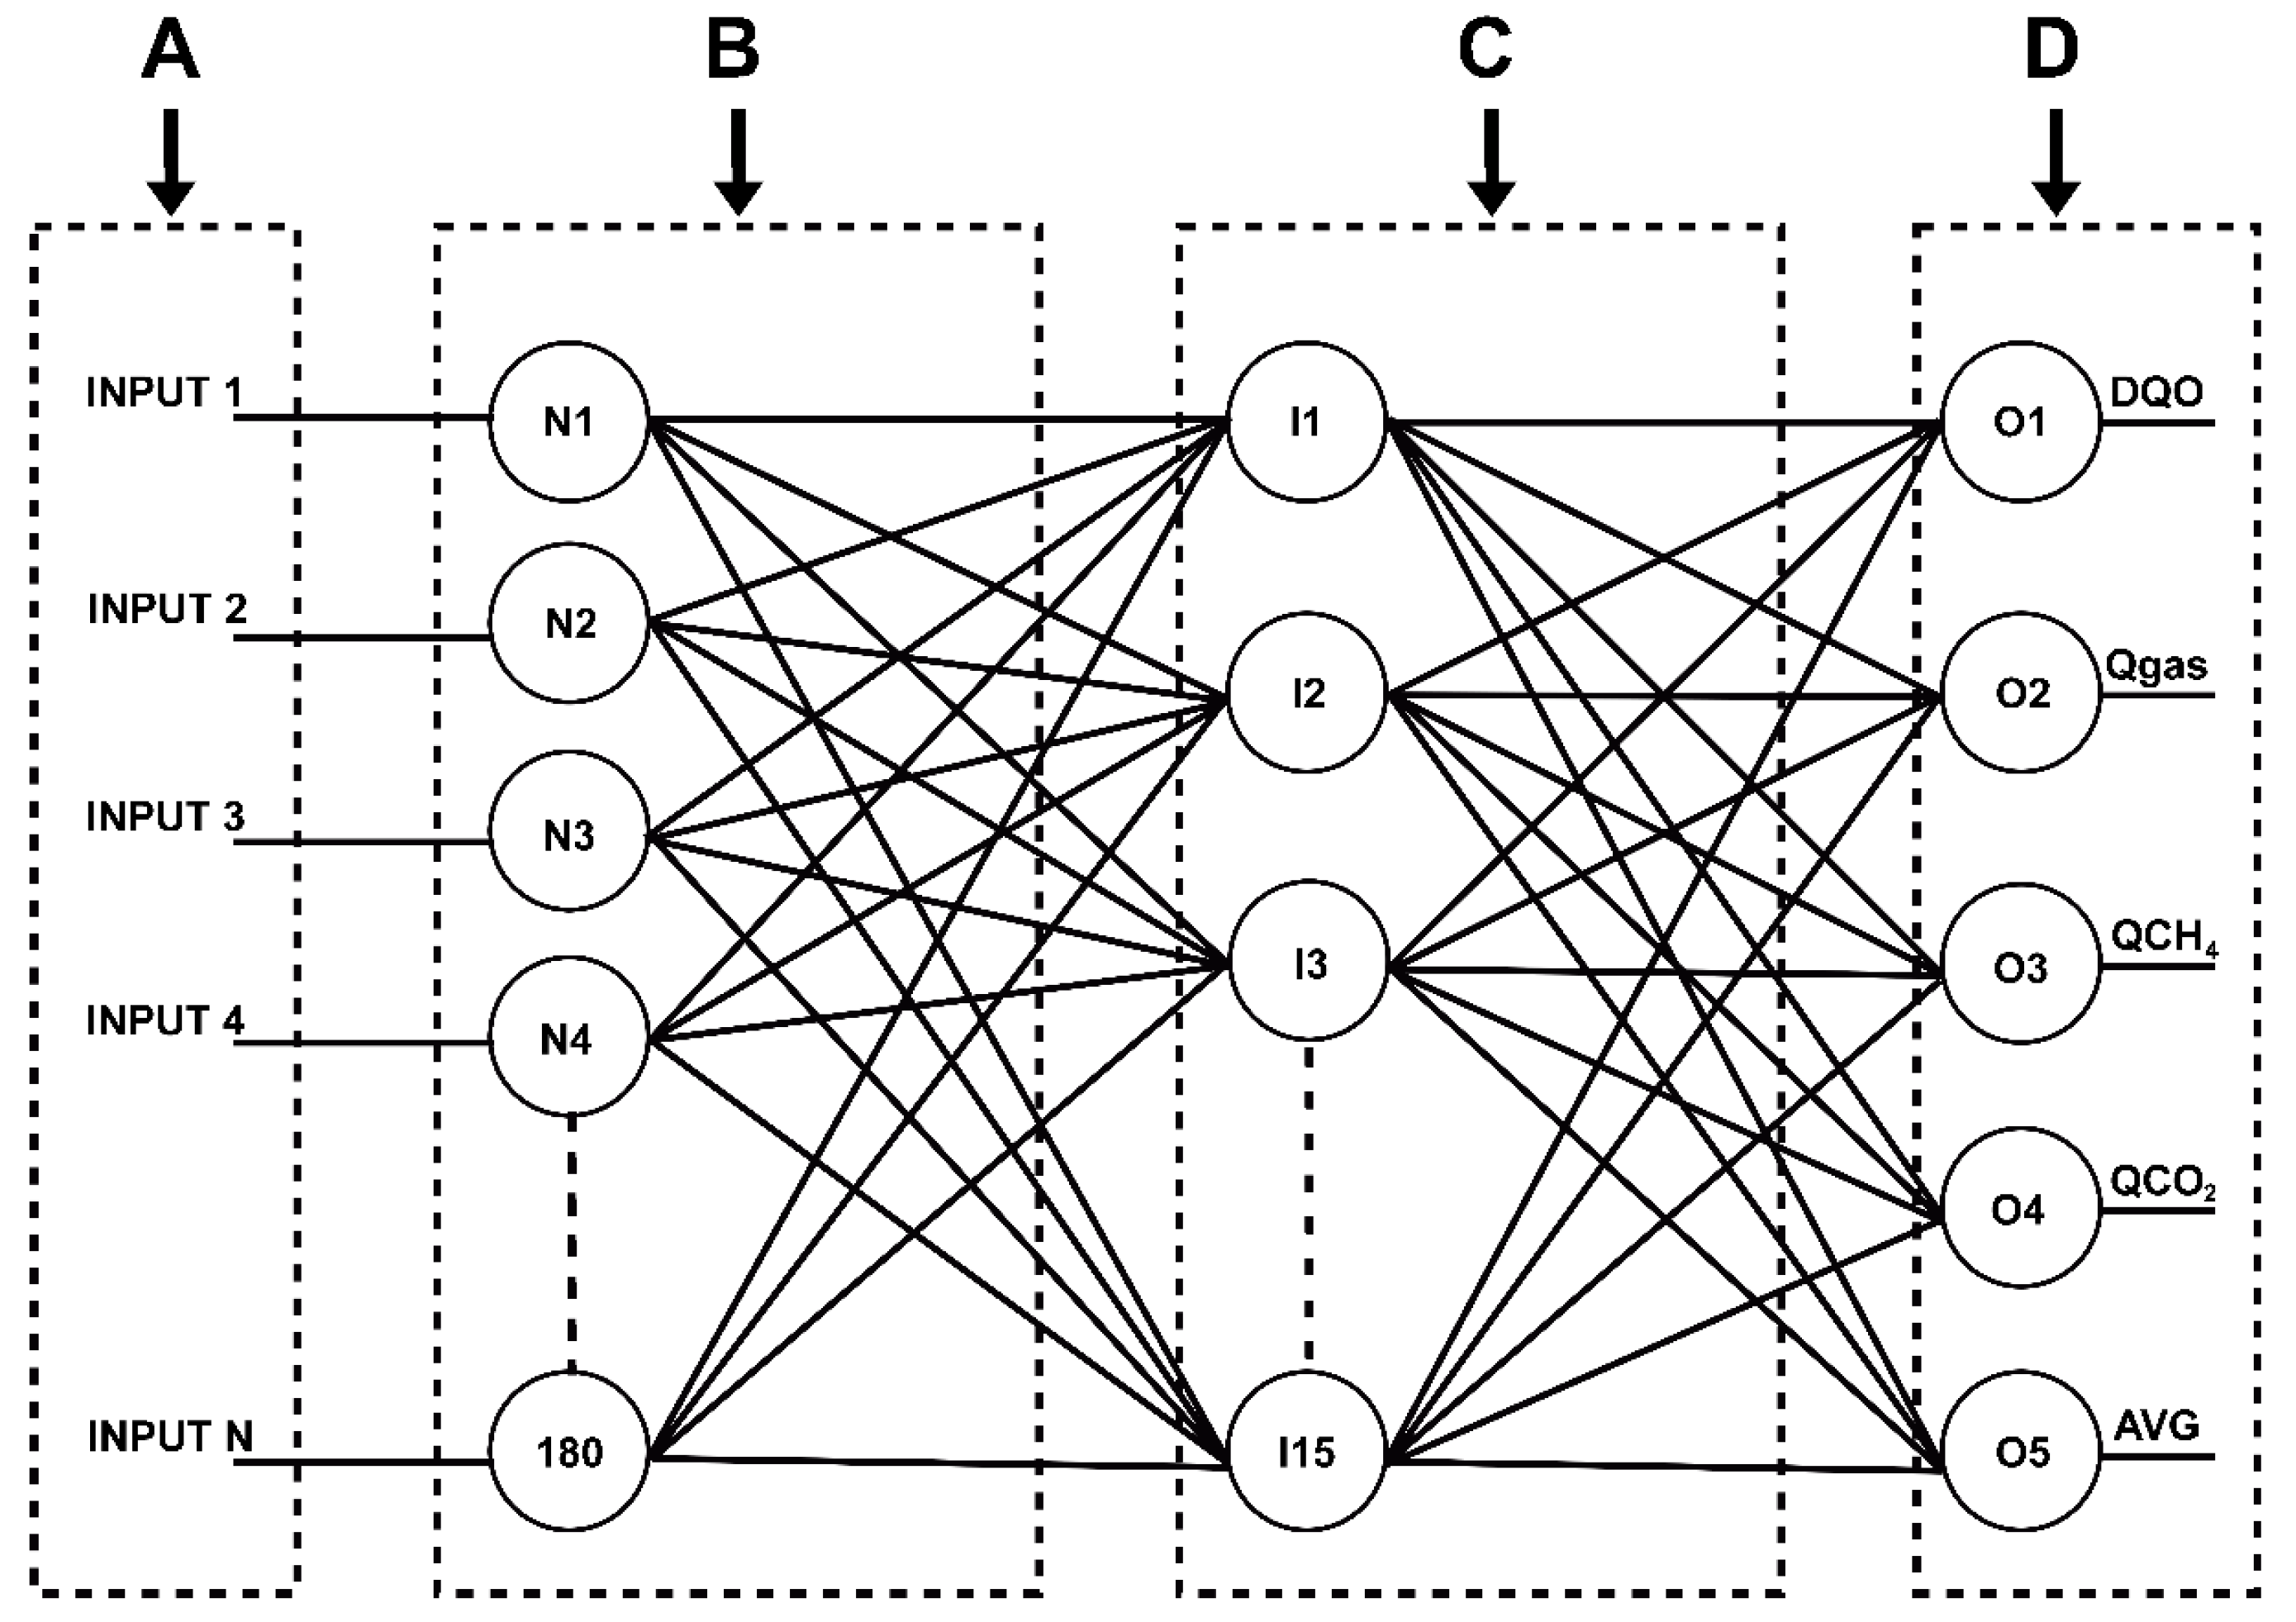
Figure 6 shows how the neural network was trained from the results obtained from the experimental tests performed with the bioreactor. The values of pH, COD concentration of the influent, inflow to the bioreactor and the signal coming from each of the conductivity sensors installed inside the reactor, during each of the experiments performed with the bioreactor, correspond to the input vector (A) of the neural network. This input vector contains 180 data points corresponding to the pH values, COD concentration of the influent, inflow to the bioreactor and the signal coming from each of the conductivity sensors installed inside the reactor during 6 months of experimental tests. There are 180 input neurons (B), which are connected to the neurons of the intermediate layer (C), and these neurons of the intermediate layer are connected to the output neurons (D), which generate the output signals estimated by the neural network, corresponding to the COD concentration of the effluent, the biogas production flow rate of the bioreactor (the sum of methane and carbon dioxide production), the methane production flow rate, the carbon dioxide production flow rate and the concentration of volatile fatty acids in the reactor effluent.
The objective of training the neural network is to make it capable of learning the relationship between the outputs and the input, so that when a new experiment is performed with the bioreactor, a new sample of pH, COD concentration of the effluent, inflow to the bioreactor and the signal coming from each of the conductivity sensors installed inside the reactor will be introduced into the neural network and it will be able, from its learning, to estimate the concentration values of the COD concentration of the effluent, the flow of biogas production from the bioreactor and the signal coming from each of the conductivity sensors installed inside the reactor that is introduced into the neural network and the neural network is able, based on its learning, to estimate the concentration values of the effluent COD concentration, the bioreactor biogas production flow (the sum of methane and carbon dioxide production), the methane production flow, the carbon dioxide production flow and the concentration of volatile fatty acids in the reactor effluent.
One of the primary objectives of this section is to statistically validate the neural networks used to determine the output signals. One of the big questions that always has to be solved when working with neural networks is to know what the number of neurons in the intermediate layer or layers required for its error in the output to be optimal is. To achieve this objective, an automatic algorithm had to be developed to analyze the behavior of the network under different configurations of neurons in hidden layers.
In total, there are 180 data points from each of the 6 input signals to the neural network, which provides us a matrix of 1080 data points, which should generate a correlation with the data obtained in the experimental tests of the anaerobic reactor. Using the 180 data points from each of the 6 input signals to train an artificial neural network can result in an incorrect training of the network, because many of these variables may not have significant relevance. For this reason, a preprocessing of these data was performed to know the variance and correlation of the data in order to reduce the dimensionality of the input vector to the neural network. A PCA is a statistical methodology that performs a linear transformation through the creation of a new coordinate system for the input data, in which, on its axes, it places the data ordered from the highest variance to the lowest variance. In general terms, what a PCA does is create a new system in which it orders the data from most relevant to least relevant, thus reducing the dimensionality of the data.
A PCA was programmed using MATLAB software, using the 1080 data points of the input matrix, which corresponds to 180 dimensions for 6 input signals. According to the results of the PCA, statistically speaking, and looking at its percentage of re-relevance, the first 8 columns of the principal components were selected since they are the most important data. With this dimensional reduction, the training input vector used in the neural network was 8 dimensions.
A neural network was modeled with the 8 input data coming from the dimensional data reduction obtained by the PCA and experimented on with different configurations related to the number of hidden layers and number of neurons in the hidden layer. This neural network delivers 5 outputs as a result, which are the estimation of the COD concentration values of the effluent, the biogas production flow rate of the bioreactor (the sum of methane and carbon dioxide production), the methane production flow rate, the carbon dioxide production flow rate and the concentration of volatile fatty acids in the reactor effluent.
Figure 7 and
Figure 8 show the structure of the neural network, composed of an input layer and an intermediate layer of neurons.
Figure 9 shows the behavior of a neural network using 5 neurons in the hidden layer of the neural network, obtaining a recognition error of 4.28%.
Figure 10 shows the behavior of the neural network using 15 neurons in the hidden layer with an error of 1.45%. The graphs show the target (the blue line) representing the ideal recognition value, and the circles in the graph are the actual recognition values obtained for each target value. It can be seen that the neural network with 15 neurons in the hidden layer has a lower recognition error (
Figure 10).
Figure 11 shows the behavior of the neural network focused on estimating the values of the conductivity sensors, S1, S2 and S3, from the values of pH, COD concentration of the influent and inflow to the bioreactor. In this regard, after evaluating multiple configurations of neurons in the intermediate layer, it was determined that the best performance was obtained with a neural network with 10 neurons in the intermediate layer.
After training the neural network and performing the behavioral tests, validation experiments were conducted to determine the margin of error of the neural network in comparison with the hardware sensors. In this regard, the margin of error was less than 2%, which allowed establishing the threshold values for the fault diagnosis scheme developed in this project.
The microcontroller was programmed for real-time execution of the neural networks. Blocks were used to map the input signals from −1 to 1, and a Math Script node was used in which all the weights of the network as well as all the mathematical formulation to run the network were found. This block is connected directly to the outputs of the hardware sensors, which delivers an input vector to the network with the values of pH, COD concentration of the influent, inflow to the bioreactor and the signal coming from each of the conductivity sensors installed inside the reactor.
4. Conclusions
A real application of a fuzzy controller to a nonlinear multivariable anaerobic reactor process was investigated; this controller provides a useful fault detection strategy when the mathematical model is not available. In addition, an artificial neural network capable of finding a relationship between pH, influent COD concentration, inflow to the bioreactor and the signal coming from each of the conductivity sensors installed inside the reactor was developed to estimate the effluent COD concentration, the biogas production flow rate of the bioreactor (the sum of methane and carbon dioxide production), the methane production flow rate, the carbon dioxide production flow rate and the concentration of volatile fatty acids in the reactor effluent. The neural network was trained from hundreds of experimental tests performed on the bioreactor to relate biogas production to fluidized bed expansion, based on signals from each of the three bioreactor conductivity sensors.
In addition, the information obtained by this system allows not only to detect and isolate failures that may occur in the sensors during the anaerobic digestion process, but the information obtained from them can also be used as virtual sensors, as there are observers that are not affected by certain faults, which allows the controller to continue operating and leads to corrections in the physical sensor. This is vital in the case of bioreactors, due to their nature and the diverse conditions necessary for their operation, since stopping the process could reduce the population of biomass responsible for the processes of acidogenesis and methanogenesis that allow the production of biogas to an unacceptable minimum, and in an extreme case would require restarting the bioreactor, which would mean months of work.
In this work, the problem regarding the lack of online sensors to measure variables in anaerobic reactors was presented; in this case, we considered a sensor to measure the level of the reverse fluidized bed [
1]; for a hybrid reactor reverse fluidized fixed bed, an original design of the Tecnológico Nacional de México Campus Orizaba—using this sensor as a basis—a control system and fault diagnosis based on artificial intelligence was made for the generation of condition-based maintenance.
An artificial intelligence strategy approach was used as an estimator, predictor and controller, as shown in this research.


 ,
, 


