
Measuring Brain Activation Patterns from Raw Single-Channel EEG during Exergaming: A Pilot Study


Abstract
1. Introduction
2. Materials and Methods
2.1. Subjects
2.2. Data Acquisition Protocol
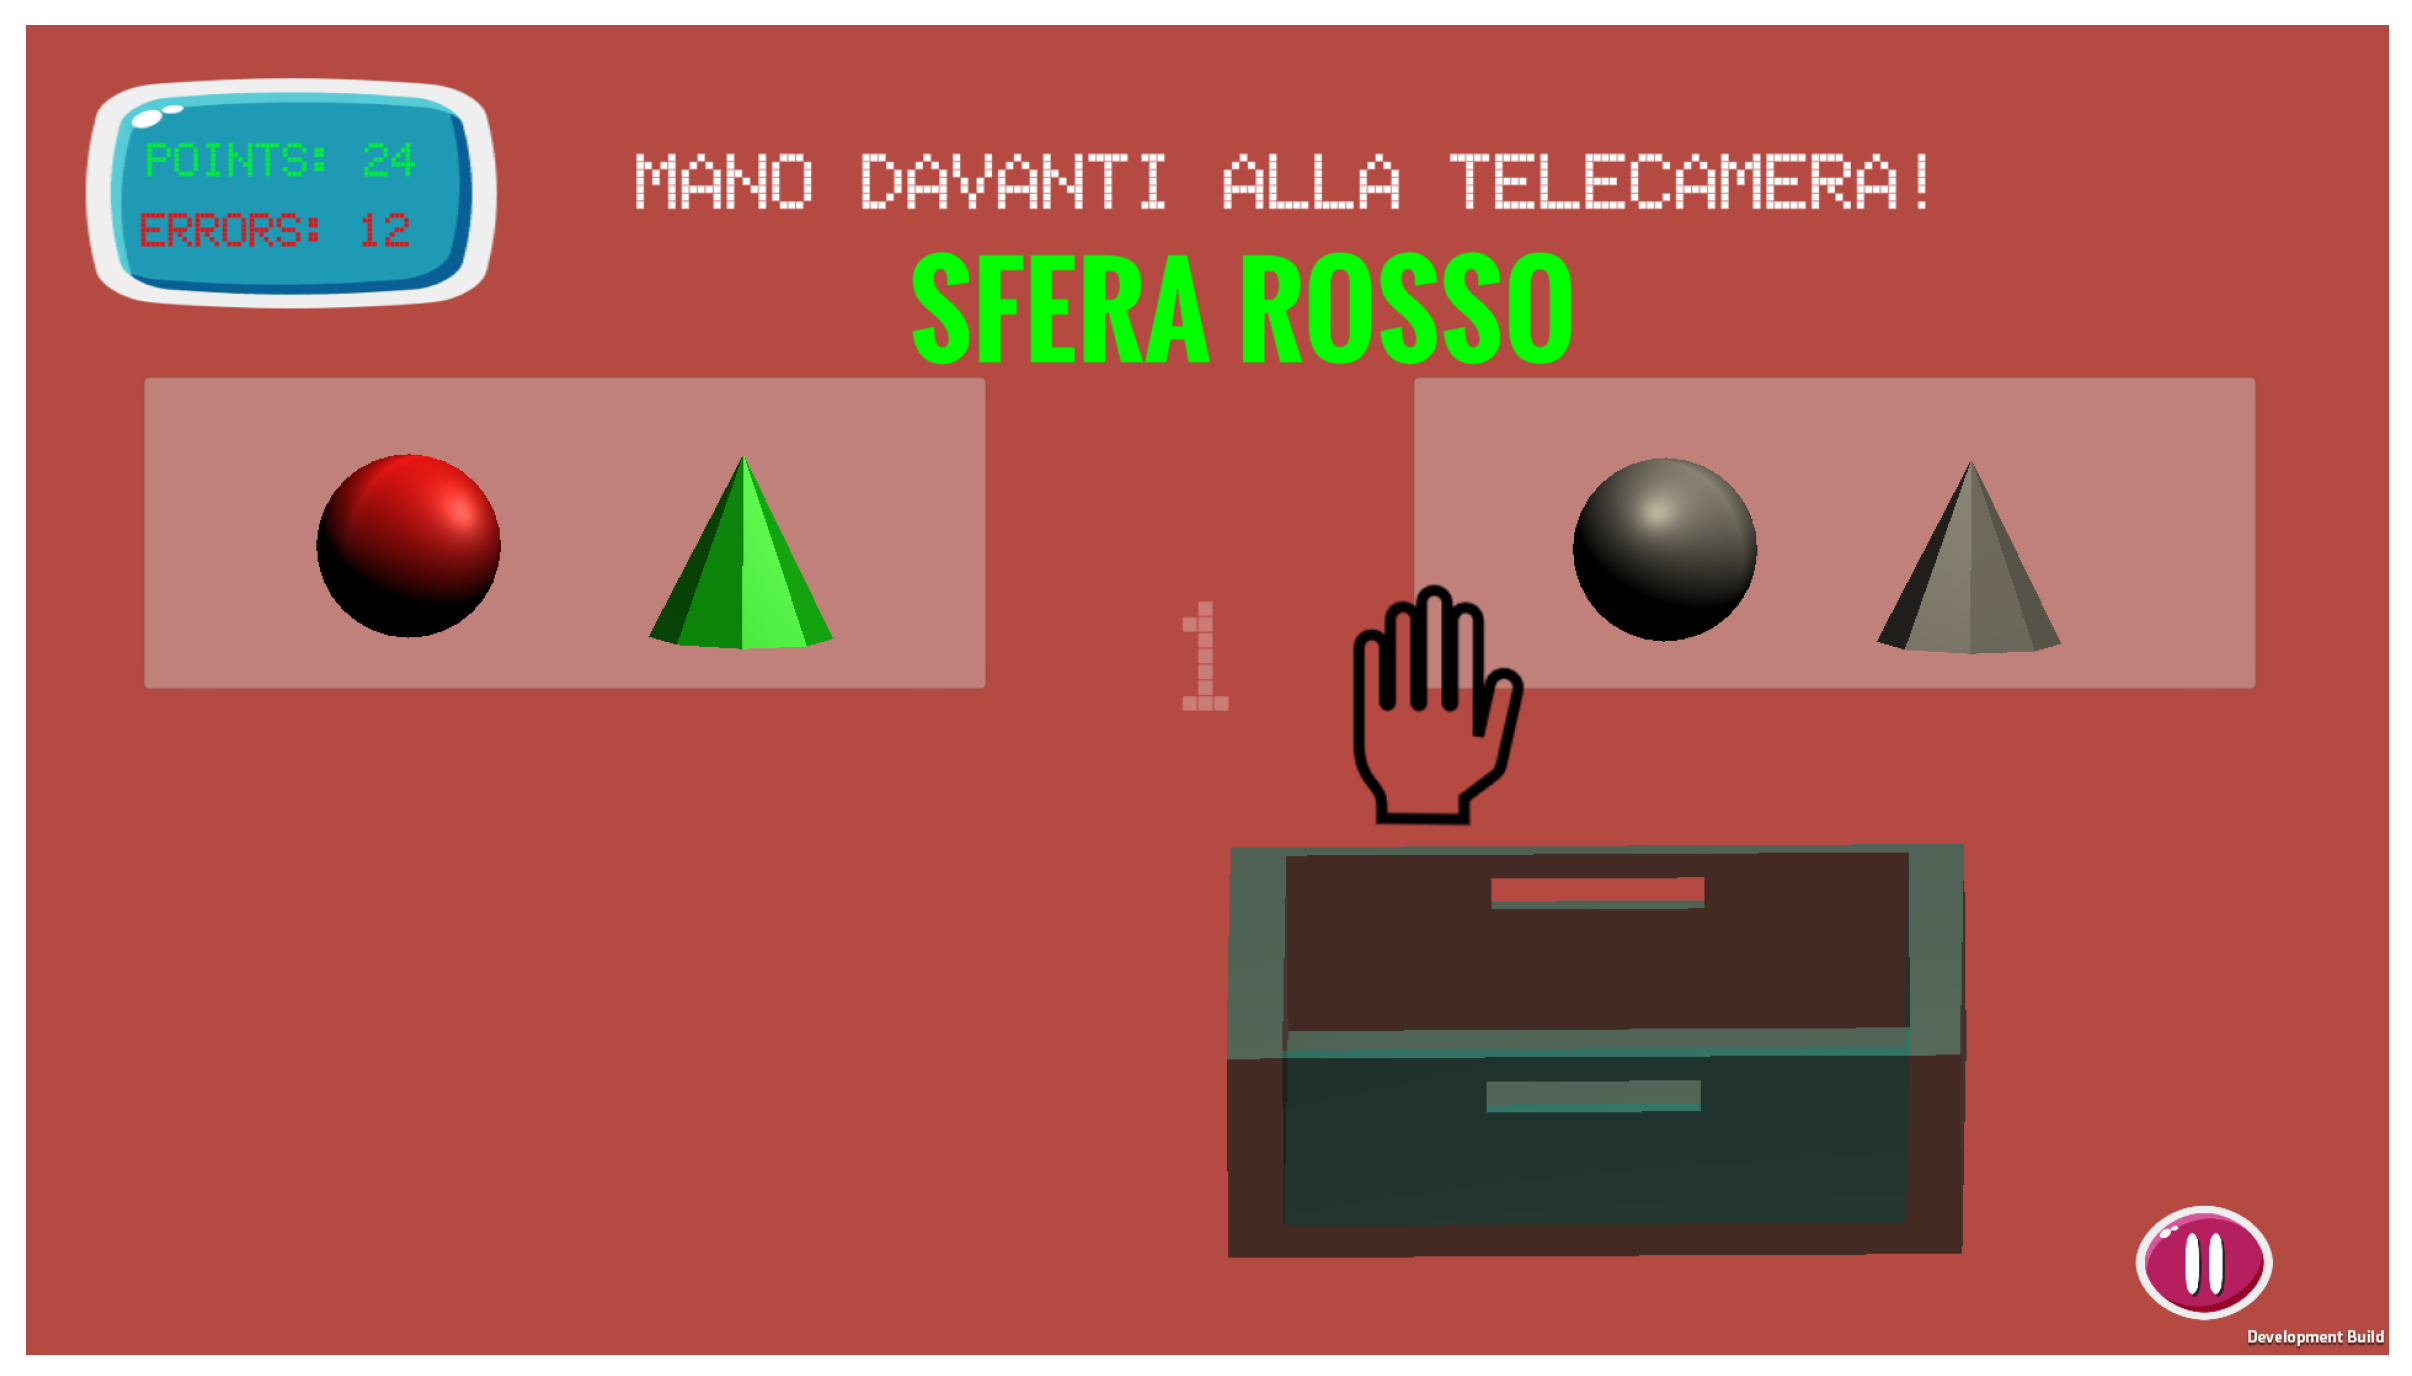
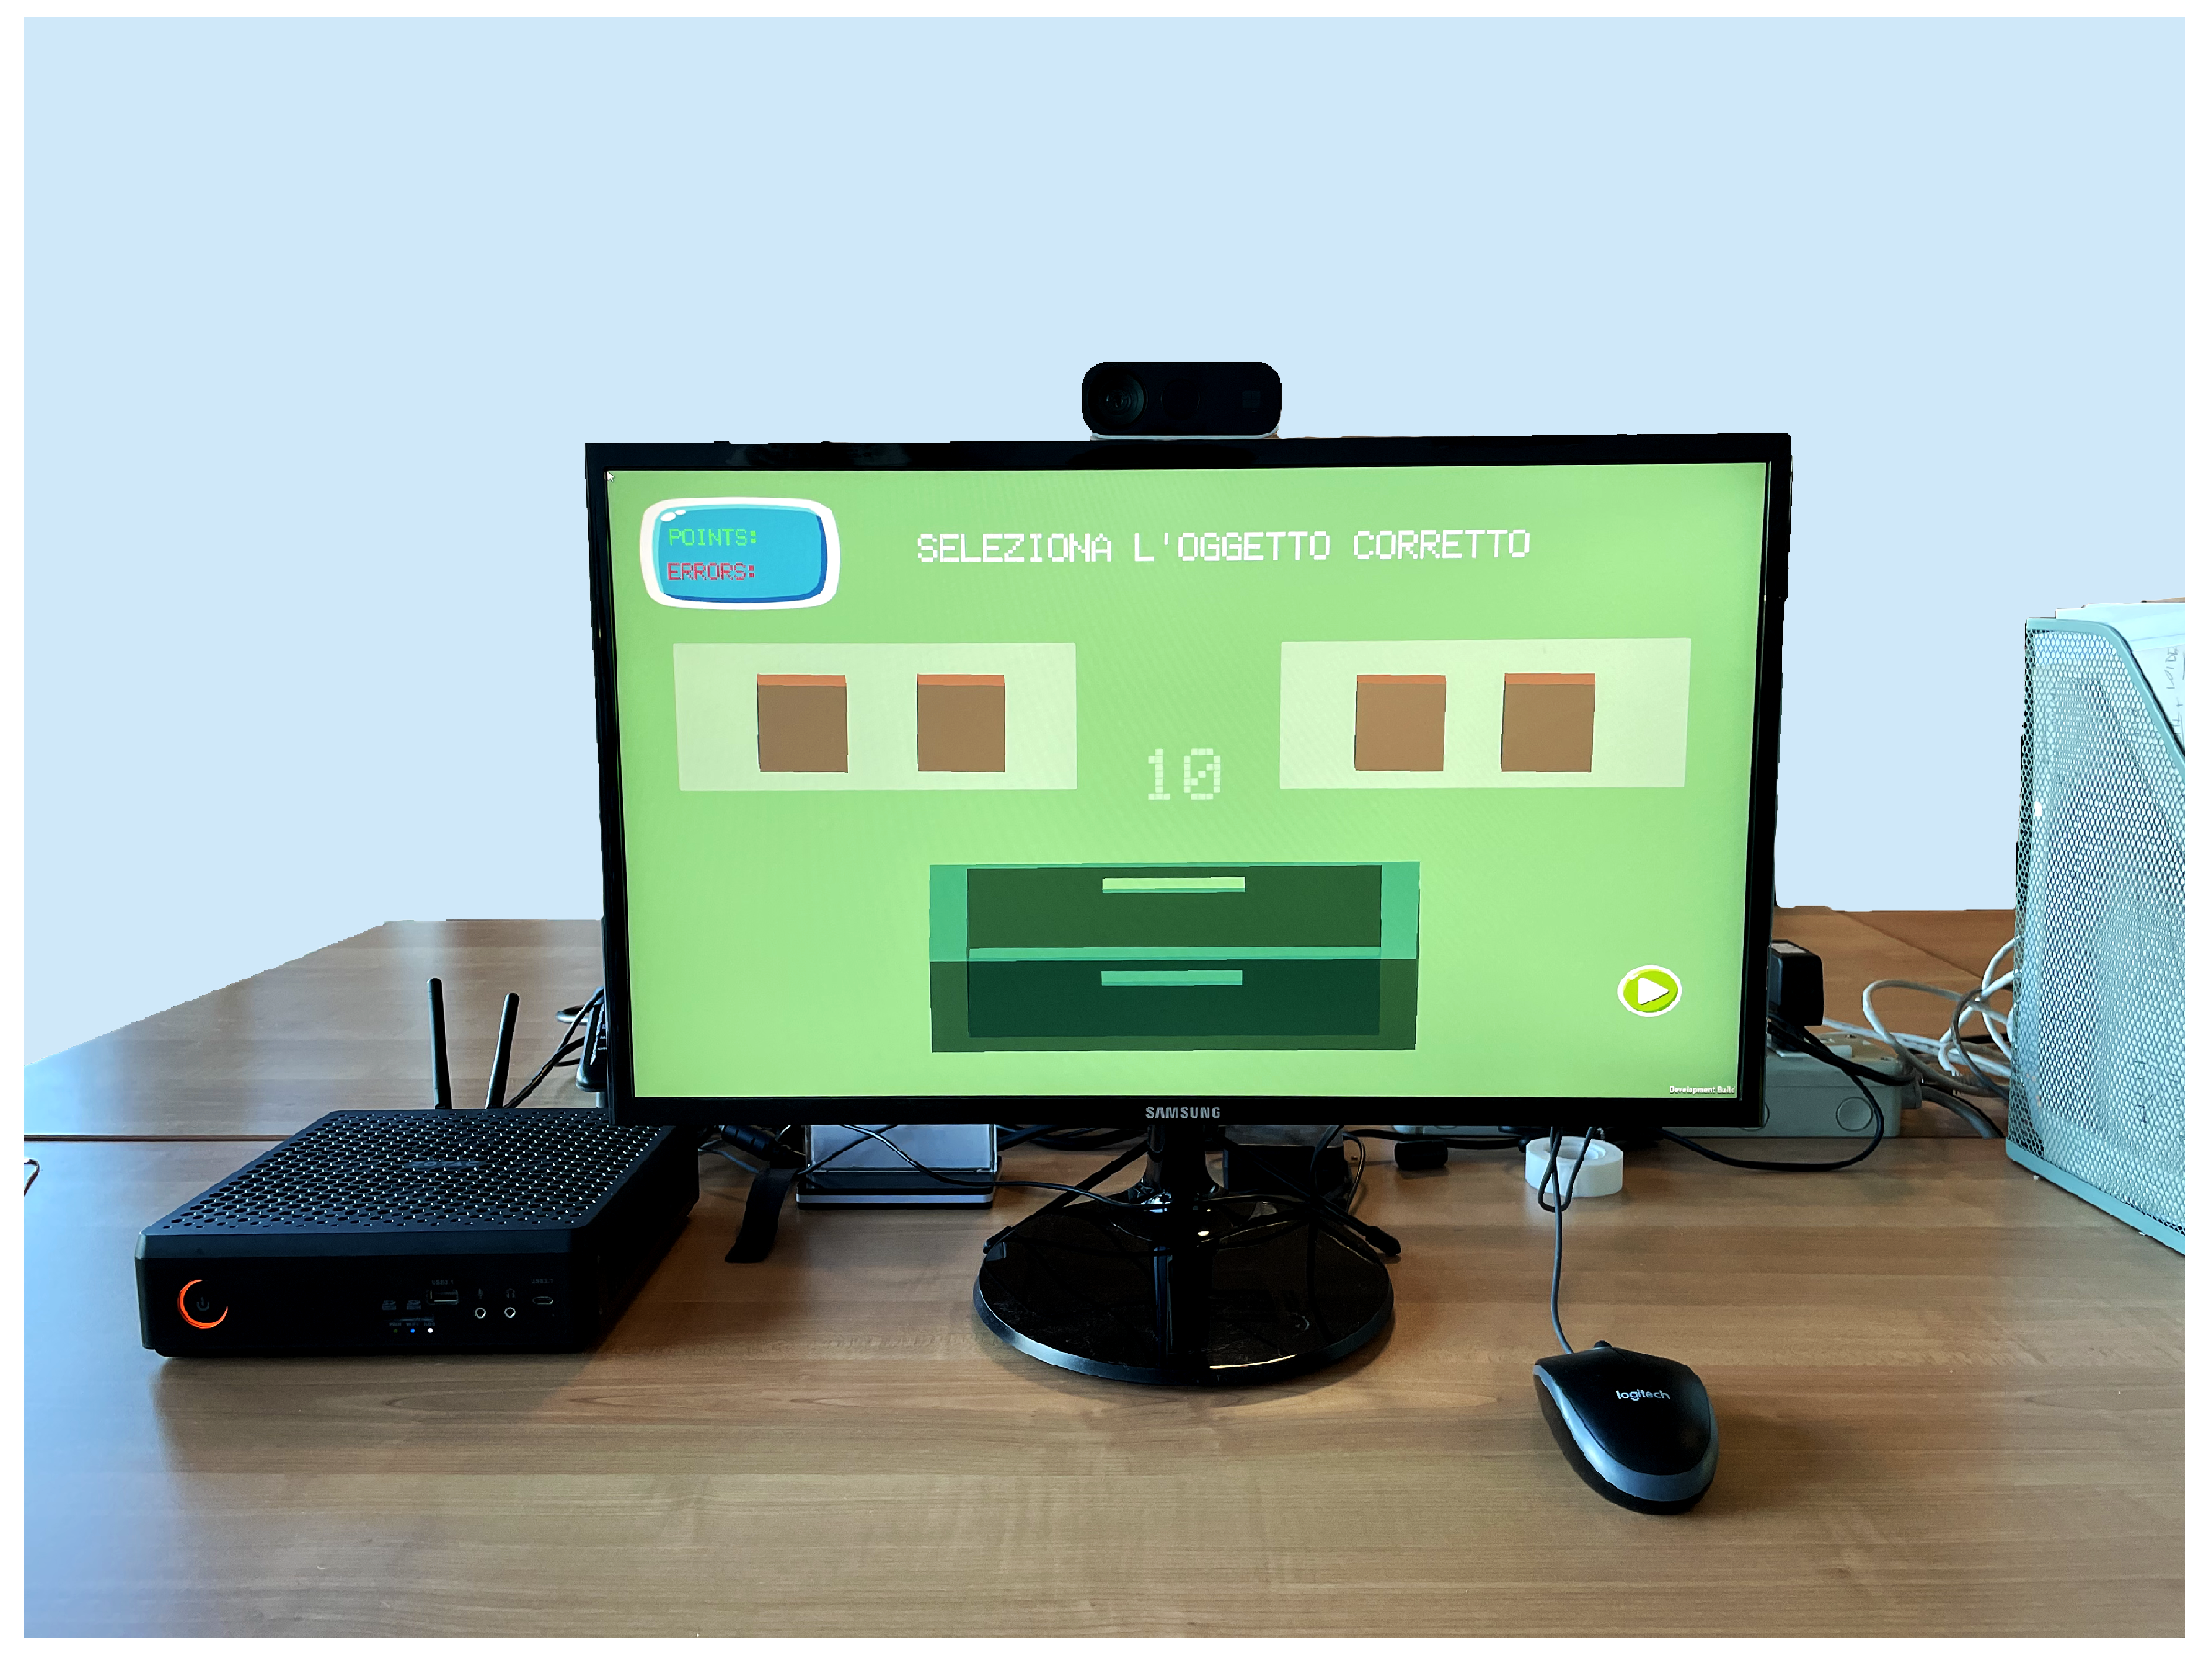
2.3. The Grab-Drag-Drop Exergame
- Level 1 (L): it is designed as a tutorial level, to become acquainted with the task and the game environment. Each GDD execution can last up to 10 seconds, and background music is played at a normal pace. All objects are cubes; the discriminating factor in the selection of the correct one is only the colour, which is not repeated among the displayed objects. Six selections must be performed in sequence.
- Level 2 (L): it introduces new possible shapes besides the cube. Colours and shapes can be repeated among the objects, so the correct colour-shape combination has to be identified. Ten objects have to be selected, while the background music plays with a 1.2x speed factor.
- Level 3 (L): this level introduces a Stroop-Test-like [65] challenge in the recognition of the correct object. In fact, the written message onscreen can appear with a non-matching colour, e.g., the message could ask the user to select the red object while being written in yellow. The time to select each of the 10 correct objects is reduced to 6 seconds, while the music is sped up by a 1.5x factor.
- Level 4 (L): this level is the most difficult one. Besides the challenges of the previous levels, the collecting box is now moving. Hence, the player has to select not only the correct object, but also the correct timing for dropping it. The time for each GDD executions is kept at 6 s as in L, whereas the background music is played at 2x.
2.4. Questionnaires
2.4.1. NASA Task Load Index
- Mental Demand: Extent of mental activity required by the task.
- Physical Demand: Extent of physical activity required by the task.
- Temporal Demand: Extent of time pressure felt by the subject, due to the task pace or the pace at which the task elements occurred.
- Overall Performance: Self-perceived success and satisfaction with the performance.
- Effort: Extent of mental and physical workload required to accomplish the level of performance.
- Frustration Level: How irritated or frustrated the subject felt during the task.
2.4.2. TRESCA: Task-Related Scale
2.5. Instrumentation
2.5.1. Azure Kinect
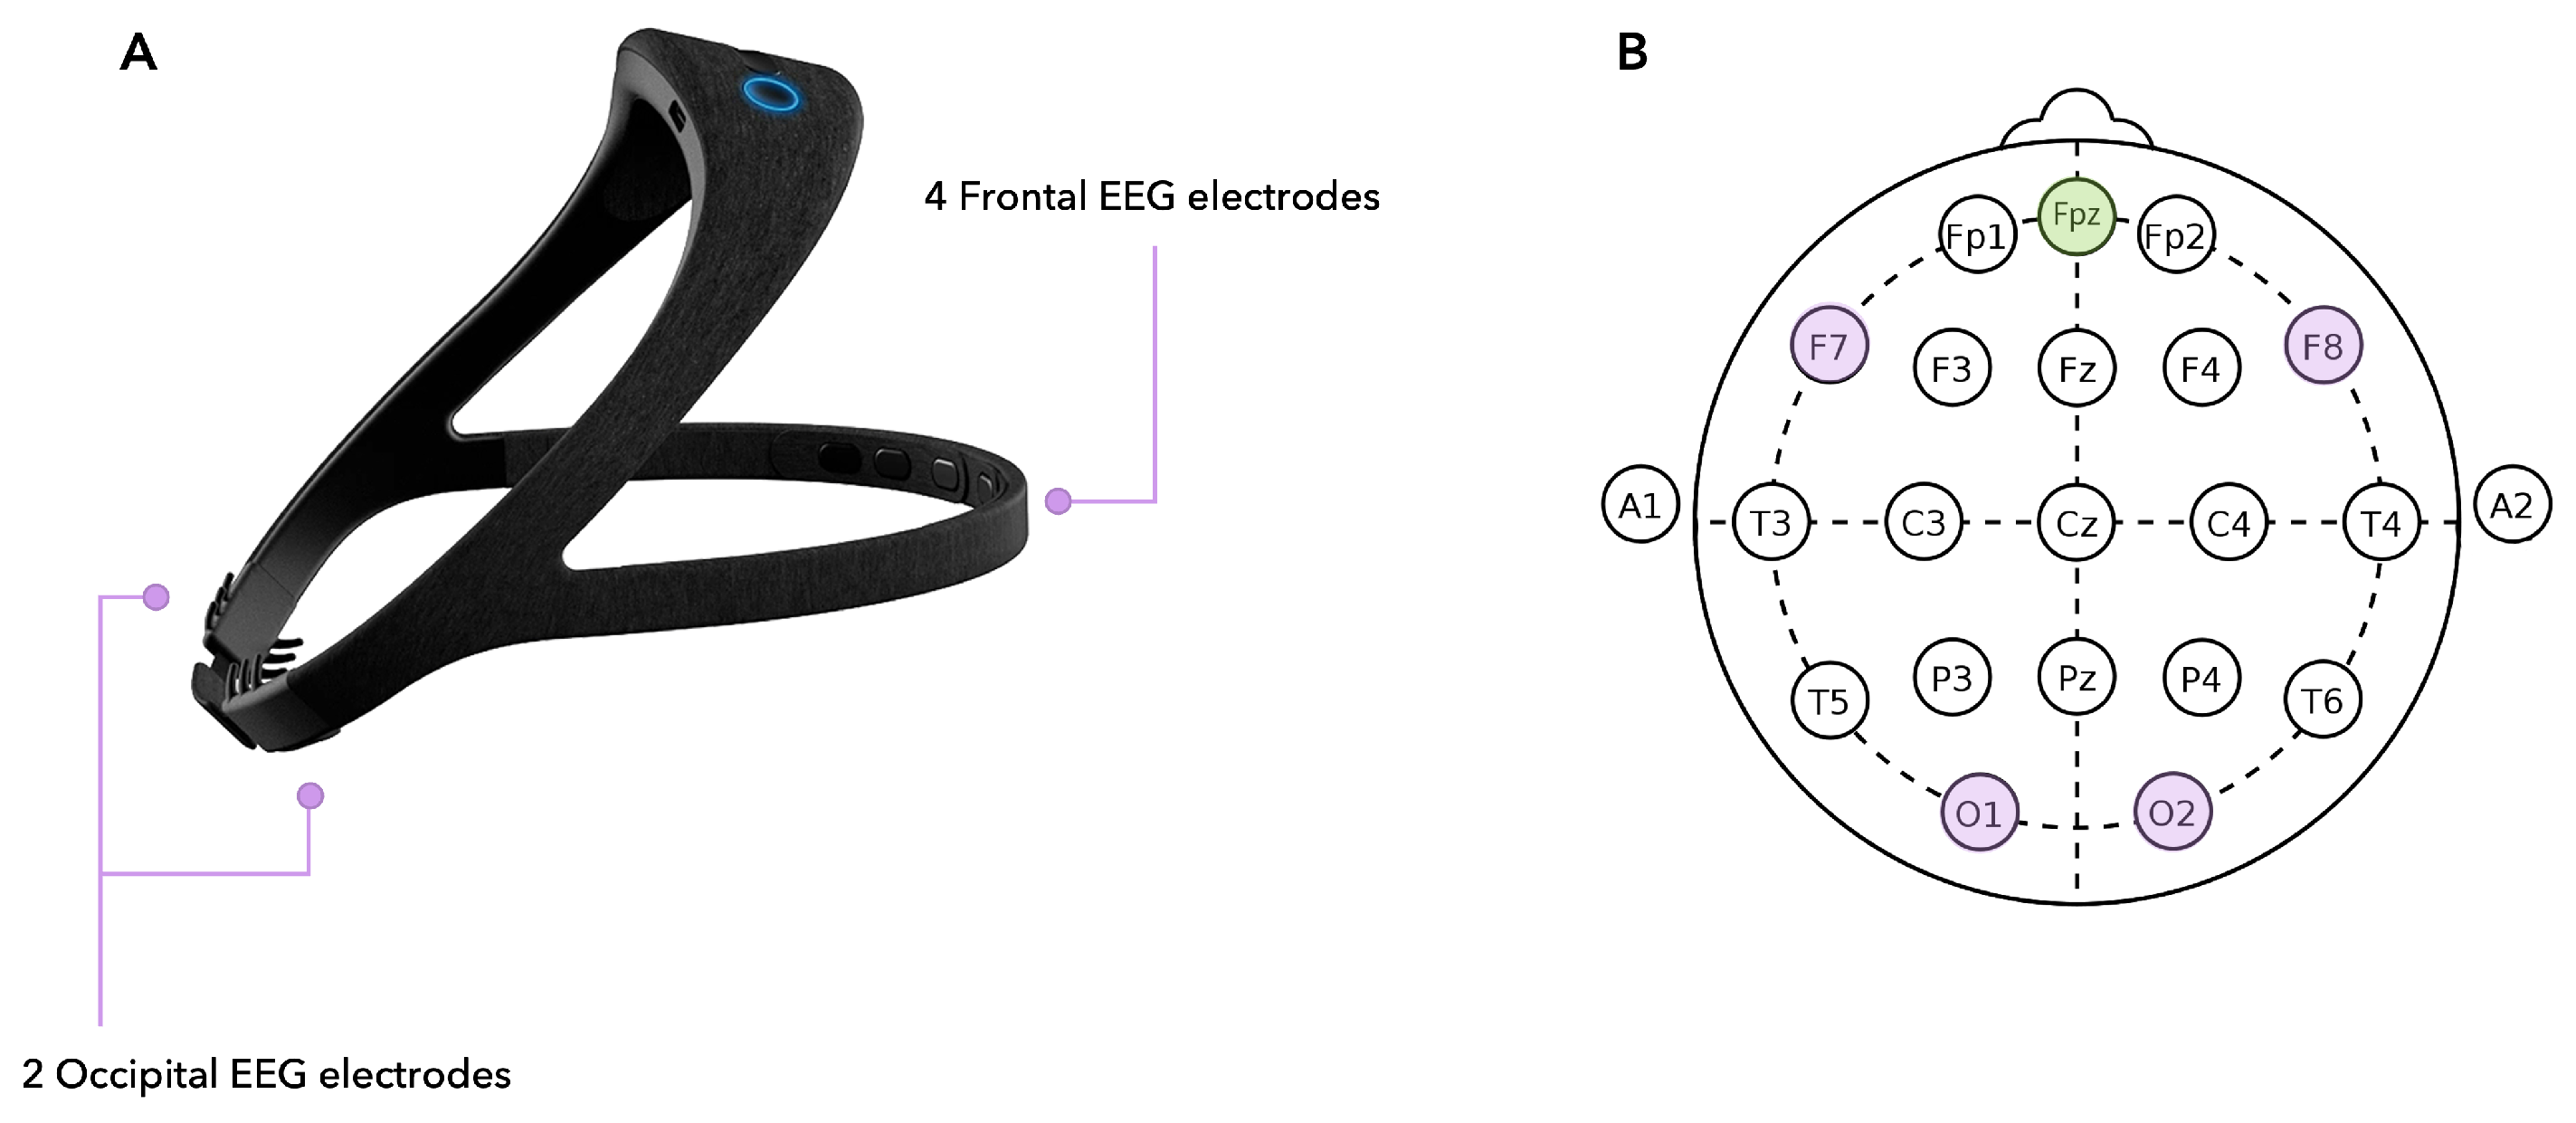
2.5.2. EEG Headset
2.6. Data Pre-Processing
2.6.1. EEG Data
2.6.2. Video Recordings for Offline Blink Detection
2.7. Feature Extraction
- Rest: Features are extracted from the whole rest period preceding the game;
- Game: Features are extracted from the whole exergame, from start to end (with no level distinction);
- Levels: Features are extracted from each single level.
2.7.1. EEG Features
2.7.2. Eye Blinking
2.8. Statistical Analysis and Feature Selection
2.9. Automatic Classification of Mental Activation
- (1) Rest vs. Game: binary classification between the rest stage and the task (whole exergame, levels 1 to 4);
- (2) Inter-Level Classification: 4-stage classification intended to detect the four levels designed in the exergame.
- Support Vector Machine (SVM): the model aims at finding the hyperplane that best separates the samples in the dataset according to their class.
- K-Nearest Neighbour (KNN): it is a non-parametric method that employs similarity measures to classify the elements in the dataset.
- Discriminant Analysis (DA): it is a multi-variate data analysis technique that aims at finding the linear combination of features that best characterises the classes in the dataset.
- AdaBoost: it is an adaptive ensemble learning method based on Random Forest classifiers. In the binary classification configuration, it trains learners sequentially and, at each iteration, it updates the observation weights by increasing the weights of the misclassified ones and decreasing those of correctly classified.
2.10. Subjects’ Response to Levels Variation
3. Results
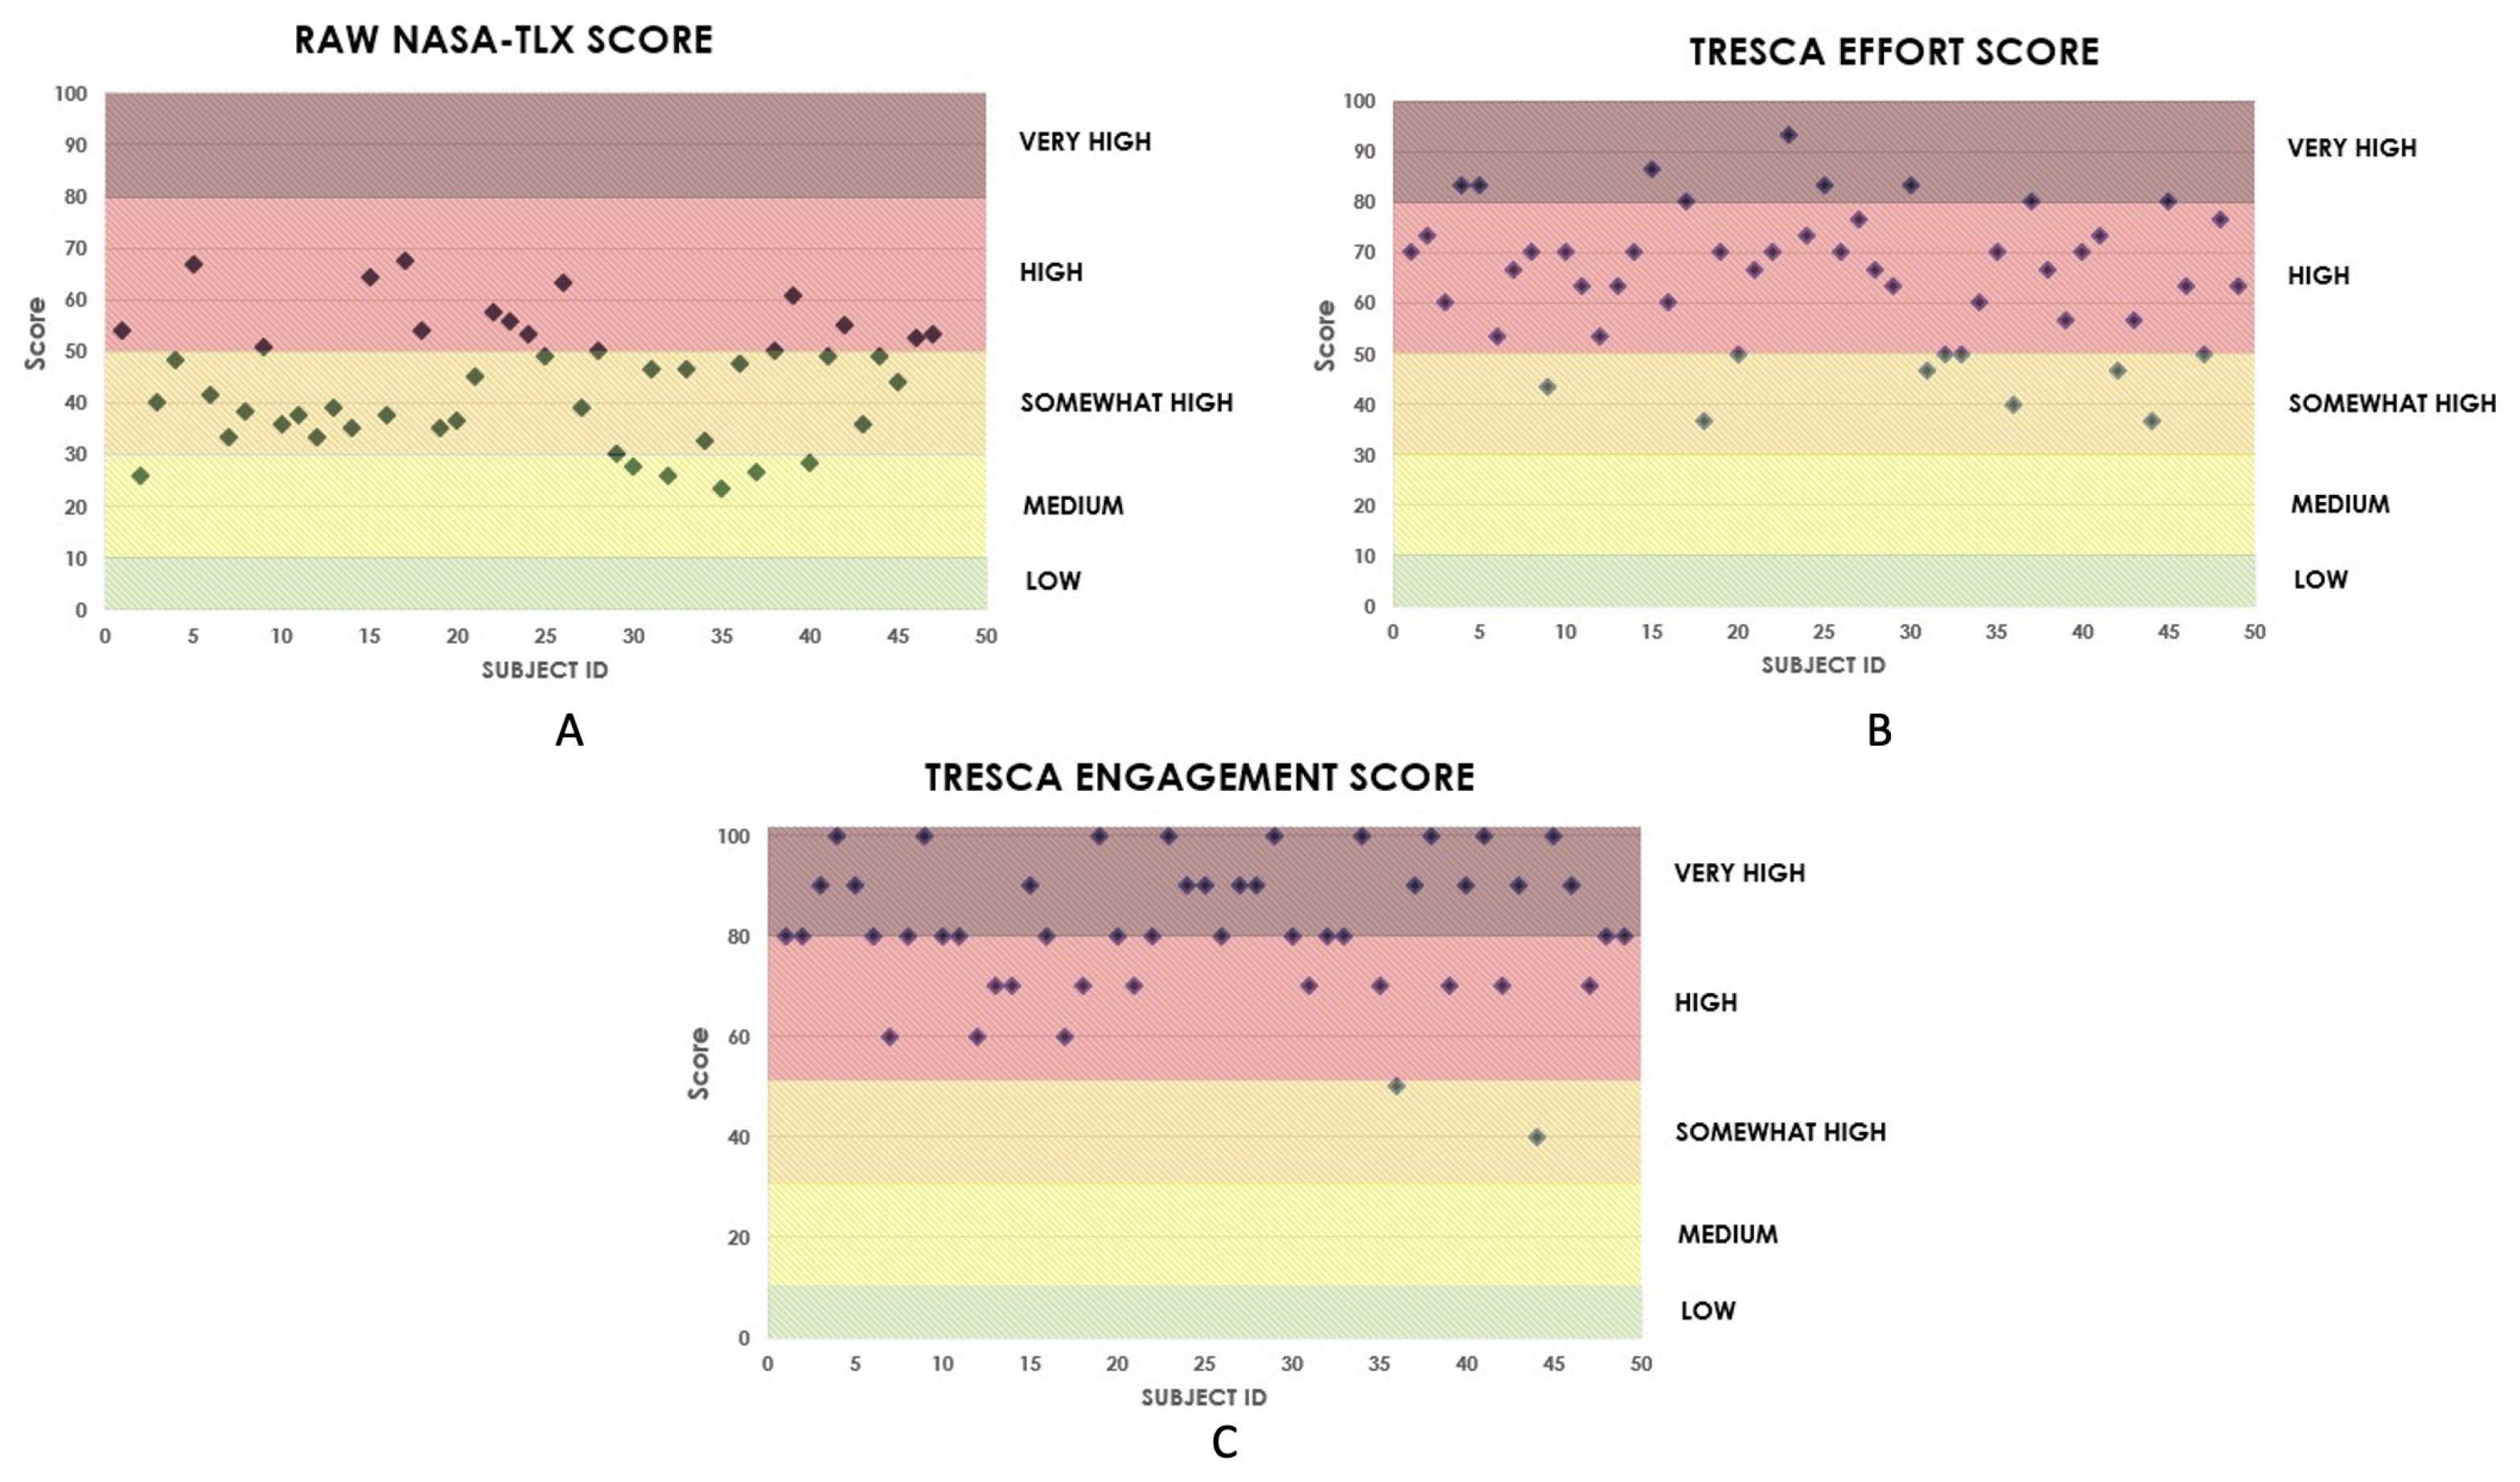
3.1. Exergame Validation
3.2. Feature Analysis: Statistical Analysis and Feature Selection Results
3.3. Automatic Classification Results
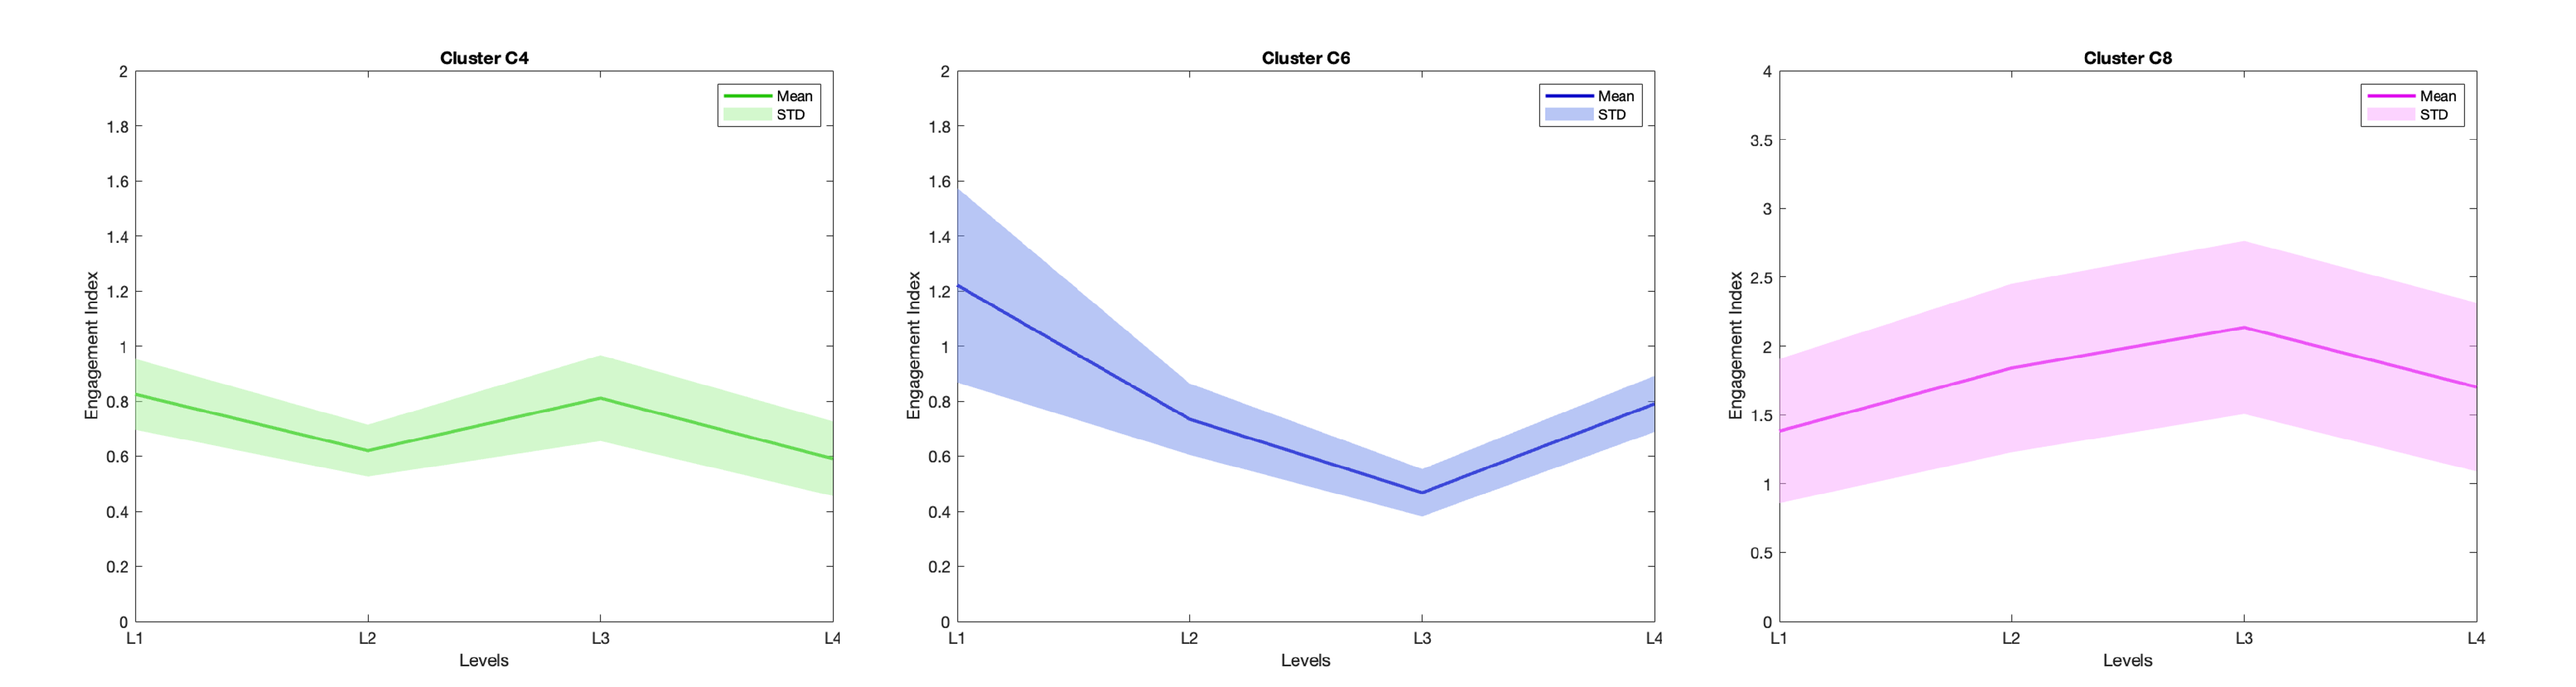
3.4. Subjects Response to Levels
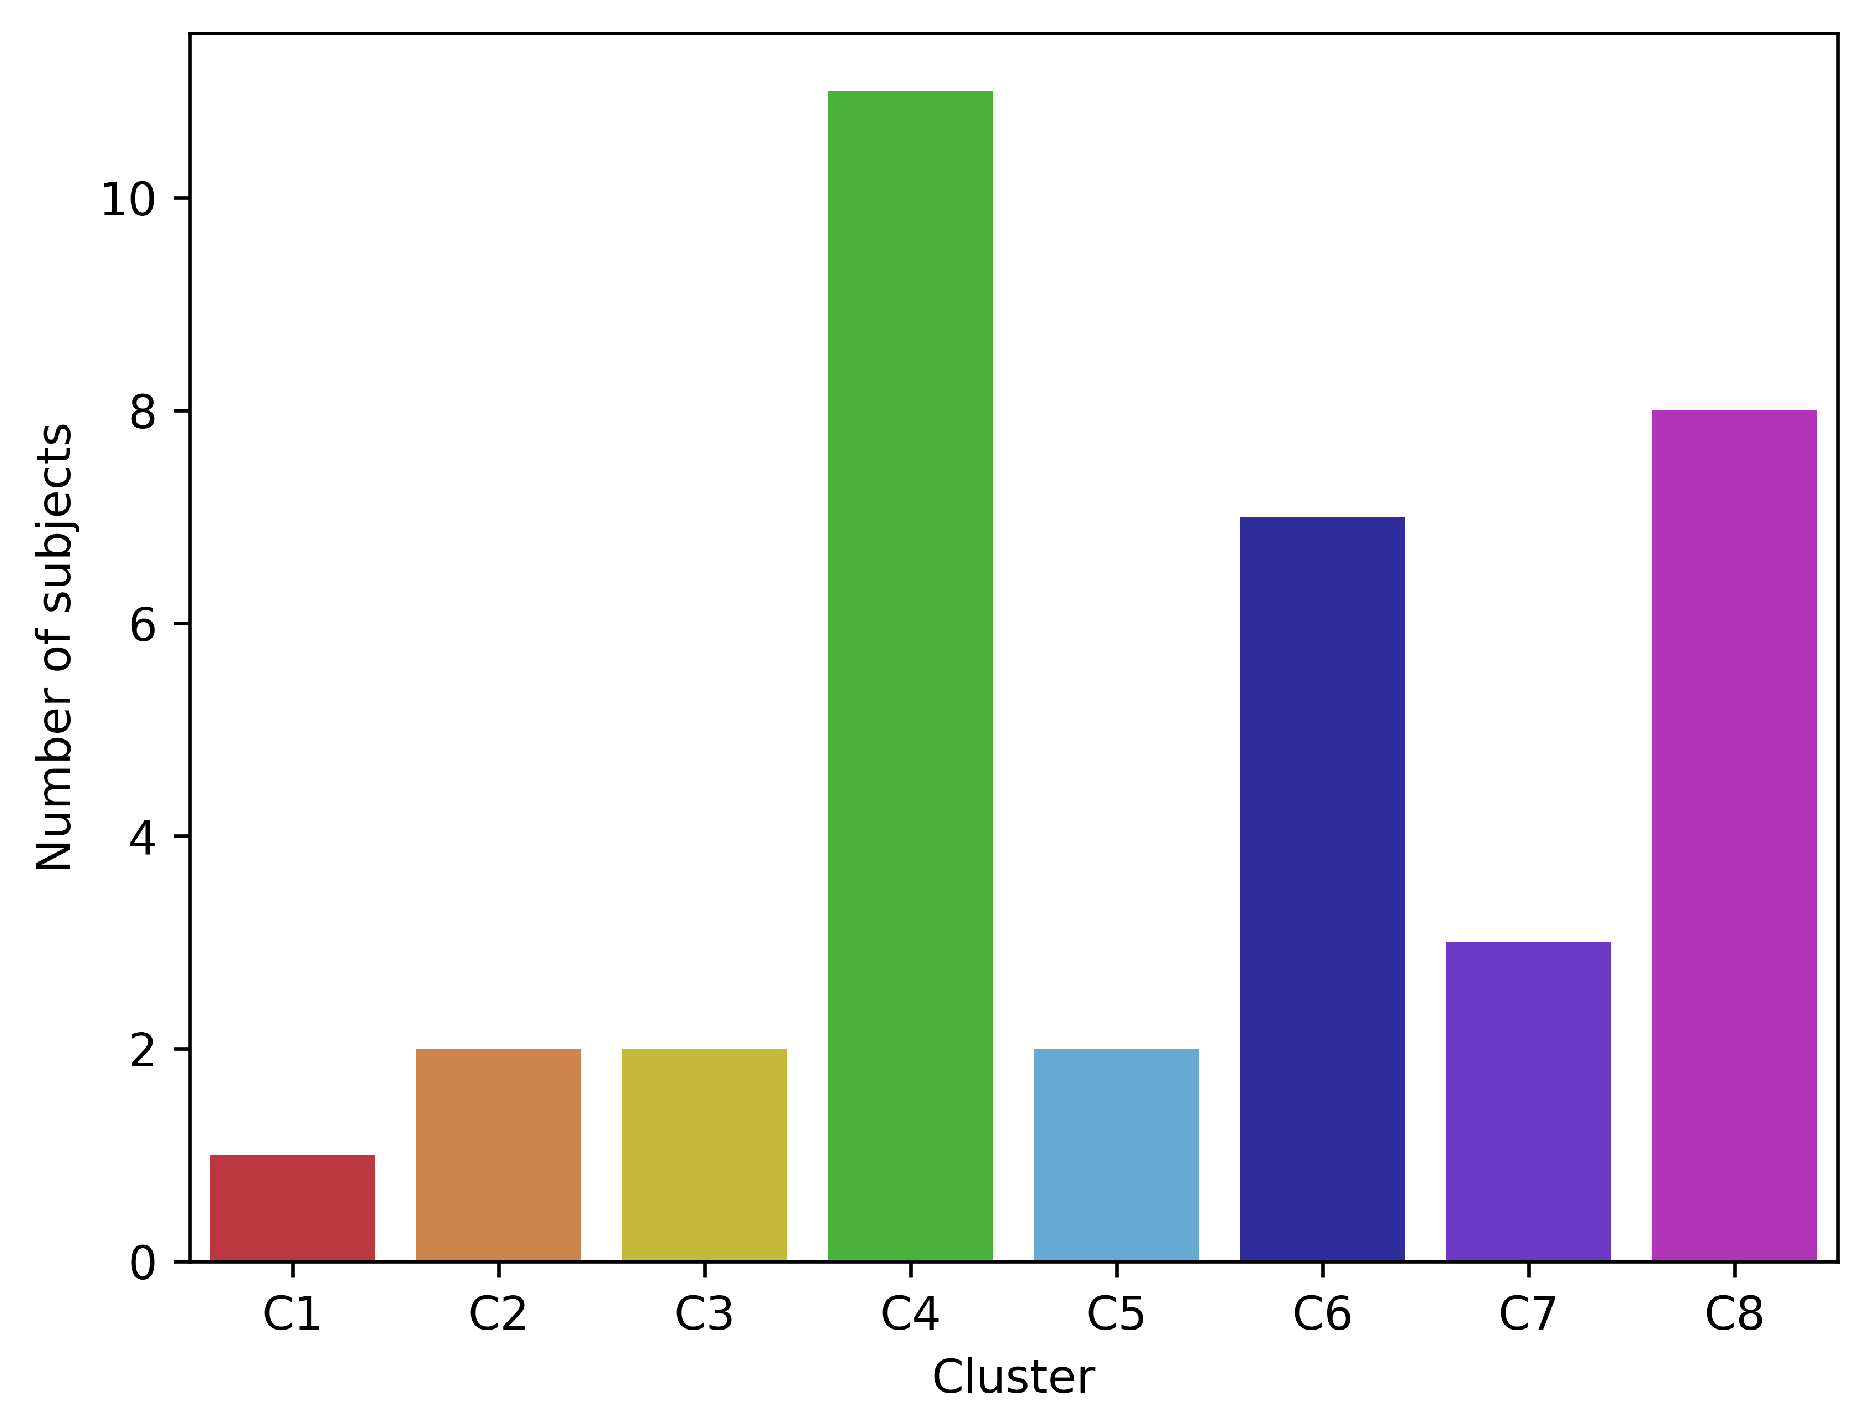
- Cluster C4. This resulted to be the most populated cluster, including 11 subjects. The trend follows a pattern, meaning that the subjects showed an increase in the value of EI while shifting from L to L.
- Cluster C6. This cluster includes 7 subjects and follows a pattern. This reflects an increase of the EI value in L.
- Cluster C8. This cluster encompasses 8 subjects. The inter-level variation pattern is . This denotes an increase in the EI value when shifting from L to L and from L to L, and then a decrease when moving to L.
4. Discussion
5. Conclusions
Author Contributions
Funding
Institutional Review Board Statement
Informed Consent Statement
Data Availability Statement
Acknowledgments
Conflicts of Interest
Abbreviations
| AP | Absolute Power |
| AVI | Audio Video Interleave |
| BCI | Brain-Computer Interface |
| BP | Bandpower |
| BRF | Blink Relative Frequency |
| CEFR | Common European Framework of Reference |
| CI | Concentration Index |
| CV | Cross-Validation |
| DA | Discriminant Analysis |
| DAP | Data Acquisition Protocol |
| EAR | Eye Aspect Ratio |
| EEG | Electroencephalography |
| EI | Engagement Index |
| ERD | Event-Related Desynchronisation |
| ERS | Event-Related Synchronisation |
| FD | Frequency Domain |
| FN | False Negatives |
| FP | False Positives |
| GDD | Grab-Drag-Drop |
| GMFM | Google Mediapipe Face Mesh |
| HCI | Human Computer Interaction |
| HE | High-Engagement |
| JSON | JavaScript Object Notation |
| KNN | K-Nearest Neighbour |
| LE | Low-Engagement |
| NASA-TLX | NASA Task Load Index |
| NeAdEx | Neuroadaptive Exergame |
| PD | Parkinson’s Disease |
| PPV | Precision |
| QoL | Quality of Life |
| R&D | Research and Development |
| RP | Relative Power |
| SMR | Sensorimotor Rhythm |
| SVM | Support Vector Machine |
| TD | Time Domain |
| TEFS | TRESCA Effort Score |
| TENS | TRESCA Engagement Score |
| TN | True Negatives |
| TP | True Positives |
| TRESCA | Task-Related Scale |
References
- Peretti, A.; Amenta, F.; Tayebati, S.K.; Nittari, G.; Mahdi, S.S. Telerehabilitation: Review of the state-of-the-art and areas of application. JMIR Rehabil. Assist. Technol. 2017, 4, e7511. [Google Scholar] [CrossRef] [PubMed]
- Simon, D.K.; Tanner, C.M.; Brundin, P. Parkinson disease epidemiology, pathology, genetics, and pathophysiology. Clin. Geriatr. Med. 2020, 36, 1–12. [Google Scholar] [CrossRef]
- Alzheimer’s Association. Alzheimer’s disease facts and figures. Alzheimer’s Dement. 2018, 14, 367–429. [Google Scholar]
- Sveinbjornsdottir, S. The clinical symptoms of Parkinson’s disease. J. Neurochem. 2016, 139, 318–324. [Google Scholar] [CrossRef]
- Arvanitakis, Z.; Shah, R.C.; Bennett, D.A. Diagnosis and management of dementia: Review. JAMA 2019, 322, 1589–1599. [Google Scholar] [CrossRef] [PubMed]
- Bature, F.; Guinn, B.A.; Pang, D.; Pappas, Y. Signs and symptoms preceding the diagnosis of Alzheimer’s disease: A systematic scoping review of literature from 1937 to 2016. BMJ Open 2017, 7, e015746. [Google Scholar] [CrossRef]
- Maresova, P.; Hruska, J.; Klimova, B.; Barakovic, S.; Krejcar, O. Activities of daily living and associated costs in the most widespread neurodegenerative diseases: A systematic review. Clin. Interv. Aging 2020, 15, 1841–1862. [Google Scholar] [CrossRef] [PubMed]
- World Health Organization. Neurological Disorders: Public Health Challenges; World Health Organization: Geneva, Switzerland, 2006. [Google Scholar]
- Debû, B.; De Oliveira Godeiro, C.; Lino, J.C.; Moro, E. Managing gait, balance, and posture in Parkinson’s disease. Curr. Neurol. Neurosci. Rep. 2018, 18, 23. [Google Scholar] [CrossRef] [PubMed]
- Mok, V.C.T.; Pendlebury, S.; Wong, A.; Alladi, S.; Au, L.; Bath, P.M.; Biessels, G.J.; Chen, C.; Cordonnier, C.; Dichgans, M.; et al. Tackling challenges in care of Alzheimer’s disease and other dementias amid the COVID-19 pandemic, now and in the future. Alzheimer’s Dement. 2020, 16, 1571–1581. [Google Scholar] [CrossRef]
- Cummings, J. Correction to: New approaches to symptomatic treatments for Alzheimer’s disease. Mol. Neurodegener. 2021, 16, 21. [Google Scholar] [CrossRef]
- Armstrong, M.J.; Okun, M.S. Diagnosis and treatment of Parkinson disease: A Review. JAMA 2020, 323, 548–560. [Google Scholar] [CrossRef] [PubMed]
- Rafferty, M.R.; Nettnin, E.; Goldman, J.G.; Macdonald, J. Frameworks for Parkinson’s Disease Rehabilitation Addressing When, What, and How. Curr. Neurol. Neurosci. Rep. 2021, 21, 1–10. [Google Scholar] [CrossRef] [PubMed]
- Gupta, A.; Prakash, N.B.; Sannyasi, G. Rehabilitation in dementia. Indian J. Psychol. Med. 2021, 43, S37–S47. [Google Scholar] [CrossRef] [PubMed]
- Formisano, R.; Pratesi, L.; Modarelli, F.T.; Bonifati, V.; Meco, G. Rehabilitation and Parkinson’s disease. Scand. J. Rehabil. Med. 1992, 24, 157–160. [Google Scholar] [PubMed]
- Fayyaz, M.; Jaffery, S.S.; Anwer, F.; Zil-E-Ali, A.; Anjum, I. The effect of physical activity in Parkinson’s disease: A mini-review. Cureus 2018, 10, e2995. [Google Scholar] [CrossRef] [PubMed]
- Chromiec, P.A.; Urbaś, Z.K.; Jacko, M.; Kaczor, J.J. The proper diet and regular physical activity slow down the development of Parkinson disease. Aging Dis. 2021, 12, 1605–1623. [Google Scholar] [CrossRef]
- Cusso, M.E.; Donald, K.J.; Khoo, T.K. The impact of physical activity on non-motor symptoms in Parkinson’s disease: A systematic review. Front. Med. 2016, 3, 35. [Google Scholar] [CrossRef]
- Speelman, A.D.; van de Warrenburg, B.P.; van Nimwegen, M.; Petzinger, G.M.; Munneke, M.; Bloem, B.R. How might physical activity benefit patients with Parkinson disease? Nat. Rev. Neurol. 2011, 7, 528–534. [Google Scholar] [CrossRef]
- Abbruzzese, G.; Marchese, R.; Avanzino, L.; Pelosin, E. Rehabilitation for Parkinson’s disease: Current outlook and future challenges. Park. Relat. Disord. 2016, 22 (Suppl. S1), S60–S64. [Google Scholar] [CrossRef]
- Mak, M.K.; Wong-Yu, I.S.; Shen, X.; Chung, C.L. Long-term effects of exercise and physical therapy in people with Parkinson disease. Nat. Rev. Neurol. 2017, 13, 689–703. [Google Scholar] [CrossRef]
- Yau, S.Y.; Gil-Mohapel, J.; Christie, B.R.; So, K.F. Physical exercise-induced adult neurogenesis: A good strategy to prevent cognitive decline in neurodegenerative diseases? Biomed Res. Int. 2014, 2014, 403120. [Google Scholar] [CrossRef]
- Marques-Aleixo, I.; Beleza, J.; Sampaio, A.; Stevanović, J.; Coxito, P.; Gonçalves, I.; Ascens ao, A.; Magalh aes, J. Preventive and therapeutic potential of physical exercise in neurodegenerative diseases. Antioxid. Redox Signal. 2021, 34, 674–693. [Google Scholar] [CrossRef]
- Vecchio, L.M.; Meng, Y.; Xhima, K.; Lipsman, N.; Hamani, C.; Aubert, I. The neuroprotective effects of exercise: Maintaining a healthy brain throughout aging. Brain Plast. 2018, 4, 17–52. [Google Scholar] [CrossRef] [PubMed]
- Docu Axelerad, A.; Stroe, A.Z.; Muja, L.F.; Docu Axelerad, S.; Chita, D.S.; Frecus, C.E.; Mihai, C.M. Benefits of Tango Therapy in Alleviating the Motor and Non-Motor Symptoms of Parkinson’s Disease Patients—A Narrative Review. Brain Sci. 2022, 12, 448. [Google Scholar] [CrossRef] [PubMed]
- Dahmen-Zimmer, K.; Jansen, P. Karate and dance training to improve balance and stabilize mood in patients with Parkinson’s disease: A feasibility study. Front. Med. 2017, 4, 237. [Google Scholar] [CrossRef] [PubMed]
- Ferrazzoli, D.; Ortelli, P.; Madeo, G.; Giladi, N.; Petzinger, G.M.; Frazzitta, G. Basal ganglia and beyond: The interplay between motor and cognitive aspects in Parkinson’s disease rehabilitation. Neurosci. Biobehav. Rev. 2018, 90, 294–308. [Google Scholar] [CrossRef] [PubMed]
- Irazoki, E.; Contreras-Somoza, L.M.; Toribio-Guzmán, J.M.; Jenaro-Río, C.; van der Roest, H.; Franco-Martín, M.A. Technologies for cognitive training and cognitive rehabilitation for people with mild cognitive impairment and dementia. A systematic review. Front. Psychol. 2020, 11, 648. [Google Scholar] [CrossRef]
- Dimyan, M.A.; Cohen, L.G. Neuroplasticity in the context of motor rehabilitation after stroke. Nat. Rev. Neurol. 2011, 7, 76–85. [Google Scholar] [CrossRef]
- Cations, M.; Laver, K.E.; Crotty, M.; Cameron, I.D. Rehabilitation in dementia care. Age Ageing 2018, 47, 171–174. [Google Scholar] [CrossRef]
- Cotelli, M.; Manenti, R.; Brambilla, M.; Gobbi, E.; Ferrari, C.; Binetti, G.; Cappa, S.F. Cognitive telerehabilitation in mild cognitive impairment, Alzheimer’s disease and frontotemporal dementia: A systematic review. J. Telemed. Telecare 2019, 25, 67–79. [Google Scholar] [CrossRef]
- Ferraris, C.; Ronga, I.; Pratola, R.; Coppo, G.; Bosso, T.; Falco, S.; Amprimo, G.; Pettiti, G.; Lo Priore, S.; Priano, L.; et al. Usability of the REHOME solution for the telerehabilitation in neurological diseases: Preliminary results on motor and cognitive platforms. Sensors 2022, 22, 9467. [Google Scholar] [CrossRef] [PubMed]
- Reis, E.; Postolache, G.; Teixeira, L.; Arriaga, P.; Lima, M.L.; Postolache, O. Exergames for motor rehabilitation in older adults: An umbrella review. Phys. Ther. Rev. 2019, 24, 84–99. [Google Scholar] [CrossRef]
- López-Nava, I.H.; Rodriguez, M.D.; García-Vázquez, J.P.; Perez-Sanpablo, A.I.; Qui nones-Urióstegui, I.; Meneses-Pe naloza, A.; Castillo, V.; Cuaya-Simbro, G.; Armenta, J.S.; Martínez, A.; et al. Current state and trends of the research in exergames for the elderly and their impact on health outcomes: A scoping review. J. Ambient Intell. Humaniz. Comput. 2022, 1–33. [Google Scholar] [CrossRef]
- Amprimo, G.; Masi, G.; Priano, L.; Azzaro, C.; Galli, F.; Pettiti, G.; Mauro, A.; Ferraris, C. Assessment tasks and virtual exergames for remote monitoring of Parkinson’s disease: An integrated approach based on Azure Kinect. Sensors 2022, 22, 8173. [Google Scholar] [CrossRef] [PubMed]
- de Melo Cerqueira, T.M.; de Moura, J.A.; de Lira, J.O.; Leal, J.C.; D’Amelio, M.; do Santos Mendes, F.A. Cognitive and motor effects of Kinect-based games training in people with and without Parkinson disease: A preliminary study. Physiother. Res. Int. 2020, 25, e1807. [Google Scholar] [CrossRef] [PubMed]
- Liu, H.; Xing, Y.; Wu, Y. Effect of Wii Fit exercise with balance and lower limb muscle strength in older adults: A meta-analysis. Front. Med. 2022, 9, 812570. [Google Scholar] [CrossRef] [PubMed]
- Chen, W.; Bang, M.; Krivonos, D.; Schimek, H.; Naval, A. An immersive virtual reality exergame for people with Parkinson’s disease. In Lecture Notes in Computer Science; Springer International Publishing: Cham, Switzerland, 2020; pp. 138–145. [Google Scholar]
- Eisapour, M.; Cao, S.; Domenicucci, L.; Boger, J. Virtual reality exergames for people living with dementia based on exercise therapy best practices. Proc. Hum. Factors Ergon. Soc. Annu. Meet. 2018, 62, 528–532. [Google Scholar] [CrossRef]
- Chu, C.H.; Biss, R.K.; Cooper, L.; Quan, A.M.L.; Matulis, H. Exergaming platform for older adults residing in long-term care homes: User-centered design, development, and usability study. JMIR Serious Games 2021, 9, e22370. [Google Scholar] [CrossRef] [PubMed]
- Park, C.; Mishra, R.K.; York, M.K.; Enriquez, A.; Lindsay, A.; Barchard, G.; Vaziri, A.; Najafi, B. Tele-medicine based and self-administered interactive exercise program (Tele-exergame) to improve cognition in older adults with mild cognitive impairment or dementia: A feasibility, acceptability, and proof-of-concept study. Int. J. Environ. Res. Public Health 2022, 19, 16361. [Google Scholar] [CrossRef] [PubMed]
- Barry, G.; Galna, B.; Rochester, L. The role of exergaming in Parkinson’s disease rehabilitation: A systematic review of the evidence. J. Neuroeng. Rehabil. 2014, 11, 33. [Google Scholar] [CrossRef] [PubMed]
- van Santen, J.; Dröes, R.M.; Holstege, M.; Henkemans, O.B.; van Rijn, A.; de Vries, R.; van Straten, A.; Meiland, F. Effects of exergaming in people with dementia: Results of a systematic literature review. J. Alzheimer’s Dis. 2018, 63, 741–760. [Google Scholar] [CrossRef]
- Nonnekes, J.; Nieuwboer, A. Towards personalized rehabilitation for gait impairments in Parkinson’s disease. J. Parkinson’s Dis. 2018, 8, S101–S106. [Google Scholar] [CrossRef] [PubMed]
- Omboni, S.; Padwal, R.S.; Alessa, T.; Benczúr, B.; Green, B.B.; Hubbard, I.; Kario, K.; Khan, N.A.; Konradi, A.; Logan, A.G.; et al. The worldwide impact of telemedicine during COVID-19: Current evidence and recommendations for the future. Connect. Health 2022, 1, 7. [Google Scholar] [CrossRef]
- Dong, S.; Reder, L.M.; Yao, Y.; Liu, Y.; Chen, F. Individual differences in working memory capacity are reflected in different ERP and EEG patterns to task difficulty. Brain Res. 2015, 1616, 146–156. [Google Scholar] [CrossRef] [PubMed]
- Pope, A.T.; Bogart, E.H.; Bartolome, D.S. Biocybernetic system evaluates indices of operator engagement in automated task. Biol. Psychol. 1995, 40, 187–195. [Google Scholar] [CrossRef] [PubMed]
- Eldenfria, A.; Al-Samarraie, H. Towards an online continuous adaptation mechanism (OCAM) for enhanced engagement: An EEG study. Int. J. Hum.–Comput. Interact. 2019, 35, 1960–1974. [Google Scholar] [CrossRef]
- Gola, M.; Magnuski, M.; Szumska, I.; Wróbel, A. EEG beta band activity is related to attention and attentional deficits in the visual performance of elderly subjects. Int. J. Psychophysiol. 2013, 89, 334–341. [Google Scholar] [CrossRef]
- Kay, L.M. Theta oscillations and sensorimotor performance. Proc. Natl. Acad. Sci. USA 2005, 102, 3863–3868. [Google Scholar] [CrossRef]
- Brauns, I.; Teixeira, S.; Velasques, B.; Bittencourt, J.; Machado, S.; Cagy, M.; Gongora, M.; Bastos, V.H.; Machado, D.; Sandoval-Carrillo, A.; et al. Changes in the theta band coherence during motor task after hand immobilization. Int. Arch. Med. 2014, 7, 51. [Google Scholar] [CrossRef]
- Edwards, L.L.; King, E.M.; Buetefisch, C.M.; Borich, M.R. Putting the “sensory” into sensorimotor control: The role of sensorimotor integration in goal-directed hand movements after stroke. Front. Integr. Neurosci. 2019, 13, 16. [Google Scholar] [CrossRef]
- Nakayashiki, K.; Saeki, M.; Takata, Y.; Hayashi, Y.; Kondo, T. Modulation of event-related desynchronization during kinematic and kinetic hand movements. J. Neuroeng. Rehabil. 2014, 11, 90. [Google Scholar] [CrossRef] [PubMed]
- Szafir, D.; Mutlu, B. Pay attention! Designing adaptive agents that monitor and improve user engagement. In Proceedings of the SIGCHI Conference on Human Factors in Computing Systems, Austin, TX, USA, 5–10 May 2012; pp. 11–20. [Google Scholar]
- Szafir, D.; Mutlu, B. ARTFul: Adaptive review technology for flipped learning. In Proceedings of the SIGCHI Conference on Human Factors in Computing Systems, Paris, France, 27 April–2 May 2013; pp. 1001–1010. [Google Scholar]
- Nuamah, J.; Seong, Y. Support vector machine (SVM) classification of cognitive tasks based on electroencephalography (EEG) engagement index. Brain-Comput. Interfaces 2018, 5, 1–12. [Google Scholar] [CrossRef]
- McMahan, T.; Parberry, I.; Parsons, T.D. Evaluating player task engagement and arousal using electroencephalography. Procedia Manuf. 2015, 3, 2303–2310. [Google Scholar] [CrossRef]
- Yücel, Z.; Koyama, S.; Monden, A.; Sasakura, M. Estimating level of engagement from ocular landmarks. Int. J. Hum. Comput. Interact. 2020, 36, 1527–1539. [Google Scholar] [CrossRef]
- Ranti, C.; Jones, W.; Klin, A.; Shultz, S. Blink rate patterns provide a reliable measure of individual engagement with scene content. Sci. Rep. 2020, 10, 8267. [Google Scholar] [CrossRef]
- Daza, R.; DeAlcala, D.; Morales, A.; Tolosana, R.; Cobos, R.; Fierrez, J. ALEBk: Feasibility study of attention level estimation via blink detection applied to e-learning. arXiv 2021, arXiv:2112.09165. [Google Scholar]
- Hart, S.G.; Staveland, L.E. Development of NASA-TLX (Task Load Index): Results of empirical and theoretical research. In Advances in Psychology; Elsevier: Amsterdam, The Netherlands, 1988; Volume 52, pp. 139–183. [Google Scholar]
- Planinc, R.; Nake, I.; Kampel, M. Exergame design guidelines for enhancing elderly’s physical and social activities. In Proceedings of the AMBIENT 2013, The Third International Conference on Ambient Computing, Applications, Services and Technologies, Porto, Portugal, 29 September–3 October 2013; pp. 58–63. [Google Scholar]
- Hébert, S.; Béland, R.; Dionne-Fournelle, O.; Crête, M.; Lupien, S.J. Physiological stress response to video-game playing: The contribution of built-in music. Life Sci. 2005, 76, 2371–2380. [Google Scholar] [CrossRef]
- Amprimo, G.; Ferraris, C.; Masi, G.; Pettiti, G.; Priano, L. GMH-D: Combining Google MediaPipe and RGB-depth cameras for hand motor skills remote assessment. In Proceedings of the 2022 IEEE International Conference on Digital Health (ICDH), Barcelona, Spain, 11–15 July 2022. [Google Scholar]
- Stroop, J.R. Studies of interference in serial verbal reactions. J. Exp. Psychol. 1935, 18, 643. [Google Scholar] [CrossRef]
- Guan, J.; Wade, M.G. The effect of aging on adaptive eye-hand coordination. J. Gerontol. Ser. B Psychol. Sci. Soc. Sci. 2000, 55, P151–P162. [Google Scholar] [CrossRef]
- Boisseau, E.; Scherzer, P.; Cohen, H. Eye-hand coordination in aging and in Parkinson’s disease. Aging Neuropsychol. Cogn. 2002, 9, 266–275. [Google Scholar] [CrossRef]
- Hart, S.G. NASA Task Load Index (TLX). 1986. Available online: https://ntrs.nasa.gov/citations/20000021487 (accessed on 15 March 2022).
- Hart, S.G. NASA-task load index (NASA-TLX); 20 years later. In Proceedings of the Human Factors and Ergonomics Society Annual Meeting, Sydney, Australia, 20–22 November 2006; Sage Publications: Los Angeles, CA, USA, 2006; Volume 50, pp. 904–908. [Google Scholar]
- Hendy, K.C.; Hamilton, K.M.; Landry, L.N. Measuring subjective workload: When is one scale better than many? Hum. Factors 1993, 35, 579–601. [Google Scholar] [CrossRef]
- Said, S.; Gozdzik, M.; Roche, T.R.; Braun, J.; Rössler, J.; Kaserer, A.; Spahn, D.R.; Nöthiger, C.B.; Tscholl, D.W. Validation of the raw National Aeronautics and Space Administration Task Load Index (NASA-TLX) questionnaire to assess perceived workload in patient monitoring tasks: Pooled analysis study using mixed models. J. Med. Internet Res. 2020, 22, e19472. [Google Scholar] [CrossRef] [PubMed]
- Prabaswari, A.D.; Basumerda, C.; Utomo, B.W. The mental workload analysis of staff in study program of private educational organization. In Proceedings of the IOP Conference Series: Materials Science and Engineering; IOP Publishing: Bristol, UK, 2019; Volume 528, p. 012018. [Google Scholar]
- Barry, G.; van Schaik, P.; MacSween, A.; Dixon, J.; Martin, D. Exergaming (XBOX Kinect™) versus traditional gym-based exercise for postural control, flow and technology acceptance in healthy adults: A randomised controlled trial. BMC Sports Sci. Med. Rehabil. 2016, 8, 25. [Google Scholar] [CrossRef] [PubMed]
- Lange, B.; Chang, C.Y.; Suma, E.; Newman, B.; Rizzo, A.S.; Bolas, M. Development and evaluation of low cost game-based balance rehabilitation tool using the Microsoft Kinect sensor. In Proceedings of the 2011 Annual International Conference of the IEEE Engineering in Medicine and Biology Society, Boston, MA, USA, 30 August–3 September 2011; pp. 1831–1834. [Google Scholar]
- Mocanu, I.; Marian, C.; Rusu, L.; Arba, R. A Kinect based adaptive exergame. In Proceedings of the 2016 IEEE 12th International Conference on Intelligent Computer Communication and Processing (ICCP), Cluj-Napoca, Romania, 8–10 September 2016. [Google Scholar]
- Tölgyessy, M.; Dekan, M.; Chovanec, Ľ.; Hubinský, P. Evaluation of the Azure Kinect and its comparison to Kinect V1 and Kinect V2. Sensors 2021, 21, 413. [Google Scholar] [CrossRef]
- Face Mesh. Available online: https://google.github.io/mediapipe/solutions/face_mesh.html (accessed on 14 December 2022).
- Thorey, V.; Guillot, A.; El Kanbi, K.; Harris, M.; Arnal, P. 1211 Assessing the Accuracy of a Dry-EEG Headband for Measuring Brain Activity, Heart Rate, Breathing and Automatic Sleep Staging. Sleep 2020, 43, A463. [Google Scholar] [CrossRef]
- Li, R.; Principe, J.C. Blinking artifact removal in cognitive EEG data using ICA. In Proceedings of the 2006 International Conference of the IEEE Engineering in Medicine and Biology Society, New York, NY, USA, 30 August–3 September 2006; pp. 5273–5276. [Google Scholar]
- Motamedi-Fakhr, S.; Moshrefi-Torbati, M.; Hill, M.; Hill, C.M.; White, P.R. Signal processing techniques applied to human sleep EEG signals—A review. Biomed. Signal Process. Control 2014, 10, 21–33. [Google Scholar] [CrossRef]
- Rechichi, I.; Amato, F.; Cicolin, A.; Olmo, G. Single-Channel EEG Detection of REM Sleep Behaviour Disorder: The Influence of REM and Slow Wave Sleep. In Proceedings of the International Work-Conference on Bioinformatics and Biomedical Engineering, Maspalomas, Spain, 27–30 June 2022; pp. 381–394. [Google Scholar]
- Stieger, J.R.; Engel, S.A.; He, B. Continuous sensorimotor rhythm based brain computer interface learning in a large population. Sci. Data 2021, 8, 98. [Google Scholar] [CrossRef]
- Yuan, H.; He, B. Brain–computer interfaces using sensorimotor rhythms: Current state and future perspectives. IEEE Trans. Biomed. Eng. 2014, 61, 1425–1435. [Google Scholar] [CrossRef]
- Coelli, S.; Sclocco, R.; Barbieri, R.; Reni, G.; Zucca, C.; Bianchi, A.M. EEG-based index for engagement level monitoring during sustained attention. In Proceedings of the 2015 37th Annual International Conference of the IEEE Engineering in Medicine and Biology Society (EMBC), Milan, Italy, 25–29 August 2015; pp. 1512–1515. [Google Scholar]
- Li, X.; Jiang, Y.; Hong, J.; Dong, Y.; Yao, L. Estimation of cognitive workload by approximate entropy of EEG. J. Mech. Med. Biol. 2016, 16, 1650077. [Google Scholar] [CrossRef]
- Angelakis, E.; Lubar, J.F.; Stathopoulou, S. Electroencephalographic peak alpha frequency correlates of cognitive traits. Neurosci. Lett. 2004, 371, 60–63. [Google Scholar] [CrossRef]
- Akiyama, M.; Tero, A.; Kawasaki, M.; Nishiura, Y.; Yamaguchi, Y. Theta-alpha EEG phase distributions in the frontal area for dissociation of visual and auditory working memory. Sci. Rep. 2017, 7, 42776. [Google Scholar] [CrossRef] [PubMed]
- Remeseiro, B.; Fernández, A.; Lira, M. Automatic eye blink detection using consumer web cameras. In Advances in Computational Intelligence; Springer International Publishing: Cham, Switzerland, 2015; pp. 103–114. [Google Scholar]
- Jordan, A.A.; Pegatoquet, A.; Castagnetti, A.; Raybaut, J.; Le Coz, P. Deep learning for eye blink detection implemented at the edge. IEEE Embed. Syst. Lett. 2021, 13, 130–133. [Google Scholar] [CrossRef]
- Zdarsky, N.; Treue, S.; Esghaei, M. A deep learning-based approach to video-based eye tracking for human psychophysics. Front. Hum. Neurosci. 2021, 15, 685830. [Google Scholar] [CrossRef] [PubMed]
- Dewi, C.; Chen, R.C.; Jiang, X.; Yu, H. Adjusting eye aspect ratio for strong eye blink detection based on facial landmarks. PeerJ Comput. Sci. 2022, 8, e943. [Google Scholar] [CrossRef] [PubMed]
- Zhu, T.; Zhang, C.; Wu, T.; Ouyang, Z.; Li, H.; Na, X.; Liang, J.; Li, W. Research on a real-time driver fatigue detection algorithm based on facial video sequences. Appl. Sci. 2022, 12, 2224. [Google Scholar] [CrossRef]
- Jamovi—Open Statistical Software for the Desktop and Cloud. Available online: https://www.jamovi.org (accessed on 19 December 2022).
- Urbanowicz, R.J.; Meeker, M.; La Cava, W.; Olson, R.S.; Moore, J.H. Relief-based feature selection: Introduction and review. J. Biomed. Inform. 2018, 85, 189–203. [Google Scholar] [CrossRef]
- Rogers, J.M.; Jensen, J.; Valderrama, J.T.; Johnstone, S.J.; Wilson, P.H. Single-channel EEG measurement of engagement in virtual rehabilitation: A validation study. Virtual Real. 2021, 25, 357–366. [Google Scholar] [CrossRef]
- Lee, J.C.; Tan, D.S. Using a low-cost electroencephalograph for task classification in HCI research. In Proceedings of the 19th Annual ACM Symposium on User Interface Software and Technology, Montreux, Switzerland, 15–18 October 2006; pp. 81–90. [Google Scholar]
- Chanel, G.; Rebetez, C.; Bétrancourt, M.; Pun, T. Emotion Assessment From Physiological Signals for Adaptation of Game Difficulty. IEEE Trans. Syst. Man Cybern. Part A Syst. Hum. 2011, 41, 1052–1063. [Google Scholar] [CrossRef]


| Age | Sex | Education Level |
|---|---|---|
| 26 ± 4.5 years | 37 males (74%) 13 females (26%) | Bachelor’s Degree: 13 (26%) Master’s Degree: 34 (68%) Ph.D.: 3 (6%) |
| Range | Perceived Workload |
|---|---|
| 0–9 | Low |
| 10–29 | Medium |
| 30–49 | Somewhat High |
| 50–79 | High |
| 80–100 | Very High |
| Item | Score |
|---|---|
| I. Environmental and Game Features | |
| Exergame Features and Environmental Factors | 1–6 (1: most distracting) |
| Change in difficulty during the game | 10-point scale (10: maximum) |
| II. Mental and Cognitive Workload | |
| The questions refer to the parameters throughout the game | |
| Engagement Level | 10-point scale (10: maximum) |
| Attention level | 10-point scale (10: maximum) |
| III. Perceived Shifts in Performance | |
| The questions refer to the parameters throughout the game | |
| Effort and Dedication | 10-point scale (10: maximum) |
| Fatigue Level | 10-point scale (10: maximum) |
| Active concentration throughout the game | 10-point scale (10: maximum) |
| Category | Feature | Reference |
|---|---|---|
| Time and Morphological | Amplitude metrics: root mean square, kurtosis, maximum and minimum value | various |
| Hjorth Parameters (Activity, Complexity, Mobility) | [80] | |
| Form, Crest and Impact Factors | various | |
| Approximate Entropy | [85] | |
| Frequency | Relative Power for each relevant frequency band () | various |
| Absolute Power for each relevant frequency band () | various | |
| Peak Frequency in the -band | [86] | |
| Frontal to Ratio | [87] | |
| Engagement Index | ⋄ [47,48] | |
| Concentration Index | ⋄ [48] | |
| Event-Related Desynchronisation and Event-Related Synchronisation | ⋄ [48,53] |
| Category | Feature | Reference |
|---|---|---|
| Blink | Blink Absolute Frequency (BAF) | ☆ |
| Blink Relative Frequency (BRF), with respect to level duration | ☆ | |
| Mean Blink Duration (MBD) | [58] | |
| STD Blink Duration | ☆ | |
| Blink Rate | various | |
| EAR | Mean EAR | [58] |
| Standard Deviation (STD) EAR | ☆ |
| SVM | KNN | DA | AdaBoost | |
|---|---|---|---|---|
| Normalisation | z-score | z-score | z-score | z-score |
| Optimisation Method (Iterations) | Bayesian (50) | Grid Search (50) | Grid Search (50) | Bayesian (50) |
| Hyperparameters and Search Range | Kernel function: linear, quadratic, cubic, gaussian Penalty (C): 0.001–1000 | Distance metric: Euclidean, Chebyschev, Hamming, Manhattan, Mahalanobis, Spearman, Minkowski K: 1–12 | Discriminant: linear, quadratic | Splits: range 1–50 Learners: 1–100 Learning rate: 0.1–1 |
| Optimised Parameters | Linear kernel C = 1 | Euclidean Distance K = 1 | Linear Discriminant | Splits: 20 Learners: 30 Learning rate: 0.1 |
| Cross-Validation | 10-fold | 10-fold | 10-fold | 10-fold |
| Features (EEG) | Shapiro-Wilk | Independent Sample Test |
|---|---|---|
| Relative Power () | 0.057⋄ | <0.001 * |
| Relative Power () | 0.142 ⋄ | <0.001 * |
| Engagement Index | <0.001 | <0.001 * |
| Frontal Ratio | 0.088 ⋄ | <0.001 * |
| Relative Power () | 0.841 ⋄ | <0.001 * |
| Complexity | 0.245 ⋄ | <0.001 * |
| Complexity | 0.036 ⋄ | <0.001 * |
| Complexity | 0.100 ⋄ | <0.001 * |
| Features (Eye-Blink) | Shapiro-Wilk | Independent Sample Test |
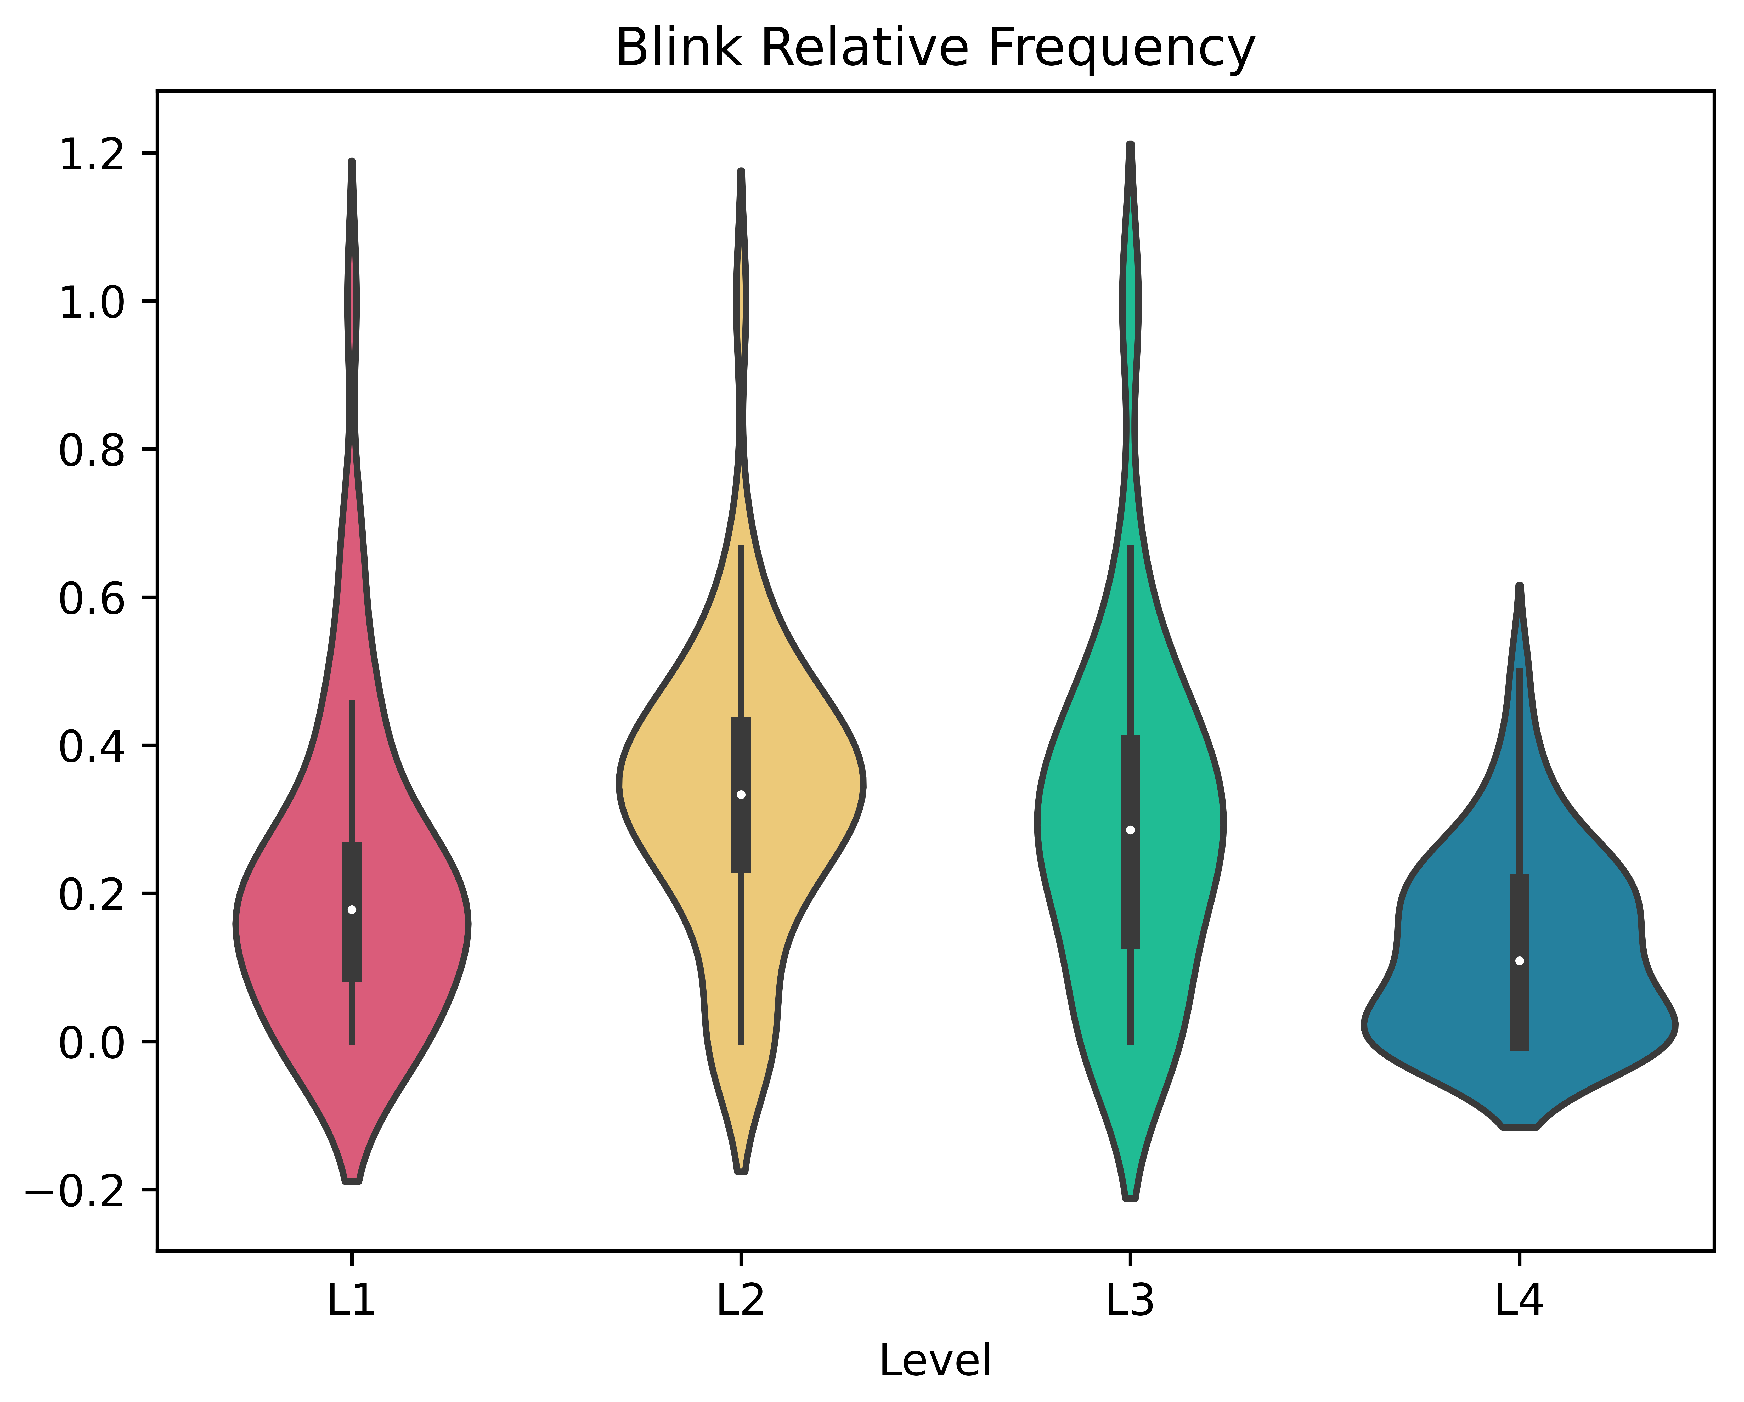
| Blink Relative Frequency | <0.001 | <0.005 |
| Eye Aspect Ratio | <0.001 | <0.005 |
| SVM | KNN | DA | AdaBoost | |
|---|---|---|---|---|
| Accuracy | 95.83% | 93.05% | 98.61% | 90.27% |
| Sensitivity | 97.23% | 94.62% | 97.21% | 91.67% |
| Specificity | 94.45% | 91.41% | 98.35% | 88.89% |
| Precision | 94.59% | 91.89% | 97.29% | 89.19% |
| F-1 | 95.89% | 93.15% | 98.63% | 90.41% |
| A. Model Hyperparameters | |||||
|---|---|---|---|---|---|
| Splits | Learners | Learning rate | |||
| Search Range | 1–50 | 1–100 | 0.1–1 | ||
| Optimised Parameters | 20 | 30 | 0.1 | ||
| B. Classification Performance | |||||
| Accuracy | Sensitivity | Specificity | Precision | F-1 | |
| Optimised AdaBoost | 72.2% | 75% | 69.44% | 71.05% | 72.3% |
Disclaimer/Publisher’s Note: The statements, opinions and data contained in all publications are solely those of the individual author(s) and contributor(s) and not of MDPI and/or the editor(s). MDPI and/or the editor(s) disclaim responsibility for any injury to people or property resulting from any ideas, methods, instructions or products referred to in the content. |
© 2023 by the authors. Licensee MDPI, Basel, Switzerland. This article is an open access article distributed under the terms and conditions of the Creative Commons Attribution (CC BY) license (https://creativecommons.org/licenses/by/4.0/).
Share and Cite
Amprimo, G.; Rechichi, I.; Ferraris, C.; Olmo, G. Measuring Brain Activation Patterns from Raw Single-Channel EEG during Exergaming: A Pilot Study. Electronics 2023, 12, 623. https://doi.org/10.3390/electronics12030623
Amprimo G, Rechichi I, Ferraris C, Olmo G. Measuring Brain Activation Patterns from Raw Single-Channel EEG during Exergaming: A Pilot Study. Electronics. 2023; 12(3):623. https://doi.org/10.3390/electronics12030623
Chicago/Turabian StyleAmprimo, Gianluca, Irene Rechichi, Claudia Ferraris, and Gabriella Olmo. 2023. "Measuring Brain Activation Patterns from Raw Single-Channel EEG during Exergaming: A Pilot Study" Electronics 12, no. 3: 623. https://doi.org/10.3390/electronics12030623
APA StyleAmprimo, G., Rechichi, I., Ferraris, C., & Olmo, G. (2023). Measuring Brain Activation Patterns from Raw Single-Channel EEG during Exergaming: A Pilot Study. Electronics, 12(3), 623. https://doi.org/10.3390/electronics12030623