Article

Some Features of Modeling Ultrasound Propagation in Non-Destructive Control of Metal Structures Based on the Magnetostrictive Effect

1
Department of Forecasting the Development of Electrical Energy Complex, Institute of General Energy of NAS of Ukraine, 03150 Kyiv, Ukraine
2
Department of Monitoring and Diagnostics of Energy Objects, Institute of General Energy of NAS of Ukraine, 03150 Kyiv, Ukraine
3
Department of Environmental Protection Technologies and Radiation Safety, State Institution “The Institute of Environmental Geochemistry of National Academy of Sciences of Ukraine”, 03142 Kyiv, Ukraine
4
Department of Tractors and Agricultural Machines, Operating and Maintenance, Mykolaiv National Agrarian University, 54020 Mykolaiv, Ukraine
5
Institute of Environmental Engineering and Biotechnology, University of Opole, 45-040 Opole, Poland
*
Author to whom correspondence should be addressed.
Electronics 2023, 12(3), 477; https://doi.org/10.3390/electronics12030477
Submission received: 14 November 2022 / Revised: 8 January 2023 / Accepted: 15 January 2023 / Published: 17 January 2023
(This article belongs to the Section Power Electronics)

Abstract

:
A method and mathematical models of direct and inverse problems of ultrasonic testing and diagnostics of complex metal structures for defects were developed and tested. A prototype of a system for magnetostrictive control of elements of the objects under study was manufactured and experimentally tested. Mathematical simulation of ultrasonic testing processes using MATLAB and the COMSOL Multiphysics software environment was carried out. The adequacy of the mathematical models was verified by the results of their comparison with real physical experiments. Information support and a methodology that implements it was developed, which ensure the functioning of the control facilities for these objects based on the use of small-aperture magnetostrictive transducers. The mathematical identification of the vibration generator in complex building structures was developed, which consists in finding the locations of the generator of ultrasonic vibrations, as well as the characteristics of this vibration generator based on data obtained from sensors in the form of time series.

1. Introduction

According to experts, the technical condition of some buildings and metal structures has reached a critical point, which increases the likelihood of accidents and emergencies [1,2,3]. However, the rate of their restoration is extremely slow due to the economic situation in many countries. Therefore, the primary task is to ensure the reliable operation of the existing stock of structures [4,5].
In this situation, the issues of managing the operational reliability and durability of the corresponding objects by determining their technical condition and residual resource and establishing scientifically grounded operating periods become more relevant.
For these reasons, various methods of non-destructive testing and diagnostics are used to obtain reliable information about the actual state of various units of construction machines and structures [5,6,7,8,9,10]. In recent years, these methods, thanks to modern information technologies, have been significantly improved with the aim of improving technical characteristics and increasing the accuracy and reliability of diagnostic results [11,12,13].
Methods based on the use of ultrasonic waves in combination with piezoelectric transducers have certain limitations and inconveniences in their practical application [14,15,16]. These inconveniences are caused by the following. First, the need for preliminary preparation of the surfaces of the studied units before placing piezoelectric transducers on them. Second, the surfaces of the controlled units can be heated significantly. In addition, the geometric shape of the investigated objects significantly affects the accuracy of diagnostic measurements.
The overwhelming majority of these disadvantages can be eliminated by the methods based on the magnetostrictive effect [17,18]. Thus, small-aperture magnetostrictive transducers [19,20,21] (MSTs) make it possible to carry out diagnostic examinations of complex-shaped objects that can heat up to high temperatures. These devices do not require preliminary preparation of the inspected surfaces (removal of rust, scale, etc.) [22].
The application of small-aperture MSTs is a base for the development of an appropriate method for diagnosing construction machines and structures. This method allows us to examine objects in construction sites and increases the accuracy and reliability of identifying possible defects.
The novelty of the obtained results is the mathematical and experimental analysis of the effect of crack sizes on the characteristics of the signal that passes through these cracks. Moreover, the new practical results of this study are mathematical models of inverse problems of ultrasound propagation in solids, specifically a model for determining the position of the ultrasonic vibrations as well as a model for determining the main physical characteristics of the source of ultrasonic vibrations, such as the amplitude and frequency of oscillations. The results of the mathematical modeling and experimentally obtained data are compared.
One hypothesis was set up.
Hypothesis 1 (H1).
In a signal that passes through defects in the form of cracks in complex building objects and structures, the amplitude of oscillations at the receiver decreases. The level of amplitude reduction depends on the crack size.
The purpose of this study was to develop a system based on the small-aperture MSTs to monitor the state of metal building structures.

2. Materials and Methods

In this study, we considered a direct problem of defect detection in bodies of complex shapes. To solve the problem (determining the influence of defects on the output signal), the classical wave equation in the area is used:
2 U ( x ¯ , t ) t 2 = v 2 i = 1 n 2 U ( x ¯ , t ) x i 2 + γ i = 1 n U ( x ¯ , t ) x i + f ( x ¯ , t ) ,
and t [ 0 , T f i n ] ; x i [ a i , b i ] ; a i ; b i ; G = [ a 1 , b 1 ] × [ a 2 , b 2 ] × × [ a n , b n ] ; i = 1 , n ¯ , where x i —spatial coordinate with number i; x ¯ —spatial coordinate vector; t—time; U —desired solution of the model; v —sound velocity in the medium; T f i n —end time of research; γ —attenuation coefficient of a wave in a particular environment.
The initial conditions are: U ( x ¯ , 0 ) = g 1 ( x ¯ ) ,     U t ( x ¯ , 0 ) = g 2 ( x ¯ ) . Boundary conditions are set depending on the formulation of the problem (which corresponds to a specific physical process).
The mathematical model (1) describes the process of wave propagation in an object without defects [23,24,25].

3. Results and Discussion

The method of dimensionless coordinates is usually used to model the behavior of complex objects and systems. This procedure simplifies finding the numerical solution. After that, the transition to real coordinates is performed. The following mathematical model was developed in dimensionless coordinates. For simulating the passage of a signal through a defect, it is envisaged to create an artificial point exciter of oscillations and a signal receiver (an analogue of the point of the small-aperture MST), which are located on opposite sides of the defect. This simulation approach allowed us to answer the main research question—the effect of the defect’s size on the passage of a signal through it. In this case, the amplitude and frequency of the received signal are determined. Next, we considered the linear wave Equation (1) in the area:
Ω :   ( x , y ) [ 0 , 5 ; 0 , 5 ] 2 ,   t [ 0 ; 1 ] ,
which has the form
2 U / t 2 = 2 U / x 2 + 2 U / y 2 .
The corresponding initial conditions (2) for carrying out computational experiments are as follows:
U ( x , y , 0 ) = U t ( x , y , 0 ) = 0 .
The choice of conditions (3) is due to the fact that the investigated object is at rest. Boundary conditions for simulation:
U / n ¯ | Γ = 0 .
They take into account the fact that when a wave reaches the boundary of the computational region of the object under study, its reflection from this boundary is taken into account. The defect area is written as a Cartesian product:
G = [ 0.5 10 3 ; 0.5 10 3 ] × [ 0.15 ; 0.15 ] .
At the point with coordinates ( x ; y ) = ( 0.2 ; 0 ) is the source of harmonic vibrations. It can be written as a sinusoid:
U ( 0.2 ; 0 ; t ) = 30 1 sin 16 π t ,   t > 0 .
The boundary conditions for the defect are set similarly to (4):
U / n ¯ | Γ 2 = 0 .
The second mathematical model is similar to the model described by Equations (2)–(4), (6), (7) and takes into account the location of the defect:
G = { ( x s ; y s ) |     ( x s ; y s ) = ( x ; y ) M , x [ 0.5 10 3 ; 0.5 10 3 ] , y [ 0.15 ; 0.15 ] , M = ( cos φ sin φ sin φ cos φ ) , φ = π 4 } .
Contour plots (level lines), which are shown in Figure 1, show that when the ultrasonic signal passes through any interference, such as cracks, gaps are formed. The main fragments of gaps in the received signal are shown in Figure 2.
In any case, even minor defects of the material are immediately noticeable. According to the mathematical simulation, there is a significant change in the amplitude of the received signal. This fact is demonstrated by the simulation results shown in Figure 3.
Some computational experiments were carried out to determine the influence of the crack size on the received signal. They showed the effect of the length of a crack-type defect on the amplitude and frequency [26,27,28,29]. Figure 4 shows the main results of these experiments.
It was found that when sound waves pass through cracks, the amplitude of the received signal decreases noticeably compared with the original one, which is carried out by the source. The oscillation frequency is also reduced, and the received signal has a nonlinear component. The obtained results were used to study the composite elements of parts containing noticeable heterogeneity.

3.1. Formulation of Inverse Problems

Homogeneous materials were used in this study, for which the propagation speed of ultrasonic waves does not depend on the molecular structure of the medium. This allows, by measuring the time of delay and damping of waves at different points of the controlled object, the formulation of conclusions about the properties of the medium to determine defects of various shapes and origins [23,24,30,31].
A model for determining the position of the source of ultrasonic vibrations was developed. The propagation of ultrasonic waves can be mathematically described by a wave equation (linear and nonlinear) of the second order. It is considered that the body is elastic and the deformation is elastic and insignificant in comparison with the geometric dimensions of the object itself. The task consisted in determining the geometric position of the exciter of oscillations, given that sensors were located at specific positions of the investigated area of the object and received the signal formed by the source.
The physical and technical characteristics of the investigated object are as follows. The velocity of propagation and attenuation of the waves are known. The frequency and amplitude of the oscillations are also known. The mathematical model of the problem has an optimization formulation, in which it needs to find the minimum of the function:
F ( x s o u r c e , y s o u r c e ) = 1 n i = 1 n [ τ i b e g τ i e n d ( s i ( x s o u r c e , y s o u r c e , t ) s i e x p e r i m e n t a l ( t ) ) 2 d t ] min .
Restrictions (9) are applied in the form:
{ s i ( x s o u r c e , y s o u r c e , t ) = U ( x i s e n s o r , y i s e n s o r , t ) , 0 τ i b e g τ i e n d T ,   i = 1 , n ¯ , 2 U / t 2 = Δ U   o n   Ω ,   t [ 0 ; T ] , U ( x , y , 0 ) = U t ( x , y , 0 ) = 0 , U / n ¯ = 0 ,   t [ 0 ; T ] , U ( x s o u r c e , y s o u r c e , 0 ) = A sin ( 2 π f t ) ,
where n—total number of sensors; τ i b e g —start time of observation on the ith sensor; τ i e n d —finish time of observation on the ith sensor; s i e x p e r i m e n t a l ( t ) —data of the ith sensor within a certain time [ τ i b e g ; τ i e n d ] ; T—total time of experiment; Ω —computing area of the problem (object under study); A, f—amplitude and frequency; ( x i s e n s o r , y i s e n s o r ) —position of the ith sensor; ( x s o u r c e , y s o u r c e ) —position of the vibration’s source.
A mathematical model of the form (10) and (11) belongs to the models of the class of nonlinear global optimization.
In such mathematical models, the constraint on the objective function (9) is usually the wave equation, which describes the process of wave propagation in a particular medium. A function of the form (9) is nonlinear; therefore, stochastic or population methods can be used to minimize it, since local minima can be obtained for it. Model (10) and (11) is an inverse problem, since according to the results of the data from the sensors (indirect measurements—consequence), it is necessary to establish the position of the source (cause).
Below are the results of the computational experiments performed using the MATLAB 2019b environment. The mathematical model of problem (10) and (11) is solved using the finite difference method. The computational grid is 60 × 60 nodes, and w = 32 is the number of bits for encoding by the genetic algorithm.

3.2. Numerical Solution of the Obtained Models of Inverse Problems

To analyze the adequacy of the developed mathematical model, 20 computational experiments were carried out on various test data. One of these computational experiments with corresponding test data is shown below. The task is to find the global minimum of the function:
F ( x s o u r c e , y s o u r c e ) = 1 8 i = 1 8 [ 0 1 , 5 ( s i ( x s o u r c e , y s o u r c e , t ) s i e x p e r i m e n t a l ( t ) ) 2 d t ] min ,
with restrictions in the form:
{ s i ( x s o u r c e , y s o u r c e , t ) = U ( x i s e n s o r , y i s e n s o r , t ) , 2 U / t 2 = Δ U ,   t [ 0 ; 1.5 ] , Ω = ( x , y ) [ 0 ; 1 ] 2 ,   i = 1 , 8 ¯ , U ( x , y , 0 ) = U t ( x , y , 0 ) = 0 , U / n ¯ = 0 ,   t [ 0 ; 1.5 ] , U ( x s o u r c e , y s o u r c e , 0 ) = A sin ( 2 π f t ) .
where Δ —Laplace operator.
Source characteristics: A = 30 1 , f = 9 . The position of the sensors is shown in Table 1.
It should be noted that for inverse problems in general, the more information is available about the object under study, the easier it is to solve such a problem. In general, the number of sensors should be selected from analytical reasoning about the availability and amount of information about the object under study.
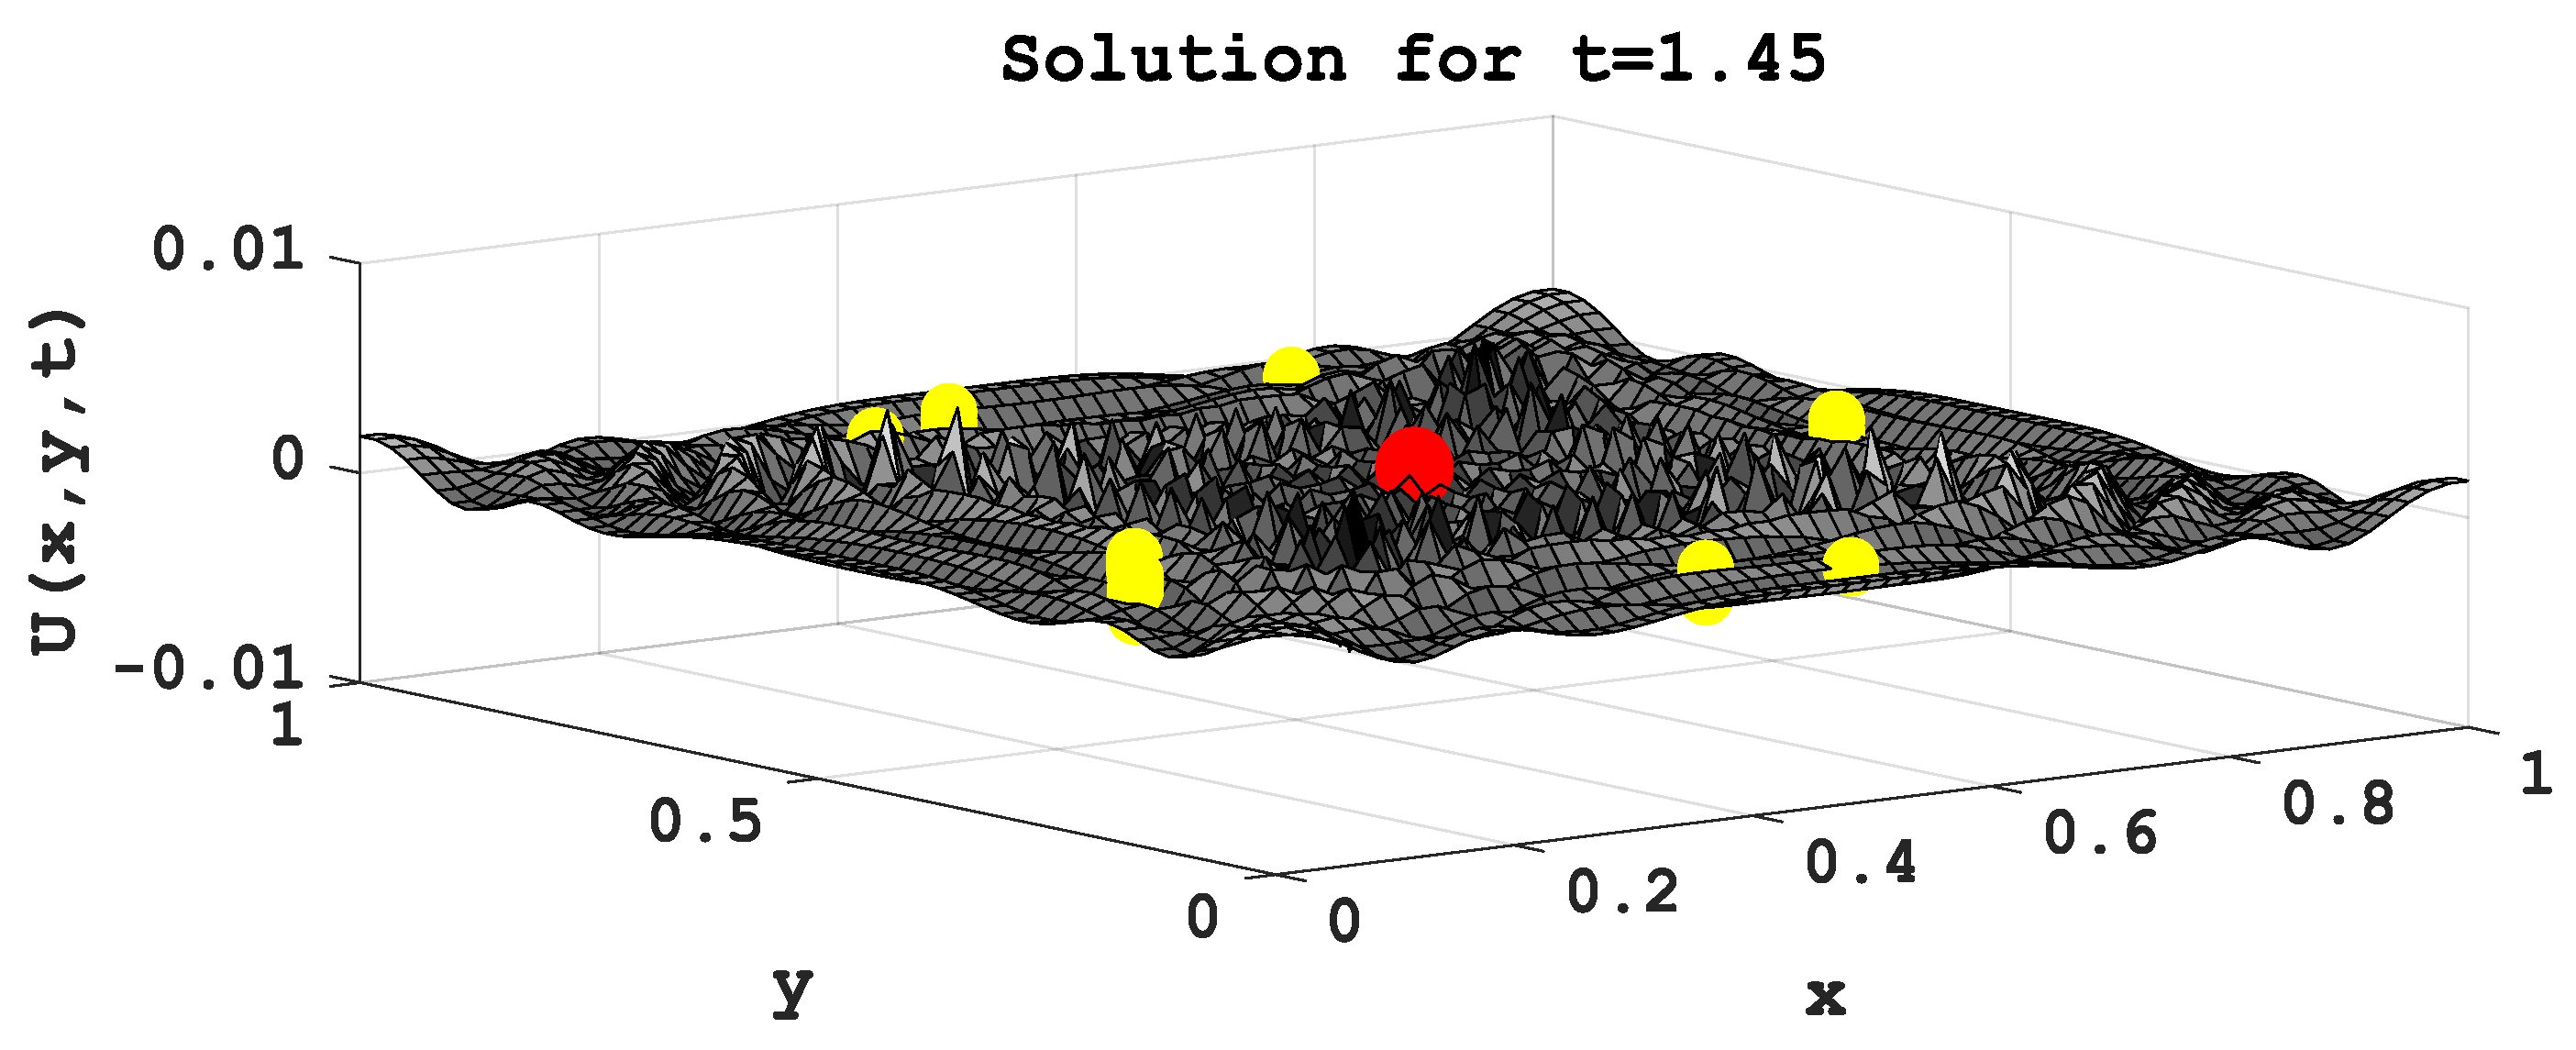
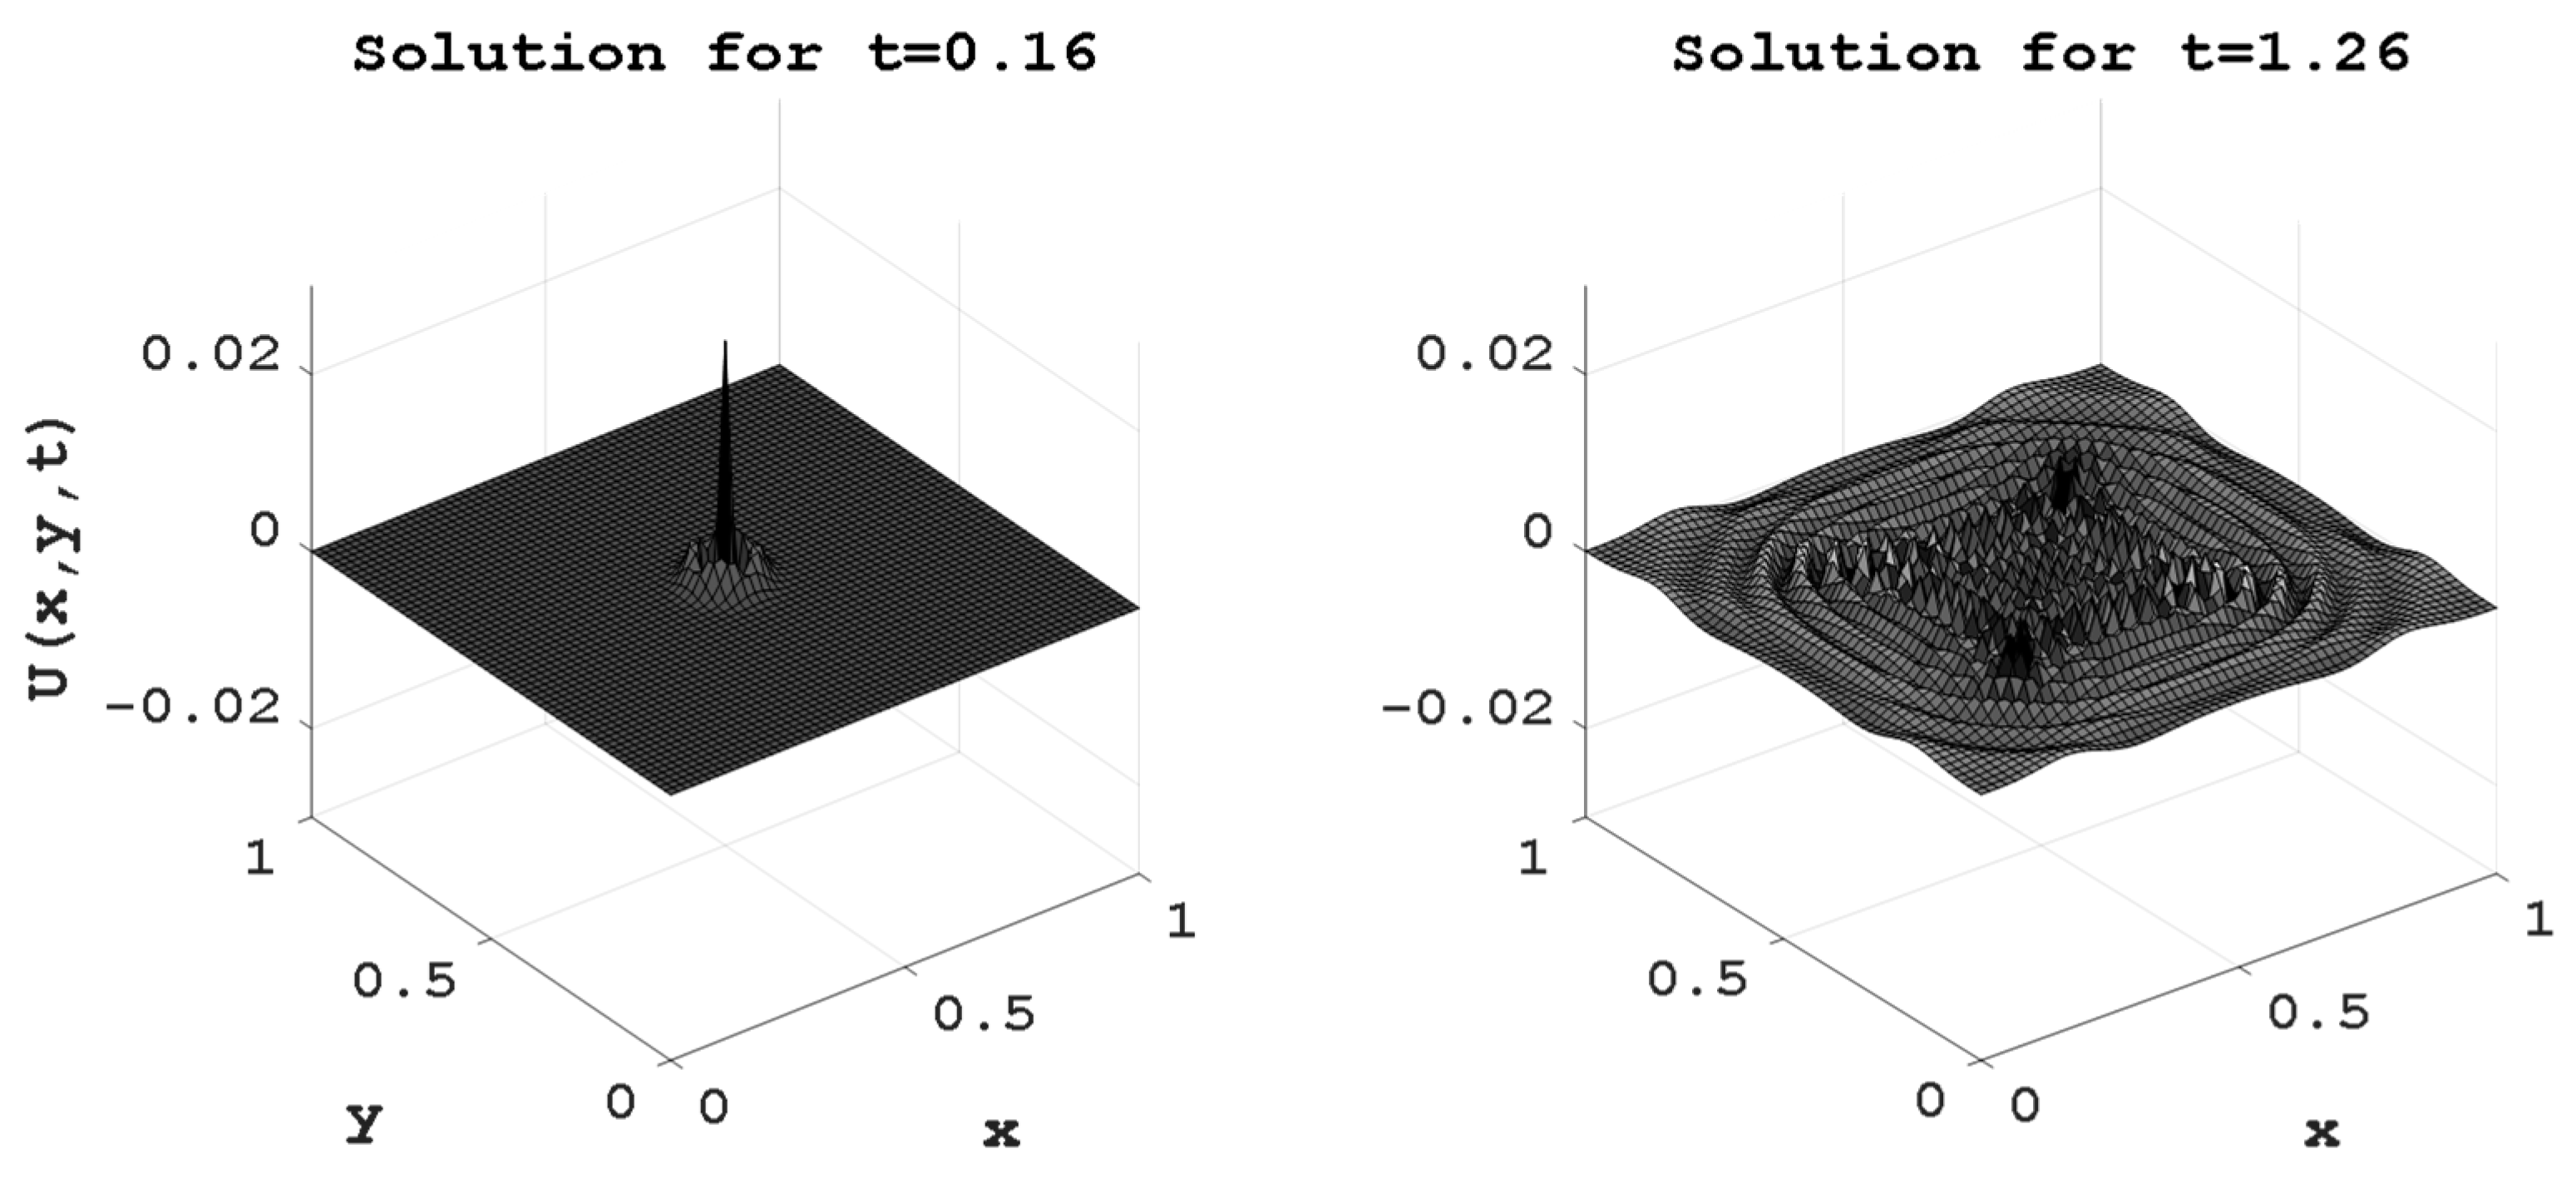
Figure 5 shows the numerical solution of the wave equation for the time t = 1.45 milliseconds. Figure 5 also shows the position of the sensors, the coordinates of which are given in Table 1, and the source of vibration.
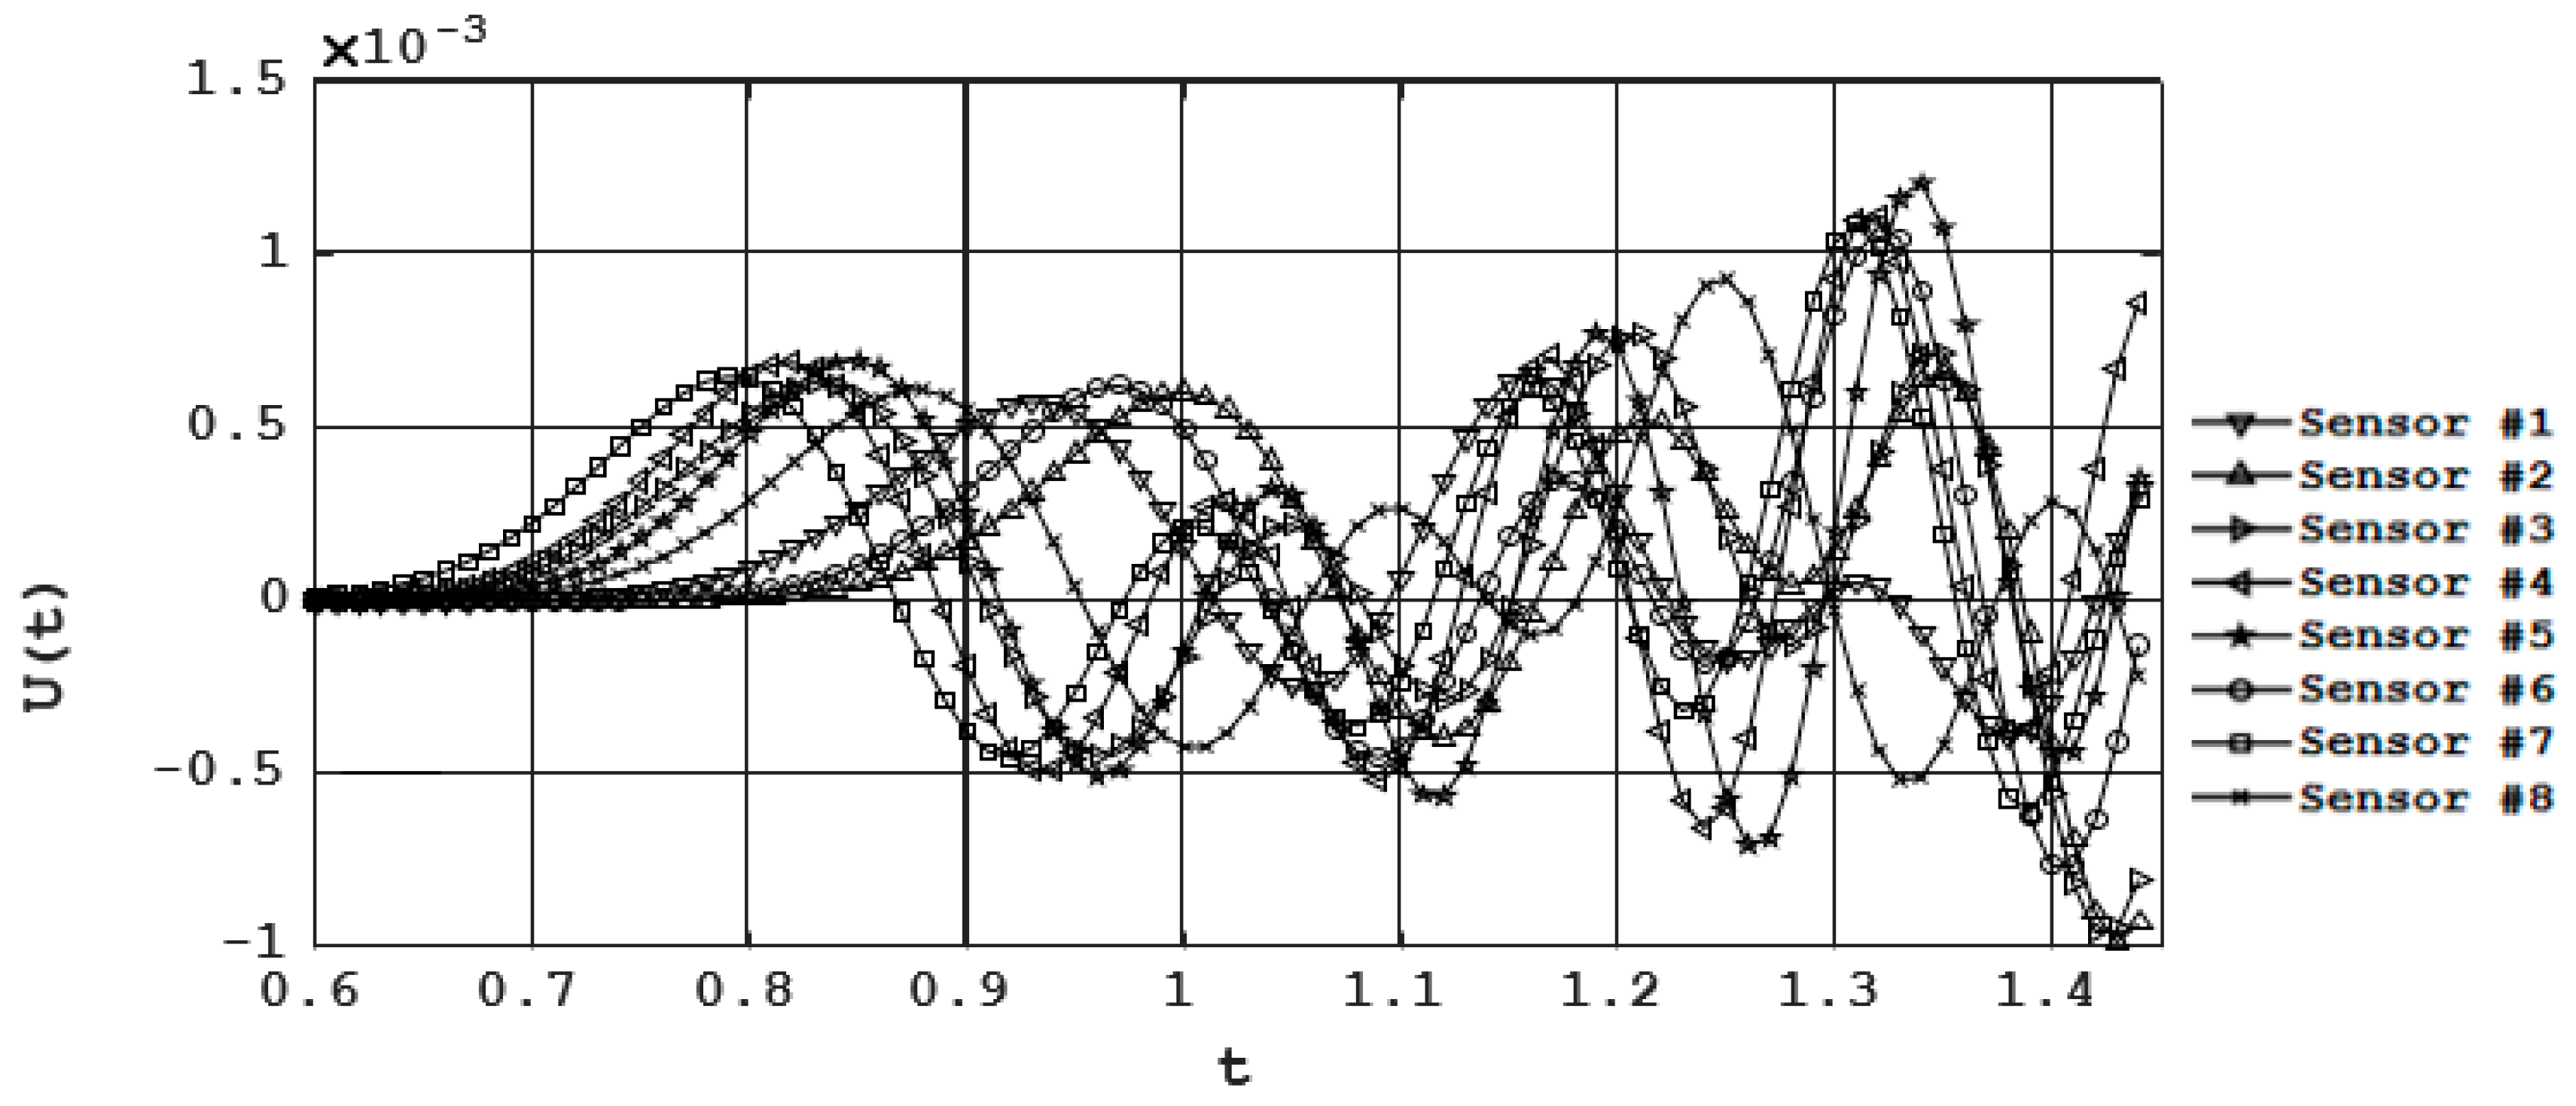
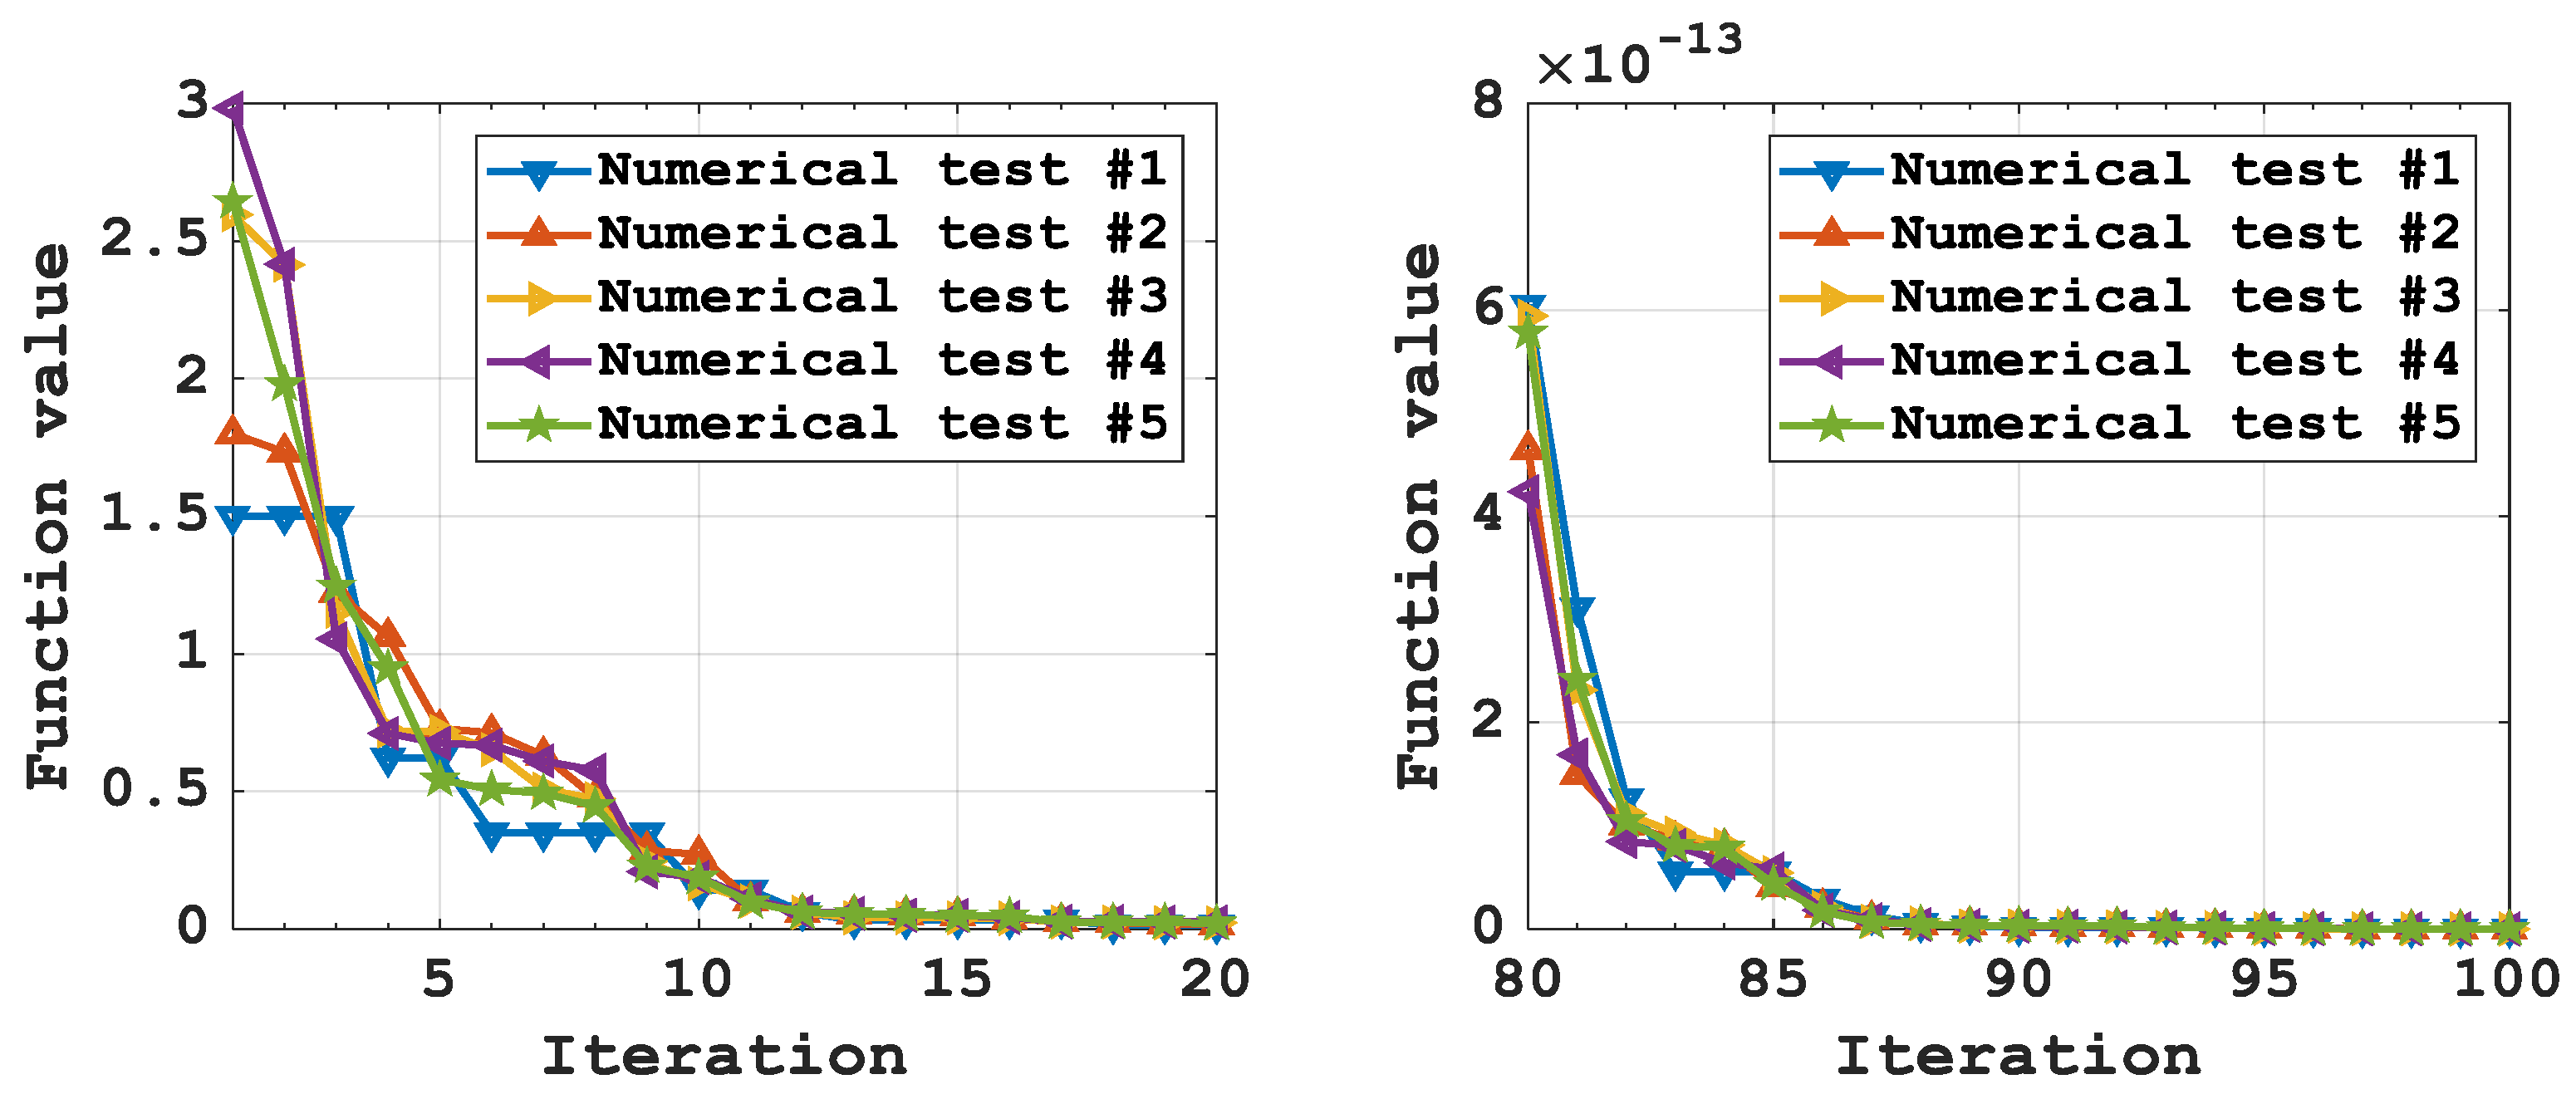
Figure 6 displays the data obtained from the sensors, the geometric arrangement of which is given in Table 1. It should be noted that all sensors receive data during the same period of time. Figure 7 shows the value of the objective function (12) of the mathematical model (12) and (13) using the classical genetic algorithm [32,33] at the first 20 and at the last 20 iterations.
To implement a model of type (10) and (11), other methods and algorithms can be used for conditional and unconditional nonlinear global optimization, such as PSO [34] and the method of differential evolution [35], since the number of sought model variables is small. If the number of variables in the problem is large, it is advisable to use a combination of stochastic and deterministic optimization methods or hybrid optimization methods in general.
Further, the model for determining the physical characteristics of the source of ultrasonic vibrations in objects is considered. The task of ultrasonic testing is very relevant in the implementation of non-destructive testing of complex objects and systems. The diagnostic procedure provides for the creation of mathematical models for determining the residual working resources of such systems, as well as for carrying out various computational experiments in order to test the parameters of the developed mathematical models and adapt them to the processes that are distributed in these objects and systems [36,37].
Next, the propagation of sound in a plate is investigated, the physical and geometric characteristics of which are known. Oscillating processes in the plate are carried out by a point source for a certain period of time, the characteristics of which (amplitude and frequency) are unknown. The geometrical position of the source is known (given by coordinates). At some fixed points (given by coordinates), there are sensors that receive the feedback of the signal, which is carried out by the source. It is necessary to determine the characteristics (amplitude and frequency) of the source according to the known indicators of the sensors that receive a signal response within a certain period of time.
An optimization mathematical model is proposed for determining the amplitude and frequency of a point source of a sound signal, based on experimental data obtained by sensors. The model is as follows:
F ( A , f ) = 1 n i = 1 n [ τ i b e g τ i e n d ( s i ( A , f , t ) s i experimental ( t ) ) 2 d t ] min ,
with restrictions in the form [38,39,40]:
{ s i ( A , f , t ) = U ( A , f , x i s e n s o r , y i s e n s o r , t ) ; 0 τ i b e g < τ i e n d T ,   i = 1 , n ¯ ;   t [ 0 ; T ] ; 2 U / t 2 = c 2 ( 2 U / x 2 + 2 U / y 2 ) , Ω = ( x , y ) [ a ; b ] × [ c ; d ] ,   a , b , c , d ; ( U / n ) | Γ = 0 ,   t [ 0 ; T ] ; U ( A , f , x s o u r c e , y s o u r c e , t ) = A sin ( 2 π f t ) .
Initial data for conducting numerical experiments (13) and (14): Source position: (0.5; 0.5). Number of sensors—8. Computational area is unit square. Finish time T = 1.5. Sensor positions: (0.5333; 0.0667), (0.7167; 0.9167), (0.4500; 0.1167), (0.1500; 0.3500), (0.3167; 0.8500), (0.1000; 0.2833), (0.8667; 0.5167), (0.4167; 0.9000).
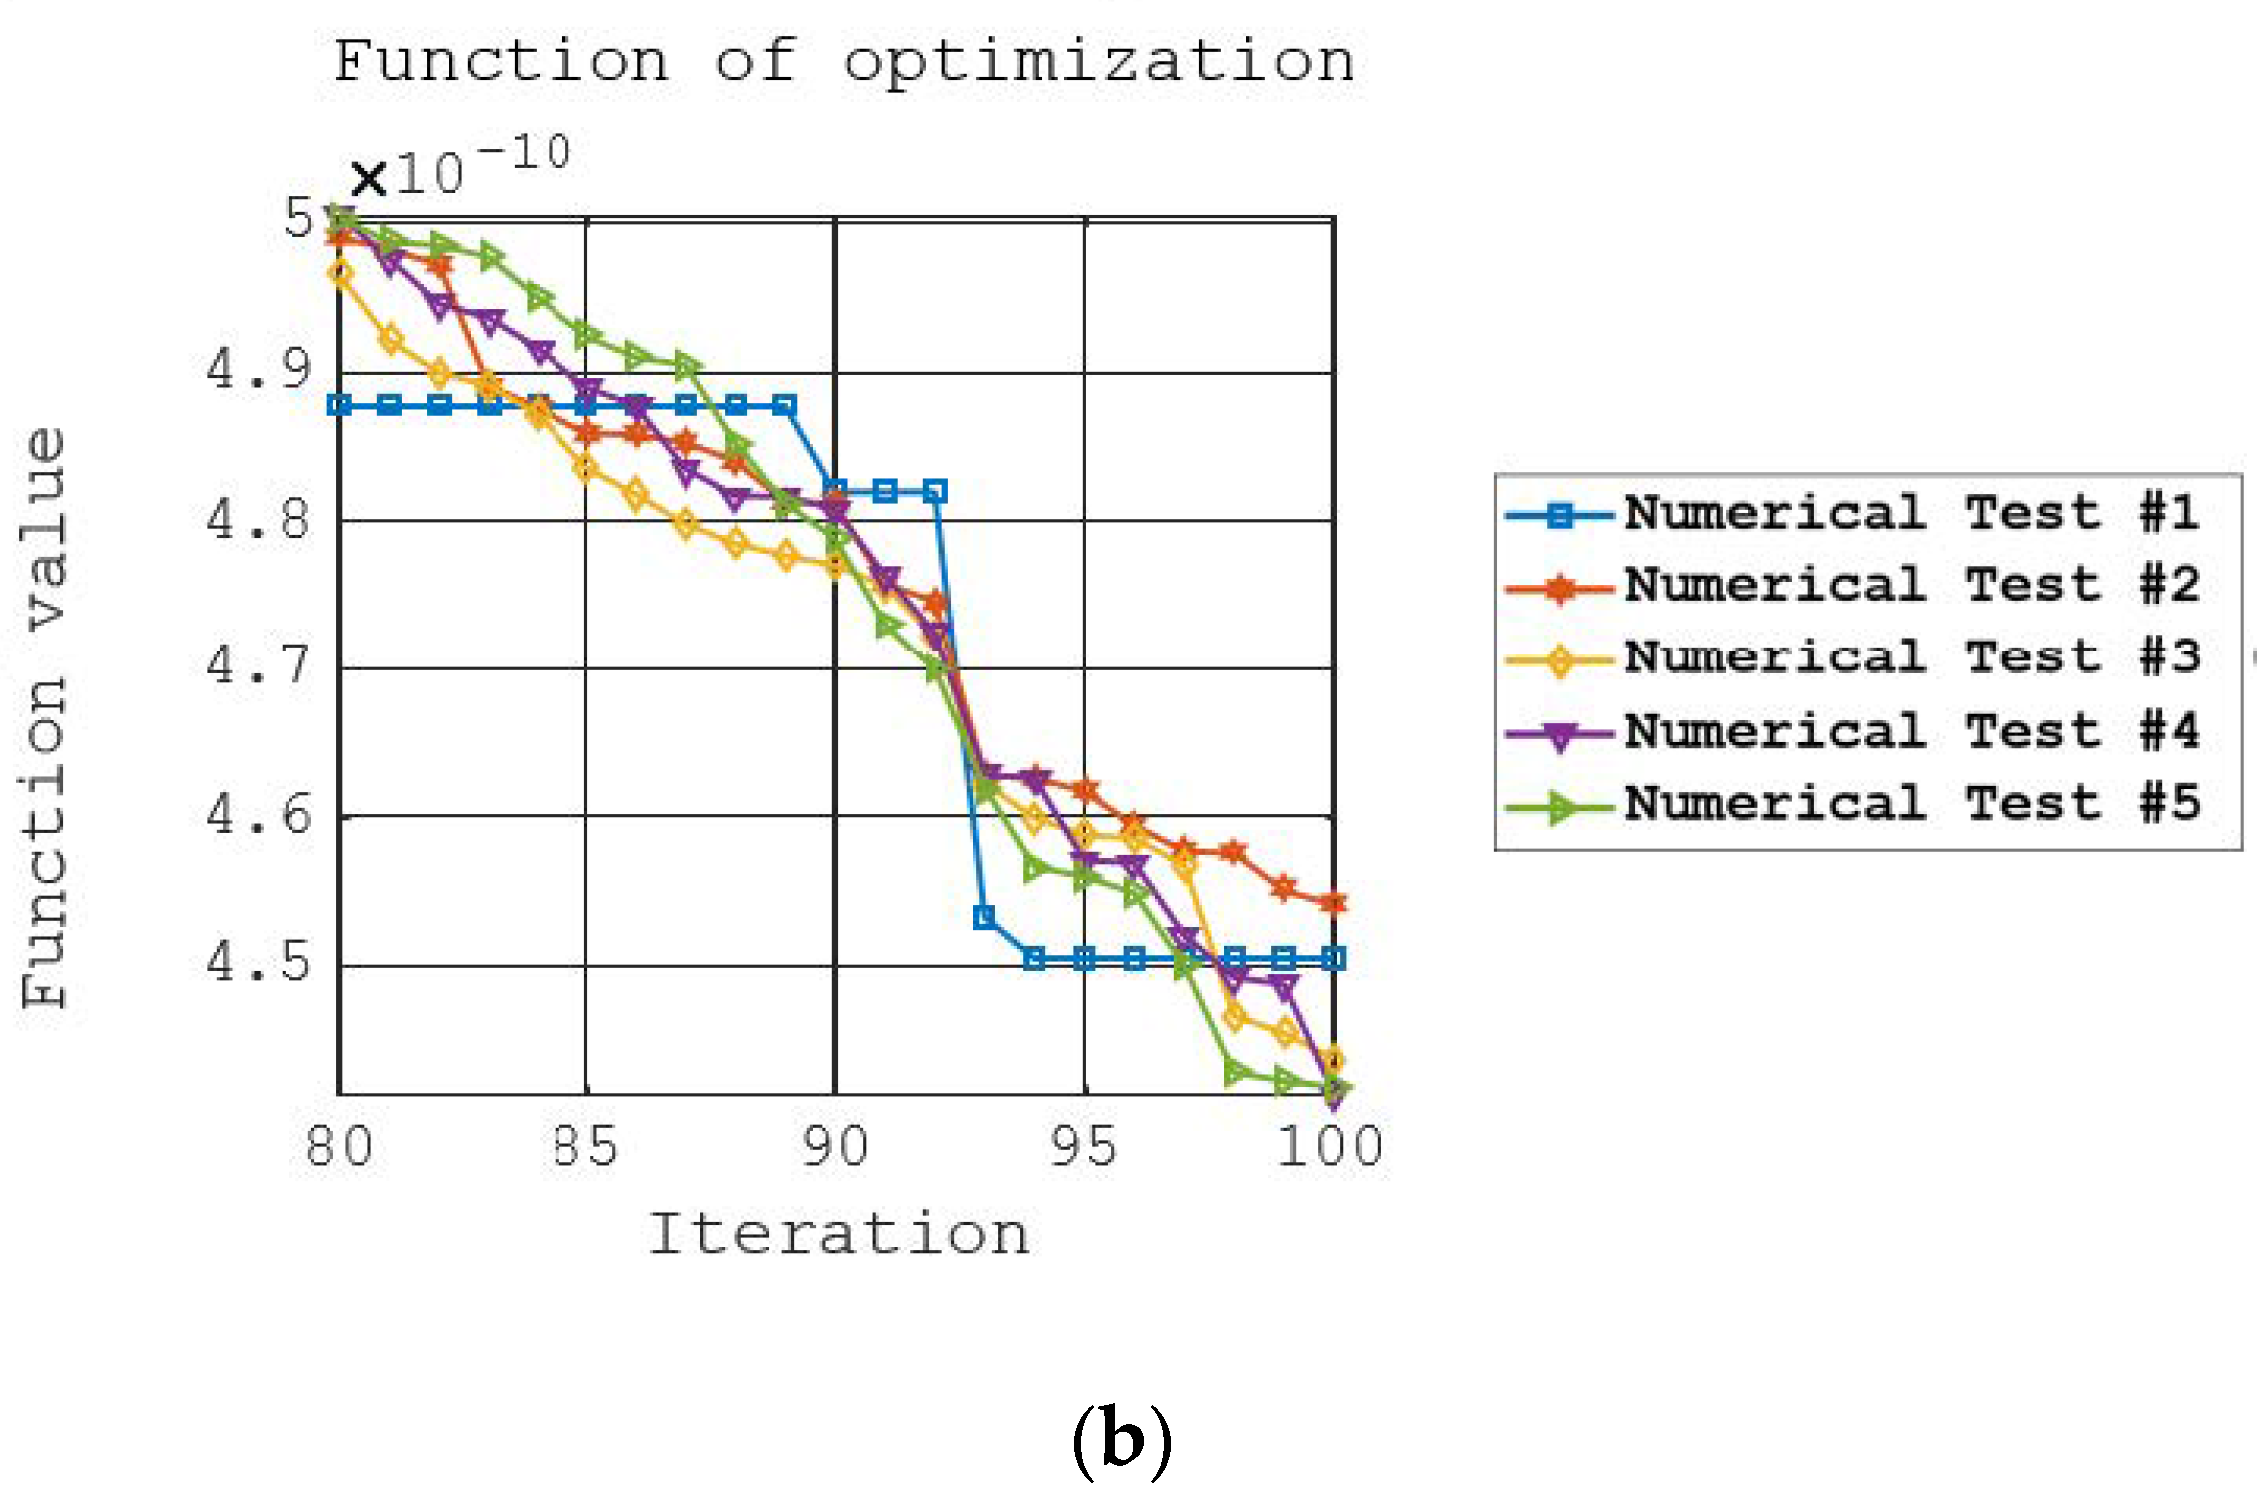
Figure 8 shows the main simulation results for (13) and (14) by the finite difference method. For optimization (13), a classical genetic algorithm was used. The computational grid—60 × 60 nodes, the number of bits for encoding in the genetic algorithm—w = 32. The number of iterations of the classical genetic algorithm—100. The number of computational experiments—5. Classical existing methods were used to find the numerical solution of the hyperbolic equation—the method of finite differences and finite elements [41,42,43].
Based on the results of computational experiments, it was found that the classical algorithm finds a numerical solution to the problem posed fairly accurately. The found values are A = 0.033334; f = 9.0000154. The real values of the parameters A and f are 1/30 and 9, respectively.
The mathematical model (10) and (11) can be used in the study of elements and structures to determine defects, for example, microcracks and potholes. Models (10) and (11) can be easily modified to study ultrasonic processes in three-dimensional objects of complex shape.

3.3. Mathematical Model for Determining the Velocity of Propagation of Sound Waves in Solids

The mathematical basis for the study of such processes is the second-order wave equation of mathematical physics. Next, we will consider the equation in the area G n [44,45,46]:
2 U ( x ¯ , t ) t 2 = c 2 i = 1 n 2 U ( x ¯ , t ) x i 2 + f ( x ¯ , t ) ,
where
x ¯ = ( x 1 , x 2 , , x n ) n ,   t [ 0 , T f i n ] ,
x i [ a i , b i ] ,   a i ,   b i ,   G = [ a 1 , b 1 ] × [ a 2 , b 2 ] × × [ a n , b n ] ,   i = 1 , n ¯ .
Basic designations: x i —spatial coordinate; n—dimension of space; x ¯ —coordinate vector; t—time; U—desired solution of the model; c—sound velocity in the medium; T f i n —finish time.
The initial conditions for (15) are as follows [45]:
U ( x ¯ , 0 ) = g 1 ( x ¯ ) ,   U t ( x ¯ , 0 ) = g 2 ( x ¯ ) .
The boundary conditions for (15) and (16) are set depending on the formulation of the problem and correspond to a specific physical process. As an example of the propagation model of wave processes that are carried out by a point source, let us consider a direct model, which is described by the equation:
2 U / t 2 = 2 U / x 2 + 2 U / y 2 ;   ( x , y ) [ 0 ; 1 ] 2 ;   t [ 0 ; 2 ] .
The initial conditions are:
U ( x , y , 0 ) = U t ( x , y , 0 ) = 0 .
The boundary conditions are [45]:
U / n ¯ | Γ = 0 ,   t > 0 .
The internal condition is:
U ( 0.5 ; 0.5 ; t ) = 30 1 sin 18 π t ,   0 < t < 0.2 .
Internal condition (20) sets harmonic oscillations, which are carried out by a point source directly inside the object under study.
Figure 9 shows the solutions of the mathematical model (17)–(20).
The task is to find the global minimum of the quadratic function [46,47,48]:
F ( c ) = 1 n i = 1 n [ τ i b e g τ i e n d ( s i ( c , t ) s i e x p e r i m e n t a l ( t ) ) 2 d t ] min ,
where c—velocity of propagation of sound waves in the medium; s i ( c , t ) = U ( x i s e n s o r , y i s e n s o r , t ) , 0 τ i b e g < τ i e n d T ,   i = 1 , n ¯ , and the restriction on (21) is the wave equation and describes the process of propagation of sound waves:
2 U / t 2 = v 2 Δ U ,
which is considered in the computing area Ω = ( x , y ) [ a ; b ] × [ c ; d ] ,   a , b , c , d , and t [ 0 ; T ] .
The initial conditions for (22) are as follows [48]:
U ( x , y , 0 ) = U t ( x , y , 0 ) = 0 .
The boundary conditions are as follows:
U / n ¯ | Γ = 0 , t [ 0 ; T ] .
The internal condition is:
U ( x s o u r c e , y s o u r c e , t ) = A sin 2 π f t .
The initial data for model (21)–(25) are the same as for other models of inverse problems of ultrasonic testing.
Table 2 contains numerous results of computational experiments of model (21)–(25) using the classical genetic algorithm. The number of bits for encoding—32, and the total number of genetic algorithm iterations—100.
Wave processes in any investigated objects have the property of damping; therefore, instead of (25) it is advisable to use [45,49,50]:
2 U ( x ¯ , t ) t 2 = c 2 i = 1 n 2 U ( x ¯ , t ) x i 2 + γ i = 1 n U ( x ¯ , t ) x i + f ( x ¯ , t ) ,
where γ—wave attenuation coefficient. In this case, taking into account (26), model (21)–(25) will contain function (21), which will depend on two variables c and γ .
Control system. The Institute of General Energy of the National Academy of Sciences of Ukraine has developed a system for ultrasonic testing of objects of complex geometric shapes [37] (Figure 10), the main technical characteristics of which are given in Table 3.
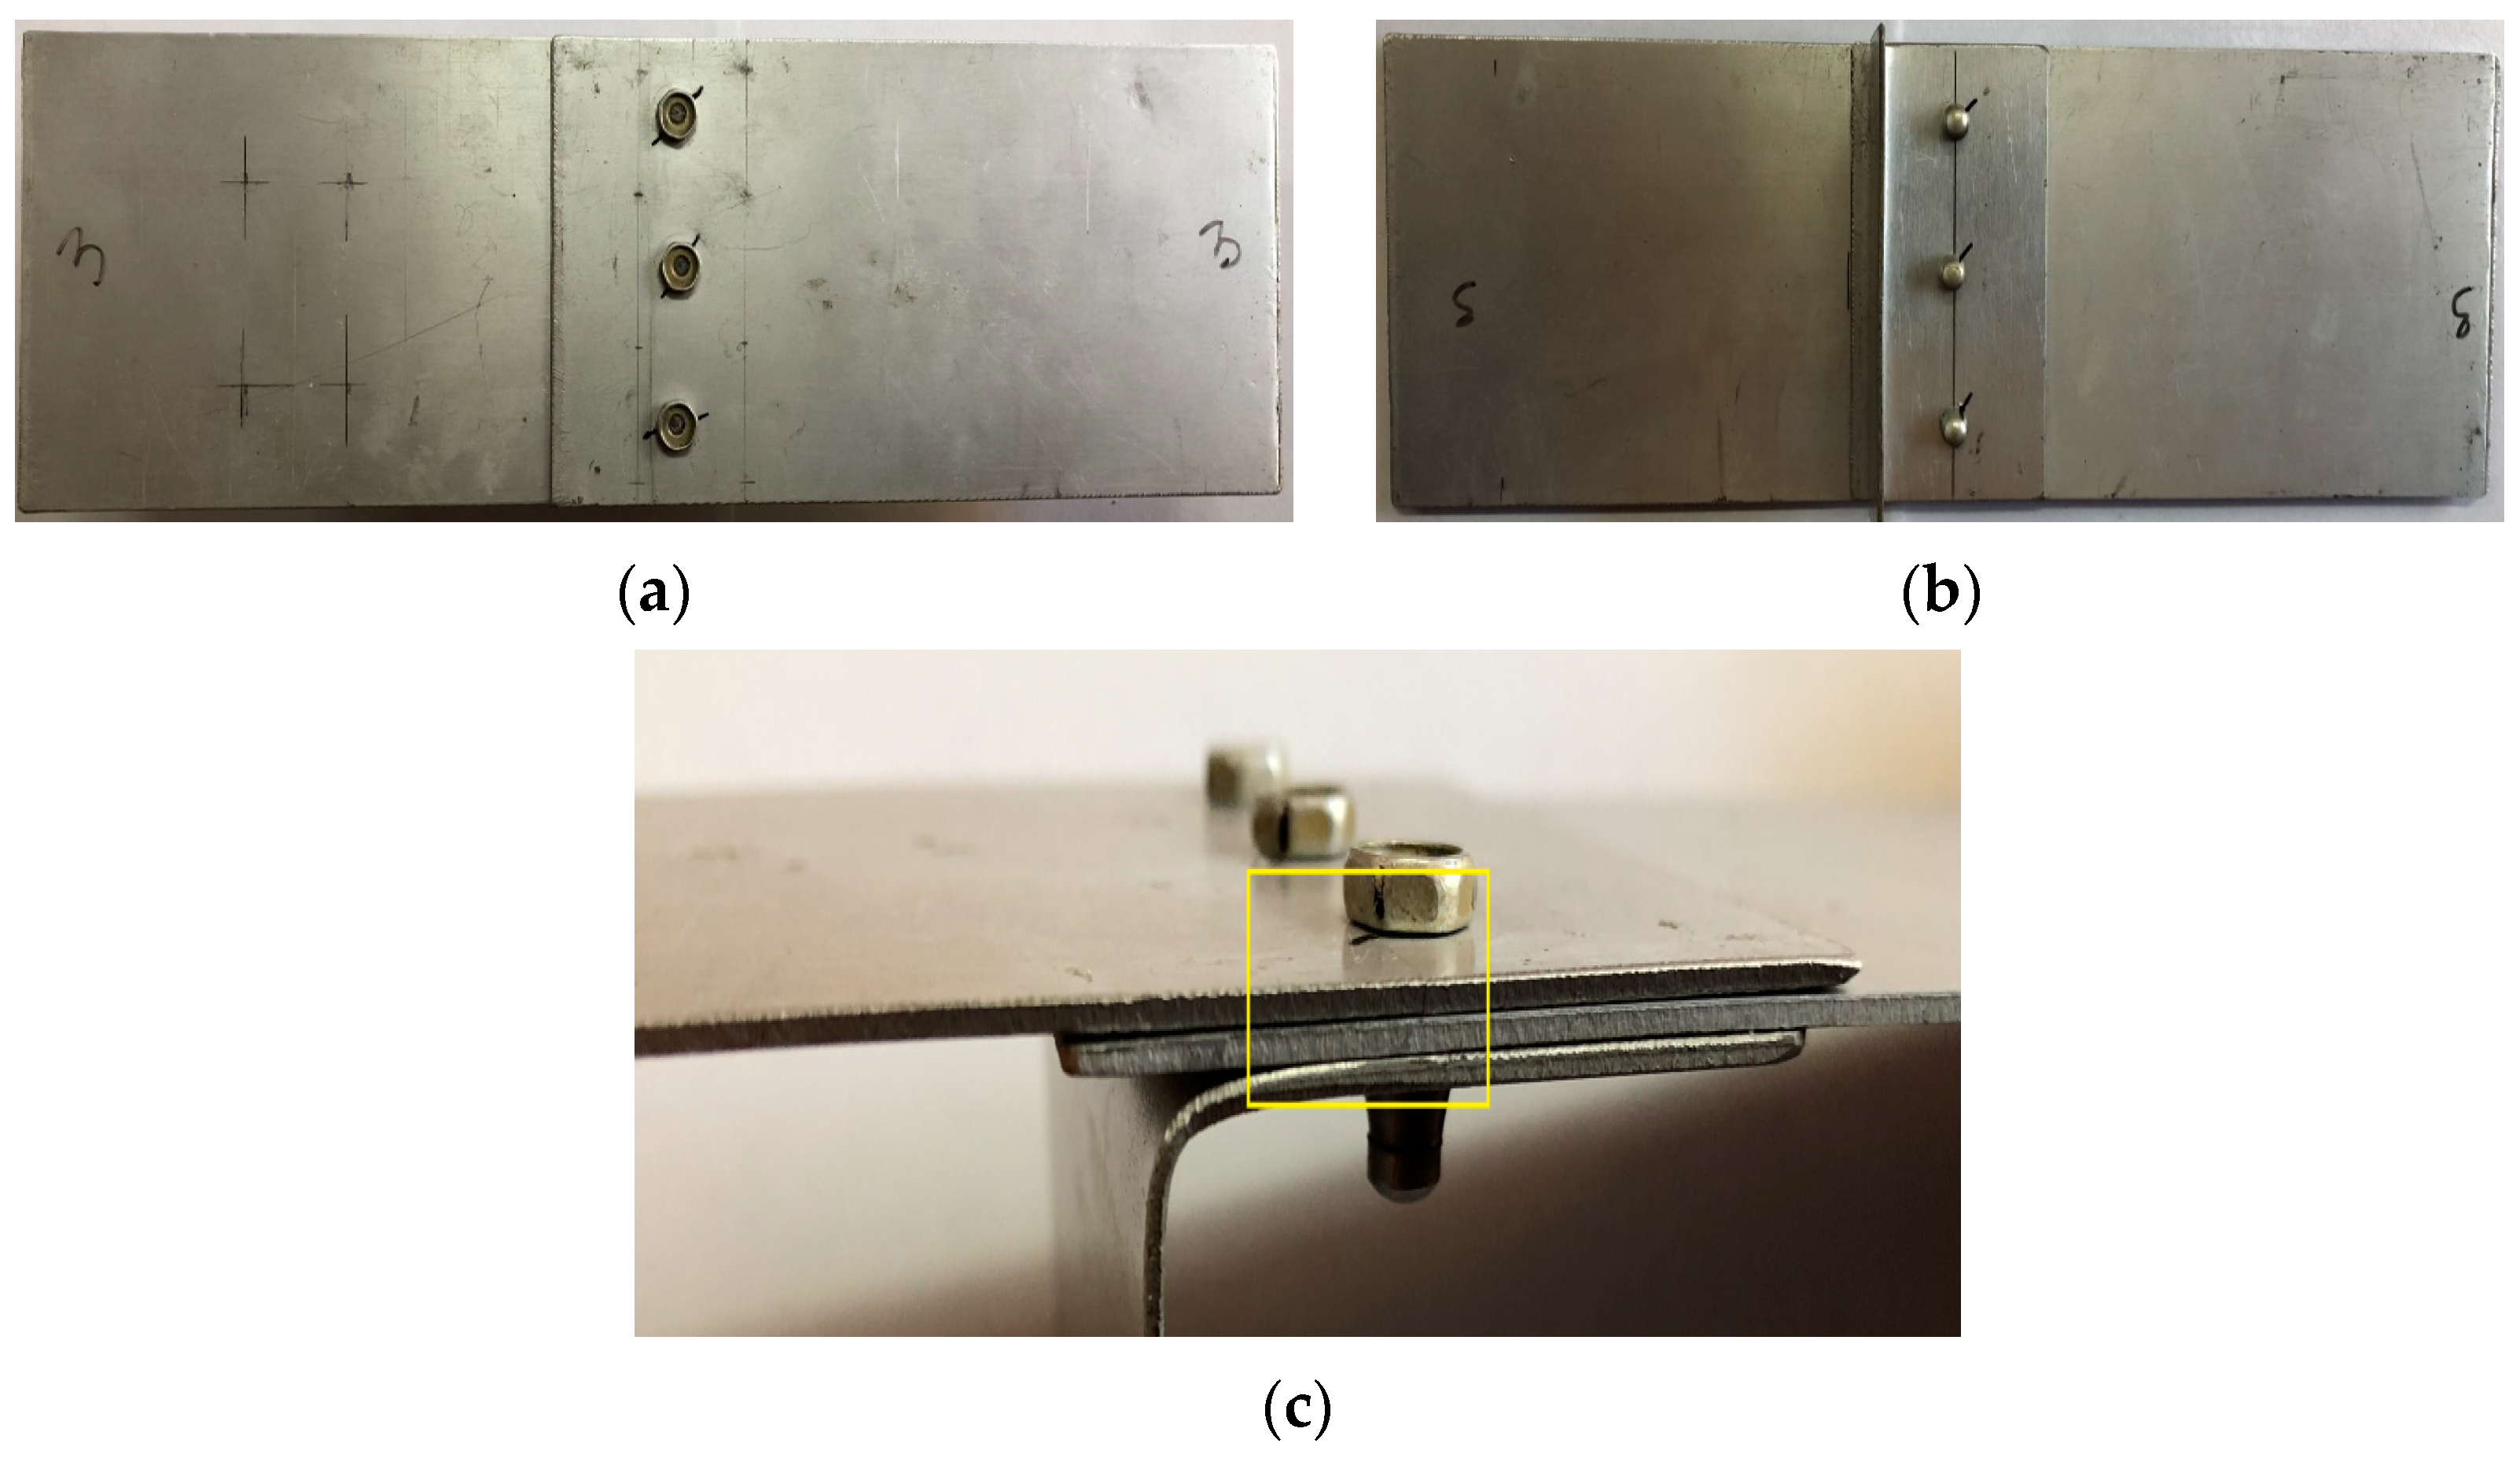
Experimental results. For the experiment, the samples used (Figure 11) were provided by the Ukrainian Research Institute of Aviation Technologies and made of aluminum-based alloy.
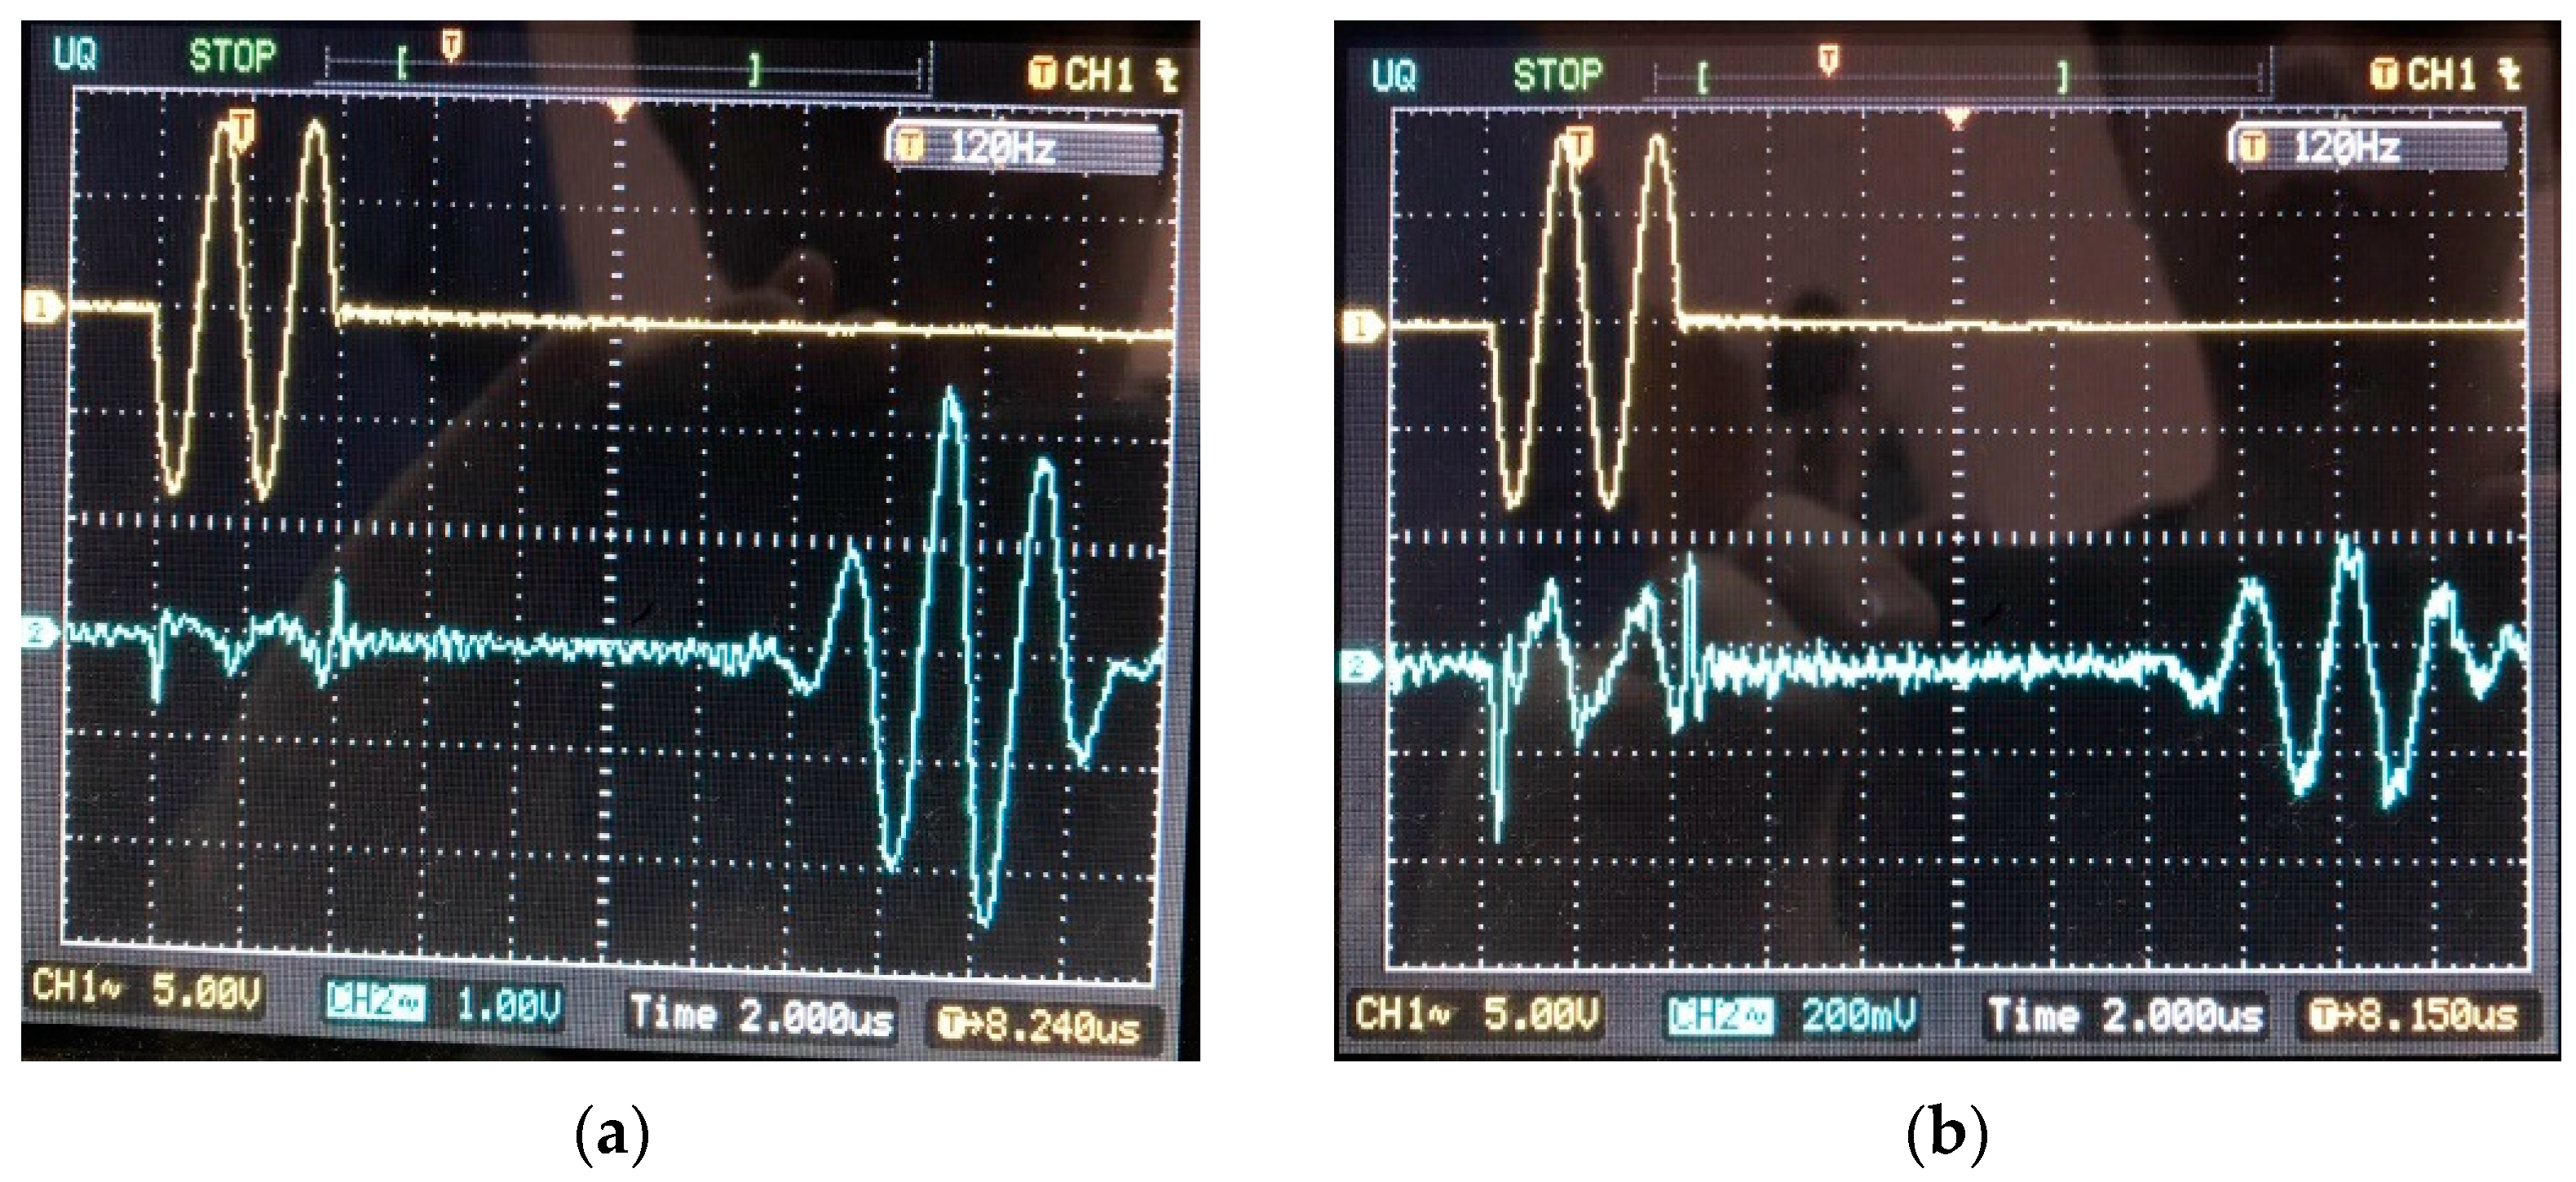
To determine the velocity of wave propagation, a marking was applied to the part (Figure 11, points 1 and 2). The transducers were placed at the given points and an oscillogram was taken (Figure 12). Signal parameters were determined using the markup on the oscilloscope screen.
Here are the main characteristics of the measuring instruments and auxiliary equipment that were used in the study of the various samples by ultrasonic testing. Electronic unit BG-219v1 for generating and receiving radio pulse signals: Filling oscillation frequencies—0.1 MHz, 0.25 MHz, 0.5 MHz, 1.0 MHz, 1.25 MHz, 2.5 MHz, 5.0 MHz, 10.0 MHz. The duration of the radio pulse—1…16 periods of filling oscillation. The repetition rate of radio pulses—1…100 Hz. The amplitude of the radio pulses—0…10 V. The output impedance of the radio pulse generator—0.1…0.5 Ohm. The amplification coefficient of the receiving amplifier—4000. Microscope MBS-9: magnification, multiplicity—3.33…100. Linear field of view, mm—39.3…2.4. Working distance of the microscope—64 mm. Light source—lamp 8 V, 20 W. Oscilloscope digital storage GDS-71102 with bandwidth 100 MHz; number of channels—2. Maximum sampling rate—250 MHz. Memory capacity—4 KB per channel. Sampling modes: sampling, peak detector (>10 ns), averaging (2…256). Interface—USB 2.0 for control and data connection. Sample dimensions—255 × 75 × 1 mm. Sizes of artificially grown cracks in riveted joints—length: 17 mm, depth: 1 mm (for the entire thickness of the sample), crack opening: 0.05–0.1 mm.
Determination of wave propagation velocity. The signals obtained experimentally are shown in Figure 12. The time it takes for the signal to pass from the emitter to the receiver is 14 μs, t = 13.2·10−6 s. Next, the converters were connected (Figure 13) and the oscillograms were taken (Figure 14) to determine the total signal delay time in the waveguides of the emitter and receiver [51].
The time it takes for the signal from the transmitter to reach the receiver is 7 microseconds. So, the delay time td = 7·10−6 s. Therefore, the wave velocity in the sample, υ = L / ( t t d ) , is:
v = 0.02/(13.2·10−6 − 7·10−6) = 3225 m/s.
Figure 14 shows oscillograms of the signal when passing through defect-free areas and the area with a crack. The measured amplitude and delay of signals are given in Table 4 (2Um—double amplitude).

3.4. Comparative Analysis

The general strategy of this research and comparisons of the results (modeling and experiment) are presented in Figure 15. Each physical computational experiment is performed according to this scheme.
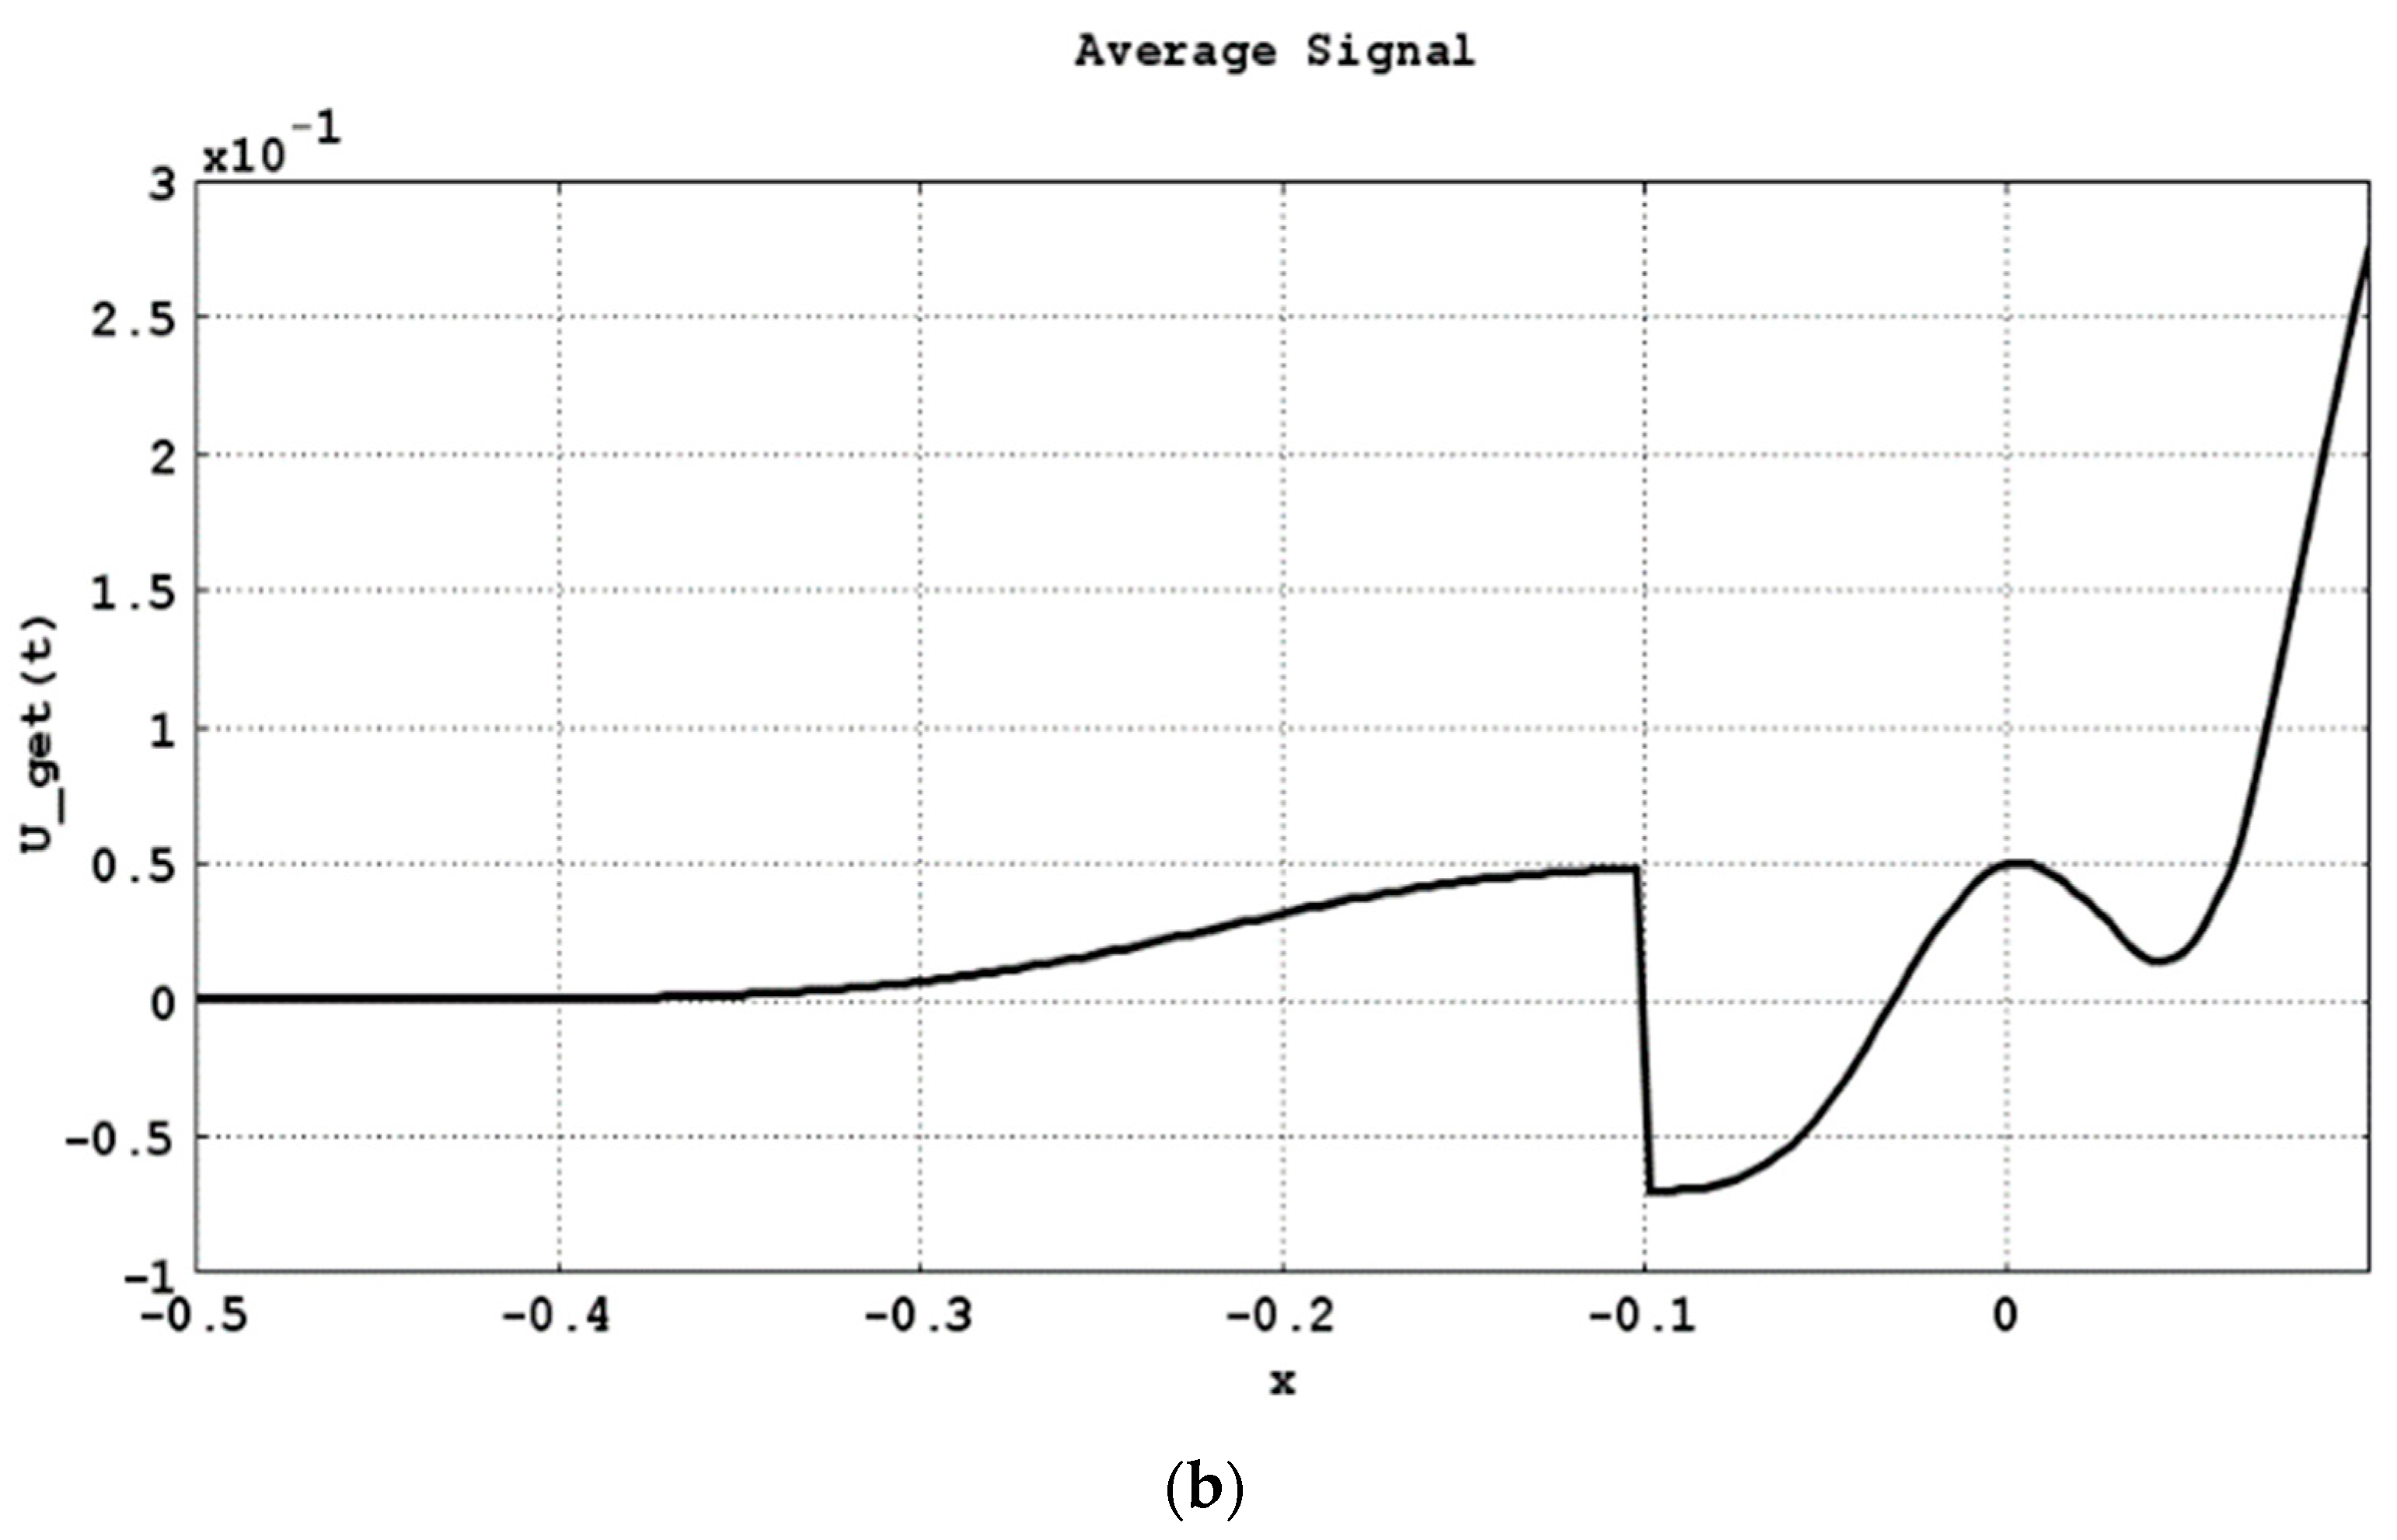
To increase the reliability of the received signals, multiple studies were carried out according to the strategy shown in Figure 15. The obtained experimental data were averaged, which made it possible to minimize the influence of interference such as white noise. The generated signals were transmitted using an ADC via a USB connection to a PC and had the form shown in Table 5.
Table 5 contains data about the signals generated by the developed ultrasonic testing device. The number of experiments performed was eight. A graphical representation of the generated signals and their average values are shown in Figure 16.
Figure 17 shows the response signals obtained when passing through a crack in the object shown in Figure 11.
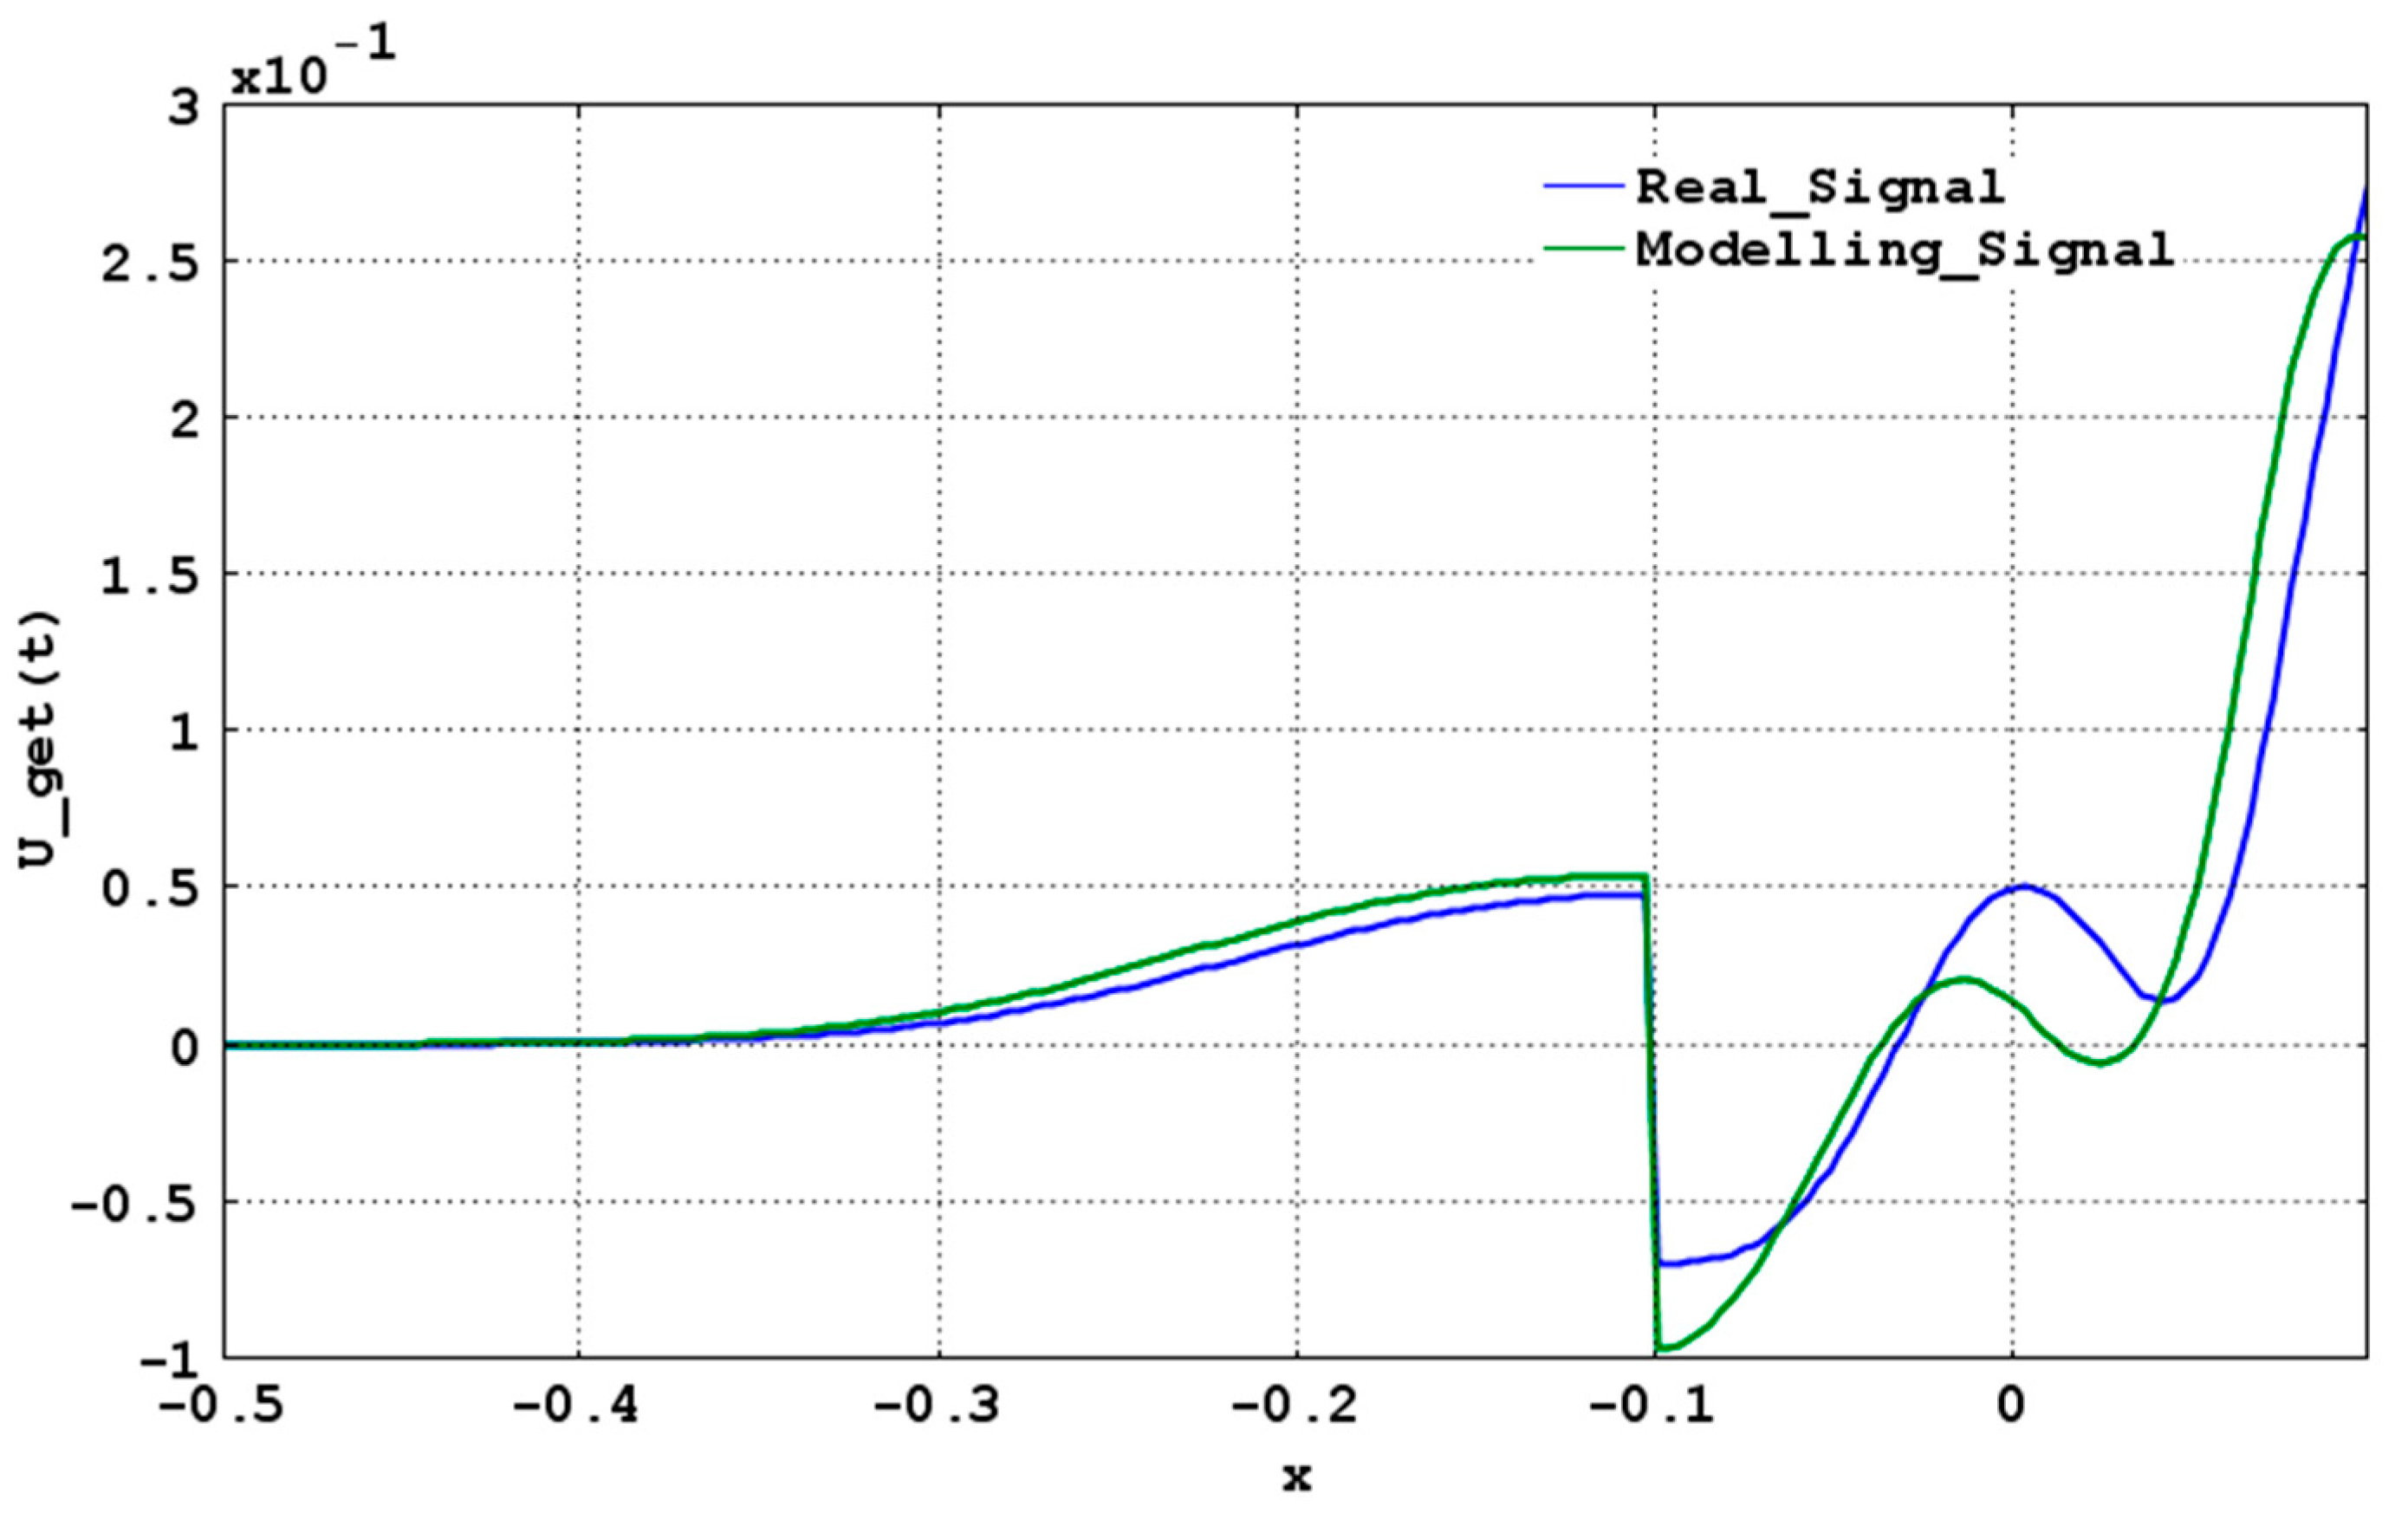
The developed mathematical models were verified. For this verification, we used the results of physical experiments. We compared signal responses obtained from experiments and calculated by the mathematical model (the specification of the generated signal is shown in Figure 16b). The comparison results are shown in Figure 18. The signal responses obtained in the experiments and modeling have small deviations. Therefore, the mathematical models are acceptable for practical application.

4. Conclusions

A method and mathematical models of direct and inverse problems of ultrasonic testing and diagnostics of complex metal structures for defects were developed and tested. A prototype of a system for magnetostrictive control of elements of the objects under study was manufactured and experimentally tested. Mathematical modeling of ultrasonic testing processes using MATLAB and the COMSOL Multiphysics software was carried out. The adequacy of the mathematical models was verified by the comparison of their results with physical experiments. Information support and a corresponding methodology were developed, which ensure the functioning of control facilities for these objects based on the small-aperture MSTs.
It was experimentally established that the amplitude of the signal passing through a crack size of 0.05–0.1 mm decreases by almost ten times, which makes it possible to use the MSTs to find such defects. The change in the delay time due to the change in the propagation velocity of the signal inside the crack (in the above experiment the delay was 0.8 μs) can be used to find the crack size.

Author Contributions

Conceptualization, V.B., I.B. and V.K.; methodology, I.B., A.Z., A.K. and V.K.; software, V.K.; validation, I.B. and V.K.; formal analysis, A.Z., V.K., A.K. and V.H.; investigation, V.B., I.B. and V.K.; resources, A.Z., V.K. and V.H.; data curation, I.B., A.K. and V.K.; writing—original draft preparation, I.B., A.Z., V.K., A.K. and V.H.; writing—review and editing, I.B., A.Z., V.K., A.K. and V.H.; visualization, A.Z. and V.K.; supervision, A.Z., V.K. and V.H. All authors have read and agreed to the published version of the manuscript.

Funding

This research received no external funding.

Data Availability Statement

The data presented in this study are available on request from the corresponding author.

Acknowledgments

The authors thank the reviewers and the editors for their valuable contributions that significantly improved this manuscript.

Conflicts of Interest

The authors declare no conflict of interest.

References

  1. Suchocki, C.; Błaszczak-Bąk, W. Down-Sampling of Point Clouds for the Technical Diagnostics of Buildings and Structures. Geosciences 2019, 9, 70. [Google Scholar] [CrossRef] [Green Version]
  2. Sogomonyan, V.K.; Chibukhchyan, G.S.; Chibukhchyan, O.S. Diagnostics of fatigue fractures of building structures elements. Mag. Civ. Eng. 2018, 82, 195–203. [Google Scholar]
  3. Bondarenko, Y.; Kovalchuk, O.; Loginova, Y.; Artiukh, K. Risk analysis on technical safety of production of welded structures using non-destructive test and technical diagnostics. Technol. Audit. Prod. Reserv. 2019, 6, 36–41. [Google Scholar] [CrossRef]
  4. Wu, S.; Clements-Croome, D.; Fairey, V.; Albany, B.; Sidhu, J.; Desmond, D.; Neale, K. Reliability in the whole life cycle of building systems. Eng. Constr. Arch. Manag. 2006, 13, 136–153. [Google Scholar] [CrossRef] [Green Version]
  5. Kuzina, E.; Rimshin, V.; Kurbatov, V. The Reliability of Building Structures Against Power and Environmental Degradation Effects. IOP Conf. Ser. Mater. Sci. Eng. 2018, 463, 042009. [Google Scholar] [CrossRef] [Green Version]
  6. Poduval’Tsev, V.V.; Khlystunov, M.S.; Mogilyuk, Z.G. Reliability of the Results of Dynamic Inspections of Buildings and Structures. Meas. Tech. 2013, 56, 846–849. [Google Scholar] [CrossRef]
  7. Steenbergen, R.D.J.M.; Sýkora, M.; Diamantidis, D.D.; Holický, M.; Vrouwenvelder, I.T. Economic and human safety reliability levels for existing structures. Struct. Concr. 2015, 16, 323–332. [Google Scholar] [CrossRef]
  8. Babak, V.P.; Babak, S.V.; Myslovych, M.V.; Zaporozhets, A.O.; Zvaritch, V.M. Principles of Construction of Systems for Diagnosing the Energy Equipment. In Diagnostic Systems For Energy Equipments; Springer: Cham, Switzerland, 2020; pp. 1–22. [Google Scholar] [CrossRef]
  9. Babak, V.P.; Dekusha, O.; Kovtun, S.; Ivanov, S. Information-Measuring System for Monitoring Thermal Resistance. CEUR Workshop Proc. 2019, 2387, 102–110. [Google Scholar]
  10. Kim, W.; Katipamula, S. A review of fault detection and diagnostics methods for building systems. Sci. Technol. Built Environ. 2017, 24, 3–21. [Google Scholar] [CrossRef]
  11. Kylili, A.; Fokaides, P.A.; Christou, P.; Kalogirou, S.A. Infrared thermography (IRT) applications for building diagnostics: A review. Appl. Energy 2014, 134, 531–549. [Google Scholar] [CrossRef]
  12. Hoła, J.; Schabowicz, K. State-of-the-art non-destructive methods for diagnostic testing of building structures – anticipated development trends. Arch. Civ. Mech. Eng. 2010, 10, 5–18. [Google Scholar] [CrossRef]
  13. Gao, Z.; Cecati, C.; Ding, S.X. A Survey of Fault Diagnosis and Fault-Tolerant Techniques—Part I: Fault Diagnosis With Model-Based and Signal-Based Approaches. IEEE Trans. Ind. Electron. 2015, 62, 3757–3767. [Google Scholar] [CrossRef] [Green Version]
  14. Fukumoto, A. The application of piezoelectric ceramics in diagnostic ultrasound transducers. Ferroelectrics 1982, 40, 217–230. [Google Scholar] [CrossRef]
  15. Martin, K.H.; Lindsey, B.D.; Ma, J.; Lee, M.; Li, S.; Foster, F.S.; Jiang, X.; Dayton, P.A. Dual-Frequency Piezoelectric Transducers for Contrast Enhanced Ultrasound Imaging. Sensors 2014, 14, 20825–20842. [Google Scholar] [CrossRef] [PubMed] [Green Version]
  16. Choi, H. Prelinearized Class-B Power Amplifier for Piezoelectric Transducers and Portable Ultrasound Systems. Sensors 2019, 19, 287. [Google Scholar] [CrossRef] [PubMed] [Green Version]
  17. Ryu, J.; Priya, S.; Uchino, K.; Kim, H.-E. Magnetoelectric Effect in Composites of Magnetostrictive and Piezoelectric Materials. J. Electroceramics 2002, 8, 107–119. [Google Scholar] [CrossRef]
  18. Dong, S.; Li, J.F.; Viehland, D.; Cheng, J.; Cross, L.E. A strong magnetoelectric voltage gain effect in magnetostrictive-piezoelectric composite. Appl. Phys. Lett. 2004, 85, 3534–3536. [Google Scholar] [CrossRef] [Green Version]
  19. Bogachev, I.V.; Meleshchenko, L.V. Improvement of Main Parameters of Magnetostrictive Transducers. Tech. Diagn. Non-Destr. Test. 2017, 4, 42–45. [Google Scholar] [CrossRef]
  20. Liu, Z.; Zhao, J.; Wu, B.; Zhang, Y.; He, C. Configuration optimization of magnetostrictive transducers for longitudinal guided wave inspection in seven-wire steel strands. NDT Int. 2010, 43, 484–492. [Google Scholar] [CrossRef]
  21. Kim, Y.Y.; Kwon, Y.E. Review of magnetostrictive patch transducers and applications in ultrasonic nondestructive testing of waveguides. Ultrasonics 2015, 62, 3–19. [Google Scholar] [CrossRef] [Green Version]
  22. Ashish, A.J.; Rajagopal, P.; Balasubramaniam, K.; Kumar, A.; Rao, B.P.; Jayakumar, T. Bulk ultrasonic NDE of metallic components at high temperature using magnetostrictive transducers. AIP Conf. Proc. 2017, 1806, 50010. [Google Scholar] [CrossRef]
  23. Golovnya, B.; Khaidurov, V. Some high-speed methods for solving nonlinear inverse heat conduction problems. Cherkasy Univ.Bull. Appl. Math. Inform. 2017, 1–2, 71–90. [Google Scholar]
  24. Golovnya, B.P.; Khaidurov, V.V. Effective method for solving nonlinear inverse heat conduction problem. Cherkasy Univ. Bull. Appl. Math. Inform. 2014, 18, 87–98. [Google Scholar]
  25. Khaidurov, V. Nonlinear mathematical model for determining the geometric position of point signals in homogeneous materials. In Proceedings of the X International Scientific and Practical Conference “Scientific Achievements of Modern Society”, Liverpool, UK, 27–29 May 2020; pp. 96–100. [Google Scholar]
  26. Kazakov, V.V.; Sutin, A.M. Pulsed Sounding of Cracks with the Use of the Modulation of Ultrasound by Vibrations. Acoust. Phys. 2001, 47, 308–312. [Google Scholar] [CrossRef]
  27. Zhang, J.; Drinkwater, B.W.; Wilcox, P.D. Longitudinal wave scattering from rough crack-like defects. IEEE Trans. Ultrason. Ferroelectr. Freq. Control. 2011, 58, 2171–2180. [Google Scholar] [CrossRef] [PubMed]
  28. Babak, V.; Eremenko, V.; Zaporozhets, A. Research of diagnostic parameters of composite materials using johnson distribution. Int. J. Comput. 2019, 483–494. [Google Scholar] [CrossRef]
  29. Eremenko, V.; Zaporozhets, A.; Babak, V.; Isaienko, V.; Babikova, K. Using Hilbert Transform in Diagnostic of Composite Materials by Impedance Method. Period. Polytech. Electr. Eng. Comput. Sci. 2020, 64, 334–342. [Google Scholar] [CrossRef]
  30. Uhlmann, G. Inverse problems: Seeing the unseen. Bull. Math. Sci. 2014, 4, 209–279. [Google Scholar] [CrossRef] [Green Version]
  31. Bazulin, E.G.; Goncharsky, A.V.; Romanov, S.Y.; Seryozhnikov, S.Y. Parallel CPU- and GPU-Algorithms for Inverse Problems in Nondestructive Testing. Lobachevskii J. Math. 2018, 39, 486–493. [Google Scholar] [CrossRef]
  32. Zaporozhets, A.O.; Khaidurov, V.V. Mathematical Models of Inverse Problems for Finding the Main Characteristics of Air Pollution Sources. Water, Air Soil Pollut. 2020, 231, 563. [Google Scholar] [CrossRef]
  33. Bilicz, S. Sensitivity analysis of inverse problems in EM non-destructive testing. IET Sci. Meas. Technol. 2020, 14, 543–551. [Google Scholar] [CrossRef]
  34. Li, Z.; Haigh, A.; Soutis, C.; Gibson, A.; Sloan, R. A Simulation-Assisted Non-destructive Approach for Permittivity Measurement Using an Open-Ended Microwave Waveguide. J. Nondestruct. Eval. 2018, 37, 39. [Google Scholar] [CrossRef] [Green Version]
  35. Yacef, N.; Bouden, T.; Grimes, M. Accurate ultrasonic measurement technique for crack sizing using envelope detection and differential evolution. NDT Int. 2019, 102, 161–168. [Google Scholar] [CrossRef]
  36. Babak, V.P.; Babak, S.V.; Myslovych, M.V.; Zaporozhets, A.O.; Zvaritch, V.M. Simulation and Software for Diagnostic Systems. In Diagnostic Systems For Energy Equipments; Springer: Cham, Switzerland, 2020; pp. 71–90. [Google Scholar] [CrossRef]
  37. Babak, V.P.; Babak, S.V.; Myslovych, M.V.; Zaporozhets, A.O.; Zvaritch, V.M. Technical Provision of Diagnostic Systems. In Diagnostic Systems For Energy Equipments; Springer: Cham, Switzerland, 2020; pp. 91–133. [Google Scholar] [CrossRef]
  38. Larsson, S.; Thomee, V. Partial Differential Equations with Numerical Methods; Springer: Berlin/Heidelberg, Germany; New York, NY, USA, 2003. [Google Scholar]
  39. Marquardt, W. Model-Based Experimental Analysis of Kinetic Phenomena in Multi-Phase Reactive Systems. Chem. Eng. Res. Des. 2005, 83, 561–573. [Google Scholar] [CrossRef] [Green Version]
  40. Carita Montero, R.; Roberty, N.; Silva Neto, A. Absorption coefficient estimation in heterogeneous media using a domain partition consistent with divergent beams. Inverse Probl. Eng. 2001, 9, 587–617. [Google Scholar] [CrossRef]
  41. Engel, M. A Multigrid Method for the Effcient Numerical Solution of Optimization Problems Constrained by Partial Differential Equations. Doctoral Dissertation, University of Bonn, Bonn, Germany, 2009. [Google Scholar]
  42. Engel, M. A Newton-Multigrid Method for PDE Constrained Optimization. In Proceedings of the Workshop on PDE Constrained Optimization, Hamburg, Germany, 27–29 March 2008. [Google Scholar]
  43. Hackbusch, W. Iterative Solution of Large Sparse Systems of Equations. In Applied Mathematical Sciences; Springer: New York, NY, USA, 1994. [Google Scholar]
  44. Keskin, Y.; Oturanc, G. Reduced differential transform method for partial differential equations. Int. J. Nonlinear Sci. Numer. Simul. 2009, 10, 741–749. [Google Scholar] [CrossRef]
  45. Alvarez Acevedo, N.; Roberty, N.; Silva Neto, A. An explicit formulation for the inverse transport problem using only external detectors. Computational modelling. Part I Comput. Appl. Math. 2010, 29, 343–358. [Google Scholar] [CrossRef]
  46. Baranov, V.; Zasyad’ko, A.; Frolov, G. Integrodifferential method of solving the inverse coefficient heat conduction problem. J. Eng. Phys. 2010, 83, 60–71. [Google Scholar]
  47. Barbone, P.; Oberai, A.; Harari, I.; Albocher, P. Adjoint-weighted variational formulation for a direct computational solution of an inverse heat conduction problem. USA J. Inverse Probl. 2007, 6, 2325–2342. [Google Scholar] [CrossRef]
  48. Qian, A.-L. Identifying an unknown source in the Poisson equation by a wavelet dual least square method. Bound. Value Probl. 2013, 2013, 267. [Google Scholar] [CrossRef] [Green Version]
  49. Saad, Y. Iterative Methods for Sparse Linear Systems, 2nd ed.; SIAM: Philadelphia, PA, USA, 2003. [Google Scholar]
  50. Nguyen, P.; Nguyen, L. A numerical method for an inverse source problem for parabolic equations and its application to a coefficient inverse problem. J. Inverse Ill-Posed Probl. 2020, 28, 323–339. [Google Scholar] [CrossRef] [Green Version]
  51. Bohachev, I.; Babak, V.; Zaporozhets, A. Novel small-aperture transducers based on magnetostrictive effect for diagnostic systems. Tekhnichna Elektrodynamika 2022, 2022, 69–78. [Google Scholar] [CrossRef]
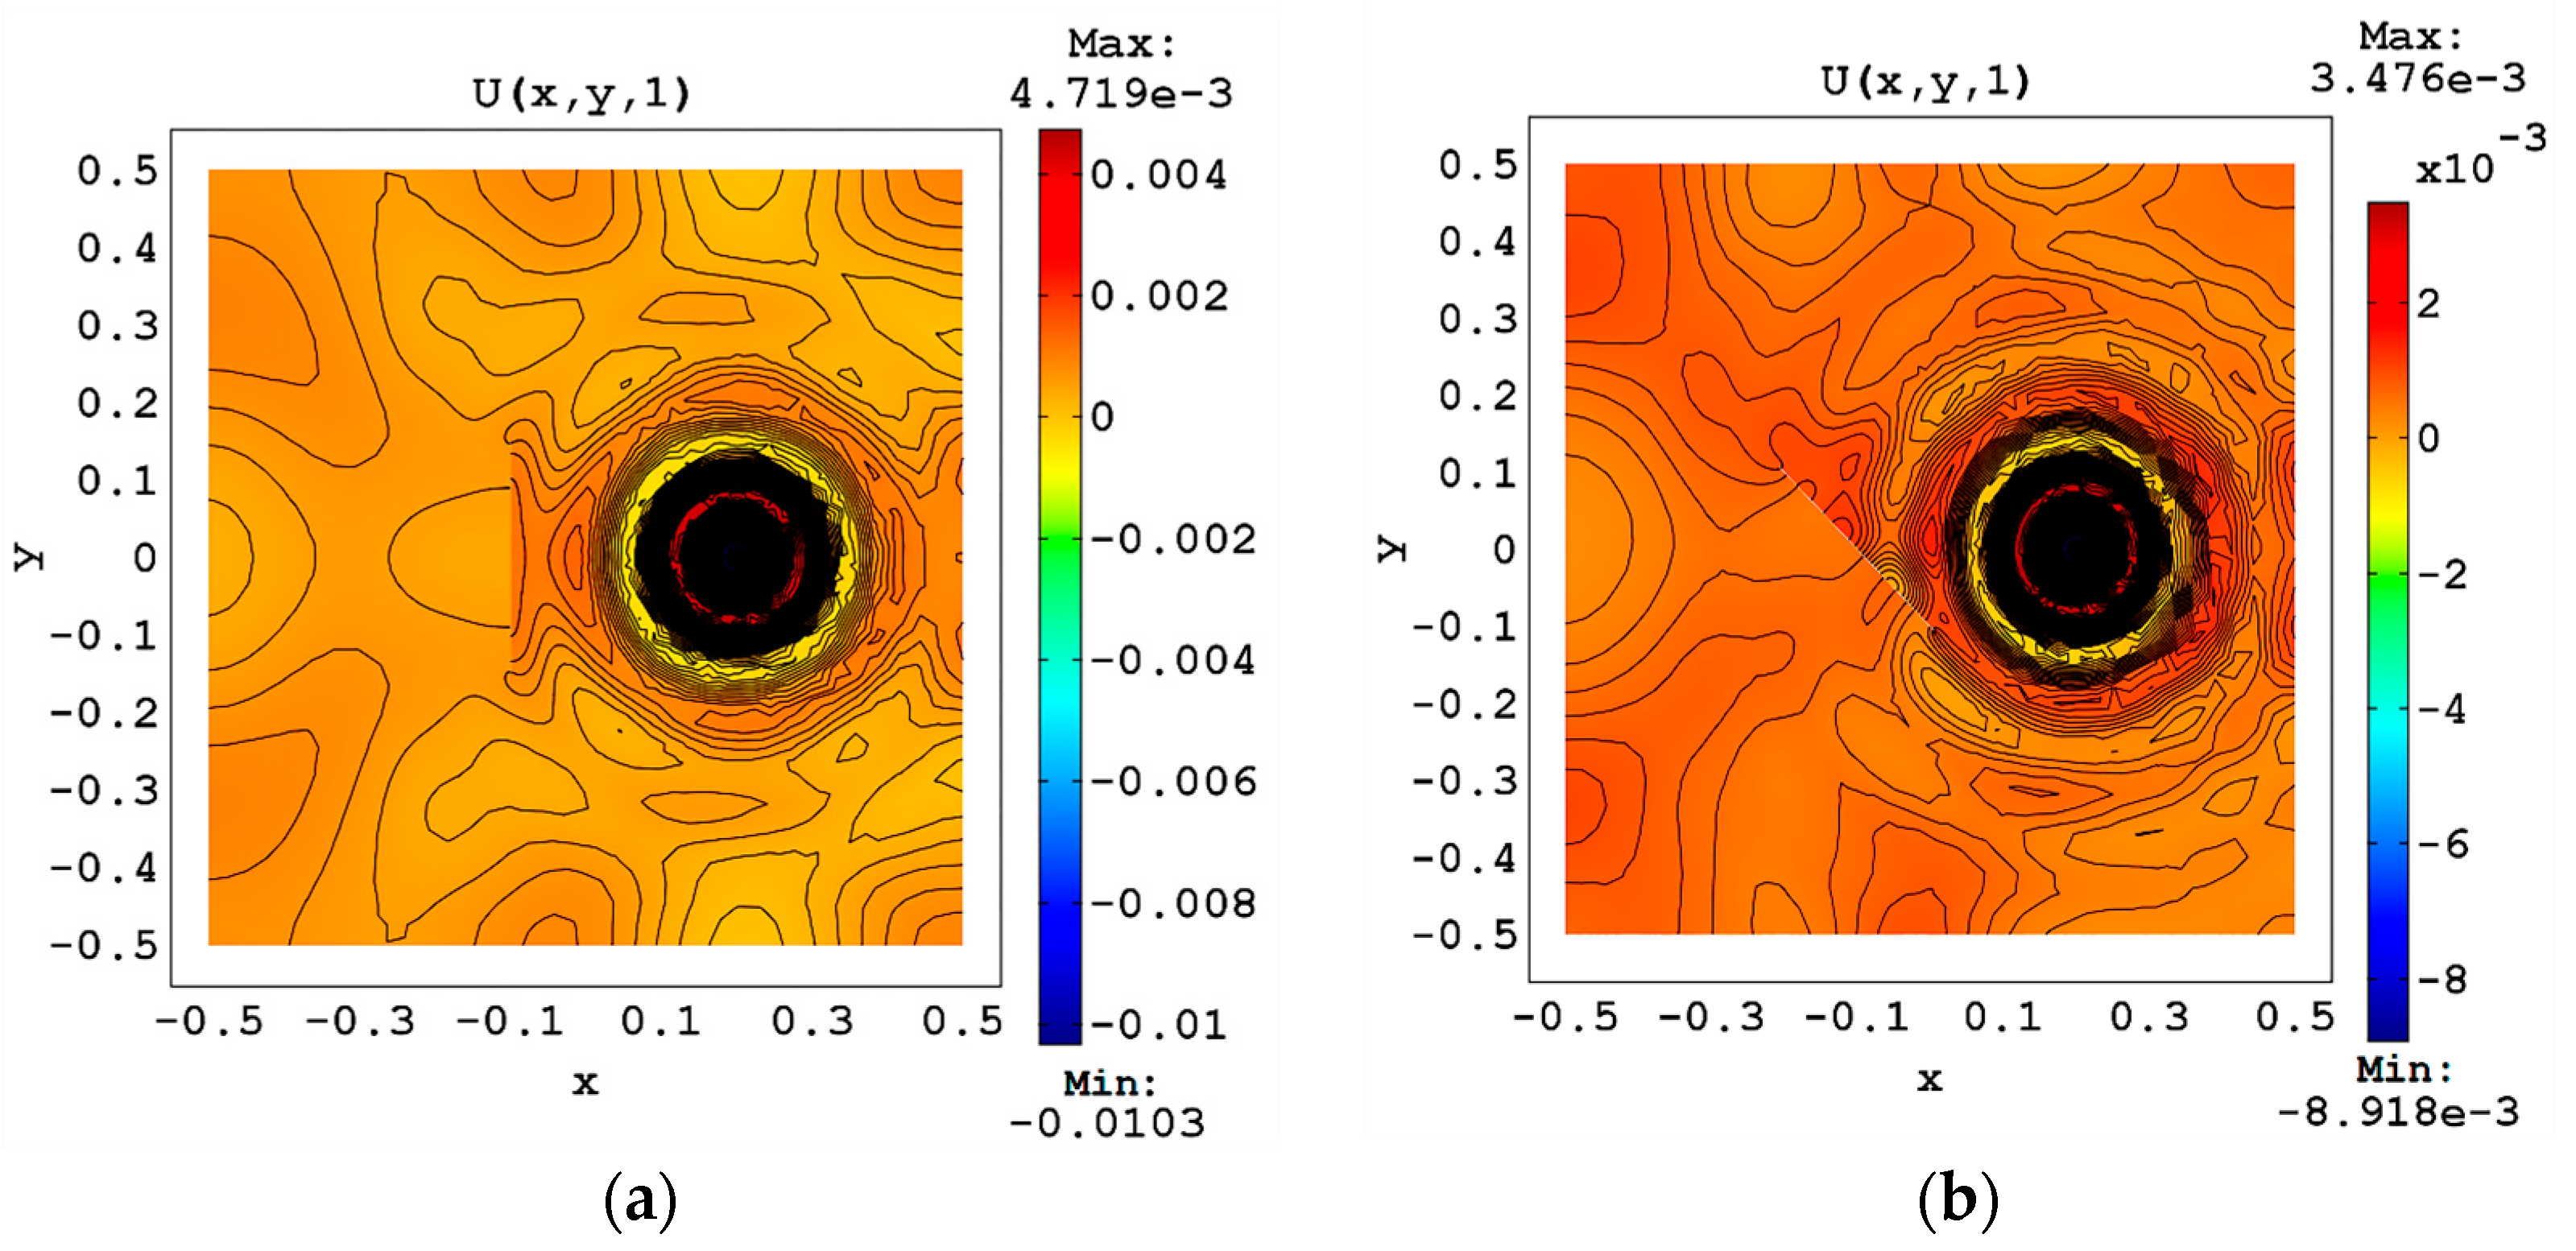
Figure 1. The wave field on the surface of bodies with defects in the form of cracks: (a) a vertical position of defects (5); (b) an angular (45°) position of defects (8).
Electronics 12 00477 g001
Figure 2. Comparison of the signal that passes through the crack: (a) a vertical position of cracks (5); (b) an angular (45°) position of cracks (8) (time in milliseconds, x in micrometers, U in micrometers).
Electronics 12 00477 g002
Figure 3. Graphic representation of the signal at the point (−0.3; 0) during the time interval [0; 1] of passing through defects such as cracks, which are specified in the form of (5) and (8), and through the defect-free area (time in milliseconds, U in micrometers).
Electronics 12 00477 g003
Figure 4. Influence of the size of a crack-type defect on the signal passed through it (time in milliseconds, U in micrometers).
Electronics 12 00477 g004
Figure 5. Schematic arrangement of sensors and a source in the computing area for a certain period of time (time in milliseconds, U in micrometers).
Electronics 12 00477 g005
Figure 6. Data obtained from 8 sensors during the same period of time (time in milliseconds, U in micrometers).
Electronics 12 00477 g006
Figure 7. Convergence (11) of the optimization mathematical model (12) and (13) by the classical genetic algorithm (left—first 20 iterations; right—last 20 iterations).
Electronics 12 00477 g007
Figure 8. Convergence (13) of the classical genetic algorithm: (a) first 20 iterations; (b) last 20 iterations).
Electronics 12 00477 g008aElectronics 12 00477 g008b
Figure 9. Numerical solution of the mathematical model (17)–(20) at different times.
Electronics 12 00477 g009
Figure 10. Photo of the developed main unit of the ultrasonic control system.
Electronics 12 00477 g010
Figure 11. Photo of the test sample: (a) top; (b) from below; (c) from the side (the frame marks the area where the crack is).
Electronics 12 00477 g011
Figure 12. Oscillograms of signals: (a) during the study of the wave velocity; (b) with connected converters.
Electronics 12 00477 g012
Figure 13. Photo of interconnected transducers.
Electronics 12 00477 g013
Figure 14. Oscillograms of signals when passing through: (a) defect-free area; (b) sample area with a crack.
Electronics 12 00477 g014
Figure 15. General strategy of data generation and processing on a PC in order to verify the mathematical model for determining the signal response.
Electronics 12 00477 g015
Figure 16. Graphical presentation of generated signals (first 700 points): (a) each test case separately; (b) average result.
Electronics 12 00477 g016
Figure 17. Graphical representation of smoothed response signals in the vicinity of defects (cracks) for experimental tests with generated signals, which are shown in Figure 16: (a) each test case separately; (b) average result.
Electronics 12 00477 g017aElectronics 12 00477 g017b
Figure 18. Graphic representation of the response signal obtained as a result of passing the generated averaged signal (Figure 16b) through the model of ultrasonic testing.
Electronics 12 00477 g018
Table 1. Geometric arrangement of sensors in dimensionless coordinates.
CoordinatePoint 1Point 2Point 3Point 4Point 5Point 6Point 6Point 8
xi0.53330.71670.45000.15000.31670.10000.86670.4167
yi0.06670.91670.11670.35000.85000.28330.51670.9000
Table 2. Convergence (21) in model (21)–(25) using the classical genetic algorithm.
IterationValue (21)IterationValue (21)
14.05116296 × 10−5701.78558303 × 10−13
52.43795886 × 10−5751.04036629 × 10−13
101.39653308 × 10−5806.67451567 × 10−14
157.86654197 × 10−6853.71148666 × 10−14
204.37072926 × 10−6902.18322134 × 10−14
252.78290865 × 10−61001.21550930 × 10−14
Table 3. Main technical characteristics of the ultrasonic control system.
Radio Pulse Filling Frequency, MHz0.1…10.0
Pulse duration1…16 periods of filling oscillation
Amplitude value of voltage on emitters, V0…10 at load 0.5 OM
Input impedance, kOhm>3.0
Maximum output voltage, V10
Amplification coefficient4000
Table 4. Received signal parameters.
ParameterDefect-Free AreaArea with Crack
t, s13.6·10−614.4·10−6
2Um, V50.5
Table 5. Generated experiment data.
Point1239989991000
Experiment 10.04750.04750.0475−0.01700.04750.0152
Experiment 2−0.2106−0.2428−0.2428−0.2751−0.3074−0.2751
Experiment 3−0.2106−0.2428−0.2106−0.2428−0.2428−0.2428
Experiment 40.01520.04750.04750.04750.01520.0152
Experiment 50.07980.04750.07980.04750.07980.0475
Experiment 6−0.0493−0.0170−0.0170−0.0493−0.0815−0.0493
Experiment 70.01520.01520.01520.0152−0.01700.0152
Experiment 8−0.0493−0.0815−0.1138−0.0815−0.0815−0.0815
Disclaimer/Publisher’s Note: The statements, opinions and data contained in all publications are solely those of the individual author(s) and contributor(s) and not of MDPI and/or the editor(s). MDPI and/or the editor(s) disclaim responsibility for any injury to people or property resulting from any ideas, methods, instructions or products referred to in the content.