Article

System Architecture for Diagnostics and Supervision of Industrial Equipment and Processes in an IoE Device Environment

1
Department of Complex Systems, The Faculty of Electrical and Computer Engineering, Rzeszow University of Technology, al. Powstańców Warszawy 12, 35-959 Rzeszow, Poland
2
Department of Control and Computer Engineering, The Faculty of Electrical and Computer Engineering, Rzeszow University of Technology, al. Powstańców Warszawy 12, 35-959 Rzeszow, Poland
3
Independent Researcher, 35-959 Rzeszow, Poland
*
Author to whom correspondence should be addressed.
Electronics 2023, 12(24), 4935; https://doi.org/10.3390/electronics12244935
Submission received: 10 November 2023 / Revised: 4 December 2023 / Accepted: 6 December 2023 / Published: 8 December 2023
(This article belongs to the Special Issue Fog/Edge/Cloud Computing in the Internet of Things)

Abstract

:
IoE components are becoming an integral part of our lives and support the operation of systems such as smart homes, smart cities, or Industry 4.0. The large number and variety of IoE components force the creation of flexible systems for data acquisition, processing, and analysis. The work presents a proposal for a new flexible architecture model and technology stack designed for the diagnostics and monitoring of industrial components and processes in an IoE device environment. The proposed solutions allow creating custom flexible systems for managing a distributed IoT environment, including the implementation of innovative mechanisms like, for example: predictive maintenance, anomaly detection, business intelligence, optimization of energy consumption, or supervision of the manufacturing process. In the present study, two detailed system architectures are proposed, and one of them was implemented. The developed system was tested in near-production conditions using a real IoT device infrastructure including industrial systems, drones, and sensor networks. The results showed that the proposed model of a central data-acquisition and -processing system allows the flexible integration of various IoE solutions and has a very high implementation potential wherever there is a need to integrate data from different sources and systems.

1. Introduction

The concept of the Internet of Everything (IoE) is an extension of the idea of the Internet of Things (IoT) by connecting devices and processes, as well as people into a single network. By definition, such a network is heterogeneous in nature from the perspective of technology, hardware, protocols, and also, applications. It can be assumed that the IoE is the result of multidimensional convergence. Thus, it is a kind of complex system, the description of which is possible in terms of complex systems taking into account their characteristics, properties, and nature of functioning. Such systems make it possible to achieve greater efficiency and better use of resources due to, i.e., non-additivity and synergy. The IoE concept assumes that all devices and systems can and will eventually be connected to a network, in particular the Internet. The IoE infrastructure is to provide a communication environment ranging from the simplest sensors to advanced robots, entire systems, and humans. By making the IoE concept a reality, it will be possible to create fully intelligent environments to automate processes and improve efficiency in many fields including industrial production, logistics and transportation, energy, medical care, and many others. The great potential of the IoE can only be realized if appropriate technological solutions are developed, as well as architectures to ensure their implementation. Such an approach requires the development of, i.e., new data processing models. It is necessary to provide mechanisms that will enable data processing at different levels of the network, starting with local devices, then devices located at the Edge of the network (Edge), then located in local data centers (Edge–Cloud), and finally, the main data centers (Cloud). This approach is called the Edge Cloud Continuum (ECC), and is a kind of ecosystem focused on increasing performance by optimizing processing through its intelligent allocation. Supplementing the IoE concept with elements of the ECC approach creates a coherent ecosystem with enormous potential in the areas of smart cities, industry (including aerospace and automotive), smart societies, etc. The IoE is of particular importance for the implementation and development of Industry 4.0. This is due to the fact that, currently, systems enabling the collection and processing of large amounts of data are crucial in industry. Such solutions allow, i.e., optimizing production, increasing productivity, and reducing costs. Achieving such results is impossible without developing new, adequate architectures characterized by scalability, versatility, openness, as well as the consideration of the security aspects. Therefore, this article presents the results of a research work that focused on the development of an architecture that allows receiving, processing, and visualizing large amounts of temporal data from various sources. The proposed architecture solves the problems of data processing and storage, and its main function is to enable the advanced processing and easy visualization of information for users. Within the framework of the proposed architecture, various aspects of this complex system were considered, such as the system architecture, communication options and data-encoding formats, the basic functional modules, the databases, and the presentation layer (frontend). The work carried out required the development of a reference model for data collection, processing, and visualization (see Figure 1), which will serve as a reference for the development of the architecture of an innovative computer system functioning in accordance with the idea of the IIoE, enabling the implementation of a learning (evolving) intelligent system for the diagnosis and supervision of industrial equipment and processes.
During the research work, four basic layers characteristic of such a system were identified: the physical layer, the communication layer, the data storage layer, and the processing, management, and analysis layer. All four layers form a coherent model for data acquisition and subsequent processing. The physical layer defines the primary sources of the data. Based on research to date, the following key elements of the IoE infrastructure were identified: manufacturing equipment constituting machinery, production lines, as well as smart city infrastructure elements, the IoT, the Industrial Internet of Things (IIoT) and Edge-processing (Edge) components, sensors for measuring human fitness and health, embedded vehicle systems including drones and autonomous vehicles, and industrial and utility robots. The next layer of the model is the communication layer. It is responsible for retrieving and transmitting the data from the physical layer. The entire telecommunications infrastructure of the IoE system operates within this layer, which includes network devices, transmission media, open and closed network protocols, communication standards, isolated process flows, defined thresholds for alarm triggers and system events, signal-transmitted measurement data series, as well as access methods, including the Application Programming Interface (API), RESTful APIs, terminal sessions, etc. The third layer includes the data storage and preprocessing environment. Within this layer, data are physically collected in source-identifiable form, containing a specific value for events, measurement series, and alerts, along with a timestamp in the case that it can be extracted. The stored data can be in the form of current reports, single measurement values, or short series, but it was also assumed that historical data can be collected as the input for a broader analysis. An important aspect of this layer is the data cleaning and standardization mechanisms, resulting in normalized data. Layer 4 is the in-depth analysis and data management. The result of the processes in this layer is information and knowledge that enable the monitoring, control, optimization, and steering of processes in manufacturing, urban environments, etc. This is possible thanks to extensive statistical analysis and the implemented artificial intelligence mechanisms, including, in particular, machine learning algorithms aimed at detecting anomalies. By using this approach, the IoE system will make it possible to fully realize concepts such as Industry 4.0 or Society 5.0. In this layer, information and new knowledge are created as a result of data mining and analysis. There is an opportunity to further extend this model in the context of Cyber–Physical Systems (CPSs). These systems use advanced technologies such as artificial intelligence, neural networks, the IoT, embedded systems, and Cloud computing to provide the automation and optimization of industrial processes and other fields. The article is organized as follows: Section 1 presents the idea of the proposed solution and the rationale for the relevance of the research work carried out; Section 2 reviews the literature to identify the current state of knowledge in the subject area addressed in the article, along with an indication of the authors’ own contributions; Section 3 presents the results of the preliminary research work, along with a description of the elements of the distributed testbed that was built for the implementation of the research; Section 4 presents the developed architecture for data acquisition, collection, and processing in the IoE system, as well as a model of the technology stack; Section 5 contains presentations of the results in the form of the software built on the basis of the proposed model and a discussion of the results obtained; Section 6 summarizes the completed research work and indicates the directions for further research.

2. Systematic Review

Modern diagnostic and supervisory systems for distributed IoE systems are an area in which a number of research works are being carried out. Intensive research in this area mainly concentrates on the area of the analysis of the acquired data, inference, and the indication of the key parameters from the point of view of the control process or supervision of the system’s operation. A crucial aspect in the area of building IoT systems is frequently overlooked: data acquisition. This is a key element of the model proposed in the previous Section 1. Therefore, during the analysis of the state-of-the-art, special attention was paid precisely to the aspect of the models proposed in the literature. In the area of data-acquisition and -processing systems from industrial and IoE systems, a number of research works have been carried out, which can find applications in research work and transmission solutions. In the study [1], the authors indicated the main application areas of IoE systems, pointing out that the architectures of the IoE systems analyzed are rather dedicated in nature, and it is difficult to find a universal approach to their design. The paper presented a very general architecture reference diagram for IoE systems, but it did not indicate the technology stack and did not describe its applicability to the construction of real data acquisition systems. In addition, the authors of the paper identified three main technological challenges for systems in this class: intelligent analysis and action, the need to develop interoperable standards, and the mutual compatibility of the solutions. The study [2] presented an IoT system architecture for aggregating data from Indoor Environmental Quality (IEQ) systems. The paper mainly used open-source solutions to build the data-acquisition system and the MQTT protocol. The communication architecture used has a closed structure and fits into the paradigm of Edge computing systems. A closed catalog of system functionality was defined in advance, i.e., centralized configuration, variable sampling times, local collection of data, Cloud services, and the MQTT communication protocol. Similarly, the work [3] presented a solution for real-time data aggregation based on the MQTT protocol. It should be noted that the MQTT protocol is currently one of the leading solutions in the area of machine-to-machine communication (e.g., sensor to Cloud), but pointing to it as the only protocol that meets all the requirements for data acquisition from OT and IoE devices is not the right approach. The paper [4] presented a general-purpose architecture for IoT data acquisition, narrowing its use, however, to devices only in this class. In addition, the authors in the paper presented an illustrative implementation of the proposed architecture to verify its operation. However, the presented case of Proof of Concept (PoC) was limited to a very narrow group of devices (two types: Global Navigation Satellite System and National Marine Electronics Association standards), completely ignoring the possibility of integrating the architecture with complex industrial and OT systems. The study [5] included a general description of the architecture model for collecting and processing measurement data that came from a set of distributed IoT systems. The authors identified in the paper a large variety of this class of solutions and pointed out in the paper two main methods of communication based on the use of the MQTT and HTTP REST API protocols. The entire system was based on the use of the open standard solution Machinery Information Management Open System Alliance (MIMOSA) and the MariaDB database. However, the paper did not include, apart from general assumptions, a description of the practical implementation of the system built on the basis of the proposed processing model. Another paper [6] was concerned with the possibility of using the Supervisory Control And Data Acquisition system (SCADA) for data aggregation with regard to the scalability of such a system. In addition, the authors stressed the need to modify web-based IoT class systems in such a way that they meet the requirements of real-time reaction in an emergency. However, the presented research did not include the implementation of a test system built on the basis of the proposed model. An important group of systems comprises also solutions dedicated to monitoring vehicles both in the area of the localization of their position and the acquisition of the data from on-board cameras. The approach proposed in this area uses a closed catalog of solutions and does not allow them to be used to support a wider spectrum of industrial solutions and the IoT [7]. Another of the solutions analyzed is based on acquiring metering data from systems from solar Photovoltaic (PV) systems [8]. However, the proposed solution focuses exclusively on the architecture of a remote measurement node located at a given PV installation. The authors indicated that measurement data from local nodes will be transmitted using Thing Speak APIs, and the analysis will be implemented using the Matlab R2016a software. Of course, from the point of view of the research work, such an approach is appropriate, but applying it in production conditions is not possible. In the paper [9], the need to integrate sensor systems with inference systems based, e.g., on Artificial Intelligence (AI) algorithms, which can find their application in fault diagnosis, was identified. However, the proposed approach deals with local data-acquisition techniques, and its scalability is limited. Note that this class of systems can, however, be a source of data sent to a larger-scale system. Microservices-based architectures are also used in the design process of distributed information systems [10]. This is an interesting approach, which especially works well in the process of building highly scalable systems and is dedicated to IoT devices. However, at the stage of their implementation, it is necessary to precisely define the all the communication mechanisms used between individual microservices because their improper selection can affect the performance of the entire system [11]. Contemporary architectures developed for data acquisition often require the adaptation of information transfer modes to a particular solution. This limits their application and indirectly forces the creation of new (designed from the beginning) high-level models of data-acquisition architectures, even in such popular applications as smart cities [12]. The data acquisition system is frequently extracted as a separate module from the overall architecture [13]. In this classical approach, the system first collects data and, only in subsequent stages, processes them. A more-appropriate approach is to use a cross-layer model [14], where each logical layer of the system can cooperate with any other layer. Thus, preprocessed data (e.g., through the use of sampling or processing at remote nodes) can be sent to the central processing system. In such a model, it is also possible to use frugal class solutions (e.g., frugal AI [15]) at the end nodes and send the finished requests or instructions to a central acquisition system. A comprehensive approach to building a data acquisition system was indicated in the paper [16]. The work centered on the development of a flexible data-acquisition model that could eventually replace SCADA-class systems. However, the proposed approach does not take into account the possibility of integrating the acquisition system with data-processing systems related to processing, correlation, and inference.
An additional group of solutions that center on the aggregation of data from multiple IoT devices are works related to the Cloud manufacturing paradigm. The paper [17] pointed out that data acquisition and, thus, knowledge of the behavior of the entire manufacturing system are key factors in the process of managing manufacturing systems. The authors of the paper proved that there is no clear definition of Cloud manufacturing, while pointing out that, in addition to pure manufacturing resources, IoT elements should also be taken into account in the management process. Such an approach can create a holistic view of the system, and the aggregation of data from multiple types and categories of devices makes it possible to correlate processes and events not only at the level of manufacturing operations, but also business and social processes. The paper did not explicitly indicate a complete implementation model for an architecture that would integrate devices into a coherent system. However, the problems that are associated with the production implementation of this class of systems were indicated, pointing out the need to develop accurate implementation models that allow the implementation of “step-by-step” production solutions. Another work [18] presented the possibility of developing software that integrates manufacturing resources into a hybrid Cloud environment. This paper proposed a new architecture that can be used to integrate IoT systems, but the authors did not present the details of the solution, providing a discussion of the model for adapting manufacturing processes to a hybrid Cloud architecture. In the article [19], the authors emphasized the role of collecting knowledge from distributed manufacturing resources, which can be used for resource management. The paper included a very comprehensive discussion of the current state of knowledge in the area of scheduling in Cloud manufacturing. However, the paper did not discuss the practical implementation of a knowledge-gathering system in a heterogeneous industrial environment including IoT systems. The results of the research team’s work presented in [20] clearly indicated the necessity of securing communication in the area of the integration of Cloud, fog, and IoT nodes, e.g., in machine-to-Cloud communication. The architecture of the system presented by the authors provides privacy, integrity, and authentication with anonymity in the area of the execution of transactions carried out in Cloud manufacturing. In the test implementation of the system, the authors used the MQTT protocol and the Raspberry Pi 4 Model A. The results obtained by the authors were encouraging, but require the adoption of a certain fixed structure of information exchange and will work well for dedicated solutions. However, the universality of the use of the proposed architecture is very limited.
We can find a flexible approach to building resource-acquisition and -management systems in a group of solutions related to Cloud IoT systems. As a rule, however, these works are devoted to the aggregation of resources performing some specific functions and activities. The work [21] presented a new low-cost system for real-time monitoring of water quality using the Internet of Things (IoT). The authors proposed using NodeMCU modules with in-built WiFi. The authors of the paper also emphasized the essential role of real-time data acquisition, but focused on the implementation of limited functionality related to the analysis of data from distributed sensors using machine learning algorithms. The presented architecture has very limited possibilities of integration with other applications or other models of pollution detection. In a paper [22] discussing 13 challenges and future directions for IoT Big Data systems, among other things, the need to take into account heterogeneous formats of data including structured, semistructured, and unstructured data that come from different devices was pointed out. In addition, the paper identified a number of current platforms performing tasks in the area of analysis and inference, such as the Azure IoT [23], the IBM IoT Platform [24], and Edge TPU [25]. This heterogeneity of data and systems available on the market in particular highlights the need for a flexible model that integrates these resources without having to choose exclusive solutions from a single vendor. This approach is particularly important because it allows the use of off-the-shelf solutions for data acquisition for future analysis. As a result, each time there will be no need to build an entire technology stack from scratch to solve a specific problem (for instance, as in the work [26]).
The development of a model integrating data-acquisition and -analysis algorithms will also allow the relatively easy implementation of solutions, e.g., in the area of Industry 4.0 [27] and healthcare [28], which are currently often tested on ready-made, previously acquired off-line data sets. This is especially important in the case of solutions integrating highly heterogeneous IoT environments, which we can encounter in smart city solutions [29]. The ability to acquire and freely correlate data from different sources (smart markets, transportation, smart grid, smart schools, smart hospitals, smart factories, etc.) allows treating such systems in terms of complex systems and using algorithms for the prediction or planning of resource consumption, e.g., energy. Structured access to the system for the acquisition and processing of data prepared using a universal model will allow the relatively easy implementation of new mechanisms for the orchestration of IoT elements [30,31,32] and an adaptation to new methods of connecting resources in distributed IoT systems [33].
In conclusion, a great number of models for the acquisition and processing of data from various devices have been proposed in the scientific space, which can find application in the process of diagnosing and managing industrial processes and IoE elements. The need to develop a reference architecture for this class of systems is also being signaled by industry partners [34]. However, analyzing the above works, we can see that the proposed approaches focus only on selected elements of the data-acquisition and -processing system. Each time, the highly heterogeneous technological ecosystem of IoE devices must be adapted to the generally homogeneous communication requirements of a given model. In addition, often, research work related to inference or, e.g., anomaly detection is conducted using previously acquired and prepared data sets. We suggest a different approach in this article, i.e., the proposed architecture was designed to allow its structure to flexibly adapt to subsequently connected IoE elements and is expected to enable work with real data acquired in real- or quasi-real-time. At the stage of preliminary research work related to the development of an architecture for the diagnostics and supervision of industrial equipment and processes in an IoE device environment, the current research papers were taken into account [35,36], which define the scope of requirements to be met by this class of systems both in the functional area and in terms of cyber security. It should be noted that the proposed solution was implemented in a PoC environment and integrated with a wide range of real industrial devices and IoT elements to determine its suitability in production conditions.
Our contributions presented in the paper are as follows:
  • Proposing a new architecture model for collecting and processing data for the architecture of the IoE device environment.
  • Proposing a new technology stack model for the proposed architecture model.
  • The development of two architectures for the diagnostics and supervision of industrial equipment and processes in an IoE device environment that meet the assumptions of the proposed architecture model and the technology stack model.
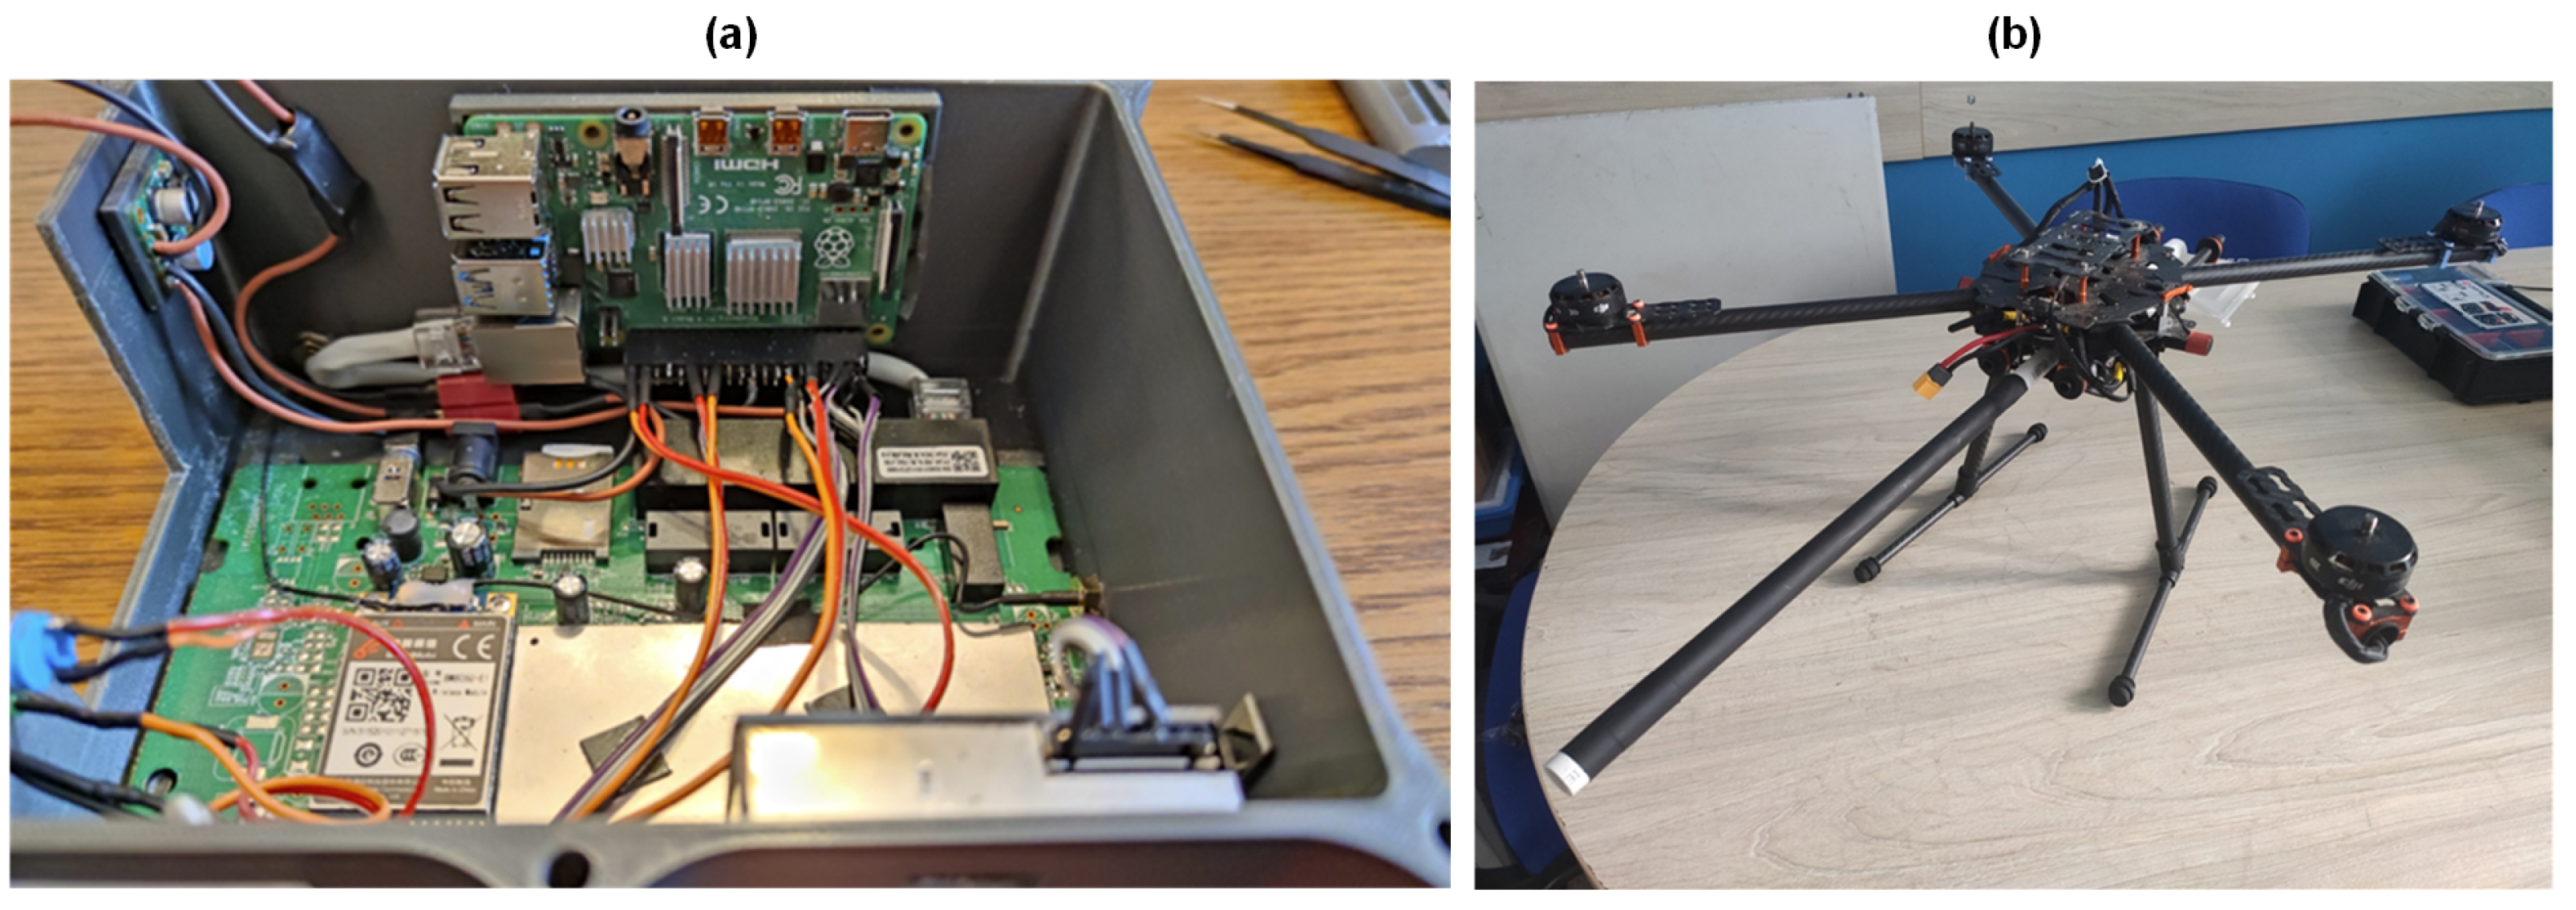
  • The implementation of the architecture in the form of a prototype (technology readiness level: TRL7) in order to confirm its correct functioning in an environment containing real elements of IoT systems and, thus, verify the assumptions of the developed models.

3. Initial Research Works

In order to test the proposed reference model (see Section 1), a number of laboratory workstations were used, the functionality of which was integrated within the proposed data-collection and -processing architecture. In the course of the research work, attention was paid to preserving the very high implementation potential of the proposed solution. Therefore, it was implemented and tested in laboratory conditions close to real life and the elements functioning in a controlled production environment. The selection of the IoE elements to be integrated using the proposed architecture was guided by the use of the broadest possible spectrum of solutions representative of those used in Industry 4.0, the IoE, and the IIoE.

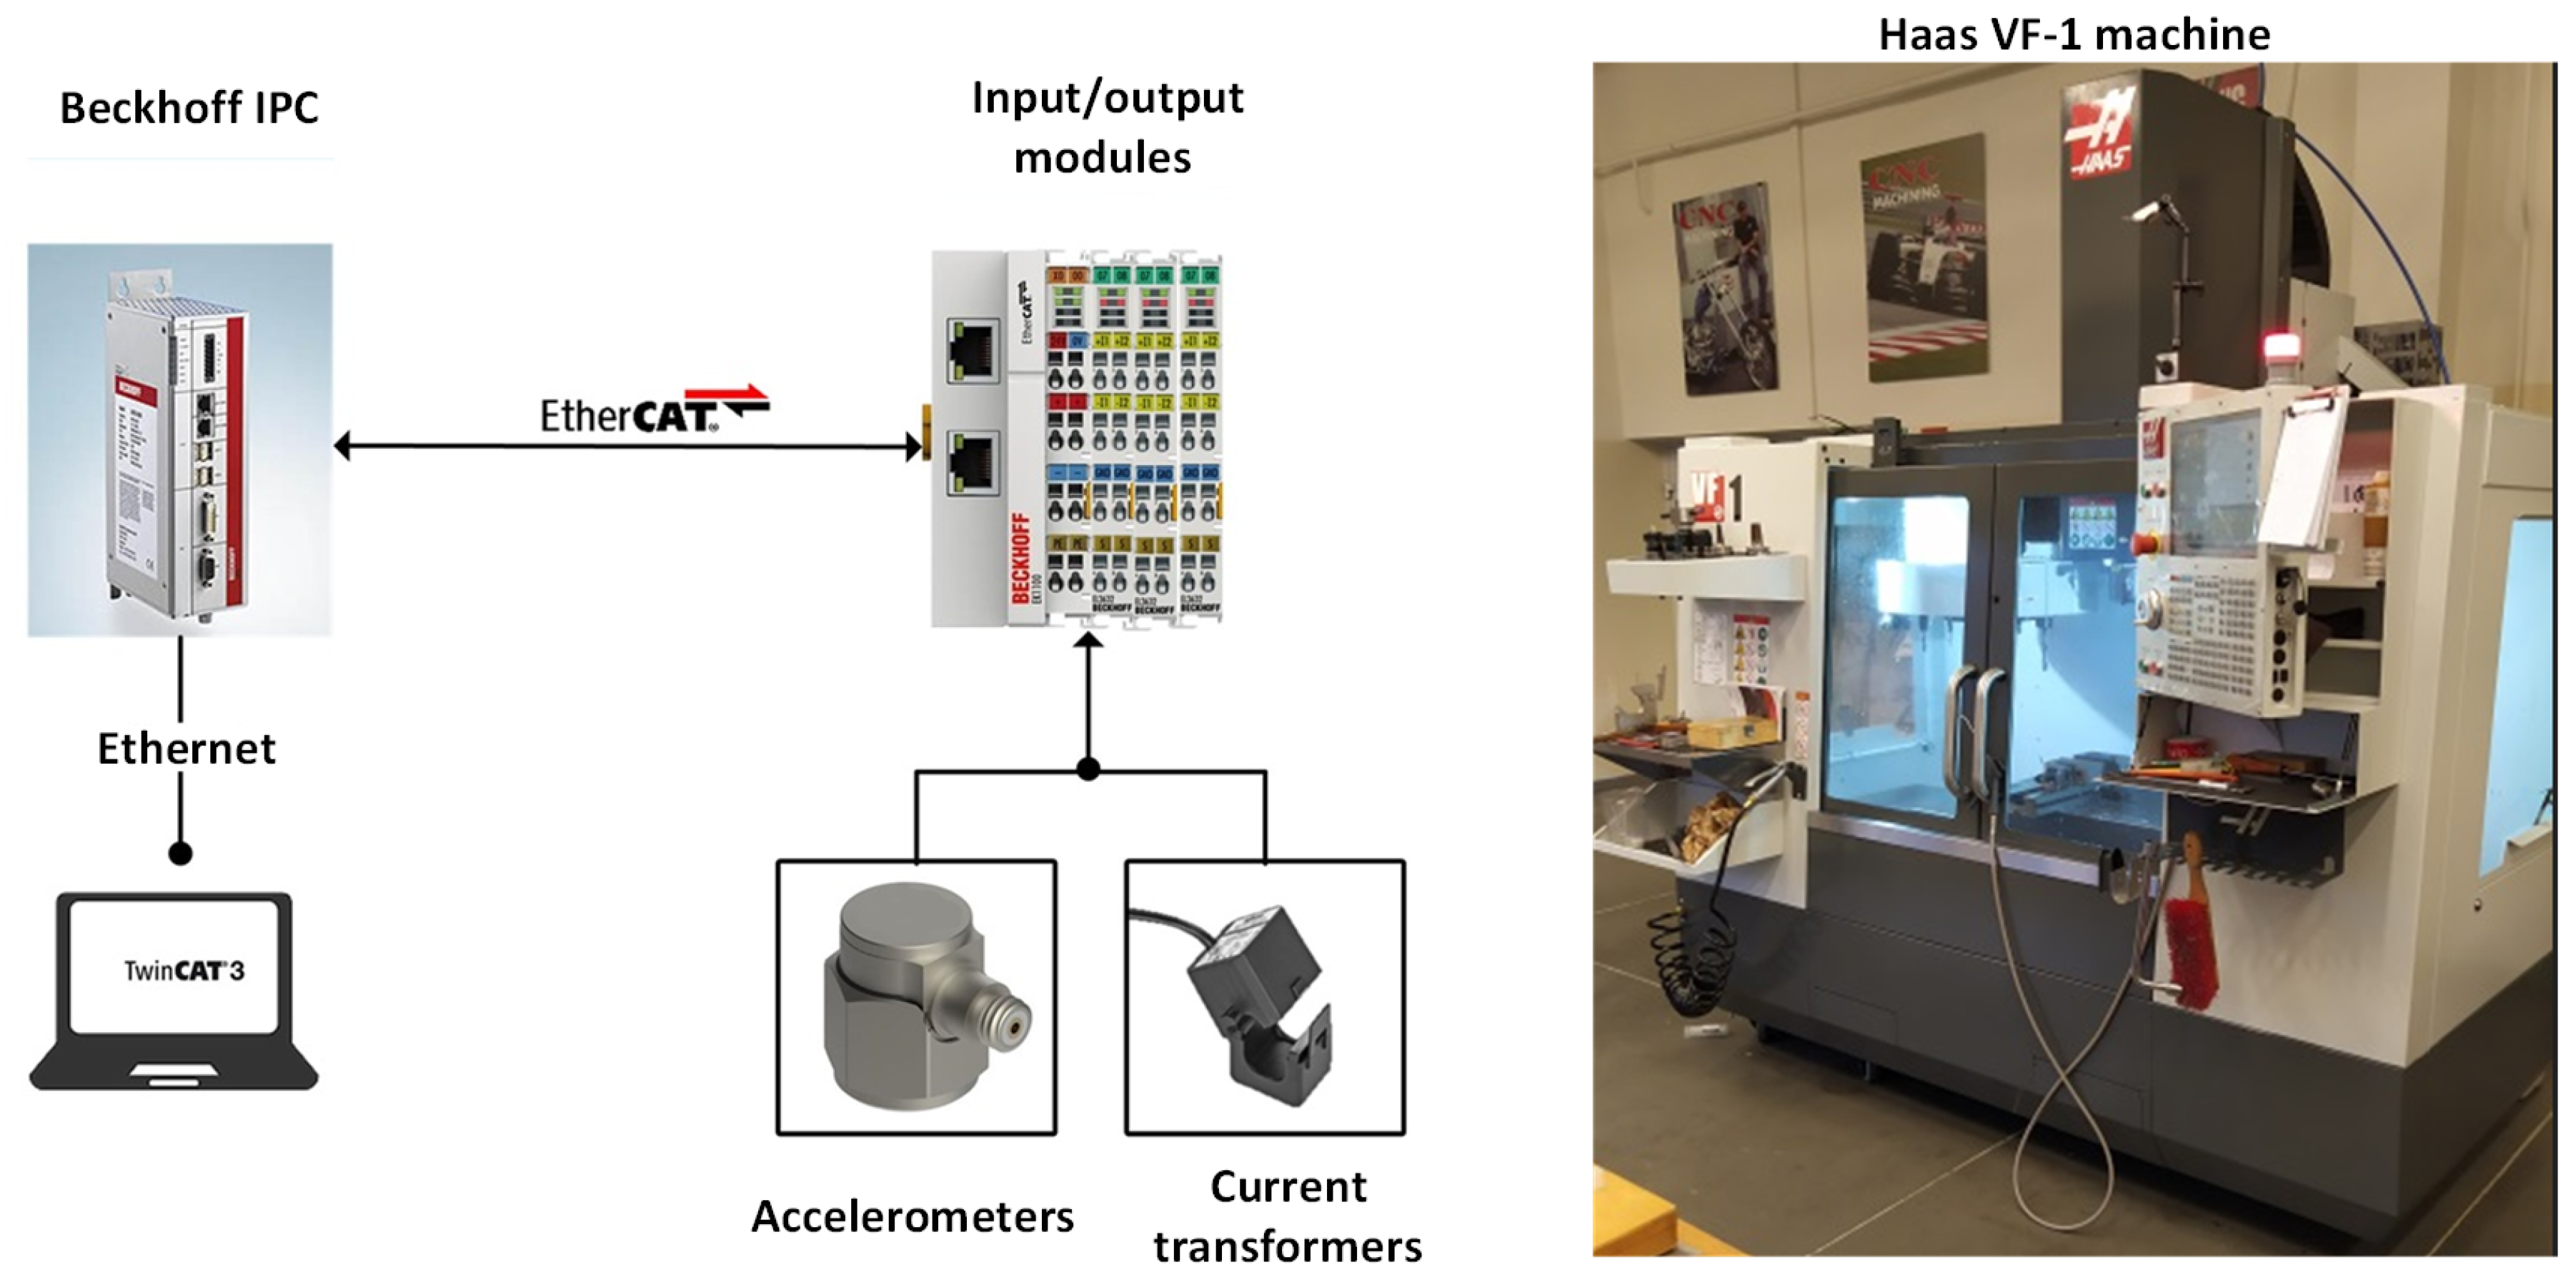
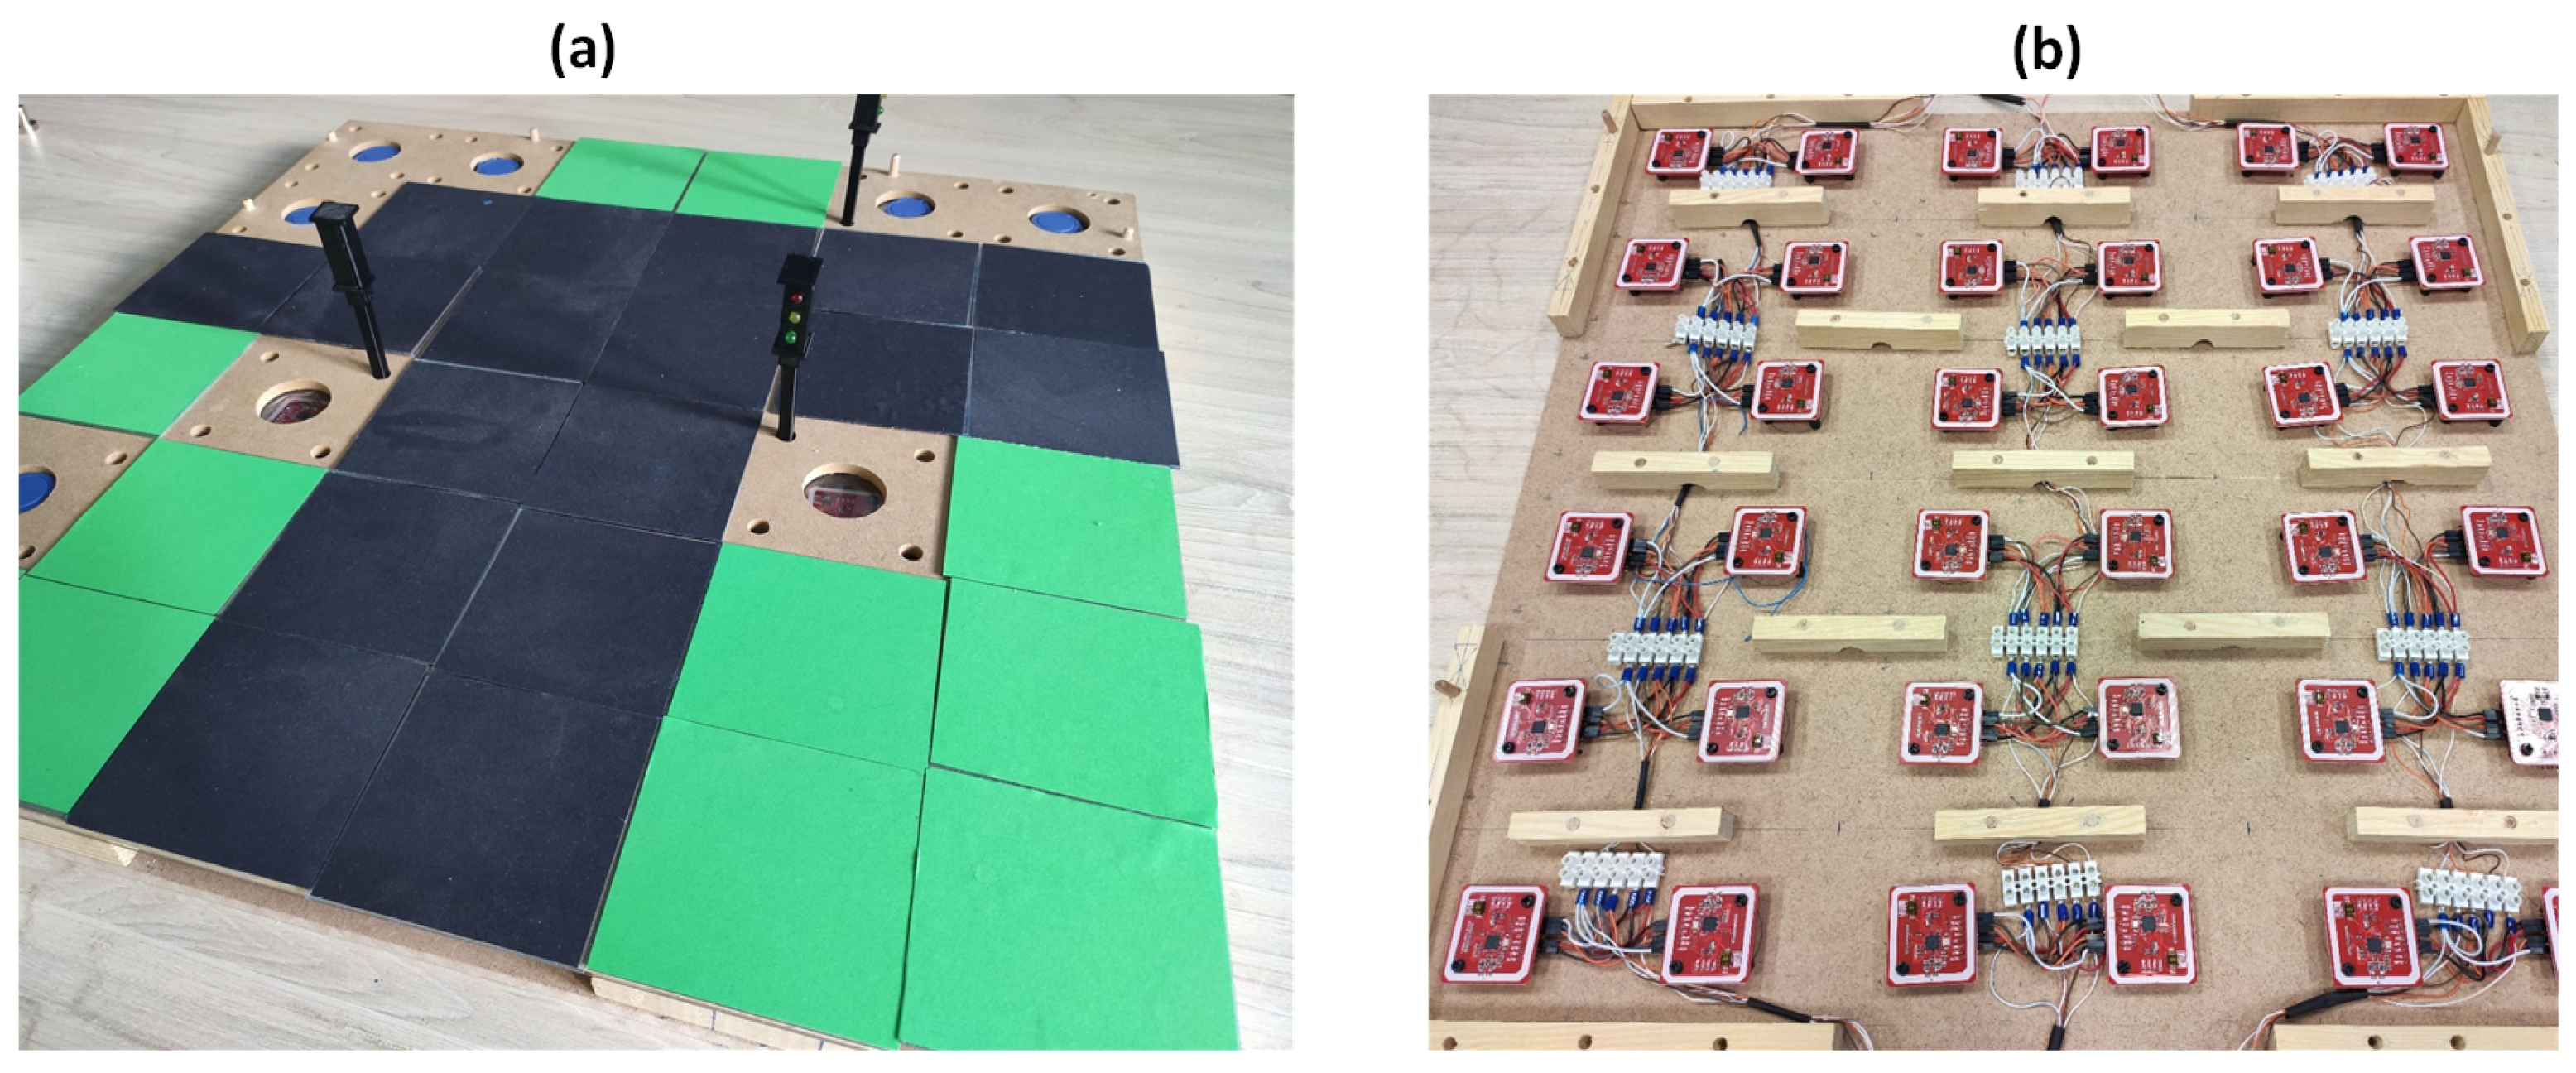
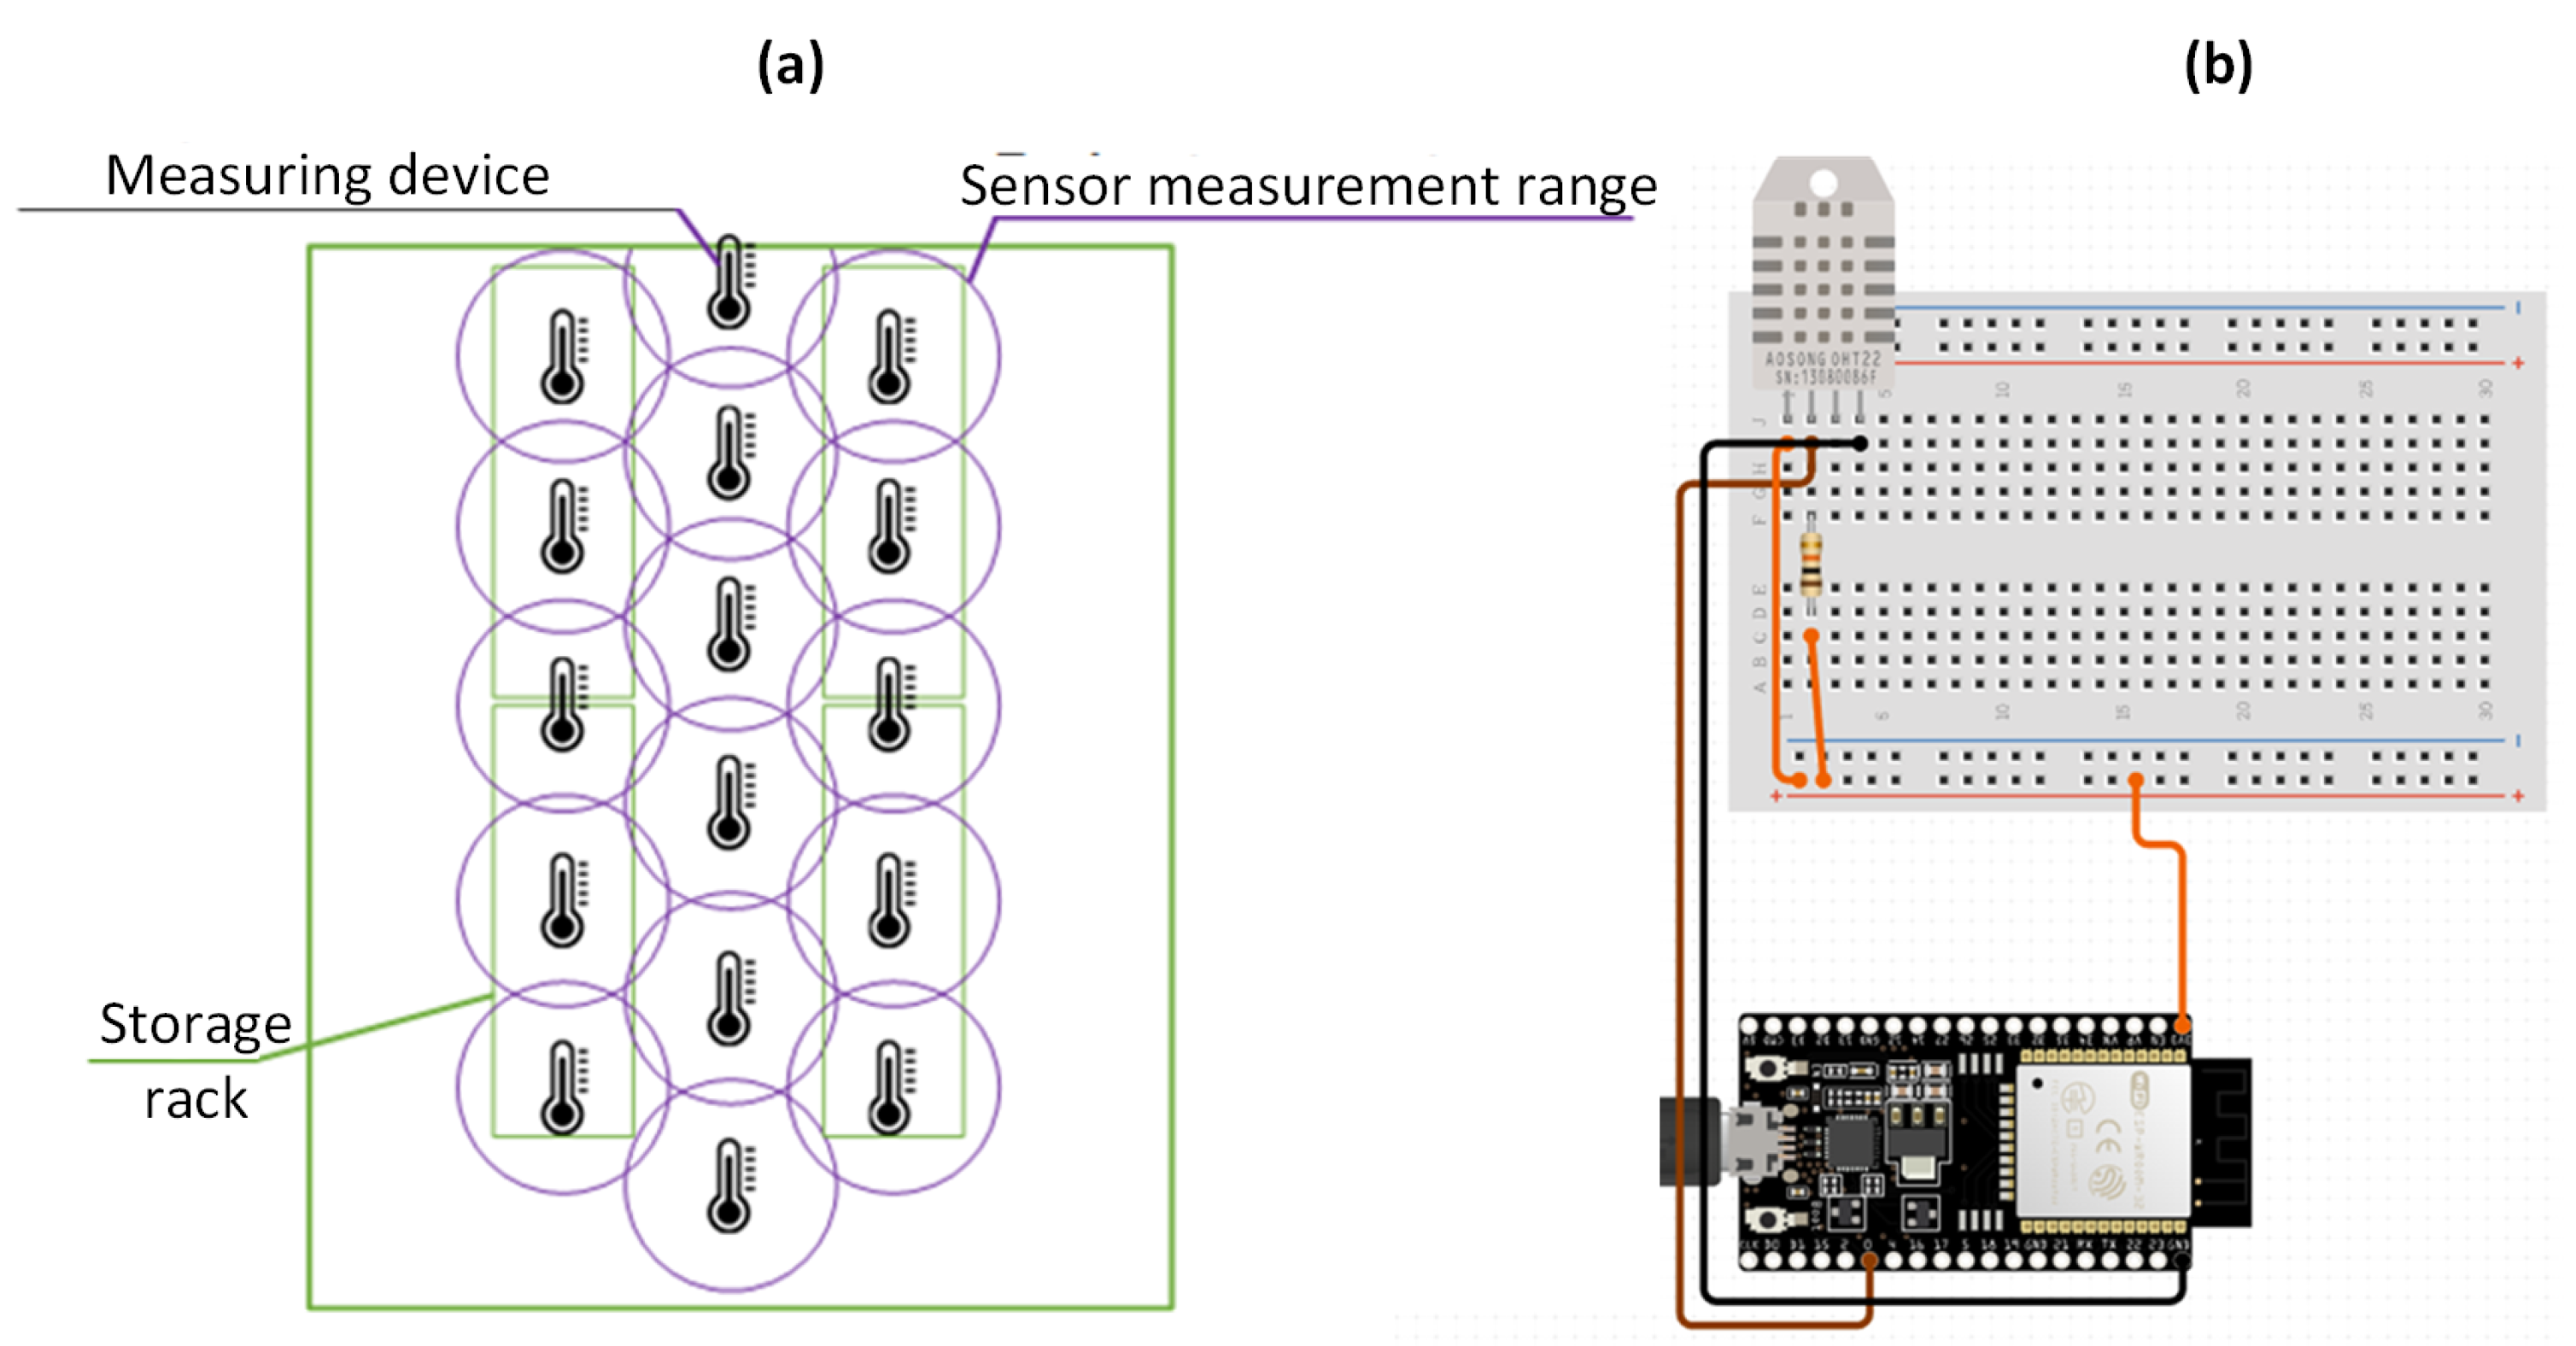
3.1. Sources of Measurement Data

As part of the ongoing research work, an advanced test stand was constructed, consisting of a three-axis milling center (Haas VF-1 CNC milling machine), which was equipped with a set of sensors (8 accelerometers, 12 current transformers) and a system for recording the measurement data, as well as a specially designed rim for vibration sensors, which formed the basis for the implementation of the research comparing the effectiveness of diagnosis systems for different ways of mounting sensors (invasive/non-invasive). The constructed stand is the basis for the development of the requirements for the IoE system architecture, in the field of industrial diagnosis and surveillance systems for Industry 4.0, and provides the basis for a wide range of research in the application of AI, Virtual Reality (VR), and IoE methods in diagnosis, surveillance, and process control in Industry 4.0. In Figure 2, a prototype measurement system with sensors (accelerometers, current transformers) installed on a Haas VF-1 machine and with an industrial computer (IPC) performing the function of a data logger is presented. The sensors were connected to the input measurement modules (EL3632 IEPE for the accelerometers and EL3413 for the current transformers). Data via the EtherCAT industrial network were recorded by the IPC and were then transferred to a PC. The built-in measurement tool available in the TwinCAT3 environment was used to record the data, which enabled the export of the recorded data, e.g., to csv format for further data processing (e.g., in Python). The data collected on the computer in the form of csv files was then made available to the data broker (Apache Kafka) using a dedicated module developed in Python, which reads the data from the files, performs the required conversion, and, using the PyKafka library, publishes the data in the topic Kafka. In this way, the possibility of integrating an Edge object into the proposed IoE architecture that returns the measurement data acquired as a result of an experimental run by an operator on demand was tested. The overall architecture of the system is shown in Figure 2.
While analyzing the available solutions for the possibility of collecting data from the various sources that made up the IoE system, attention was also paid to the great potential of using Radio-Frequency Identification (RFID) systems. One of the areas explored for the use of RFID tags and sensors was the road and home infrastructure as a part of the implementation of the smart city and smart home concepts. The developed algorithms enabled the data exchange between the RFID readers coupled to a Raspberry Pi microcomputer and a Cloud service, which is also part of the ECC concept. For the analysis of this class of systems as a source of data, a mock-up of an intersection was prepared to simulate traffic and the functioning of traffic lights controlled using RFID systems (see Figure 3). The mock-up was prepared specifically for the implementation of the study, as a traffic source and an element subject to analysis, control, and inference within the proposed architecture. The ideas behind the operation of this class of systems were described in more detail in the paper [37].
Another position that was used to test the developed architecture was related to the system for tracking environmental parameters in a warehouse. In the case of some warehouses, it is required to ensure adequate humidity and temperature so that the products stored in them are not damaged. Determining the current environmental conditions requires taking a number of measurements at various locations in a given facility—the warehouse, which, in turn, involves the use of a number of measurement and transmission devices. In order to obtain verified and specific data/measurements, it is necessary to install a larger number of sensors in the preset area. The adopted distribution of sensors is presented in Figure 4a.
The data obtained from temperature and humidity sensors make it possible to develop an area map to visualize the technical conditions in a given area. However, obtaining an area map requires taking measurements at multiple points, as mentioned earlier. The task requires modules that can operate independently of one another, in continuous mode, with an emphasis on the battery power. The devices should have Internet access to be able to transmit data to the data-acquisition and -processing system. Any data corrections or normalization and preparation of the data into the appropriate format can be performed on the microcontroller to which the sensor is connected or directly in the central system. In the course of the work, the following configurations of the measurement elements were analyzed: Raspberry Pi 3/4, Raspberry Pi Zero 1.3/2, Raspberry Pi Pico, Arduino (Uno, Nano, Mega, etc.), ESP32 or ESP8266. Due to its considerable capabilities, availability, and low power consumption for analysis, it was decided to use the ESP32-DevKit module as a sensor-data-aggregation chip. It was decided to perform the temperature and humidity measurements using multifunction sensors. The focus was on 3 potential measurement sensors that would collect the data. They are rearranged in Table 1.
Based on the parameters of the sensors, a digital sensor DHT22 was selected, having the function of measuring both temperature and humidity, which further reduced the total number of measuring systems. The DHT22 sensor is characterized by a wide measurement range (−40 to 80 C), humidity measurement in the range of 0 to 100%, a low current consumption of 0.2 mA, and measurement accuracy in both temperature and humidity. The circuit should be mounted by connecting the sensor’s VCC supply pin to the 3.3 V of the ESP32 DevKit module, since the ESP-32 operates using 3.3 V logic. To avoid a voltage converter, both the power supply and signal levels must be the same. The GND pin should be connected to the ground located on the board—the GND pin. The signal connector (OUT) should be connected to the digital pin on the ESP32. The resistor used will allow the signal to be processed correctly and read the correct frame with data coming from the DHT22 sensor. An example of the connection is presented in Figure 4b. The devices can be connected to one another using the WLAN located in the warehouse. All data were processed in the ESP32 DevKit chip, while the data were sent to the central system in a predefined format, e.g., readings in the format set for the architecture, using both JSON and XML. Diverse solutions can be used for data transmission, e.g., the REST API. The data were collected from multiple sensors located a random distance away from each other, as proposed in Figure 4a. The data acquired can allow the development of a temperature map with a high degree of accuracy, making it possible to determine what potential goods can be stored in given locations. By densifying the sensors, the probability of accurate measurement increases.
The last measurement system that was prepared within the framework of the conducted research work for data acquisition was a mobile air quality measurement system placed onboard a drone. In order to carry out preliminary analyses related to the development of the architecture of the data-acquisition and -processing system, the elements of the architecture integrated with the central system were analyzed, along with the processing of a part of the data (preprocessing) on one of the additional modules placed on the drone. As a part of the work, the connection of an Unmanned Aerial Vehicle (UAV) for collecting data related to the concentration of pollutants in the air (PM2.5 and PM10 dust sensors) was tested. In the proposed piece of architecture for data transmission between the drone and the data-acquisition system, a Raspberry Pi was used as an intermediary computer and, at the same time, aggregated data from the PM sensors. The communication model is shown in Figure 5.
The latest version of the Pixhawk Cube controller was used to control the drone. There are several variants of the Cube controller available on the market, which differ primarily in the STM microprocessor used. The orange version features a 32 bit ARM® Cortex®-M7-type microprocessor called STM32H753VIT6. The microprocessor operates at a clock frequency of 400 MHz, has 2 MB of flash memory and 1 MB of RAM, which gives it a wide range of application possibilities, and has sufficient parameters for use in a given project. For testing purposes, all communication was based on the use of the REST API. Due to its request/response structure, it is possible to send any data using the JSON, XML, etc., format between devices. The key element in the transmission of the data, as well as the control of the UAV was the Raspberry Pi. The device is equipped with popular communication protocols—UART, SPI, I2C—and has a built-in Bluetooth/WiFi module. It is possible to connect additional communication modules such as Near-Field Communication (NFC) readers or Global System for Mobile Communications (GSM) devices. As a part of the tests, the use of an ESP32 module was considered, but the Raspberry Pi turned out to be a more-favorable solution due to the higher number of General-Purpose Input/Output (GPIO) pins required to connect the Global System for Mobile Communications (GSM) module. For UAVs, it is also possible to plan a mission or program the autonomous operation of a drone or drones communicating with one another as a swarm. Any data acquired can be sent to a database in a properly prepared format. A special holder was developed for the board support package, in which the necessary electronics were placed, viz.: Raspberry Pi, PM measurement sensor, and necessary passive electronics, i.e., prototype boards, GSM module, or voltage stabilizers. The finished measurement system placed on the drone is presented in Figure 6.
The work also analyzed the possibility of integrating the Manufacturing Execution System (MES) solution class (EDOCS MES 3.2) with the proposed IoE system architecture. MES classes systems are a key element of the IT infrastructure enabling the implementation of the Industry 4.0 concept in industrial practice, as they provide data on the execution of production orders and the level of utilization and the working time structure of production resources. As a part of the work carried out in cooperation with an industrial partner (EDOCS Systems, https://edocssystems.com), two integration scenarios were analyzed. The first approach analyzed assumed the possibility of implementing a module for reading data from the MES’s database using the Debezium platform, which detects changes in the MES’s database and transfers them in the form of events published in the topic Kafka. The second approach analyzed assumed the possibility of integrating the MES with the IoE platform by reading data information from the integration database provided by the MES and transferring it to the Kafka broker using a dedicated C# program using PyKafka libraries and publishing data in the topic Kafka. The challenge in terms of the practical implementations of the discussed platform is the use of an integration solution that will reduce the need for modifications of the MES (e.g., the need to develop a dedicated API or the direct implementation of data transfer to an integration broker in the MES). As part of the tests carried out in a real production system, an integration solution based on the Debezium platform was tested. Both solutions proposed in the paper do not require any additional implementations in the MES, because they use the data that the MES saves in its database. The Change Data Capture (CDC) solution based on Debezium and Apache Kafka seems to be slightly better suited to the event-based characteristics of MES data. It is not necessary for the database integrator to periodically query to notice if there are any new events that require reading (which generates additional load on the database server). Debezium captures event-based new data in the MES database, e.g., order processing and work-in-progress events, and then, automatically publishes them to the Apache Kafka topic. From this source, subscribed clients (integration modules) already receive data asynchronously. The work, carried out in cooperation with an industrial partner, showed that both scenarios are feasible and can be applied in industrial practice.

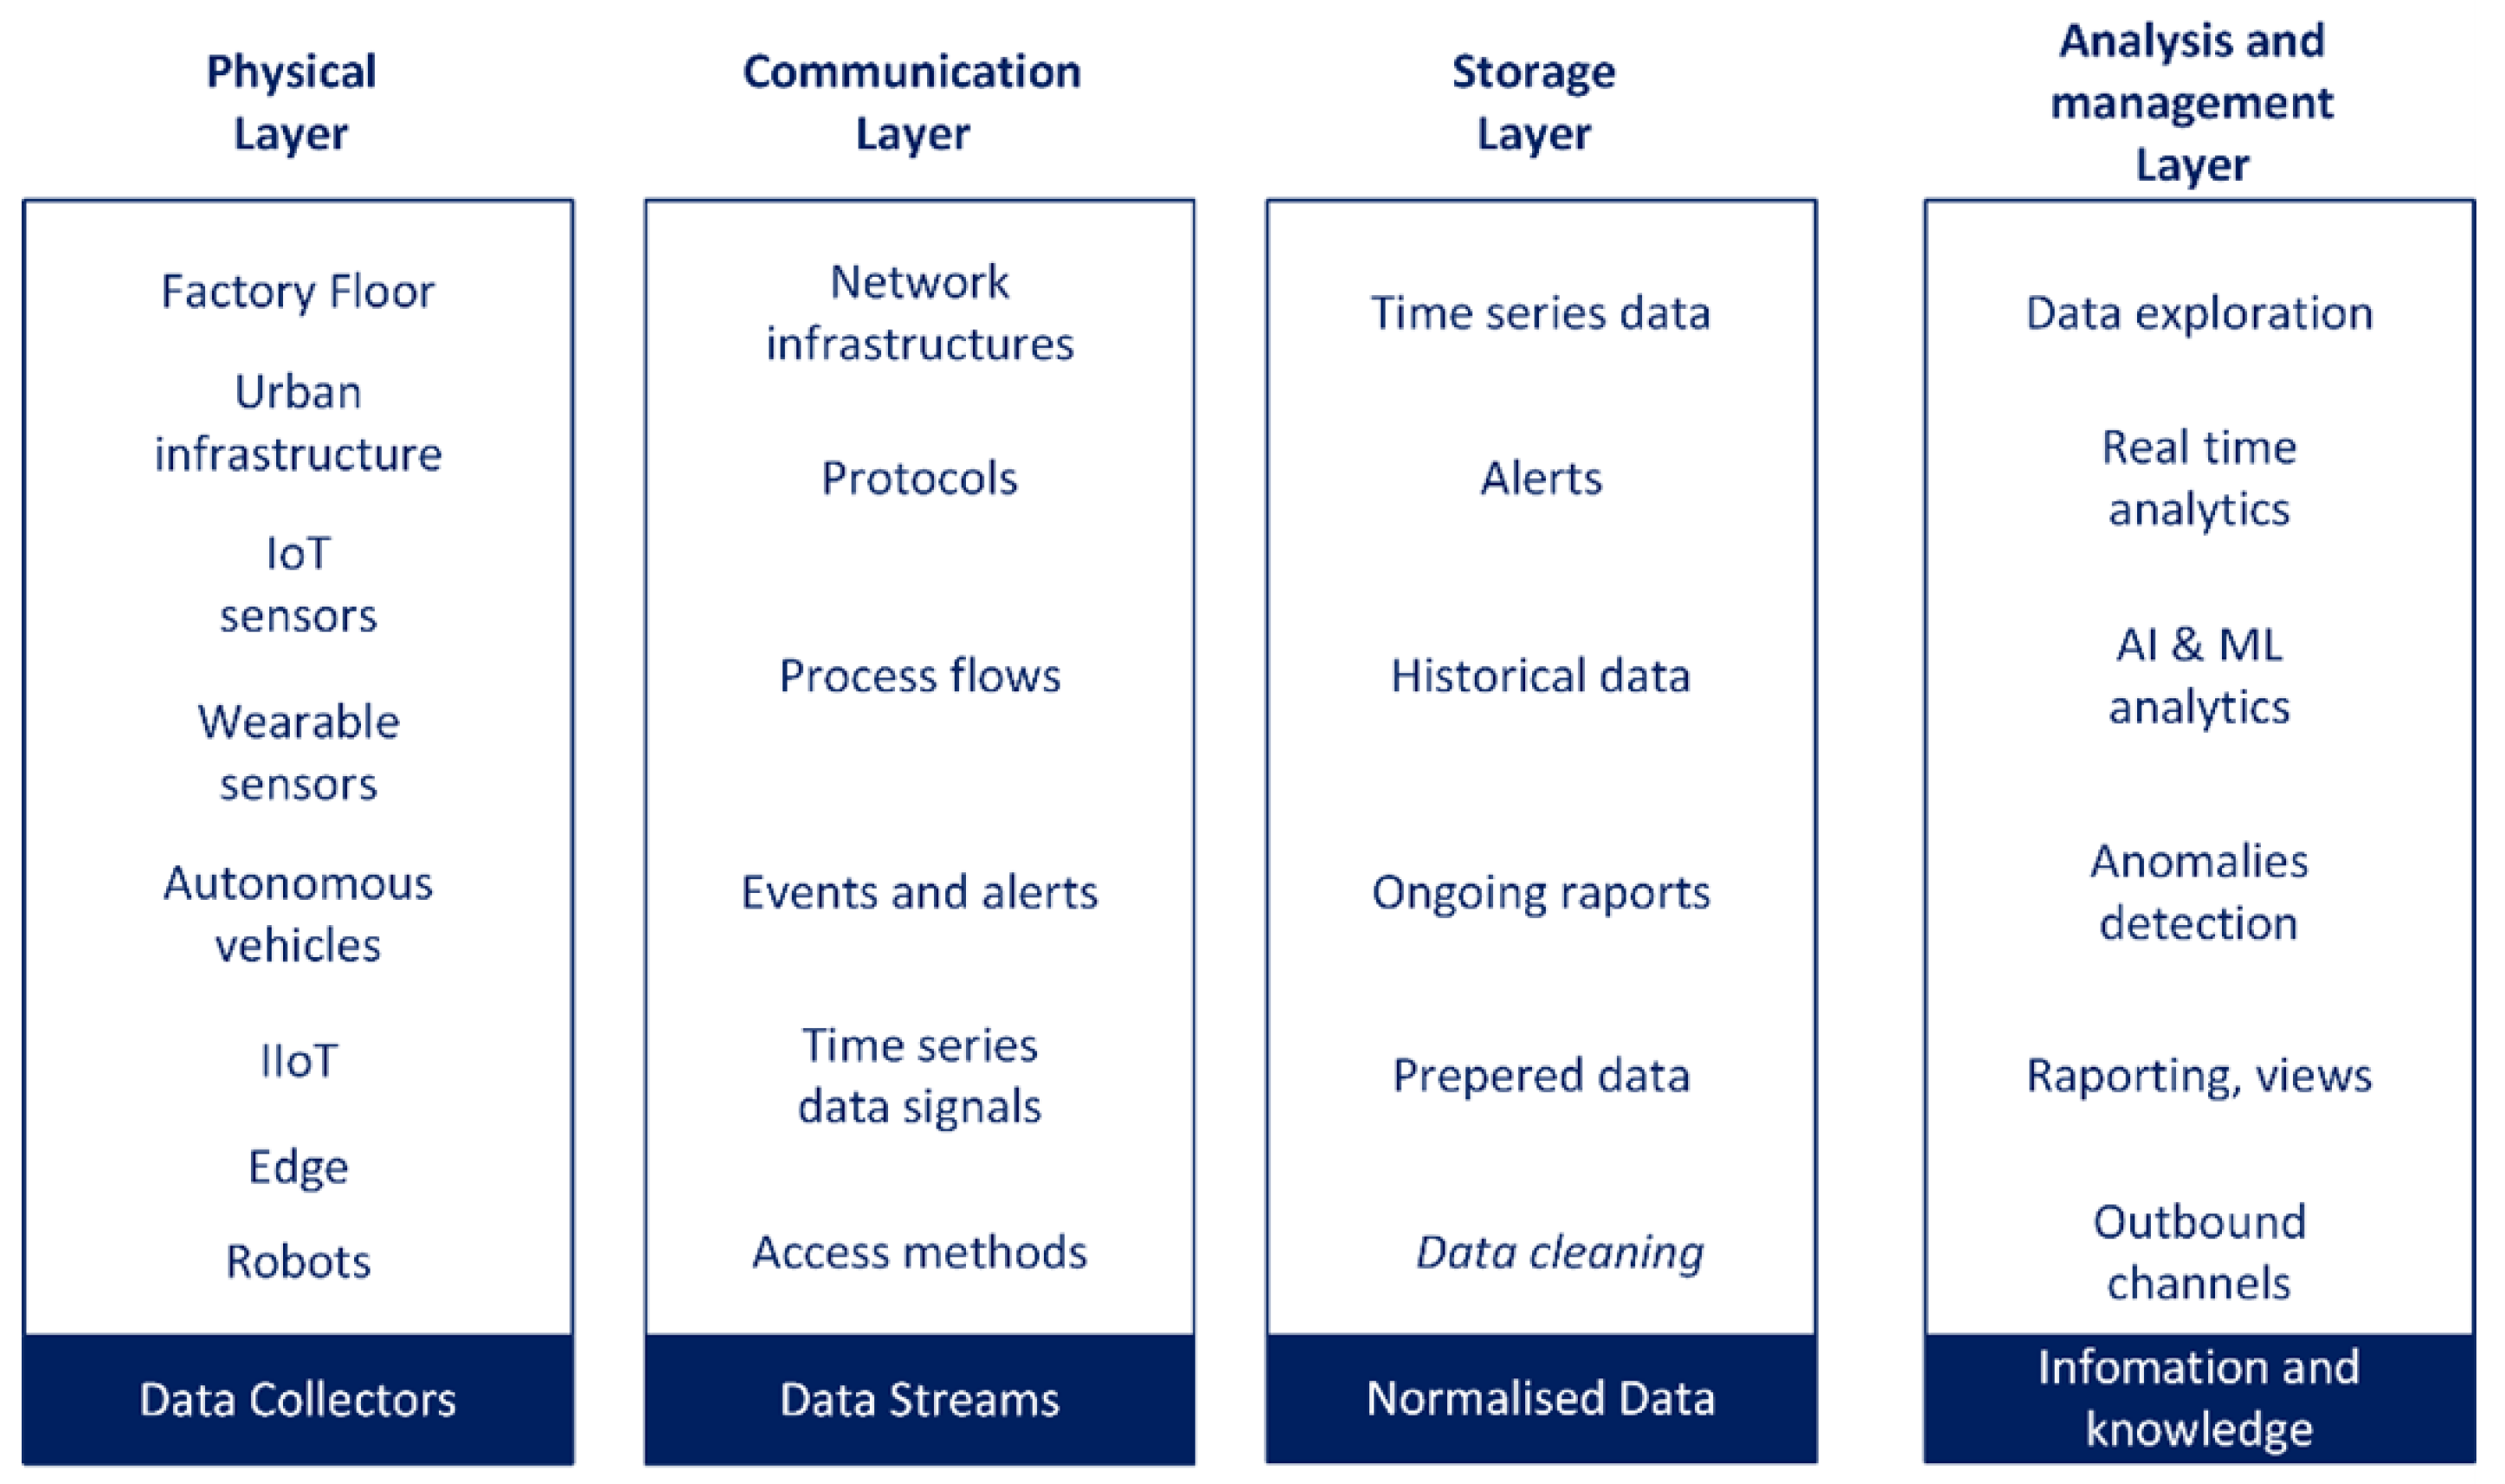
3.2. Categories of Data Sources

In the previous section, the data sources created specifically to test the effectiveness of the proposed architecture were presented. In addition, the work used a number of elements available directly on the market; they are presented in Figure 7. It should be noted that the Apache Kafka system was selected as the data aggregator, but other solutions are acceptable.
As a result of the work carried out, the following main categories of devices were selected as possible data sources:
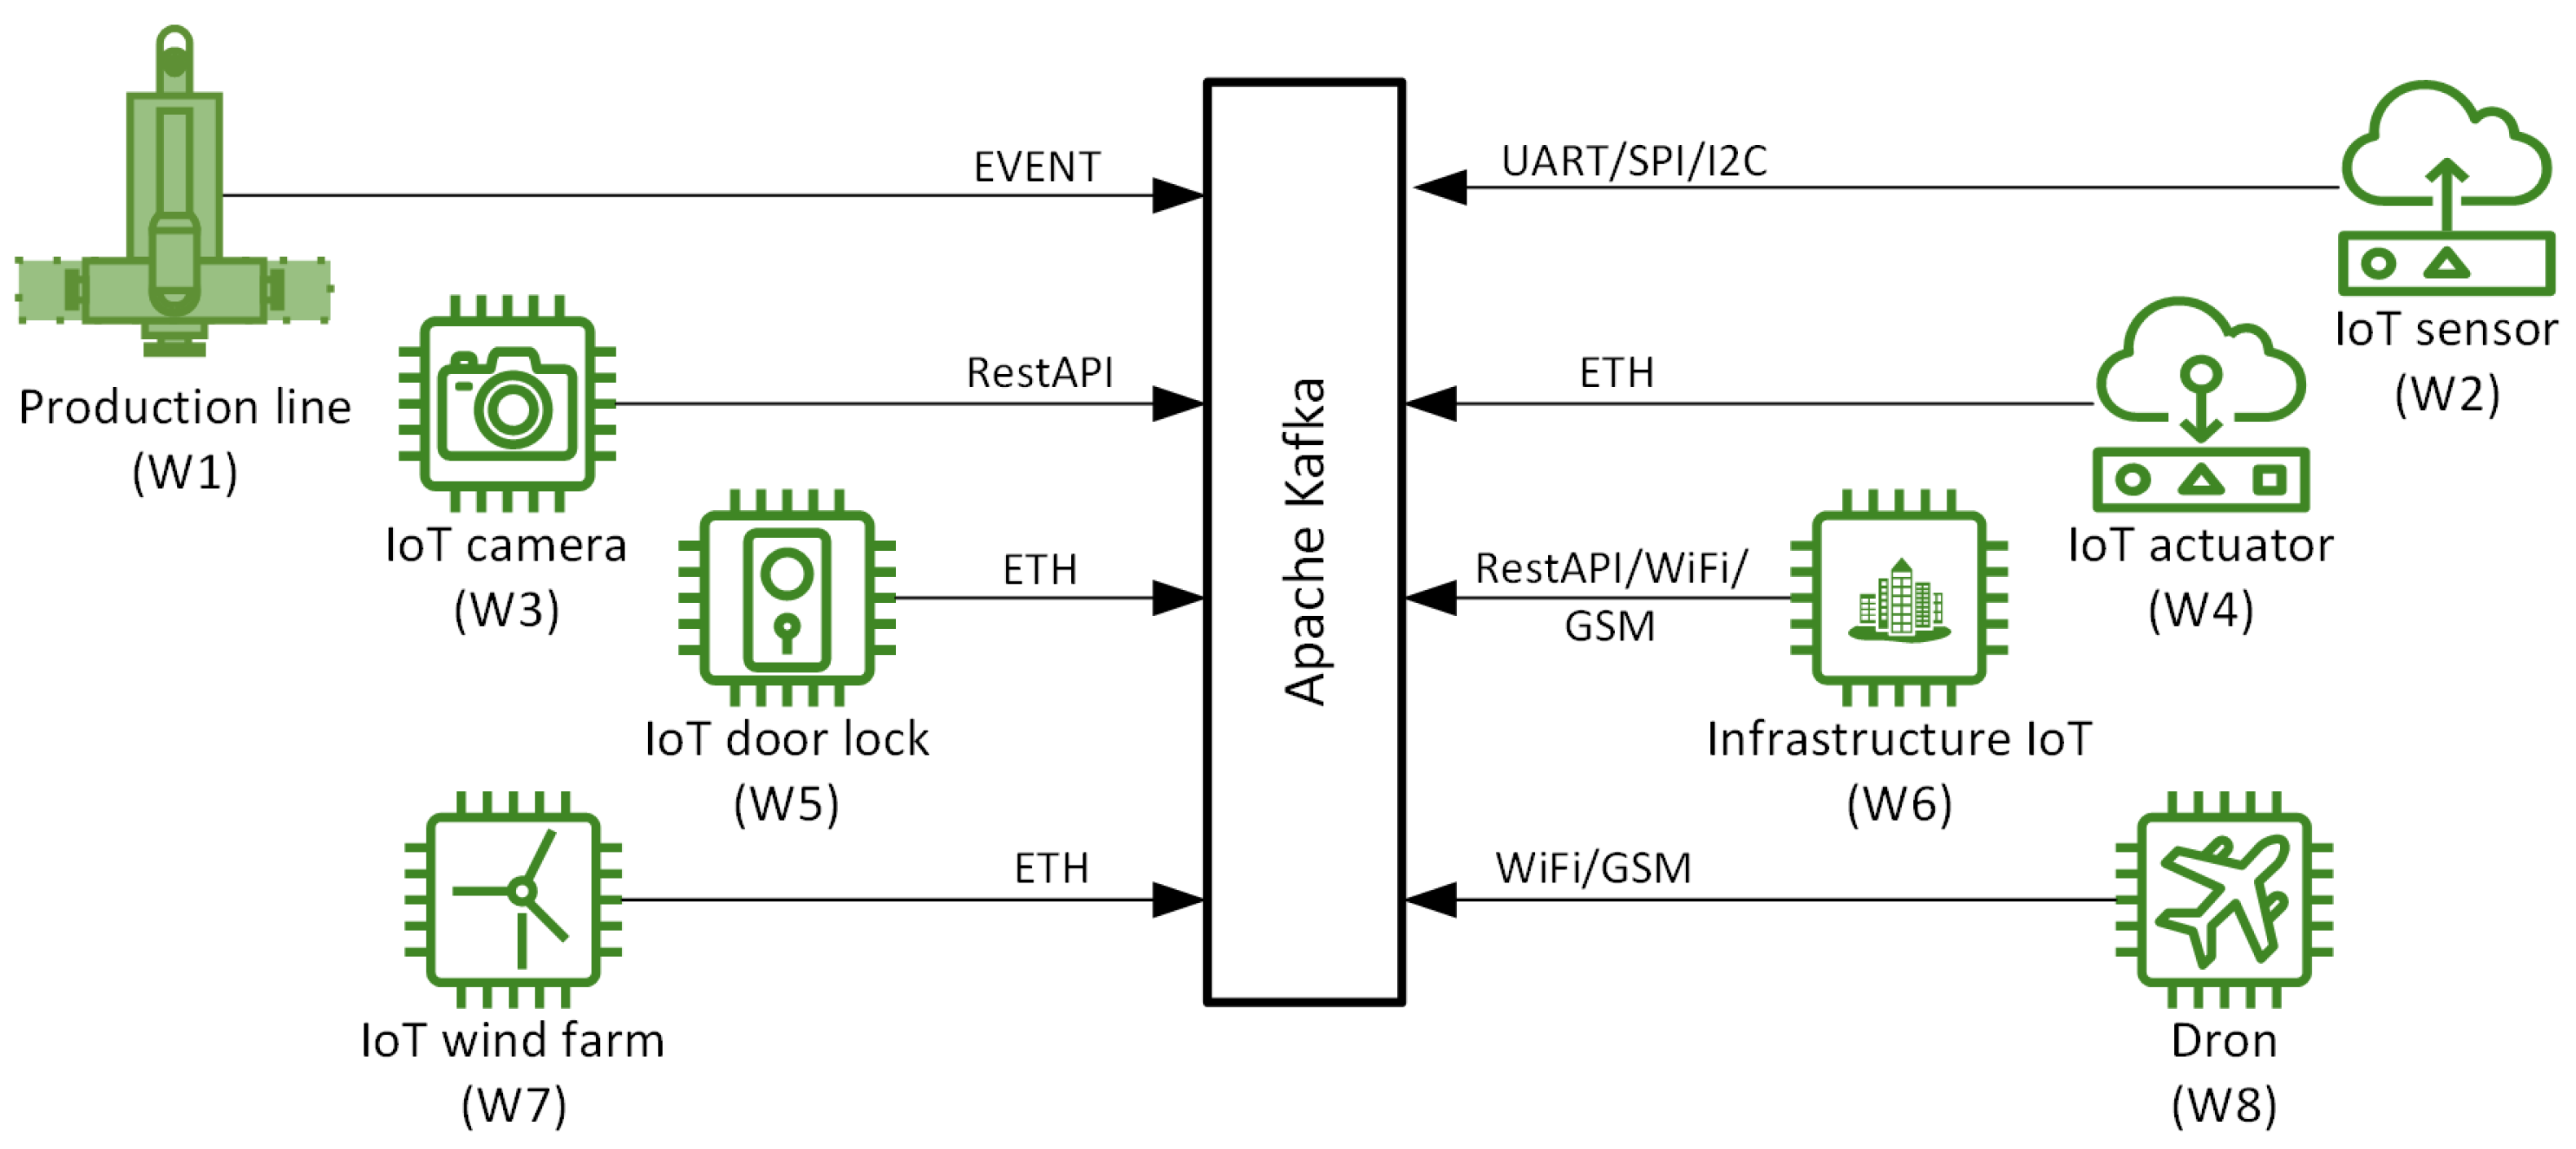
  • Category 1 (W2, W3, W4, W5): simple objects, e.g., IoT sensors, etc. As a rule, they return data with little complexity and do not require complex data processing performed locally on remote nodes. In this case, nodes do not aggregate data and do not store them in local databases or other repositories.
  • Category 2 (W3, W6, W8): facilities that require local data processing (aggregation, cleaning, local control, etc.), but these are relatively simple facilities that have little computing power and limited hardware resources. This group of devices includes, i.e., the Computer Numerical Control (CNC) machine, manufacturing components, embedded systems, controllers, and IPC computers. In the case of these systems, we are dealing with limited resources for data storage (small databases, low-performance servers in extreme cases). Edge and IIoT objects with low complexity belong in this category.
  • Category 3 (W1, W7): complex systems, including entire factory floors, factories, smart city systems, etc. They include information systems that communicate with the rest of the system using events, aggregated data, Api.MES, Enterprise Resource Planning systems (ERP), etc. In this class of systems, we are dealing with dedicated processing resources, which include server systems, database systems, application systems, directory services, etc. Complex IIoT objects fall into this category.
The identification of categories of devices allowed systematizing the work related to the analysis of traffic sources, which, in turn, were translated into a system model and a proposal for the target architecture of the data-collection and -processing system. The proposed classification can be used in the future during the construction of the system to prepare recommendations, a set of good practices, or ready-made hardware and software requirements for each category. Such an approach can speed up the process of implementing and attaching new remote nodes to the system under construction.

4. Data-Acquisition, -Collection, and -Processing Architecture with Technology Stack Assumptions

A key element in the management of a modern information system is the ability to implement a universal system for information collection, processing, and distribution. There are more than one billion devices in the world compatible with the idea of the IoT. Each of these devices sends significant amounts of data to the network, supporting the operation of many different industrial systems, cyber–human systems, or telemedicine applications. This class of solutions is also used in such fields as transportation, the automotive industry, aviation, Industry 4.0, and telemedicine. With regard to manufacturing systems, the concept of IIoT objects is becoming increasingly common in the literature. Many sensors, offering a similar functional range, but from different manufacturers, send data using different standards for recording information, using different communication protocols or a different measurement scale for the same physical quantity. The main challenge for these solutions is the need to ensure universality in terms of the transmitted data, which will translate into interoperability between solutions from different manufacturers. In closed IoT systems, control over the operation and data acquisition from sensors is performed by a dedicated management module. Most often, this is a minicomputer, IPC, or a given series of Programmable Logic Controllers (PLCs) or Programmable Automation Controllers (PACs). The main advantage of such a homogeneous architecture is, at the same time, its biggest disadvantage. Such a system can only work with compatible sensors and measuring devices. For some time, there has been a noticeable unification of solutions in the context of information transfer between individual elements of distributed systems, but they are still heterogeneous systems in the area of communication protocols (Ethernet, BTLOW, ZigBee, etc.) and the structure of transmitted messages (RESTAPI, GRPC, XML). Industrial solutions use heterogeneous devices, from different manufacturers, which are characterized by different measurement parameters specific to the industry sector. The complexity of the transmitted data also varies, with more-complex industrial facilities being referred to as IIoT facilities. From this perspective, therefore, it is crucial to develop the assumptions of an open system architecture, which will allow the integration of various objects, sensors, and measurement devices and, also, data acquisition, processing, and in special cases, the transmission of control messages. At the same time, the developed system should meet the requirements of industrial standards, safety, and scalability. A number of systems integrating measurement data have been described in the literature, but their implementation in real production conditions is difficult. Very often, the assumptions of this class of systems are tested only in simulators or presented in the form of prototypes at a maximum of TRL5 (see Section 2). The reasons for this situation can be attributed to two main aspects:
  • Currently, there is no consistent, uniform, universal interface available to acquire data from various IoT/IIoT devices and send control messages to them.
  • There is no environment available in the form of a framework within which new functionalities and algorithms could be implemented without having to directly and time-consumingly implement them in all types of end items.
The proposed system architecture uses a producer–broker–consumer model, in which the data producer is a measurement device, a sensor, a data aggregator in the case of an off-the-shelf solution (a sensor with instrumentation and dedicated software), an IIoT object (e.g., a CNC machine, a production line), or an Edge object. These components transmit data using the selected transmission medium and transmission protocols to the broker. In the proposed solution, in order to integrate different types of messages, a dedicated data-aggregation module is used in the Central Management Module (CMM), which uses a data flow management system such as Apache Kafka. In the described architecture, it functions as a microservice (Kafka Connect) broker. This collector integrates data from various sources using a queuing system and redirects data streams to the appropriate microservices that are components of the CMM system. The data is queued accordingly using ZooKeeper, which further duplicates the data and stores them in different partitions. This approach allows uninterrupted operation of the system in case of the failure of the selected broker instance. From the point of view of the technology stack, currently, the most-common system model was presented in the paper [38]. However, ongoing work has shown weaknesses in the current approach. This model promotes standardization trends in the area of IoT solution integration. In other words, the desired long-range goal considered in this approach is to standardize all aspects of communication between elements of the architecture under consideration. Going further, it would also be desirable to create a consistent and uniform standard for recording and representing measurement data. This approach allows building large heterogenic IoT systems based on consistent and rigid protocol rules. This is a classic approach widely used in distributed systems such as computer networks. However, the question should be asked: Will such a model work for IoE systems? In [38], the physical sensing layer operates strongly differentiated IoT solutions, which are characterized by strict adaptation to the conditions in which they are used, and their architecture is determined by the environment in which they are applied. Such an approach prevents, e.g., the use of uniform communication standards, standards related to security, or accepted data representation. To integrate this class of systems, it is necessary to use a maximally flexible system model with the assumption that the integrated systems will not use consistent and uniform protocols. In Figure 8, the assumptions proposed in this article for the new technology stack model for the proposed architecture are presented.
The proposed approach to creating a technology stack shown in Figure 8 is characterized by great flexibility in the context of adding and using functional blocks. In blue are marked mandatory elements for the data-collection and -processing system; in green are marked optional elements; dots indicate the vertical and horizontal directions of development of the technology stack, which allows taking into account new technologies that will appear on the market. Data from remote nodes are collected in a central Cloud, which is tasked with processing the data and making them available to the end customers via application interfaces. By data processing is meant both the sharing of data in a specific format and the conclusions drawn from the data analysis. Clients of the system can be, i.e., individuals, brokers of data or Business Intelligence (BI) systems, machines, or other information systems. The entire system is covered by a coherent security approach defining the rules of information exchange and processing, which includes the definition of legal aspects (e.g., General Data Protection Regulation), as well as the technological aspects (e.g., it defines encryption algorithms, secure data exchange, animation techniques, etc.). The key in the proposed approach is to use the most-flexible approach to the construction of individual blocks. Let us consider this with the example of the data collector block. Using an MQTT broker to build it, for example, forces the use of the MQTT protocol to exchange data between nodes. In the proposed approach, a most-flexible and -open collector should be used. In the proposed architecture (which will be described further on), the Apache Kafka module is used, which can retrieve data using many different protocols from different remote nodes. It should be noted that, at the stage of system design, the key is the appropriate selection of the data collector. The selection of an element in this area depends largely on the purpose of the system. For example, if the system should be characterized by high versatility and allow the integration of a large group of different IoT solutions, Apache Kafka may be applicable. If the implemented architecture is to work more energy efficiently and has limited hardware resources at its disposal, the MQTT broker may be a better solution. Of course, custom solutions are also possible. In addition, depending on the nature of the data, or analysis, the data can be stored in different types of databases or as files. Applications, through a central node, access the data they need and, in the preprocessing process, can prepare them accordingly for a given purpose.
The following subsections will present two proposed architectures for data acquisition, collection, and processing that meet the assumptions of the presented technology stack model.

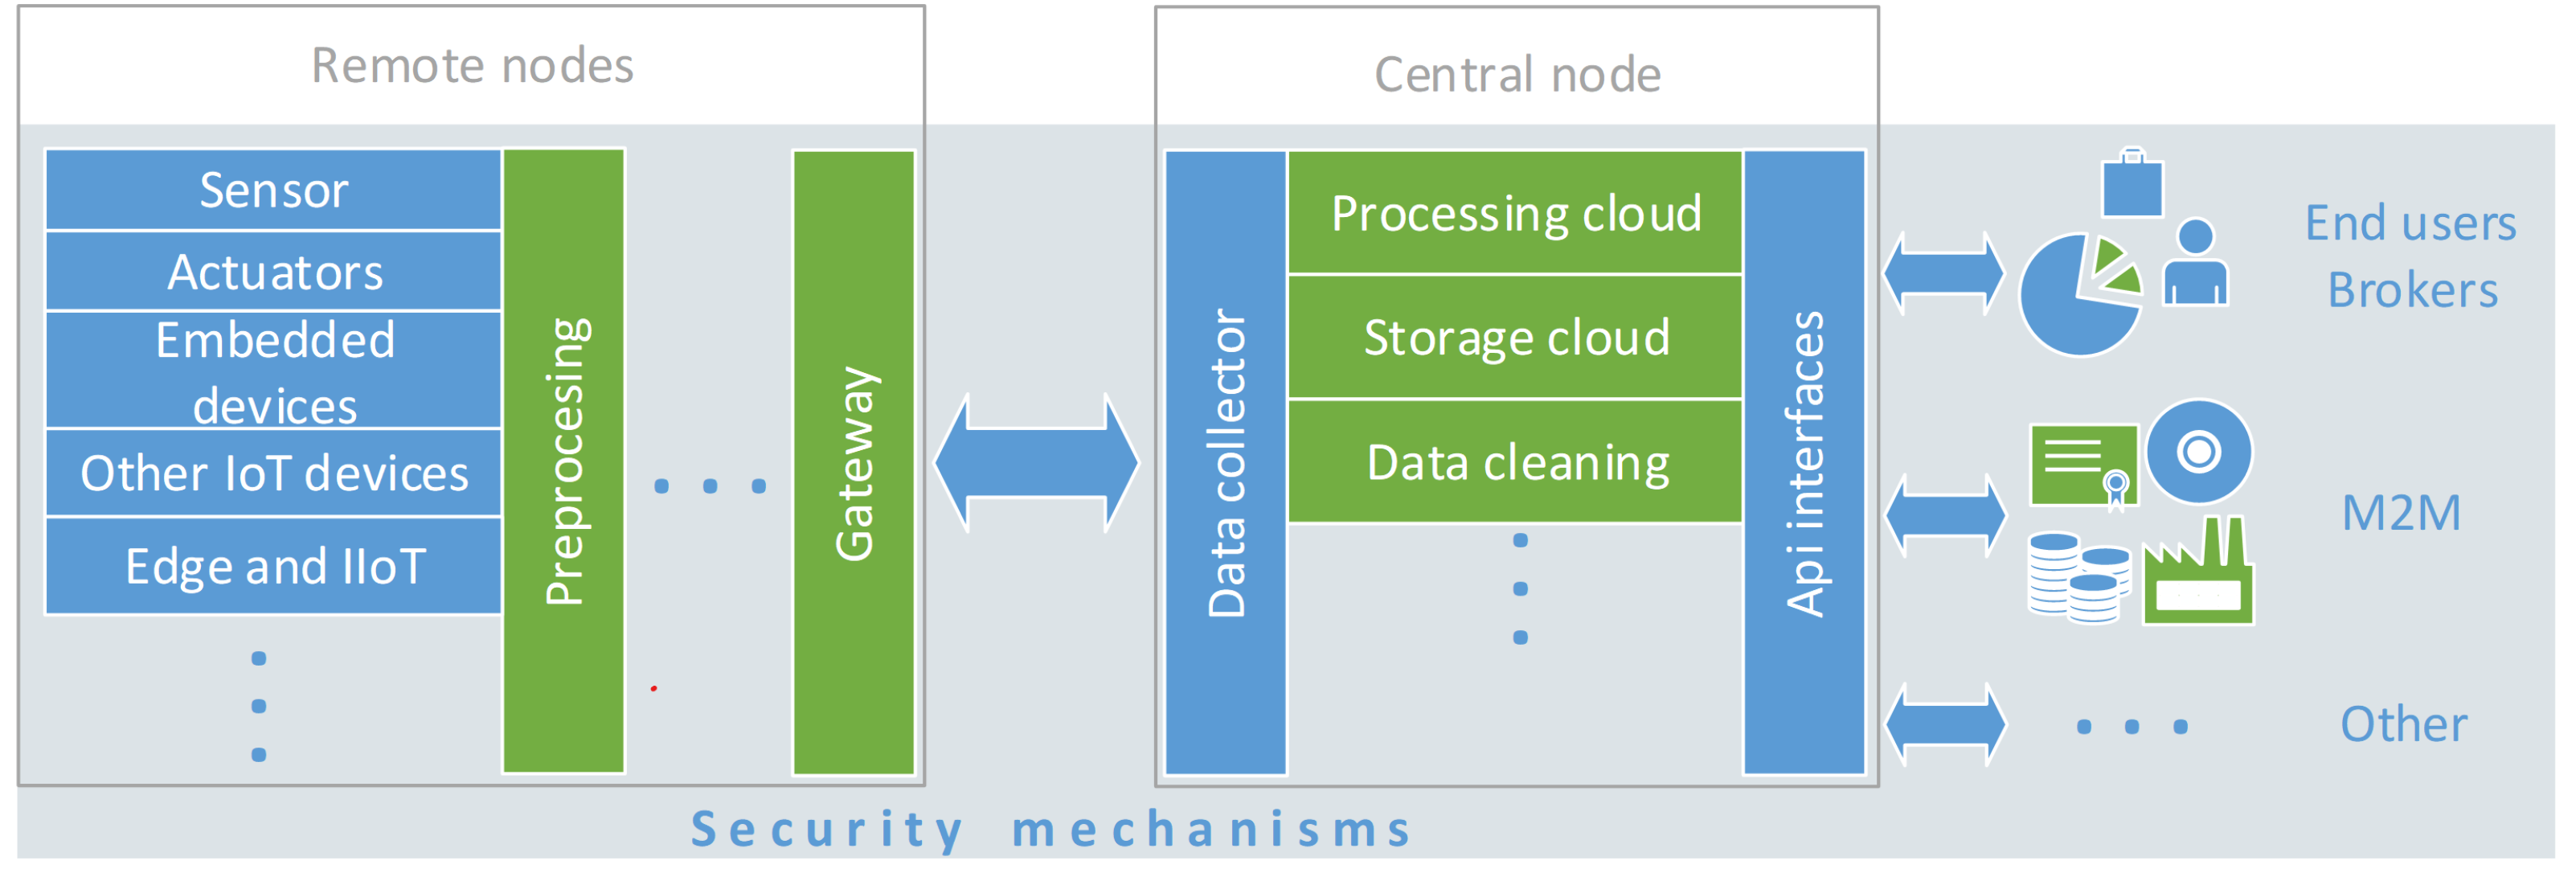
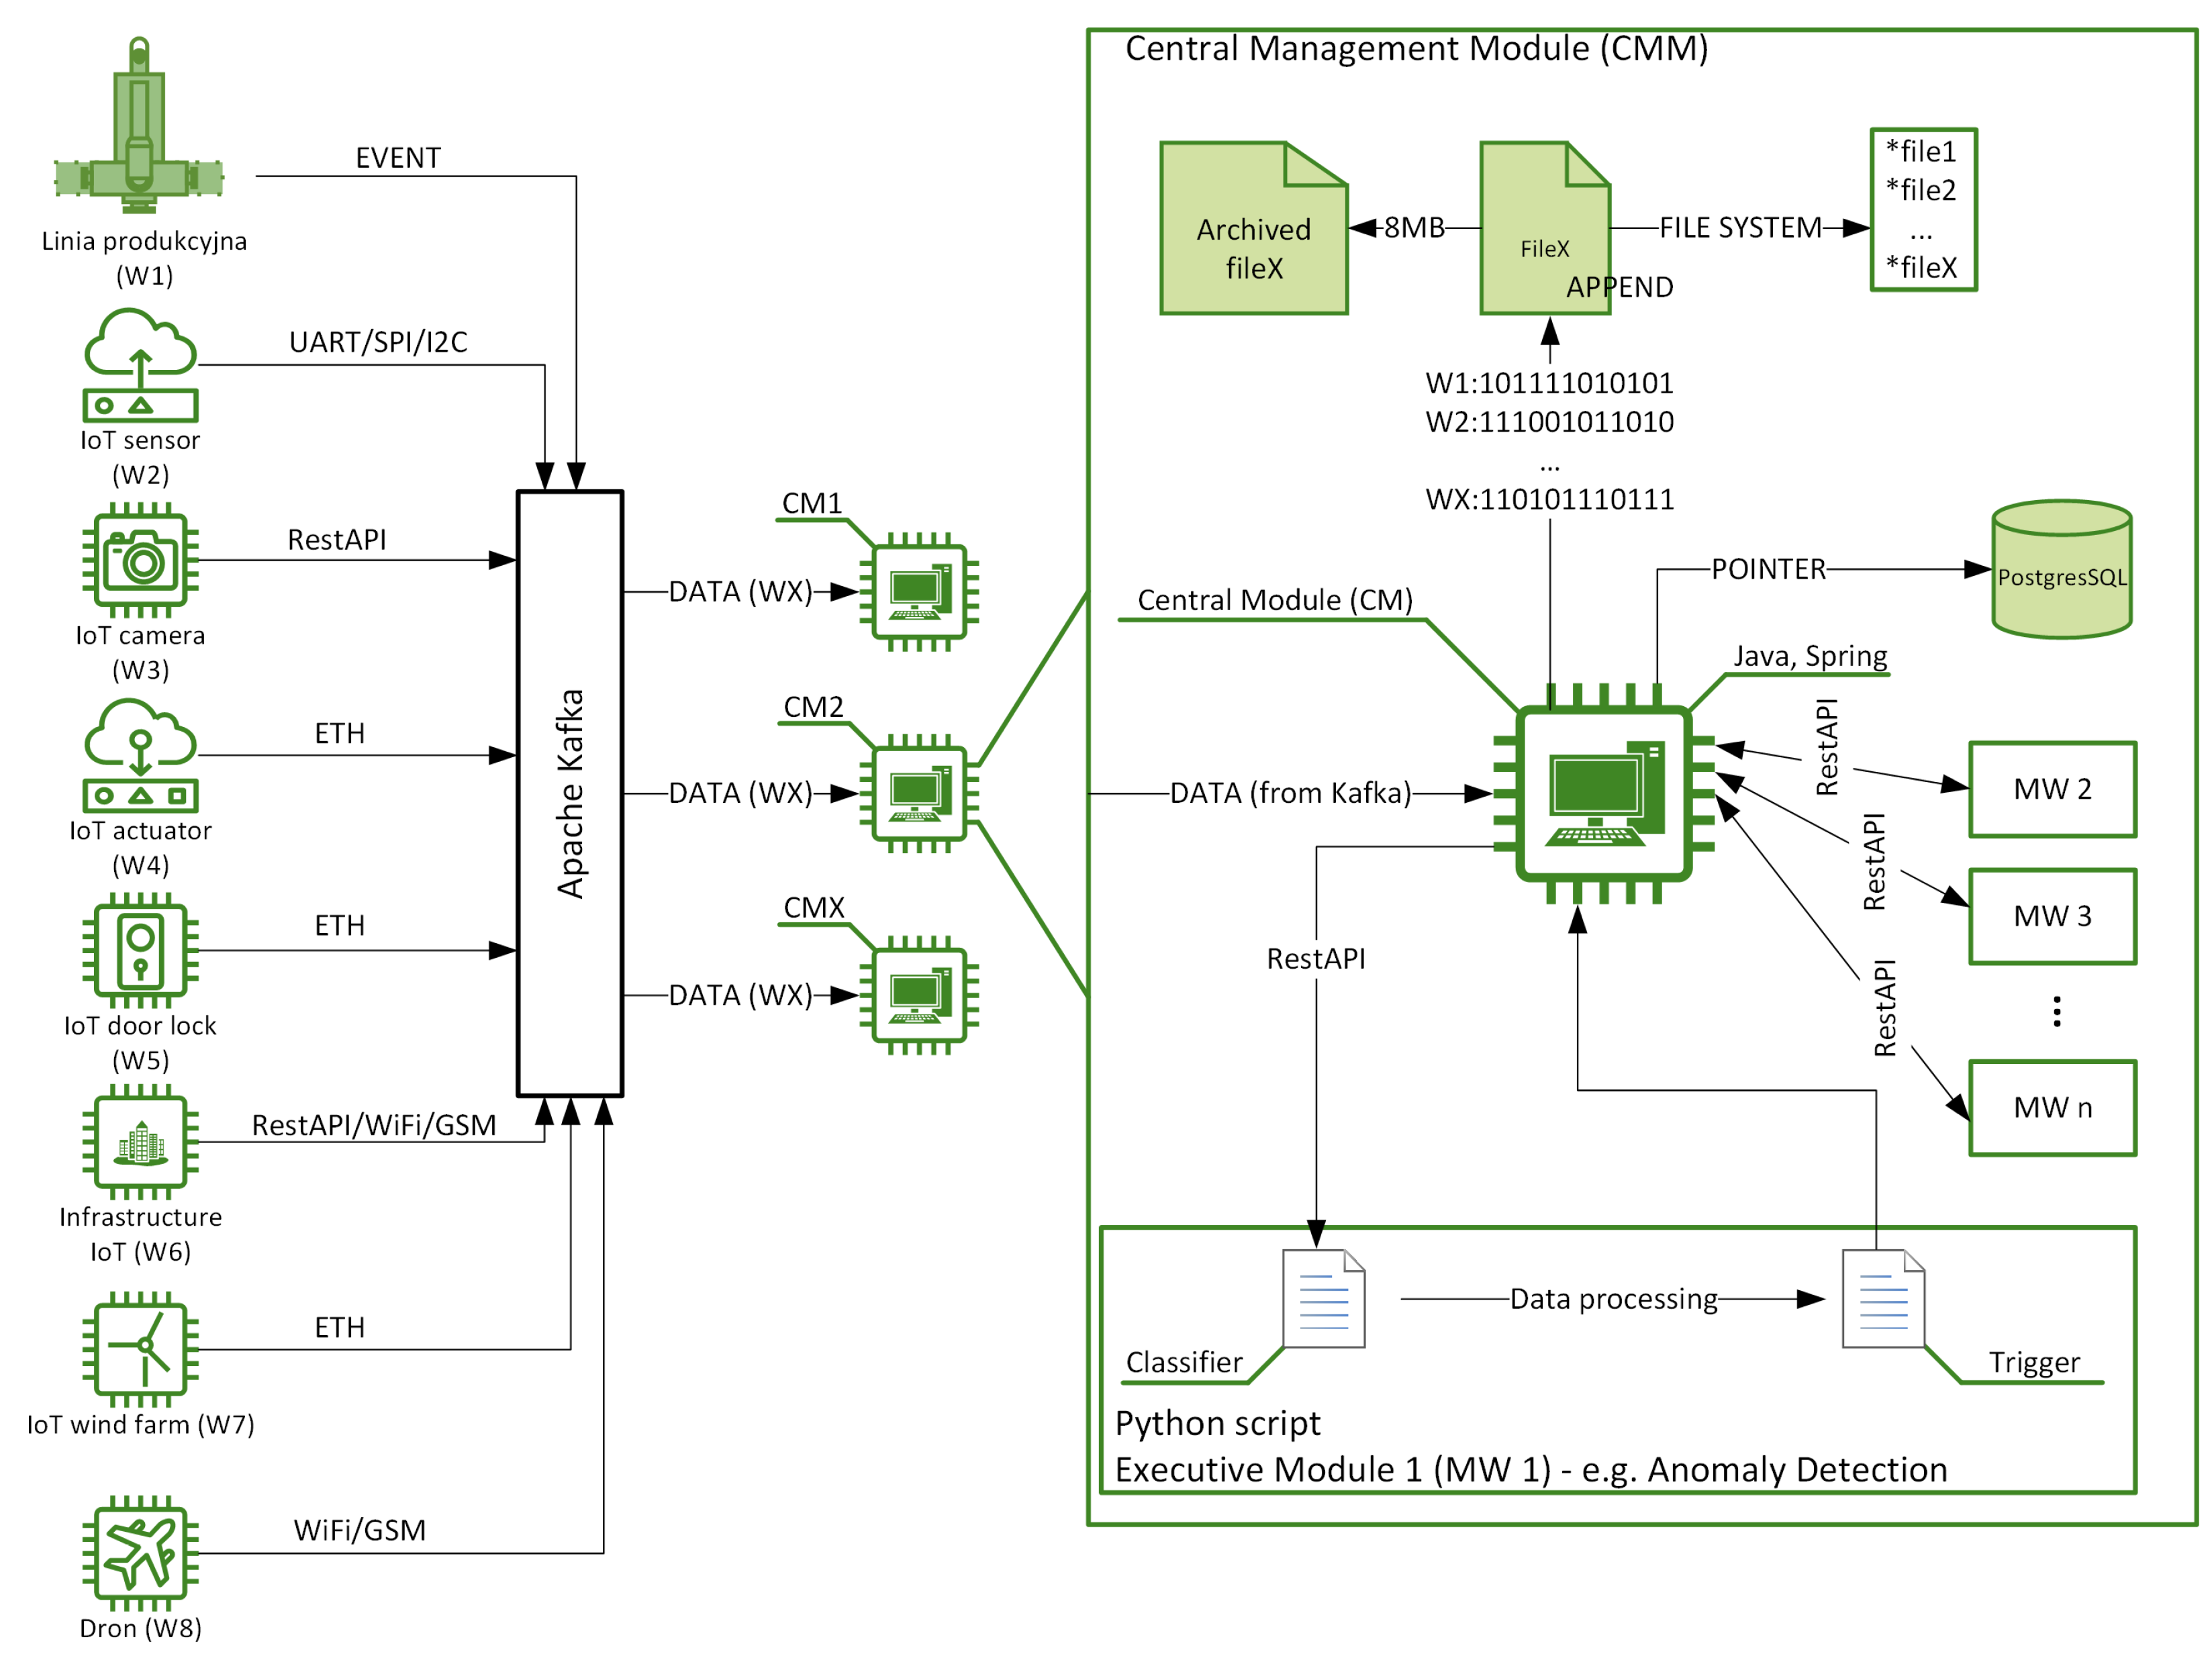
4.1. Assumptions of IoE Data Collection and Processing System: Architecture I

As a part of our research work, we developed a model of the CMM system using the architecture shown in Figure 9.
It should be noted that the architectural elements shown in Figure 9 were implemented in a near-real laboratory environment to determine their suitability for building a system that conforms to the architecture model presented at the beginning of this section. In Figure 9, from the left are shown the systems that are the data producers, i.e., the IoT, IIoT, and Edge, which will be monitored and controlled. They will be integrated with the CMM via Ethernet, WiFi, GSM, and using software communication interfaces (e.g., REST API, GRPC, XML, SNMP, sFLOW). It is also possible to install auxiliary systems directly on a machine or at another industrial facility (e.g., in the form of Edge computing devices). They can play a dual role: to provide a communication interface between the machine and the rest of the system or to provide a platform for implementing specialized control algorithms or anomaly detection. This approach makes it possible to reduce the amount of data sent to the CMM, which, in turn, can significantly reduce the load on the communication channel between the machine and the CMM. In such a dual approach, we will have to deal with two types of communication coming from devices:
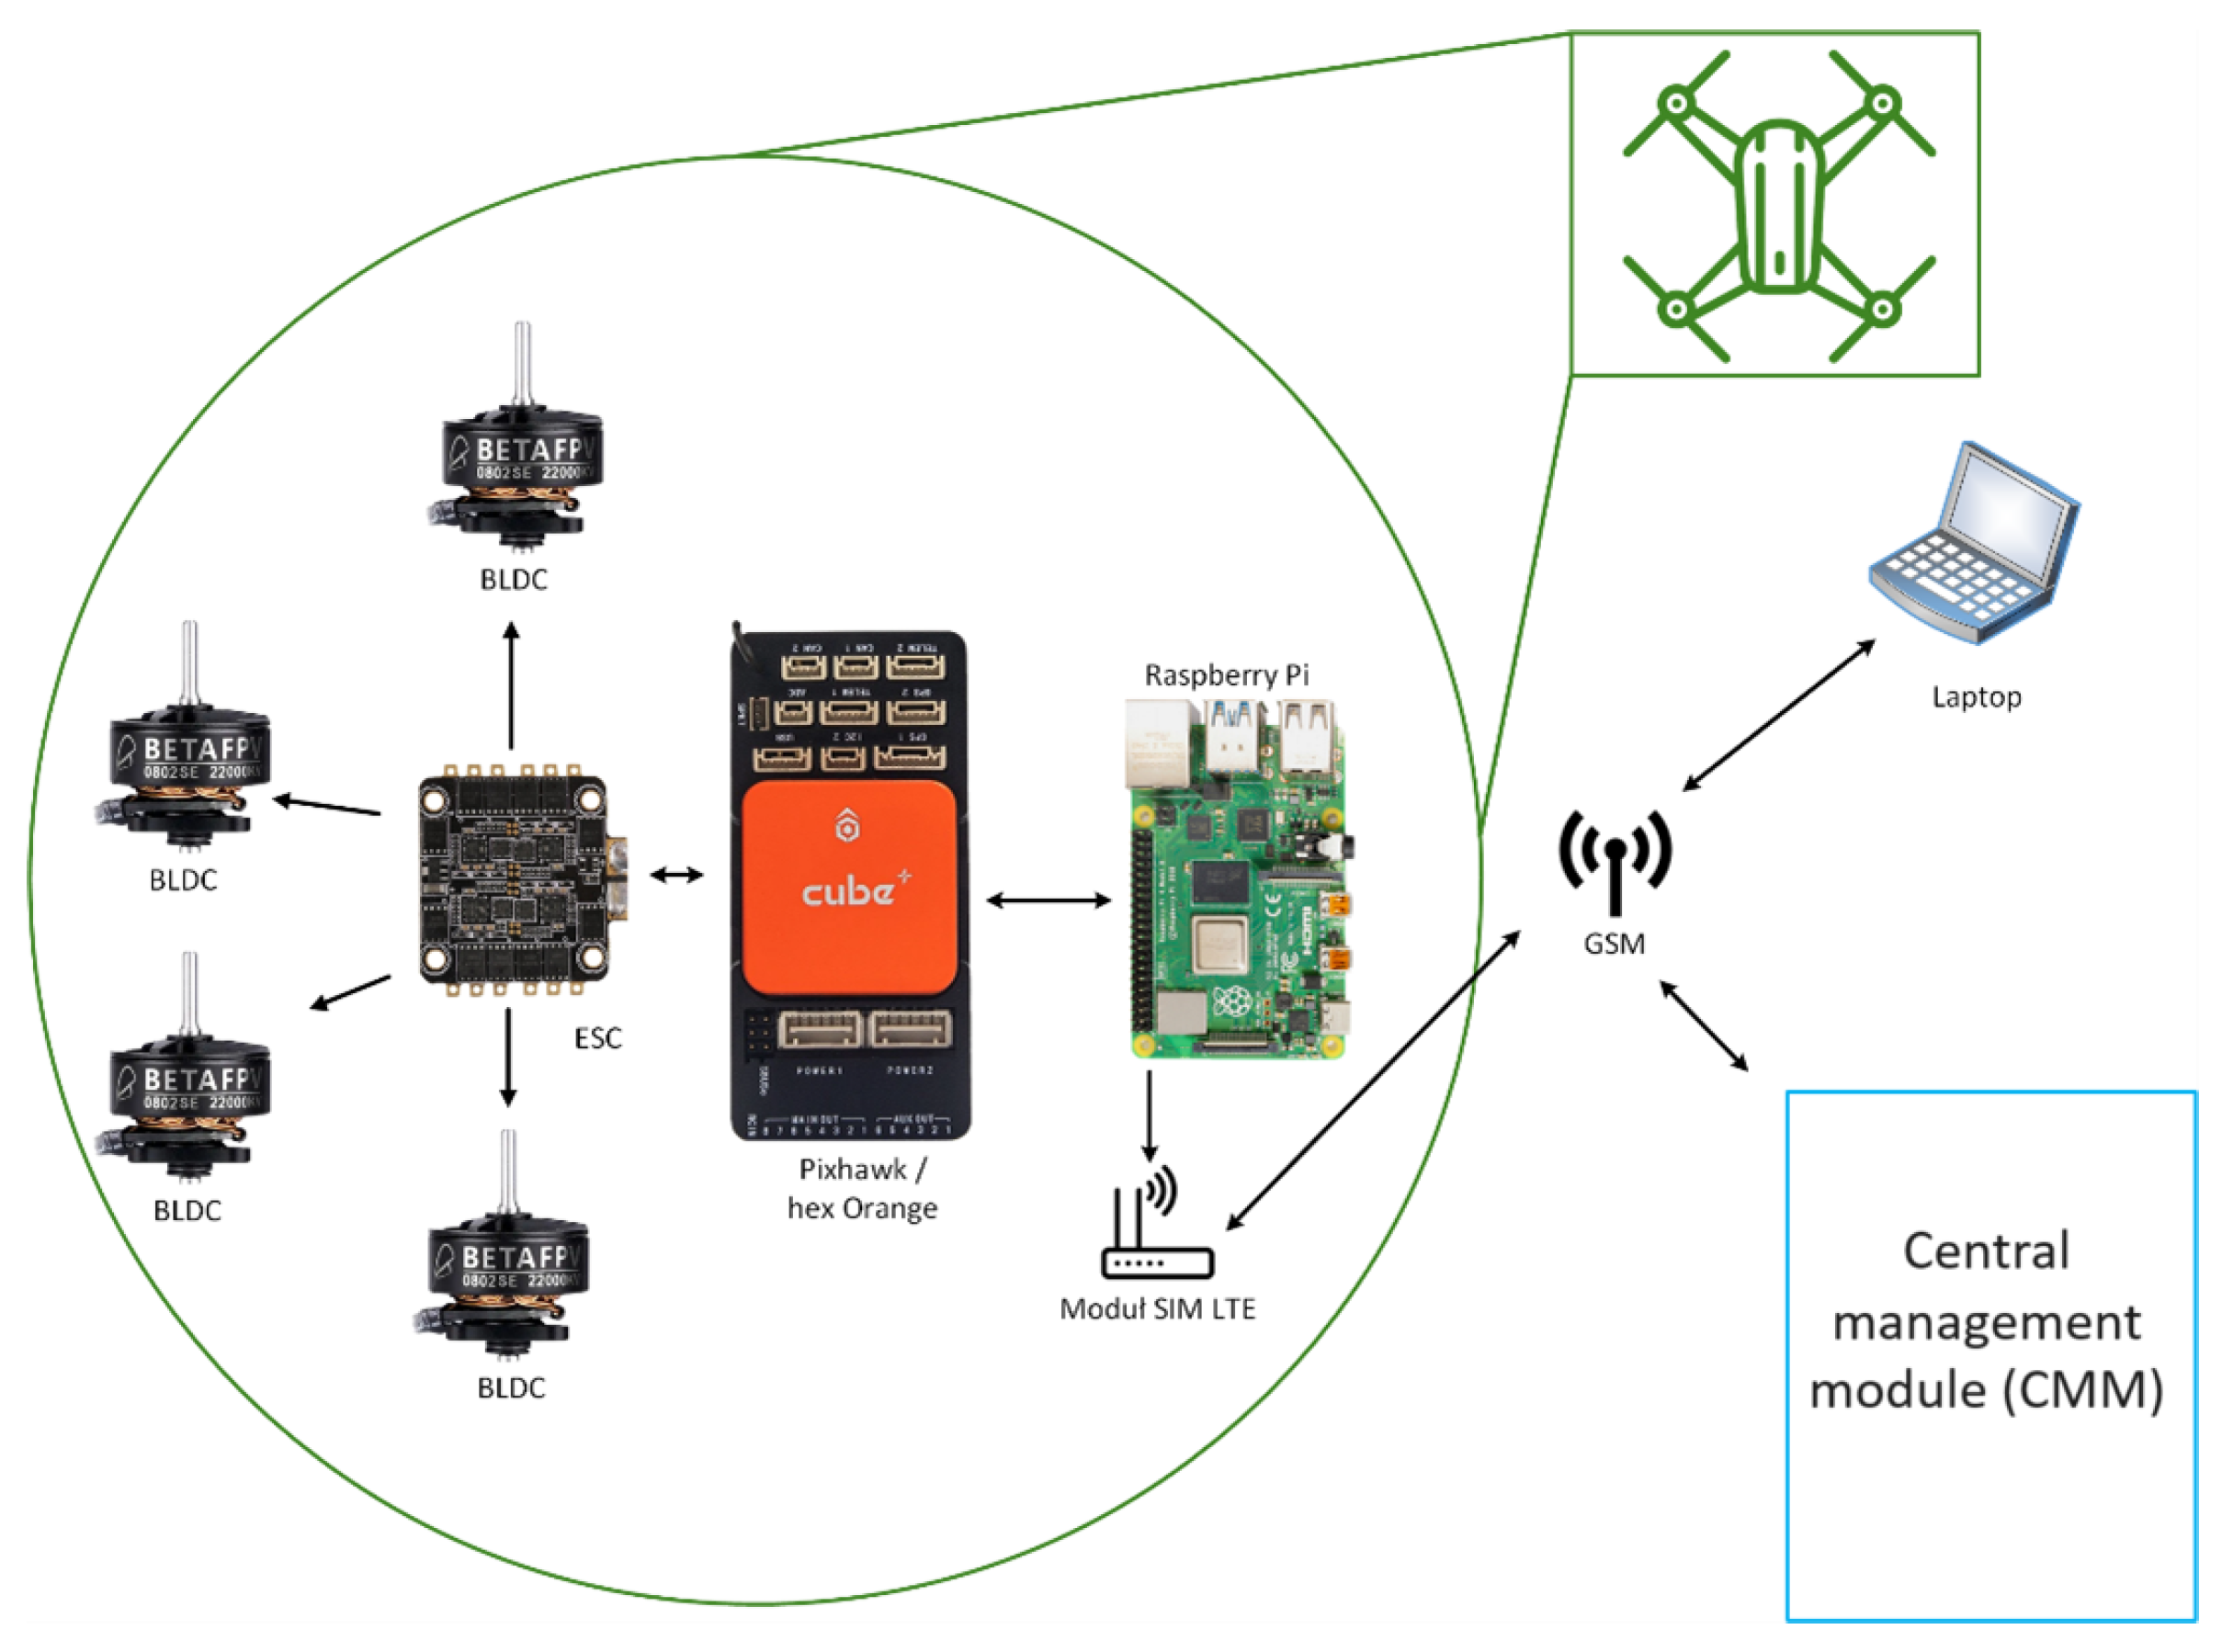
  • Raw data: All data will be sent to the CMM directly from sensors and device elements (input device: WX). Based on this, the CMM inference module will make a decision and treat these data as an input to algorithms.
  • Event data: In this case, on the auxiliary module (W1), the algorithm will be executed using the data obtained from the device, and only the results of the algorithm (events) will be returned to the CMZ in the form of control messages.
The main module of the management system is the Central Module (CM) (the consumer). In the course of performance testing, it turned out to be optimal to use the Java programming language and the Spring design pattern for its construction. The main aspects that were taken into account when choosing this architecture were: the speed of operation of the target module, the cost of its production in man-hours, and the stability of the functioning of the libraries used in relation to the processing of a large number of requests. In the course of the work, an architecture built on the basis of the Python language was also tested—while the stability and overload resistance of this solution was insufficient. The CM system analyzes the transmitted input data and stores them in a database. Originally, only database systems were used in the system for data acquisition. With the increasing number of manufacturer components, this type of approach proved to be inappropriate: it significantly degraded the performance of the entire system. In further work, a hybrid approach was proposed, in which each newly started communication session with the device was written to the PostgreSQL database system, along with a pointer to a file, to which all data transferred within a given communication session were written. When the default file size (in our case, 8 MB) was exceeded, a new file was created for the session, and another entry was added to the database along with a pointer to the correct file. A copy in the form of an archived (gZip) file was also created. It should be noted that the database also stored the timestamp values of the data stored in the file. Connected to the CM module using the REST API is an execution module (MW), which was written in Python. The main task of this module is to acquire data from the file system via the CM and pass it to the execution sub-processes, which can perform a number of functionalities such as classifying data (classifier) and triggering actions based on the classification (trigger). The trigger has access to all historical data stored in the file system. This is particularly important from the point of view of the application of modern inference models based on, i.e., artificial intelligence, since new models can be trained on their basis or new inference rules can be developed. It should be noted that there can be multiple instances (microservices) of the trigger and classifier(s) or multiple execution modules in the system. To integrate external management components, the ReactiveX for Python library was used to create asynchronous and event-based programs using observable sequences and query operators. The ability to use programs written in Python as scripts running on the platform engine will enable the development of the system’s functionality without modifying the data-collection and -preprocessing layer and the need to compile it. This is one of the main features of the platform under development, which will enable its effective implementation in practical solutions.

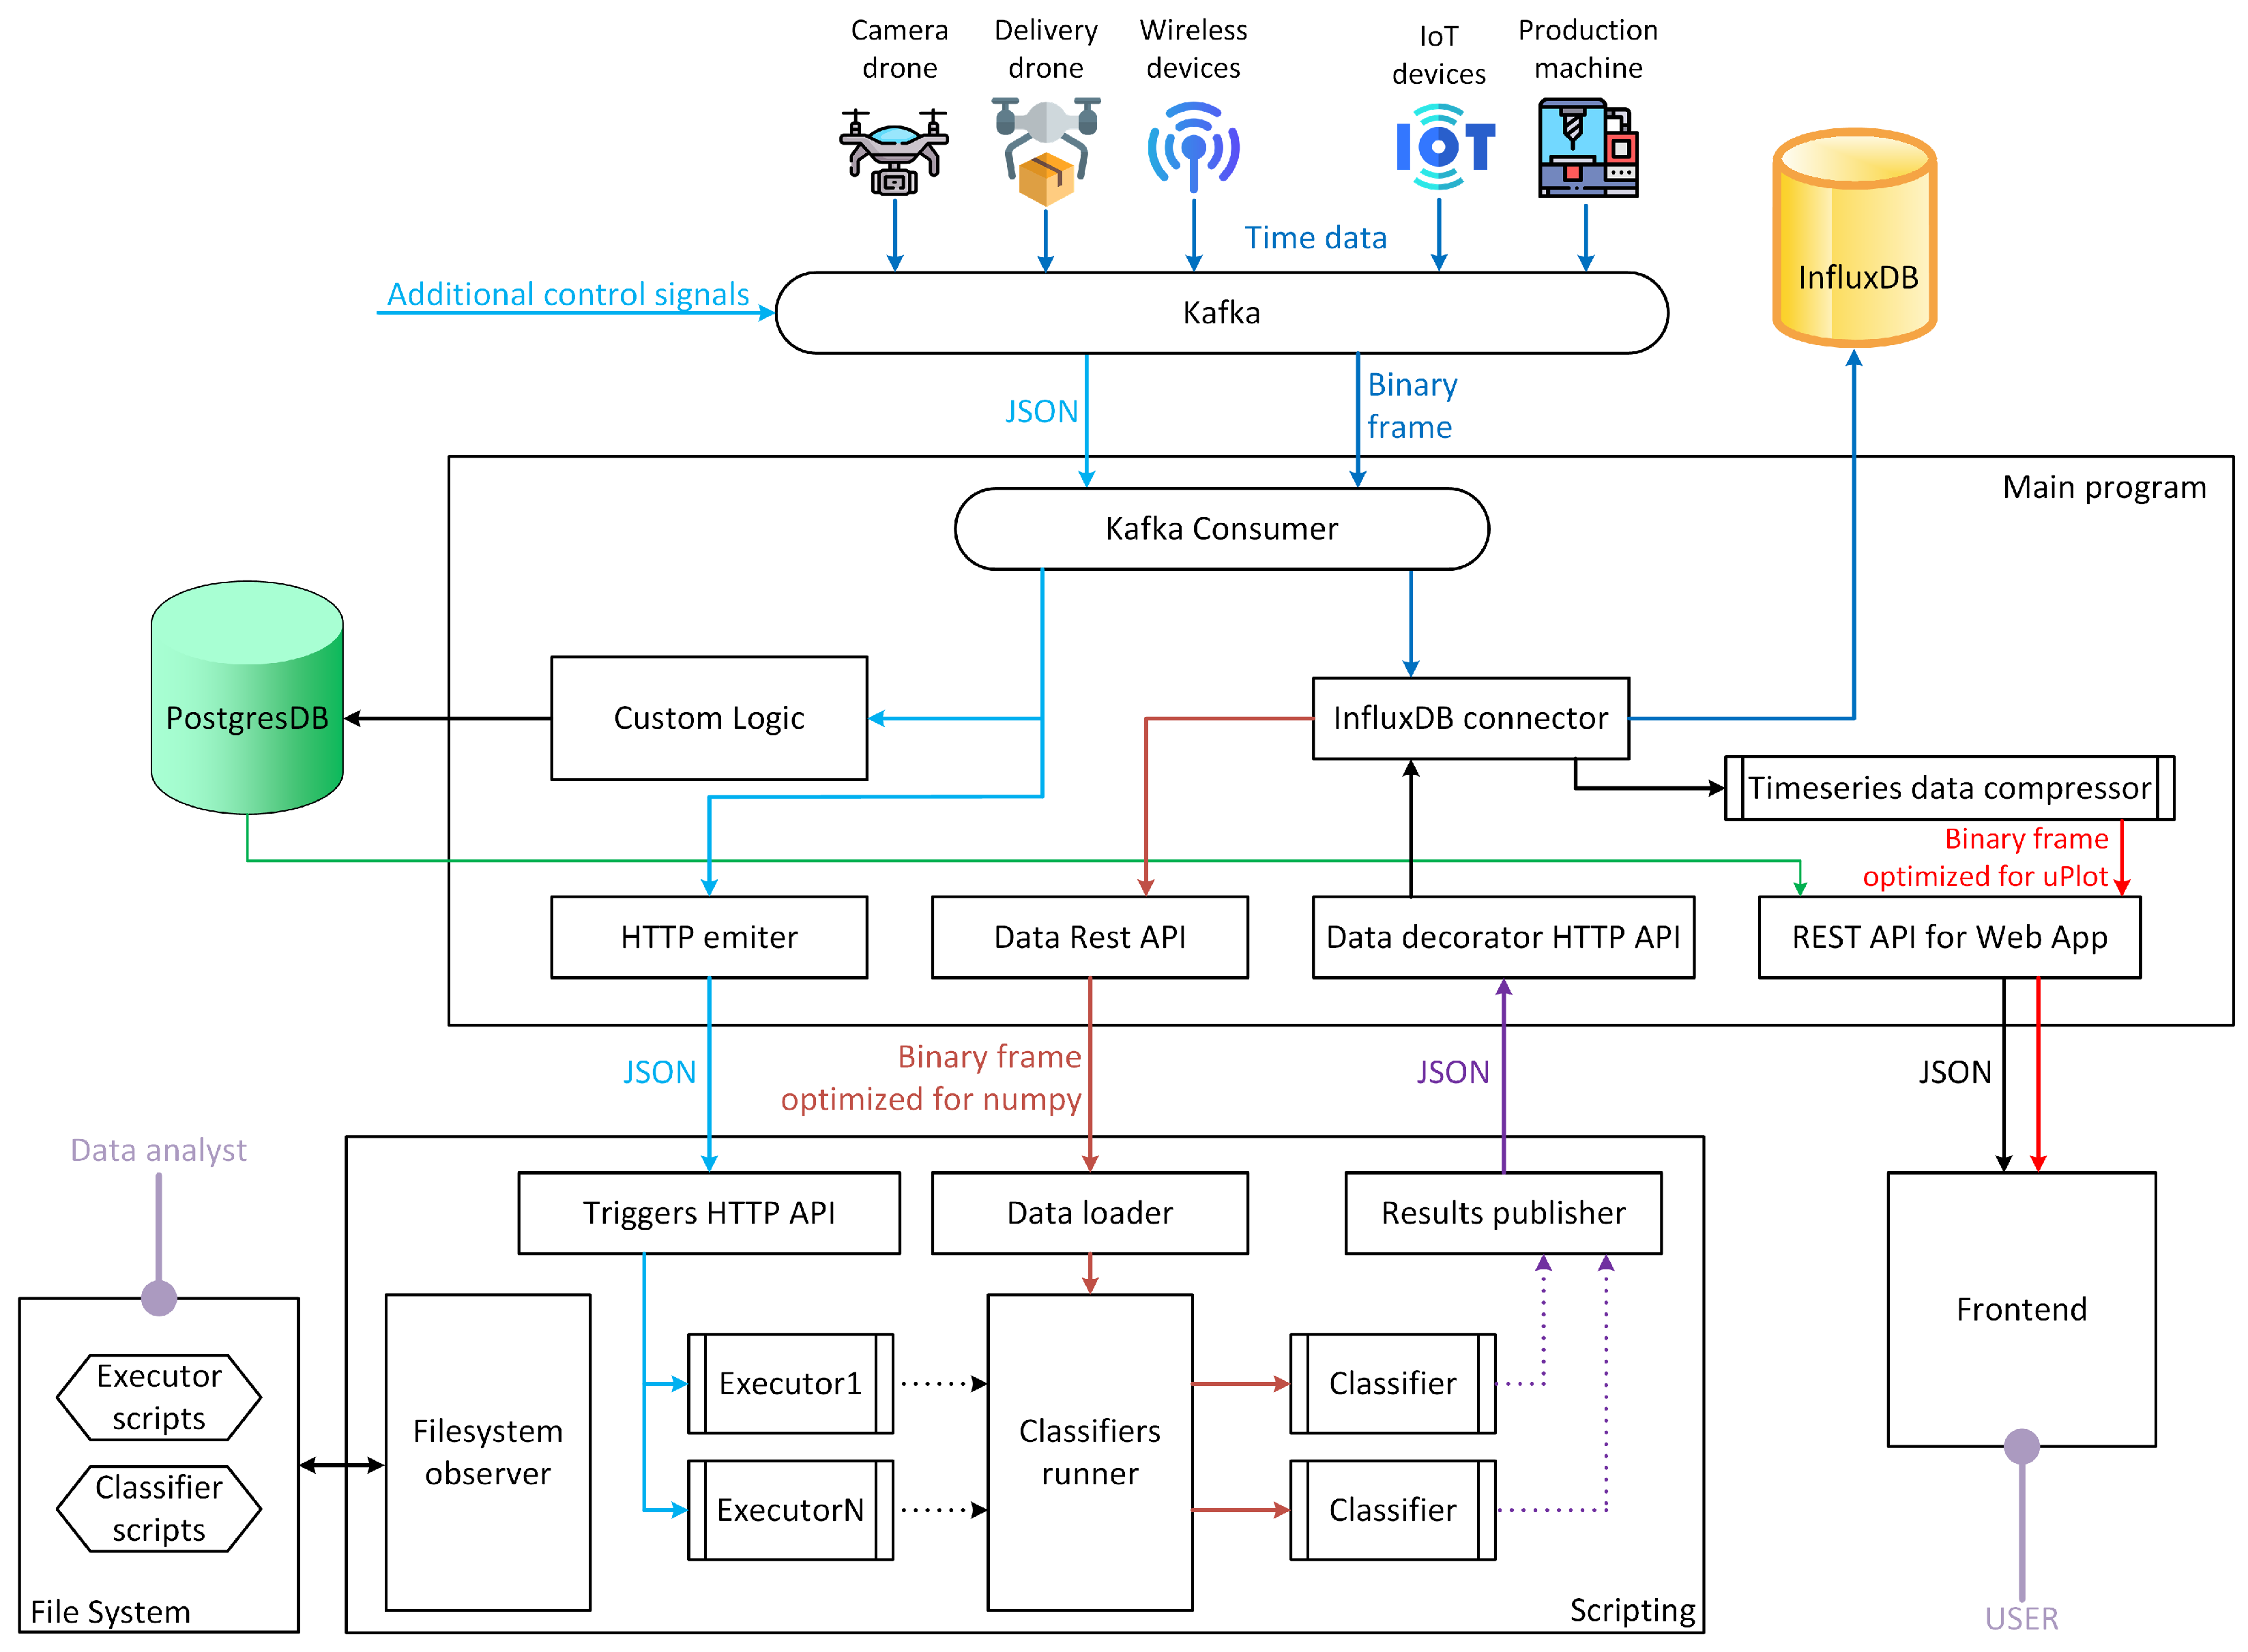
4.2. Assumptions of IoE Data Collection and Processing System: Architecture II

Figure 10 presents the assumptions of the second proposal of the IoE data-collection system architecture, which is consistent with the architectural assumptions presented earlier. The next proposal shows how flexible the proposed model is and how wide of a spectrum of applications it supports. It should be emphasized that, in the proposed approach, the target system architecture can be evolutionarily adapted to the functional requirements (in terms of logically implemented functions and returned information) and adapt to the changing conditions of the implementation environment.
In the proposed architecture, devices via software acting as the Kafka producer can connect to one of Kafka’s nodes and send data with timestamps. In order to optimize the amount of data transmitted, a binary data frame based on a proprietary—maximally simplified—data format was used. This allows devices with low computing capacity to produce and send data to the system. It was assumed that the data would be sent in properly prepared packets. The frame, in addition to the correct headers and control flags, has a timestamp of the first value, the time difference between successive values, and a range of values. When sending binary frames from different platforms, attention was paid to the problems of encoding binary numbers (big-endian and little-endian) and ensuring the consistency of string encoding. On properly segregated and configured topics in the Kafka collector, devices and integrated systems can send additional signals or report events (events), which are processed and stored in the Postgres database. Events can trigger data-analyst-configured actions prepared in Python and can also be used to depict additional information in the end-user application interface. The Apache Kafka system was also indicated as a data collector in the designed architecture. The main tasks of the main program of the designed architecture include:
  • Receiving data from Kafka;
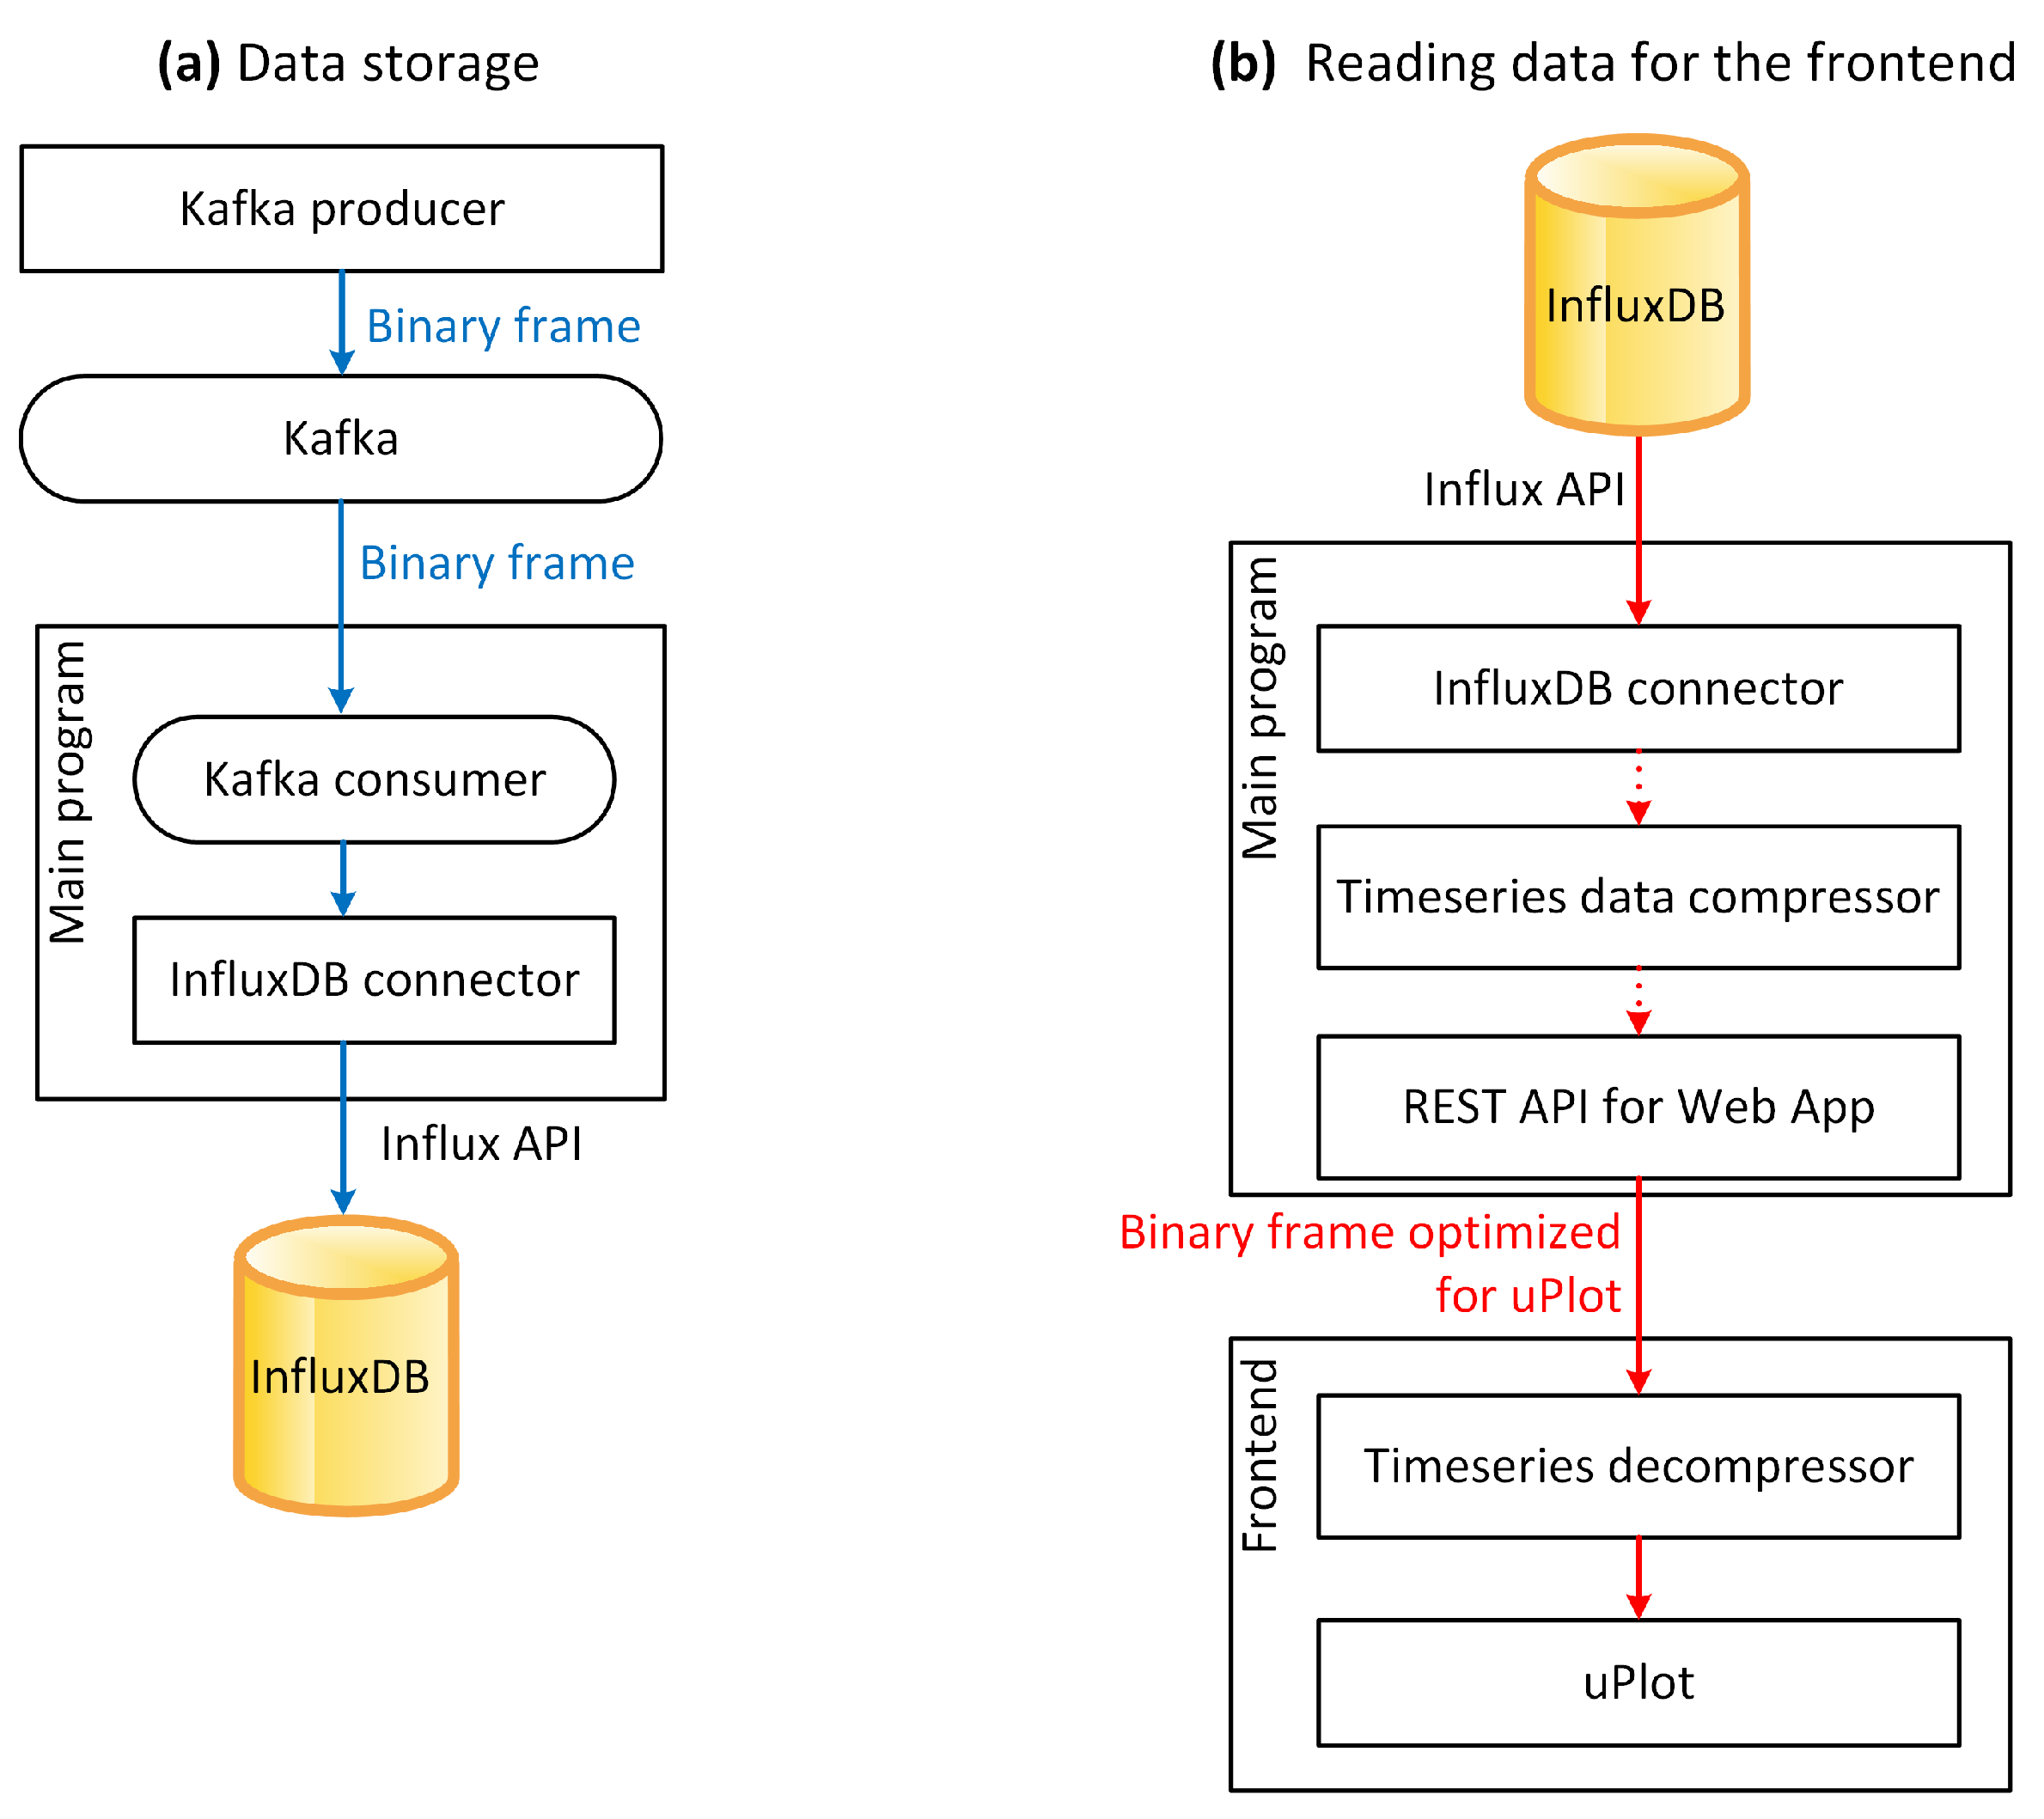
  • Saving data in the database;
  • Frontend sharing;
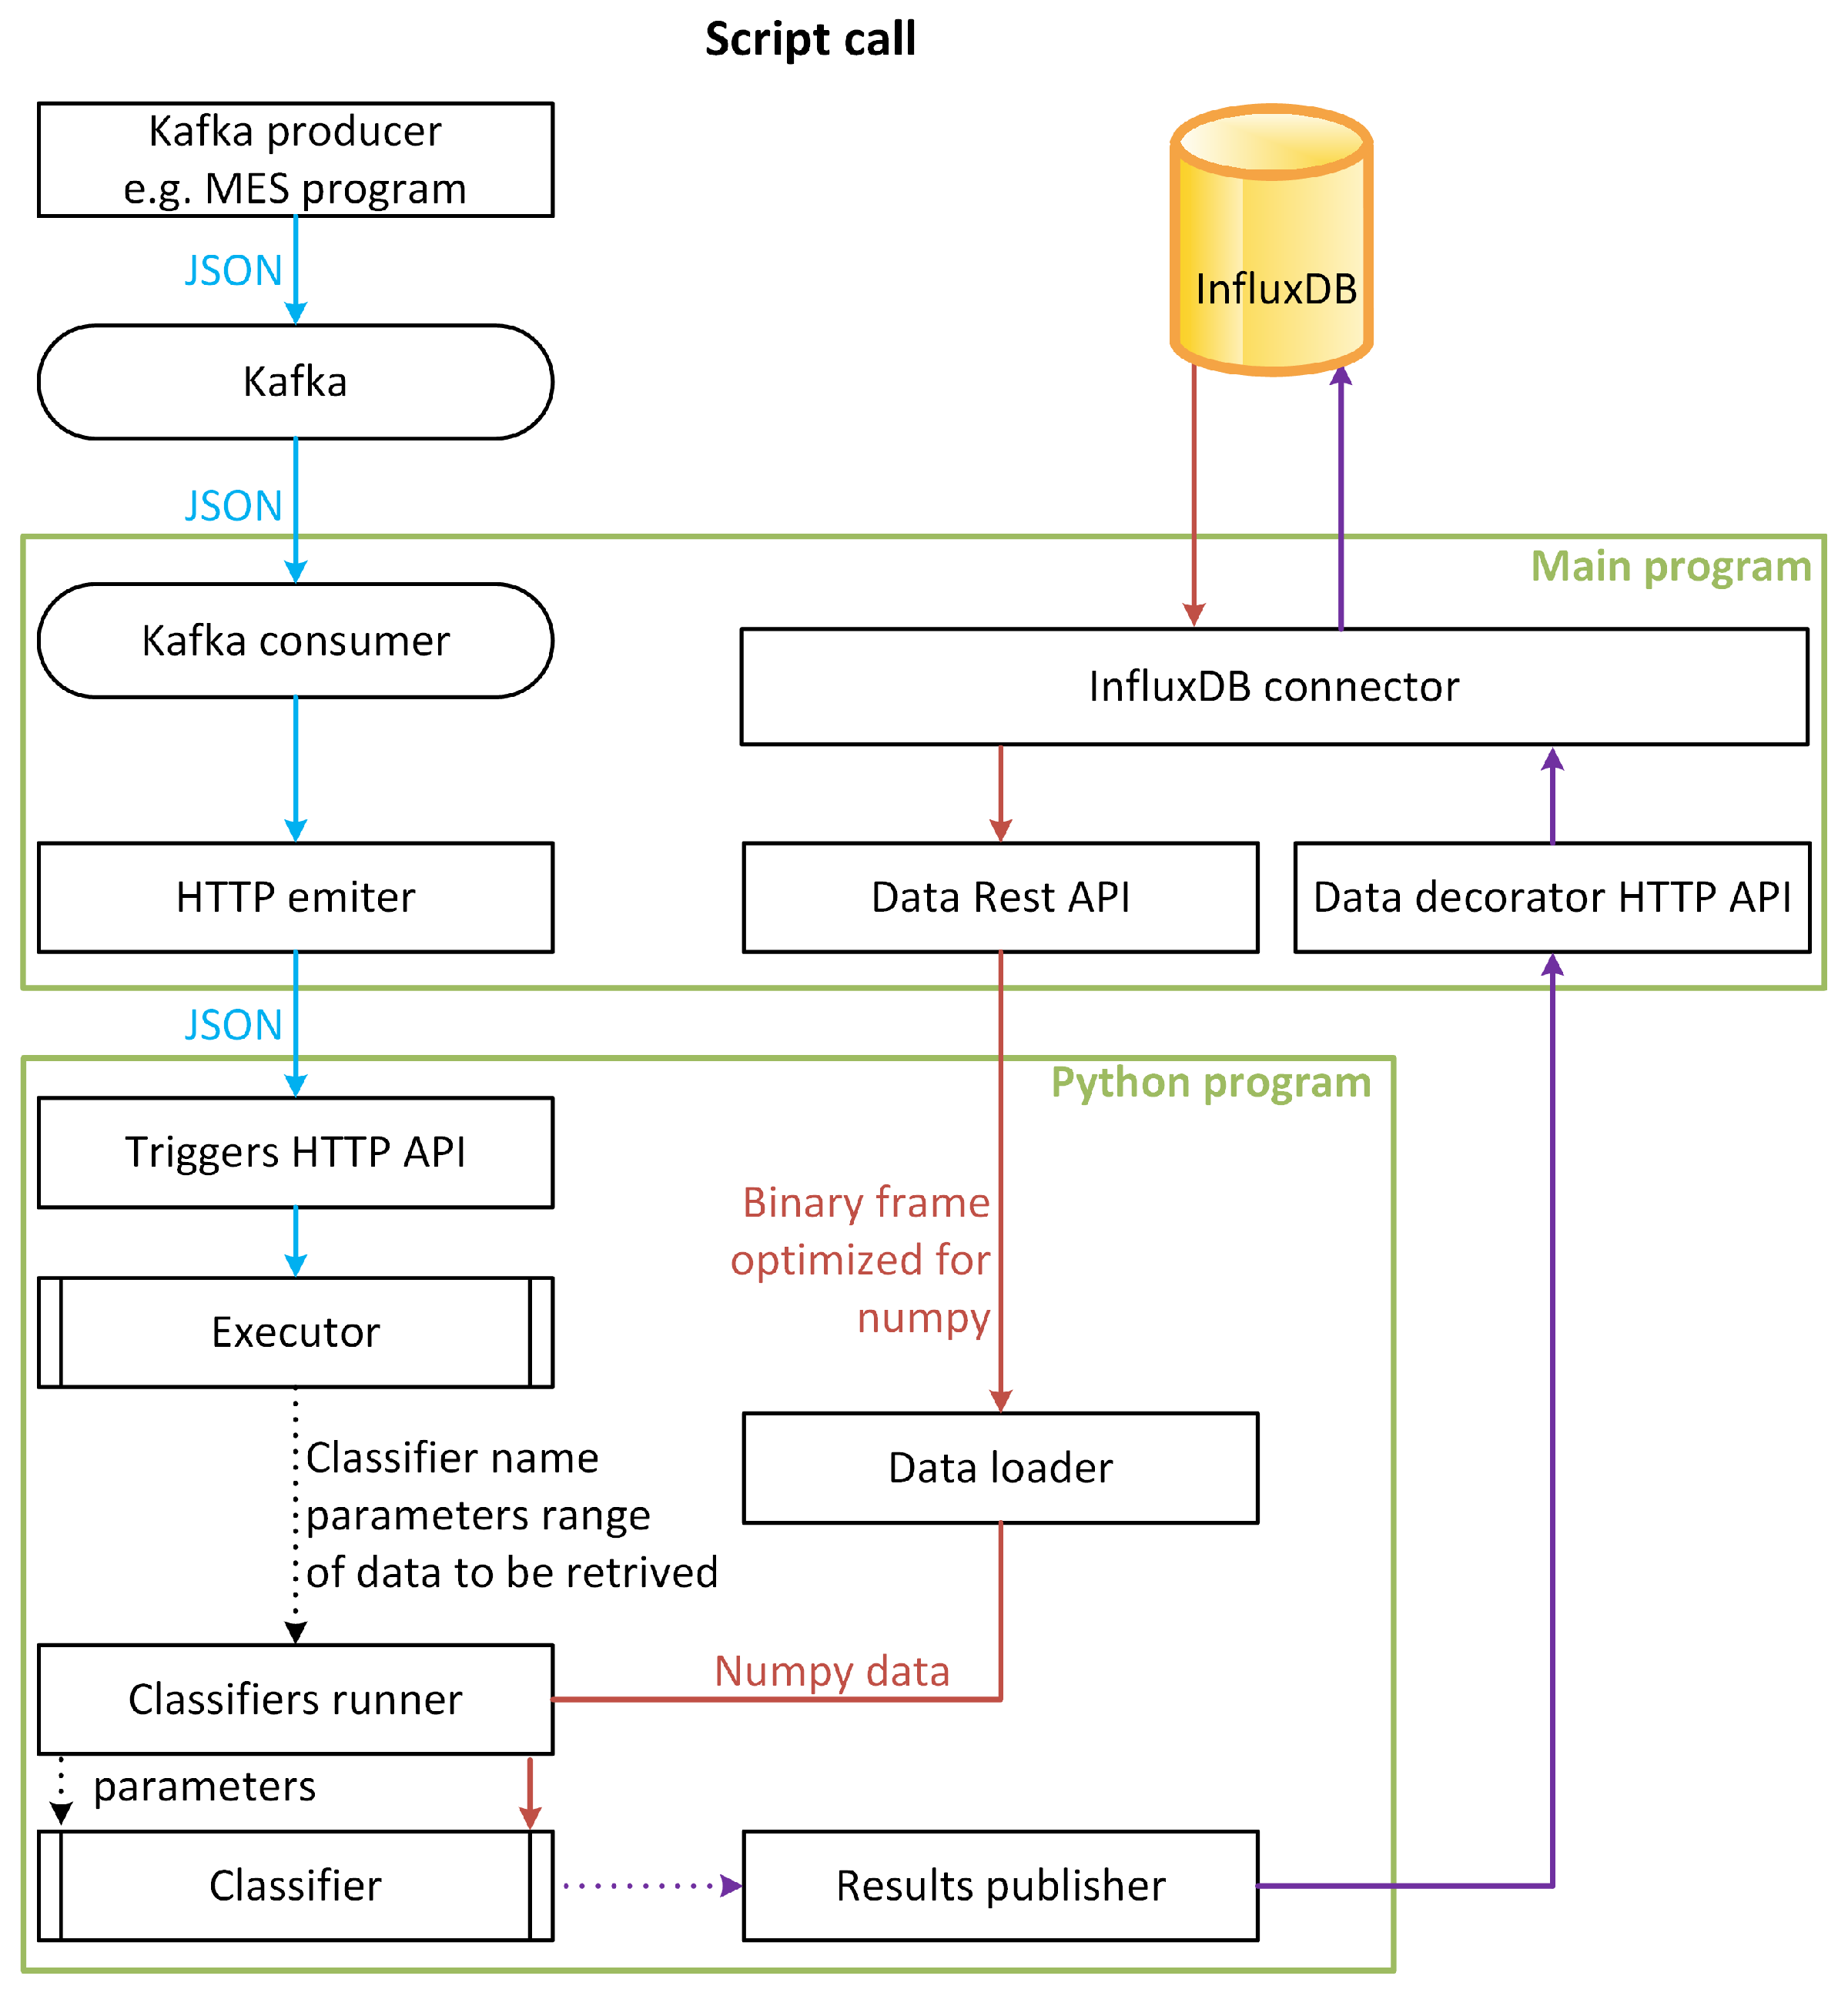
  • Communication with the scripting subsystem;
  • Recording and processing of events.
The main program uses a mechanism for connecting, configuring, and receiving data from various Kafka topics. This module is responsible for verifying and configuring the relevant topics and provides two basic types of consumers—JSON and binary. Data are received multithreaded—with the caveat that time data from one time series cannot be processed in parallel to ensure data chronology and optimize certain algorithms. The received data are transformed into internal structures and directed to the application logic module or to the connector module responsible for data storage. The block diagram of the data storage is shown in Figure 11a.
The official library for Java for connecting to the InfluxDB database was used to build the InfluxDB connector module. This module is responsible for grouping and optimizing the uploaded parcels to the database and providing software interfaces to retrieve data for other modules. Additional application logic will be implemented and built into the application in the form of the custom logic module. In its most-truncated form, it provides a record of events (events) to the Postgres database. It can be responsible for processing and filtering data, cyclic checking of alerts, and exception states. The scripting module was a separate Python program that communicates with the main program via HTTP REST API. The program watches a configured directory where the data analyst can write scripts, which are then loaded and run. The scripts are divided into two types: executor and classifier. Figure 12 represents the procedure for calling a script. The script written by the analyst, once loaded, is run in an async loop. To each executor, as the input signals, are passed all events (events) received by the REST API from the main program. The executor has the task, based on the input signals, to decide whether and when to run a given classifier and return information on what timing data to provide. As a base library for handling and observing events (events), the ReactiveX for Python library was used, which is more widely known from the JavaScript version and widely used, for example, in Angular.
In case any of the executors decides to call a particular classifier, the intermediary module—classifiers runner—fetches the required time data via the HTTP API via the main program from the Influx database. In order to optimize the processing of large data series in Python, it was proposed that the time data should not be stored in the classic lists of the Python program. In the main program, the data REST API module additionally encodes the time series and sends it in a binary frame so that the Python program can, by reading the received frame, write the data directly into NumPy library structures. What libraries and what kind of algorithms are used in the classifier is up to the programmer/analyst. Each call to the classifier is executed on a separate thread. Scripting provides a limited number of threads and a ThreadPool mechanism along with task queuing in case there are more classifiers to run than free threads. The output of the classifier is annotated with time flags to specific the time data in JSON form, which is stored in InfluxDB via an API.
It is intended that the system has a web layer where users can browse the stored time data and tables consisting of event data (events) stored in a Postgres database. The key functionality is the upload, display, and charting mechanism for viewing the time data. In this case, it is recommended to use a small uPlot library (see Figure 11b). The standard approach to data retrieval of downloading data in text format, such as JSON in the case of large amounts of data, is inefficient and causes heavy network load. A solution to help optimize the retrieval of temporal data is to use binary frames and pre-prepare (already in the backend) the data for the uPlot library, so that the browser does not have to process the data in the final format.
The technology stack model proposed in this section, combined with the developed layered model of data collection and processing for the IoE computer system architecture, provides a design pattern around which distributed IoE systems of various sizes and purposes can be built. A design approach using this pattern helps to organize the work-planning process and highlights the technological aspects that must be considered at the design stage of this class of systems. The range of technologies identified in this way will allow for the appropriate decomposition of the design task, the division of work, and the alignment of the processes involved in the creation of individual system components. In addition to developing a model of the technology stack for the designed architecture, the assumptions of the architecture for data acquisition, collection, and processing were proposed. During the research work, proposals for two architectures were developed: I was optimized for processing large data sets centrally, in a specially designed data storage system; II was optimized for initial distributed data processing and the easy implementation of client analytical algorithms. The work carried out by the research team had an evolving nature, i.e., the authors continuously verified the theses and tested selected components of the developed architecture in a laboratory environment with the help of the developed prototypes. The large number of experiments carried out made it possible to propose two implementation architectures; with further stages of the research work, Architecture II was implemented due to the greater possibility of integrating this approach with those developed by the authors under the RID project [39] inference and anomaly-detection algorithms.

5. Implementation of the System and Discussion of the Results Obtained

The target system was implemented in a container environment based on Docker. Some of the modules functioning within each container were implemented and created as proprietary programs, and some were properly configured open-source tools combined into a coherent whole. The most-important services of the system included:
  • NodeRED allows graphically creating input data flows and enables integration with various sources. The main task of the service is to retrieve data from an IoT device and send them to Kafka.
  • A functionality that gives the ability to simply send data to the system via standard HTTP requests.
  • Kafka is a service used to temporarily store and queue data from various data sources.
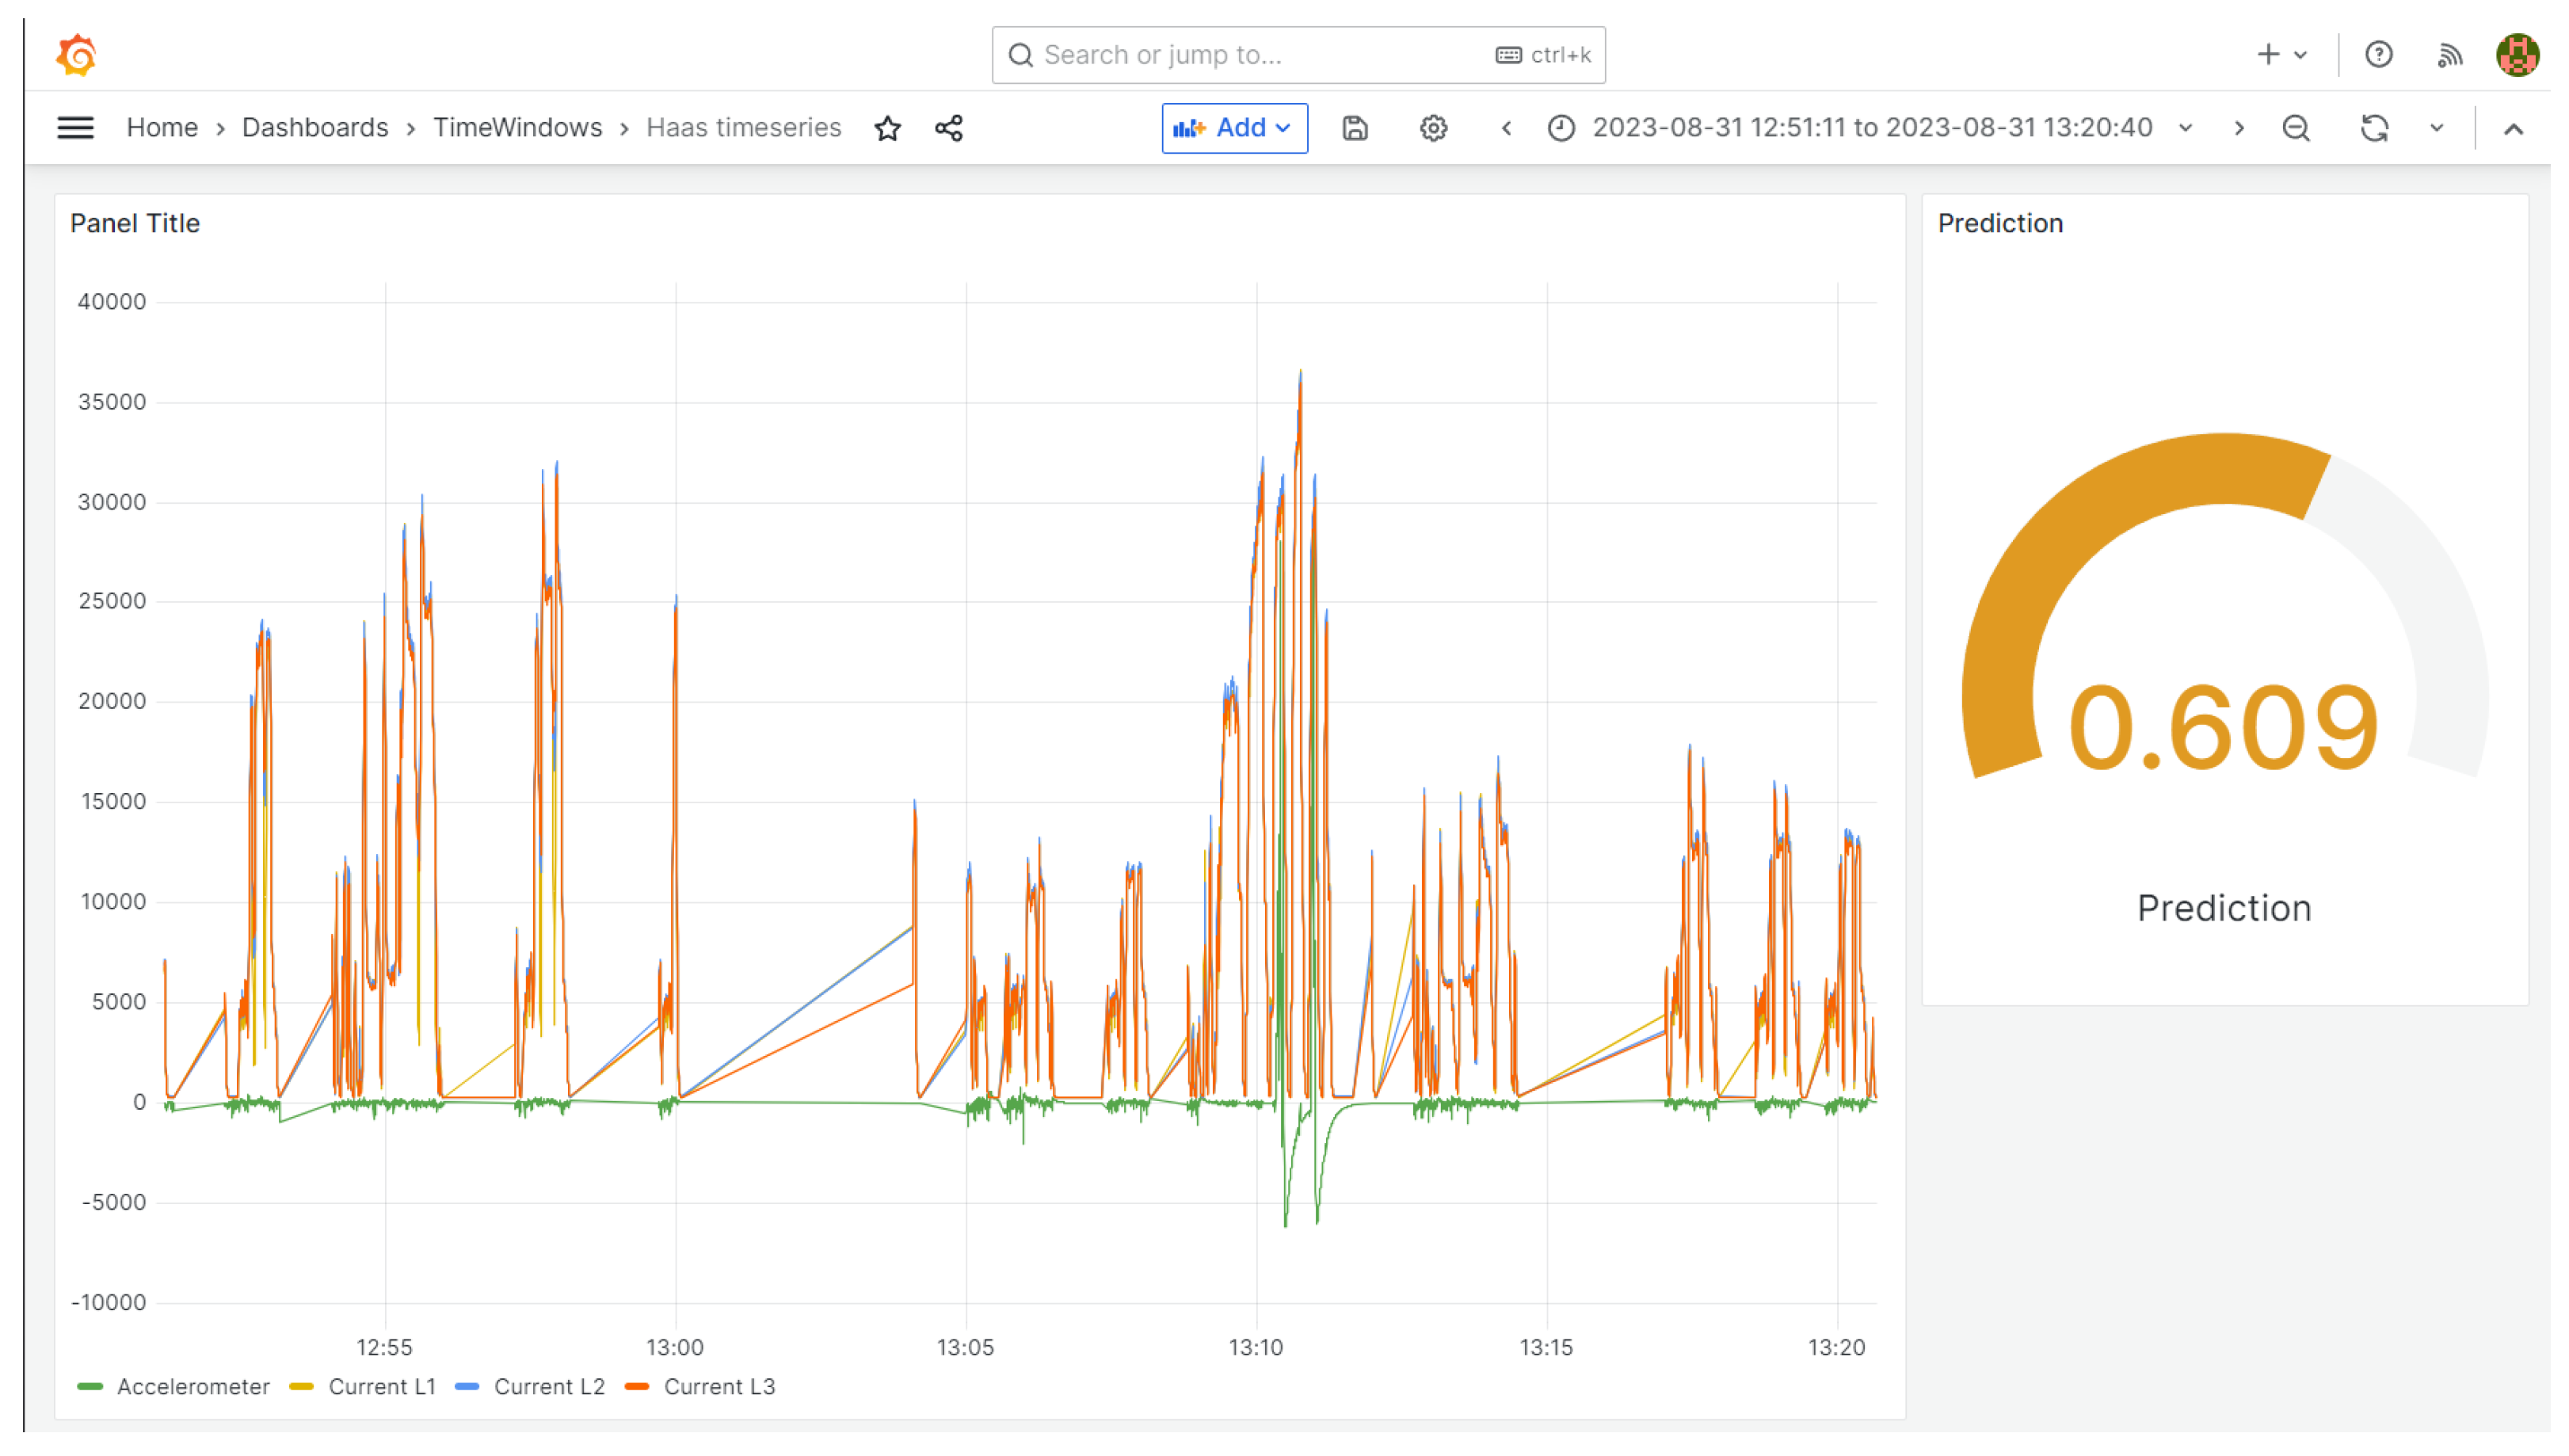
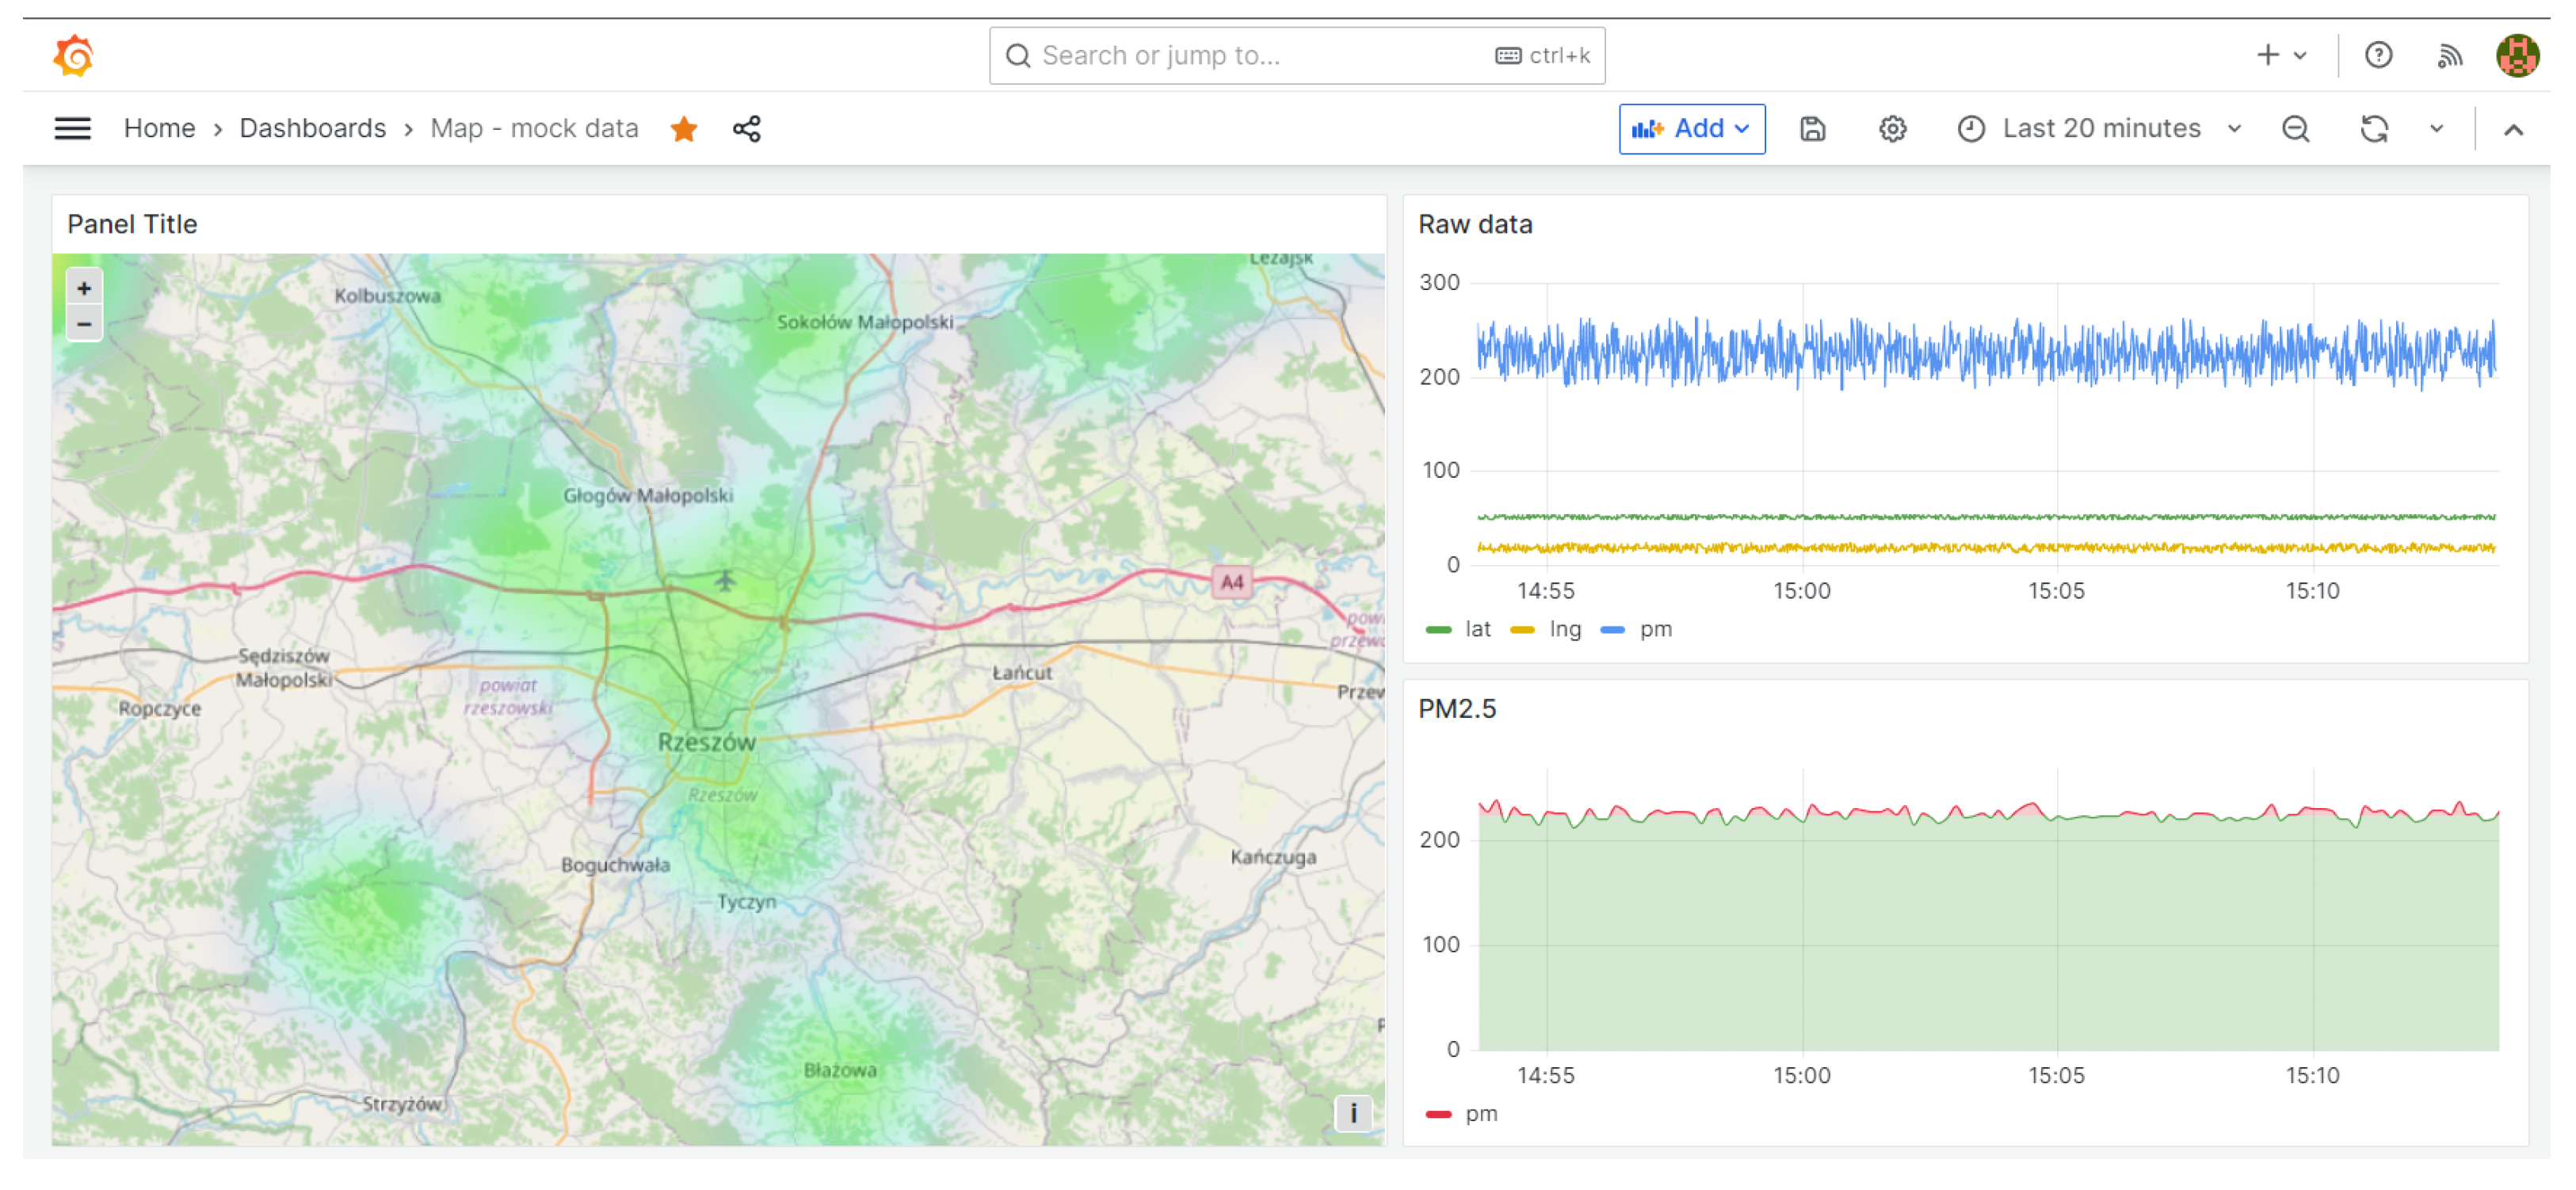
  • InfluxDB is a popular database specifically optimized for storing time series data, chosen for its high schema flexibility and additional calculation functionality for time series runs. In addition, this system has its own interface, which allows displaying data in graphs, which enables viewing all stored data quickly.
  • Kafka Consumer for InfluxDB is designed to retrieve data from relevant Kafka topics, manage database connections, and for optimization, send data in batches.
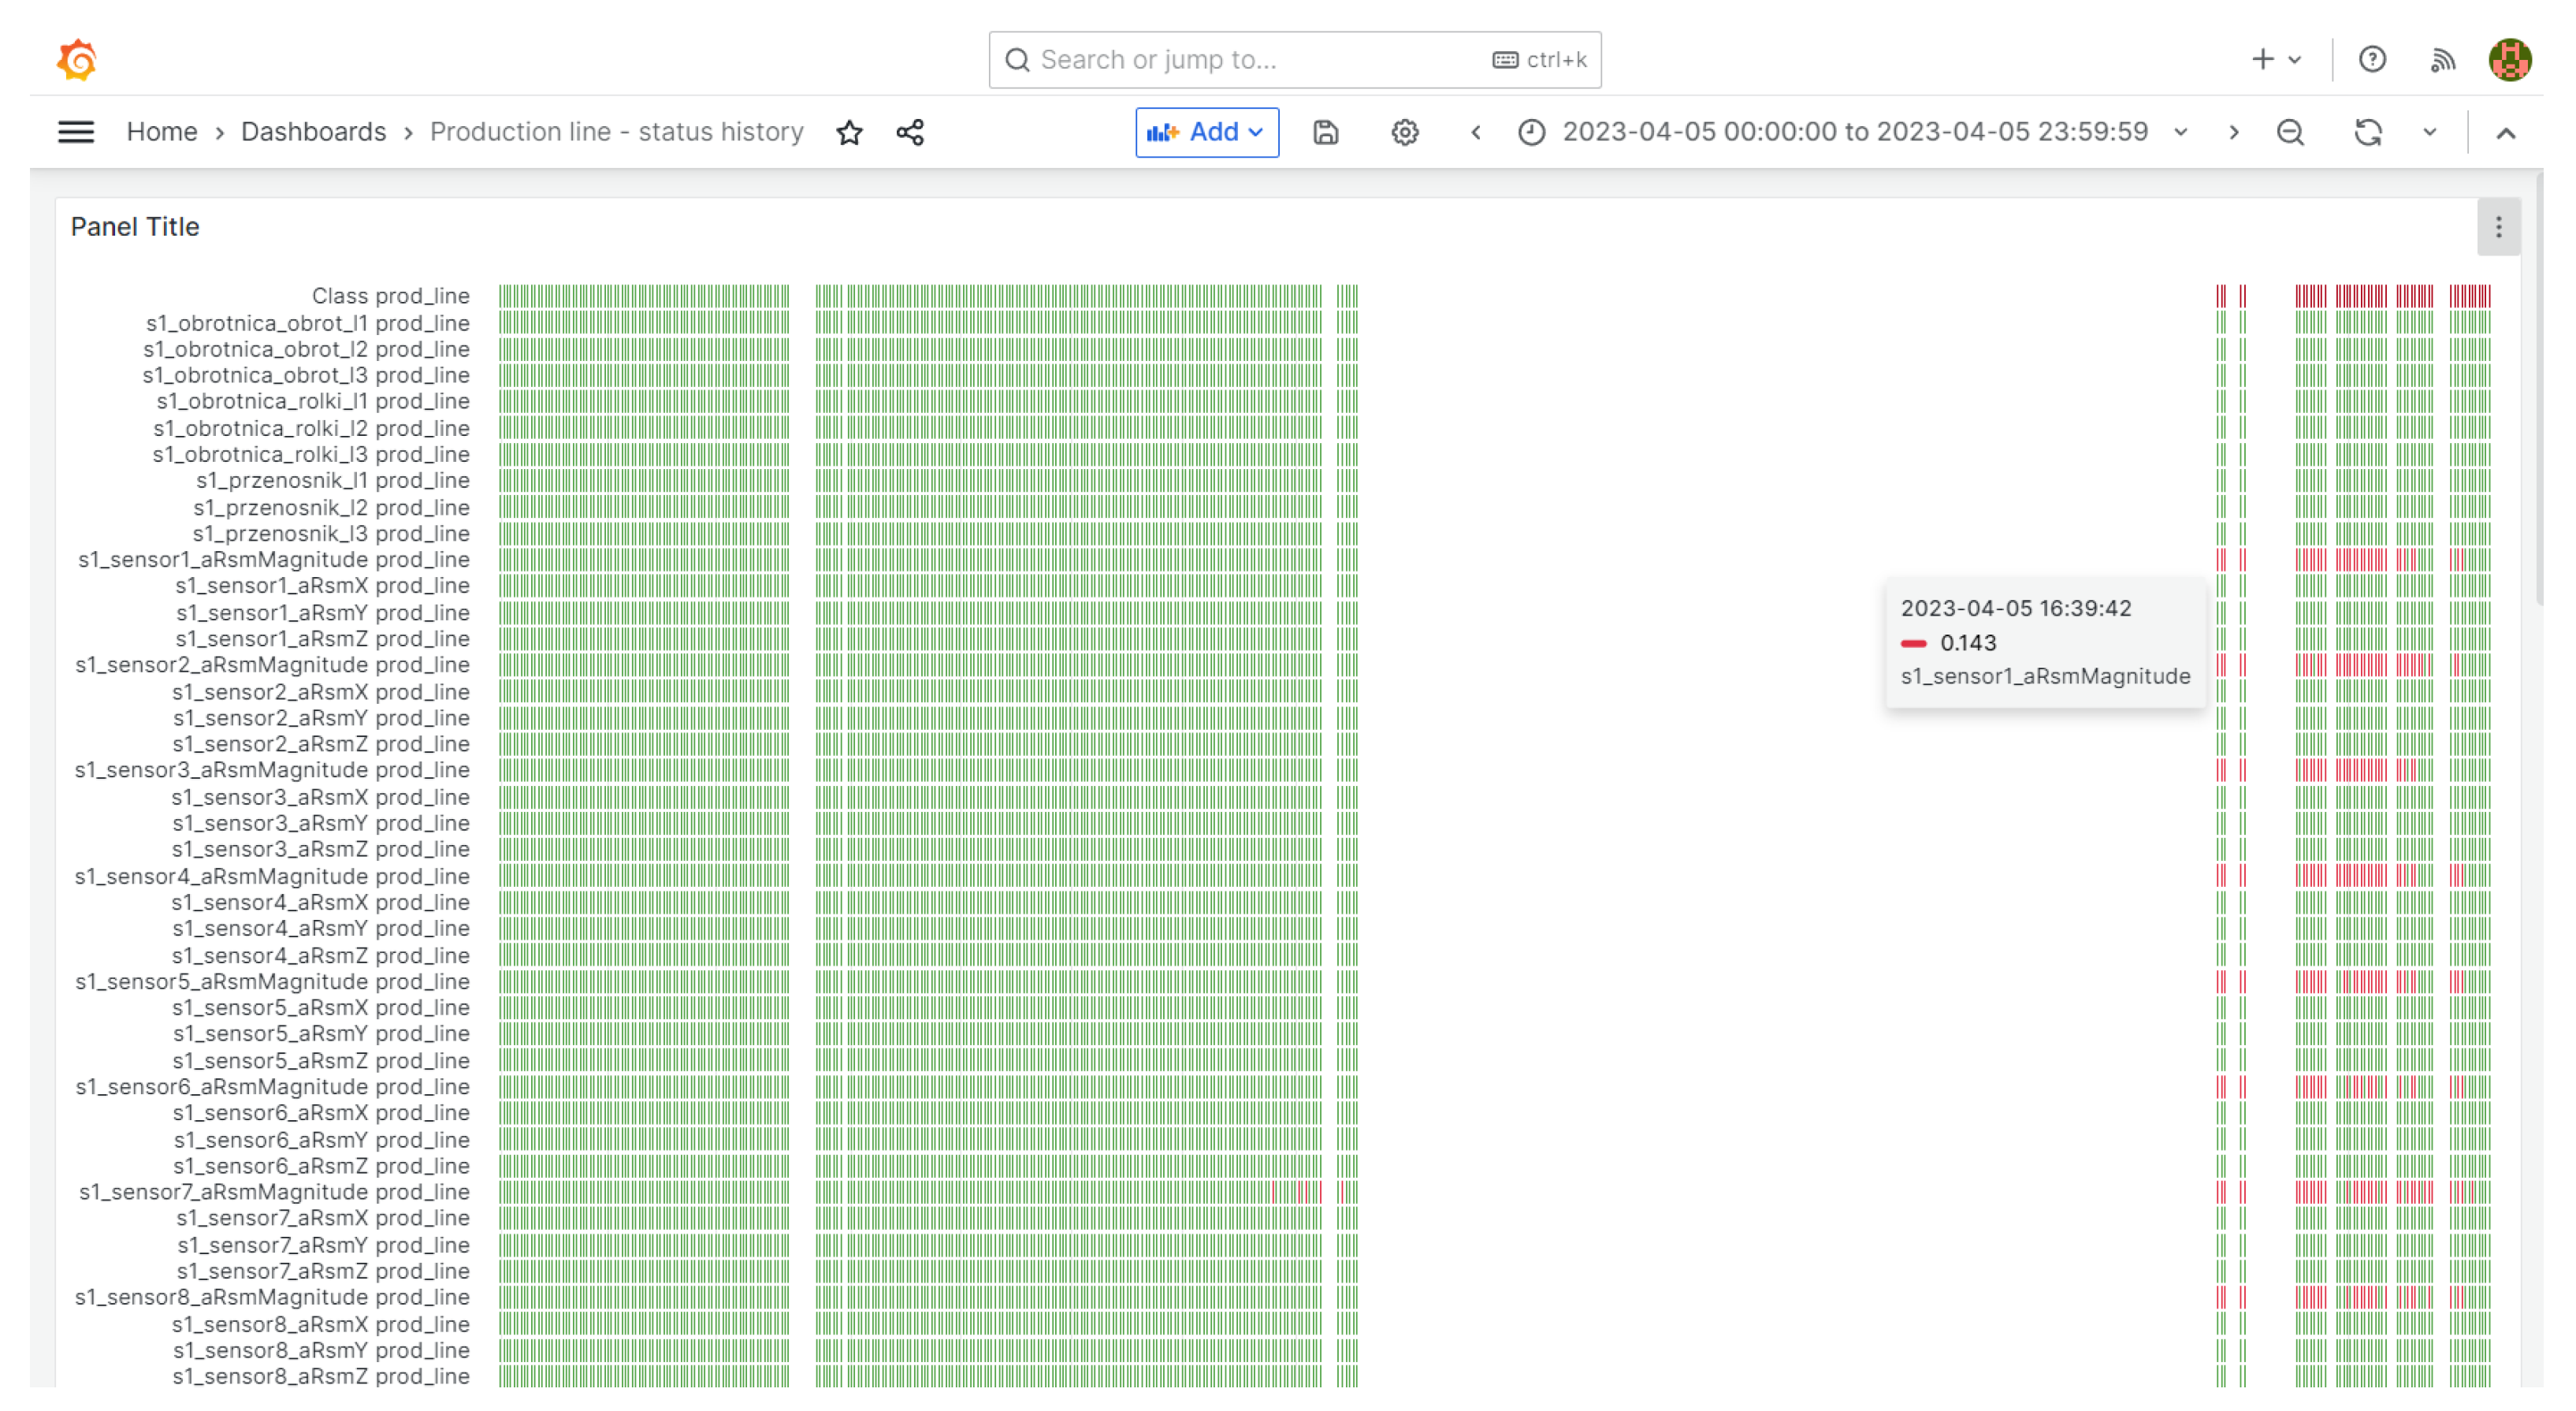
  • The analytical scripting module reacts to events and can observe individual time courses.
  • Grafana allows creating visualizations and retrieving data from many different sources, including InfluxDB and PostgreSQL. It constitutes the frontend of the system, which, if necessary, can be extended with custom plugins of the data source, panel, or application type.
According to the architectural model and technology stack model described in earlier sections, devices and other data sources have the ability to transmit data in several ways:
  • Sending directly to the topic Kafka: This requires the customer to use a special library and properly configure the connection. This is the most-efficient option and may be required in case of a large amount of transferred data.
  • Sending via HTTP requests (REST API): This is tailored for less-advanced devices, for which frequency of transmitted data is no more than once per second. The advantage of this solution is the simplicity of the configuration.
  • Using NodeRED: With its base of add-ons, it can support a wide variety of protocols for communicating with devices and provides the ability to pre-filter and recalculate raw data
Of course, the list of communication methods can be expanded with further items according to the needs of the environment in which the solution will be implemented. For the purposes of the research, a single frame with the time data is proposed in such a way as to provide great flexibility due to the need to support different types of devices. An example frame in the format JSON looks as follows:
{
    "measurement": "drone_pm",
    "lng": 22.022853,
    "lat": 50.048233,
    "pm": 20,
    "whatever_id": 123
    "tag1": "droneName",
}
The basic identifier of the transmitted data is the measurement field, which, for a single type of device, should be constant. Then, the frame can contain any number of fields with values to be stored; in this example, it is: lng, lat, pm. In addition, keys ending in “id” or starting with “tag” will be treated as tags, which will later enable the filtering and searching of data.
During the implementation, we also paid attention to security issues. The security of the system was ensured at several levels. Starting from the lowest, the system running on Docker exposes only the necessary ports for access by the clients. The server is protected by a firewall, and access to the system is implemented via VPN. The use of Kafka makes it possible to apply the identification and authorization of connecting clients (producers, as well as consumers) by keys, as well as the use of Access Control Lists (ACLs)—giving access to selected topics and actions for specific usernames. On the frontend side, the Grafana-based visualization application offers standard user authorization and authentication, as well as the ability to create user groups and types according to the principle of minimum privileges.
Figure 13, Figure 14 and Figure 15 present three dashboards consisting of various visualizations created in the Grafana system. The visualized data are both raw data and data derived from the results of the analysis module Scripting: In order to optimize the transmission and display of graphs, InfluxDB’s time series averaging and aggregation capabilities were used. The queries were stored in the appropriate data source of Grafana using the language Flux.
The data shown in Figure 13 are directly related to the supervision of the operation of the CNC machine, and they are the data from the position and vibration sensors of the tool used in the manufacturing process. In addition, based on the prediction algorithms, the system determines the degree of wear of the tool and the probability of its damage (e.g., breakage). In Figure 14 are presented the data sent from the drones related to air quality in the vicinity of Rzeszow. In addition, the data are correlated with a map and, in the form of a gradient scale, plotted on a map of the area. In Figure 15 are presented the data from the sensors supervising the work of the production line from one day of operation. The readings of the measured parameters are carried out in steps. If the value of the readings is within the range appropriate for the normal operation of the system, such a situation is visualized in the form of a green dash. If the measured value exceeds the normal range, an error is signaled and visualized in the form of a red dash.
The proposed architecture, in addition to the ability to connect basically any set of sensors or off-the-shelf IoE systems, also allows the use of custom data-analysis algorithms and proprietary control systems for a distributed system of IoE devices. In addition, the system allows correlating events and data from different devices and systems, leaving the analyst free in the area of the solution design. It should be noted that the proposed system was built on the basis of the proposed model and implemented in a real device environment under operational conditions (TRL7). In the course of our work, we were not able to find a system with similar implementation capabilities. On one hand, there are scientific papers available that present complex models without specifying precise implementation examples; on the other hand, there are extensive industrial models available on the market dedicated, however, to closed ecosystems. The developed system was based on the experience of both types of solutions, but special emphasis was placed on the openness of the system and the possibility of expanding it with its own analytical modules and the ability to integrate with any type of IoE device.
In addition, Table 2 compares the proposed solution with the existing most-popular Cloud solutions integrating IoT devices in 2023 [40]. The comparison clearly shows that platforms of this class enforce certain communication protocols in advance and support a certain set of functionalities. In the case of implementing simple uncomplicated IoT usage scenarios, implementing off-the-shelf platform solutions is faster, but if you want to integrate many different types of devices using different communication protocols and different inference rules, then you should think about using your own solution, for example based on the architecture model proposed in this article. In addition, it should be noted that the architectures presented in the paper can also be installed in a public or private Cloud environment.

6. Conclusions

This paper presented the results of work related to the development of a new architecture model and technology stack of a system for the diagnostics and monitoring of industrial components and processes in an IoE device environment. In the course of the work carried out, special emphasis was placed on the verification of the proposed solution in the environment of real IoE devices with special attention to their great diversity and different application areas. The proposed architecture and technology stack models, as well as the proposals for the two architectures that met their assumptions, allow the flexible integration of elements of distributed industrial systems. The proposed design pattern creates an environment that adapts to the elements being integrated, rather than merely creating rigid rules to which data providers must adapt. From this perspective, the proposed approach has great implementation potential. The implementation of the system was tested in a near-real environment with the participation of industrial partners, who successfully tested the integration of the production systems with the developed system. In addition, the analytical elements (surveillance, anomaly detection, and control algorithms) developed by the RID project team were tested during the work. The results of these application tests are presented in Section 5. The proposed approach provides practically unlimited possibilities for customizing the system to meet the needs of a particular enterprise. It should be noted, however, that, at the initial stage of implementation, it is necessary to set aside a relatively large number of man-hours to implement the initial architecture of the system. Once the core architecture has been created, further modules, devices, and functionalities can be added gradually, according to the needs and financial possibilities. It should also be taken into account to increase the possibility of the scaling of the proposed architecture, in particular taking into account failover mechanisms seen not only from the point of view of individual components of the system, but the entire system instances operating in High-Availability (HA) mode. Also, as a part of the implementation of the next versions of the architecture, a module should be developed to facilitate the use of analytical rules created in the no-code, low-code model. In further research, the team will focus on the use of crack-resistant encryption algorithms using quantum computers for communication between key system components. In addition, work will be carried out to take into account the correlation of events and data from multiple systems to implement predictive maintenance and predictive orders mechanisms, as well as to develop a graphical programming interface for analysts with an extensive privilege management system. Considering also the threats posed by potential cyber attacks, a security framework correlating with the proposed solution should also be developed in the future.

Author Contributions

Conceptualization, M.B., A.P., T.Ż., G.P., M.S. and K.T.; methodology, M.B., A.P., T.Ż., G.P., M.S. and K.T.; software, M.B., A.P., T.Ż., G.P., M.S. and K.T.; validation, M.B. and A.P.; formal analysis, M.B., A.P., T.Ż., G.P., M.S. and K.T.; investigation, M.B., A.P., T.Ż., G.P., M.S. and K.T.; resources, M.B., A.P., T.Ż., G.P., M.S. and K.T.; data curation, M.B., A.P., T.Ż., G.P., M.S. and K.T.; writing—original draft preparation, M.B., A.P. and K.T.; writing—review and editing, M.B. and A.P.; visualization, M.B., A.P., G.P. and K.T.; supervision, M.B. and A.P.; project administration, M.B. and A.P.; funding acquisition, M.B., A.P., T.Ż., G.P. and M.S. All authors have read and agreed to the published version of the manuscript.

Funding

This project is financed by the Minister of Education and Science of the Republic of Poland within the “Regional Initiative of Excellence” program for the years 2019–2023. Project Number 027/RID/2018/19; amount granted PLN 11 999 900.

Data Availability Statement

The data used in this study are available from the authors upon request.

Conflicts of Interest

The authors declare no conflict of interest.

References

  1. Raj, A.; Prakash, S. Internet of Everything: A survey based on Architecture, Issues and Challenges. In Proceedings of the 2018 5th IEEE Uttar Pradesh Section International Conference on Electrical, Electronics and Computer Engineering (UPCON), Gorakhpur, India, 2–4 November 2018; IEEE: Piscataway, NJ, USA, 2018; pp. 1–6. [Google Scholar] [CrossRef]
  2. Calvo, I.; Espin, A.; Gil-García, J.M.; Fernández Bustamante, P.; Barambones, O.; Apiñaniz, E. Scalable IoT Architecture for Monitoring IEQ Conditions in Public and Private Buildings. Energies 2022, 15, 2270. [Google Scholar] [CrossRef]
  3. Atmoko, R.A.; Riantini, R.; Hasin, M.K. IoT real time data acquisition using MQTT protocol. J. Phys. Conf. Ser. 2017, 853, 012003. [Google Scholar] [CrossRef]
  4. Acosta-Ortiz, D.; Ramos-Pollán, R.; Pedraza, G. A General Purpose Architecture for IoT Data Acquisition. In Advances in Computing; Solano, A., Ordoñez, H., Eds.; Communications in Computer and Information Science; Springer International Publishing: Cham, Switzerland, 2017; Volume 735, pp. 644–658. [Google Scholar] [CrossRef]
  5. Hastbacka, D.; Jaatinen, A.; Hoikka, H.; Halme, J.; Larranaga, M.; More, R.; Mesia, H.; Bjorkbom, M.; Barna, L.; Pettinen, H.; et al. Dynamic and Flexible Data Acquisition and Data Analytics System Software Architecture. In Proceedings of the 2019 IEEE SENSORS, Montreal, QC, Canada, 27–30 October 2019; IEEE: Piscataway, NJ, USA, 2019; pp. 1–4. [Google Scholar] [CrossRef]
  6. Liang, F.; Guo, H.; Yi, S.; Ma, S. A Scalable Data Acquisition Architecture in Web-Based IOT. In Information and Business Intelligence; Qu, X., Yang, Y., Eds.; Communications in Computer and Information Science; Springer: Berlin/Heidelberg, Germany, 2012; Volume 267, pp. 102–108. [Google Scholar] [CrossRef]
  7. Wang, S.; Hou, Y.; Gao, F.; Ji, X. A novel IoT access architecture for vehicle monitoring system. In Proceedings of the 2016 IEEE 3rd World Forum on Internet of Things (WF-IoT), Reston, VA, USA, 12–14 December 2016; IEEE: Piscataway, NJ, USA, 2016; pp. 639–642. [Google Scholar] [CrossRef]
  8. Gupta, V.; Sharma, M.; Pachauri, R.K.; Babu, K.N.D. A Low-Cost Real-Time IOT Enabled Data Acquisition System for Monitoring of PV System. Energy Sources Part A Recover. Util. Environ. Eff. 2021, 43, 2529–2543. [Google Scholar] [CrossRef]
  9. Kumar, S.; Kolekar, T.; Patil, S.; Bongale, A.; Kotecha, K.; Zaguia, A.; Prakash, C. A Low-Cost Multi-Sensor Data Acquisition System for Fault Detection in Fused Deposition Modelling. Sensors 2022, 22, 517. [Google Scholar] [CrossRef] [PubMed]
  10. Ortiz, G.; Boubeta-Puig, J.; Criado, J.; Corral-Plaza, D.; Garcia-de Prado, A.; Medina-Bulo, I.; Iribarne, L. A microservice architecture for real-time IoT data processing: A reusable Web of things approach for smart ports. Comput. Stand. Interfaces 2022, 81, 103604. [Google Scholar] [CrossRef]
  11. Bolanowski, M.; Żak, K.; Paszkiewicz, A.; Ganzha, M.; Paprzycki, M.; Sowiński, P.; Lacalle, I.; Palau, C.E. Eficiency of REST and gRPC Realizing Communication Tasks in Microservice-Based Ecosystems. In Frontiers in Artificial Intelligence and Applications; Fujita, H., Watanobe, Y., Azumi, T., Eds.; IOS Press: Amsterdam, The Netherlands, 2022. [Google Scholar] [CrossRef]
  12. Badii, C.; Bellini, P.; Difino, A.; Nesi, P. Sii-Mobility: An IoT/IoE Architecture to Enhance Smart City Mobility and Transportation Services. Sensors 2018, 19, 1. [Google Scholar] [CrossRef] [PubMed]
  13. Jindal, A.; Kumar, N.; Singh, M. A unified framework for big data acquisition, storage, and analytics for demand response management in smart cities. Future Gener. Comput. Syst. 2020, 108, 921–934. [Google Scholar] [CrossRef]
  14. Paszkiewicz, A.; Bolanowski, M.; Budzik, G.; Przeszłlowski, L.; Oleksy, M. Process of Creating an Integrated Design and Manufacturing Environment as Part of the Structure of Industry 4.0. Processes 2020, 8, 1019. [Google Scholar] [CrossRef]
  15. Sowiński, P.; Rachwał, K.; Danilenka, A.; Bogacka, K.; Kobus, M.; Dąbrowska, A.; Paszkiewicz, A.; Bolanowski, M.; Ganzha, M.; Paprzycki, M. Frugal Heart Rate Correction Method for Scalable Health and Safety Monitoring in Construction Sites. Sensors 2023, 23, 6464. [Google Scholar] [CrossRef]
  16. Touati, F.; Tariq, H.; Al-Hitmi, M.A.; Mnaouer, A.B.; Tahir, A.; Crescini, D. IoT and IoE prototype for scalable infrastructures, architectures and platforms. Int. Robot. Autom. J. 2018, 4, 319–327. [Google Scholar] [CrossRef]
  17. Liu, Y.; Wang, L.; Wang, X.V.; Xu, X.; Jiang, P. Cloud manufacturing: Key issues and future perspectives. Int. J. Comput. Integr. Manuf. 2019, 32, 858–874. [Google Scholar] [CrossRef]
  18. Paszkiewicz, A.; Bolanowski, M. Software for Integration of Manufacturing Resources in the Hybrid Cloud Model for Industry 4.0. In Integrating Research and Practice in Software Engineering; Jarzabek, S., Poniszewska-Marańda, A., Madeyski, L., Eds.; Studies in Computational Intelligence; Springer International Publishing: Cham, Switzerland, 2020; Volume 851, pp. 223–236. [Google Scholar] [CrossRef]
  19. Liu, Y.; Wang, L.; Wang, X.V.; Xu, X.; Zhang, L. Scheduling in Cloud manufacturing: State-of-the-art and research challenges. Int. J. Prod. Res. 2019, 57, 4854–4879. [Google Scholar] [CrossRef]
  20. Hewa, T.; Braeken, A.; Liyanage, M.; Ylianttila, M. Fog Computing and Blockchain-Based Security Service Architecture for 5G Industrial IoT-Enabled Cloud Manufacturing. IEEE Trans. Ind. Inform. 2022, 18, 7174–7185. [Google Scholar] [CrossRef]
  21. Ajith, J.B.; Manimegalai, R.; Ilayaraja, V. An IoT Based Smart Water Quality Monitoring System using Cloud. In Proceedings of the 2020 International Conference on Emerging Trends in Information Technology and Engineering (ic-ETITE), Vellore, India, 24–25 February 2020; IEEE: Piscataway, NJ, USA, 2020; pp. 1–7. [Google Scholar] [CrossRef]
  22. Bansal, M.; Chana, I.; Clarke, S. A Survey on IoT Big Data: Current Status, 13 V’s Challenges, and Future Directions. ACM Comput. Surv. 2021, 53, 1–59. [Google Scholar] [CrossRef]
  23. Microsoft Azure. Azure IoT Solution Accelerators. Available online: https://azure.microsoft.com/en-us/solutions/iot (accessed on 3 December 2023).
  24. IBM. Internet of Things. Available online: https://www.ibm.com/Cloud/internet-of-things (accessed on 3 December 2023).
  25. Google. Edge TPU. Available online: https://Cloud.google.com/Edge-tpu/ (accessed on 3 December 2023).
  26. Kaur, H.; Sood, S.K.; Bhatia, M. Cloud-assisted green IoT-enabled comprehensive framework for wildfire monitoring. Clust. Comput. 2020, 23, 1149–1162. [Google Scholar] [CrossRef]
  27. Aceto, G.; Persico, V.; Pescapé, A. Industry 4.0 and Health: Internet of Things, Big Data, and Cloud Computing for Healthcare 4.0. J. Ind. Inf. Integr. 2020, 18, 100129. [Google Scholar] [CrossRef]
  28. Nancy, A.A.; Ravindran, D.; Raj Vincent, P.M.D.; Srinivasan, K.; Gutierrez Reina, D. IoT-Cloud-Based Smart Healthcare Monitoring System for Heart Disease Prediction via Deep Learning. Electronics 2022, 11, 2292. [Google Scholar] [CrossRef]
  29. Rani, R.; Kashyap, V.; Khurana, M. Role of IoT-Cloud Ecosystem in Smart Cities: Review and Challenges. Mater. Today Proc. 2022, 49, 2994–2998. [Google Scholar] [CrossRef]
  30. Wu, Y. Cloud-Edge Orchestration for the Internet of Things: Architecture and AI-Powered Data Processing. IEEE Internet Things J. 2021, 8, 12792–12805. [Google Scholar] [CrossRef]
  31. Fysarakis, K.; Spanoudakis, G.; Petroulakis, N.; Soultatos, O.; Broring, A.; Marktscheffel, T. Architectural Patterns for Secure IoT Orchestrations. In Proceedings of the 2019 Global IoT Summit (GIoTS), Aarhus, Denmark, 17–21 June 2019; IEEE: Piscataway, NJ, USA, 2019; pp. 1–6. [Google Scholar] [CrossRef]
  32. Rafique, W.; Zhao, X.; Yu, S.; Yaqoob, I.; Imran, M.; Dou, W. An Application Development Framework for Internet-of-Things Service Orchestration. IEEE Internet Things J. 2020, 7, 4543–4556. [Google Scholar] [CrossRef]
  33. Sirma, M.; Kavak, A.; Inner, B. Cloud Based IoE Connectivity Engines for The Next Generation Networks: Challenges and Architectural Overview. In Proceedings of the 2019 1st International Informatics and Software Engineering Conference (UBMYK), Ankara, Turkey, 6–7 November 2019; IEEE: Piscataway, NJ, USA, 2019; pp. 1–6. [Google Scholar] [CrossRef]
  34. Longbottom, C. A Reference Architecture for the IoE; Technical Report; Enterprise Management 360: London, UK, 2016. [Google Scholar]
  35. Balestrieri, E.; De Vito, L.; Lamonaca, F.; Picariello, F.; Rapuano, S.; Tudosa, I. Research challenges in Measurement for Internet of Things systems. Acta IMEKO 2019, 7, 82. [Google Scholar] [CrossRef]
  36. Sadhu, P.K.; Yanambaka, V.P.; Abdelgawad, A. Internet of Things: Security and Solutions Survey. Sensors 2022, 22, 7433. [Google Scholar] [CrossRef] [PubMed]
  37. Pawłowicz, B.; Salach, M.; Trybus, B. Infrastructure of RFID-Based Smart City Traffic Control System. In Automation 2019; Szewczyk, R., Zieliński, C., Kaliczyńska, M., Eds.; Advances in Intelligent Systems and Computing; Springer International Publishing: Cham, Switzerland, 2020; Volume 920, pp. 186–198. [Google Scholar] [CrossRef]
  38. Uviase, O.; Kotonya, G. IoT Architectural Framework: Connection and Integration Framework for IoT Systems. Electron. Proc. Theor. Comput. Sci. 2018, 264, 1–17. [Google Scholar] [CrossRef]
  39. “Regional Initiative of Excellence” Program for Years 2019–2022. Project Number 027/RID/2018/19. Available online: https://rid.prz.edu.pl/ (accessed on 23 October 2023).
  40. 10+ Best IoT Cloud Platforms in 2023. Available online: https://euristiq.com/best-iot-Cloud-platforms (accessed on 3 December 2023).
Figure 1. Developed model collecting and processing data for the architecture of the IoE device environment.
Electronics 12 04935 g001
Figure 2. Prototype measurement system with a set of sensors installed on a Haas VF-1 machine.
Electronics 12 04935 g002
Figure 3. Mock-up of the intersection: (a) mockup view with lane layer; (b) detector layer under the road surface.
Electronics 12 04935 g003
Figure 4. (a) Layout of sensors in the area of an example warehouse; (b) sensor wiring diagram DHT22.
Electronics 12 04935 g004
Figure 5. Communication diagram of the measurement system.
Electronics 12 04935 g005
Figure 6. (a) Architecture of the measurement system tested under laboratory conditions; (b) the measurement system mounted on the drone.
Electronics 12 04935 g006
Figure 7. Data sources used in the project.
Electronics 12 04935 g007
Figure 8. Proposed technology stack model for the proposed architecture.
Electronics 12 04935 g008
Figure 9. Diagram of the resource-integration system.
Electronics 12 04935 g009
Figure 10. Diagram of the resource-integration system.
Electronics 12 04935 g010
Figure 11. (a) Data-writing block diagram; (b) block diagram showing the data-reading procedure for the frontend.
Electronics 12 04935 g011
Figure 12. A block diagram showing the procedure for calling the script.
Electronics 12 04935 g012
Figure 13. Visualization of a single experiments on a CNC machine along with the result of the predictions that determined the probability of problems with the machine.
Electronics 12 04935 g013
Figure 14. Drone data visualization of air quality in the area with the map and plotted gradients.
Electronics 12 04935 g014
Figure 15. Visualization for production line supervision: shows the status of individual sensors over time.
Electronics 12 04935 g015
Table 1. Measurement sensors used.
ParameterDHT11BME280DHT22
Measurement temperature0–50 C−40–85 C−40–80 C
Humidity (RH)20–90%10–100%0–100%
Supply voltage0–3.3 do 5.5 V3.3 V3.3–6 V
Electricity consumption0–0.2 mAUnknown0.2 mA
Accuracy (temp)0–2 C+/−1 C+/−0.5 C
Accuracy (humidity)0–+/−4 RH+/−3 RH+/−2 RH
Table 2. Comparison of solutions.
PlatformCommunication ProtocolFunctionsPossibility to Install a Separate Instance on Local ResourcesTime Required for Initial System Implementation
Google IoTHTTP, MQTTConnectivity device managementn/ashort
Amazon Web Services IoT PlatformHTTP MQTT WebSocketsAWS IoT core, connectivity, authentication, rules engine, development environmentn/ashort
Microsoft Azure IoTMQTT, AMQP, both over WebSockets, HTTPSAzure IoT Hub, connectivity, authentication, device monitoring, device management, IoT Edgen/ashort
IBM Watson IoTHTTP, MQTTBM Watson IoT platform, connectivity, device management, real-time analytics, blockchainn/ashort/medium
Proposed solutionHTTP, MQTT, and any othersAny functionality depending on customer needs, possibility to integrate with existing Cloud solutionsyesmedium/long
Disclaimer/Publisher’s Note: The statements, opinions and data contained in all publications are solely those of the individual author(s) and contributor(s) and not of MDPI and/or the editor(s). MDPI and/or the editor(s) disclaim responsibility for any injury to people or property resulting from any ideas, methods, instructions or products referred to in the content.

