
A Systematic Literature Review on Artificial Intelligence and Explainable Artificial Intelligence for Visual Quality Assurance in Manufacturing


Abstract
:1. Introduction
2. Machine Learning
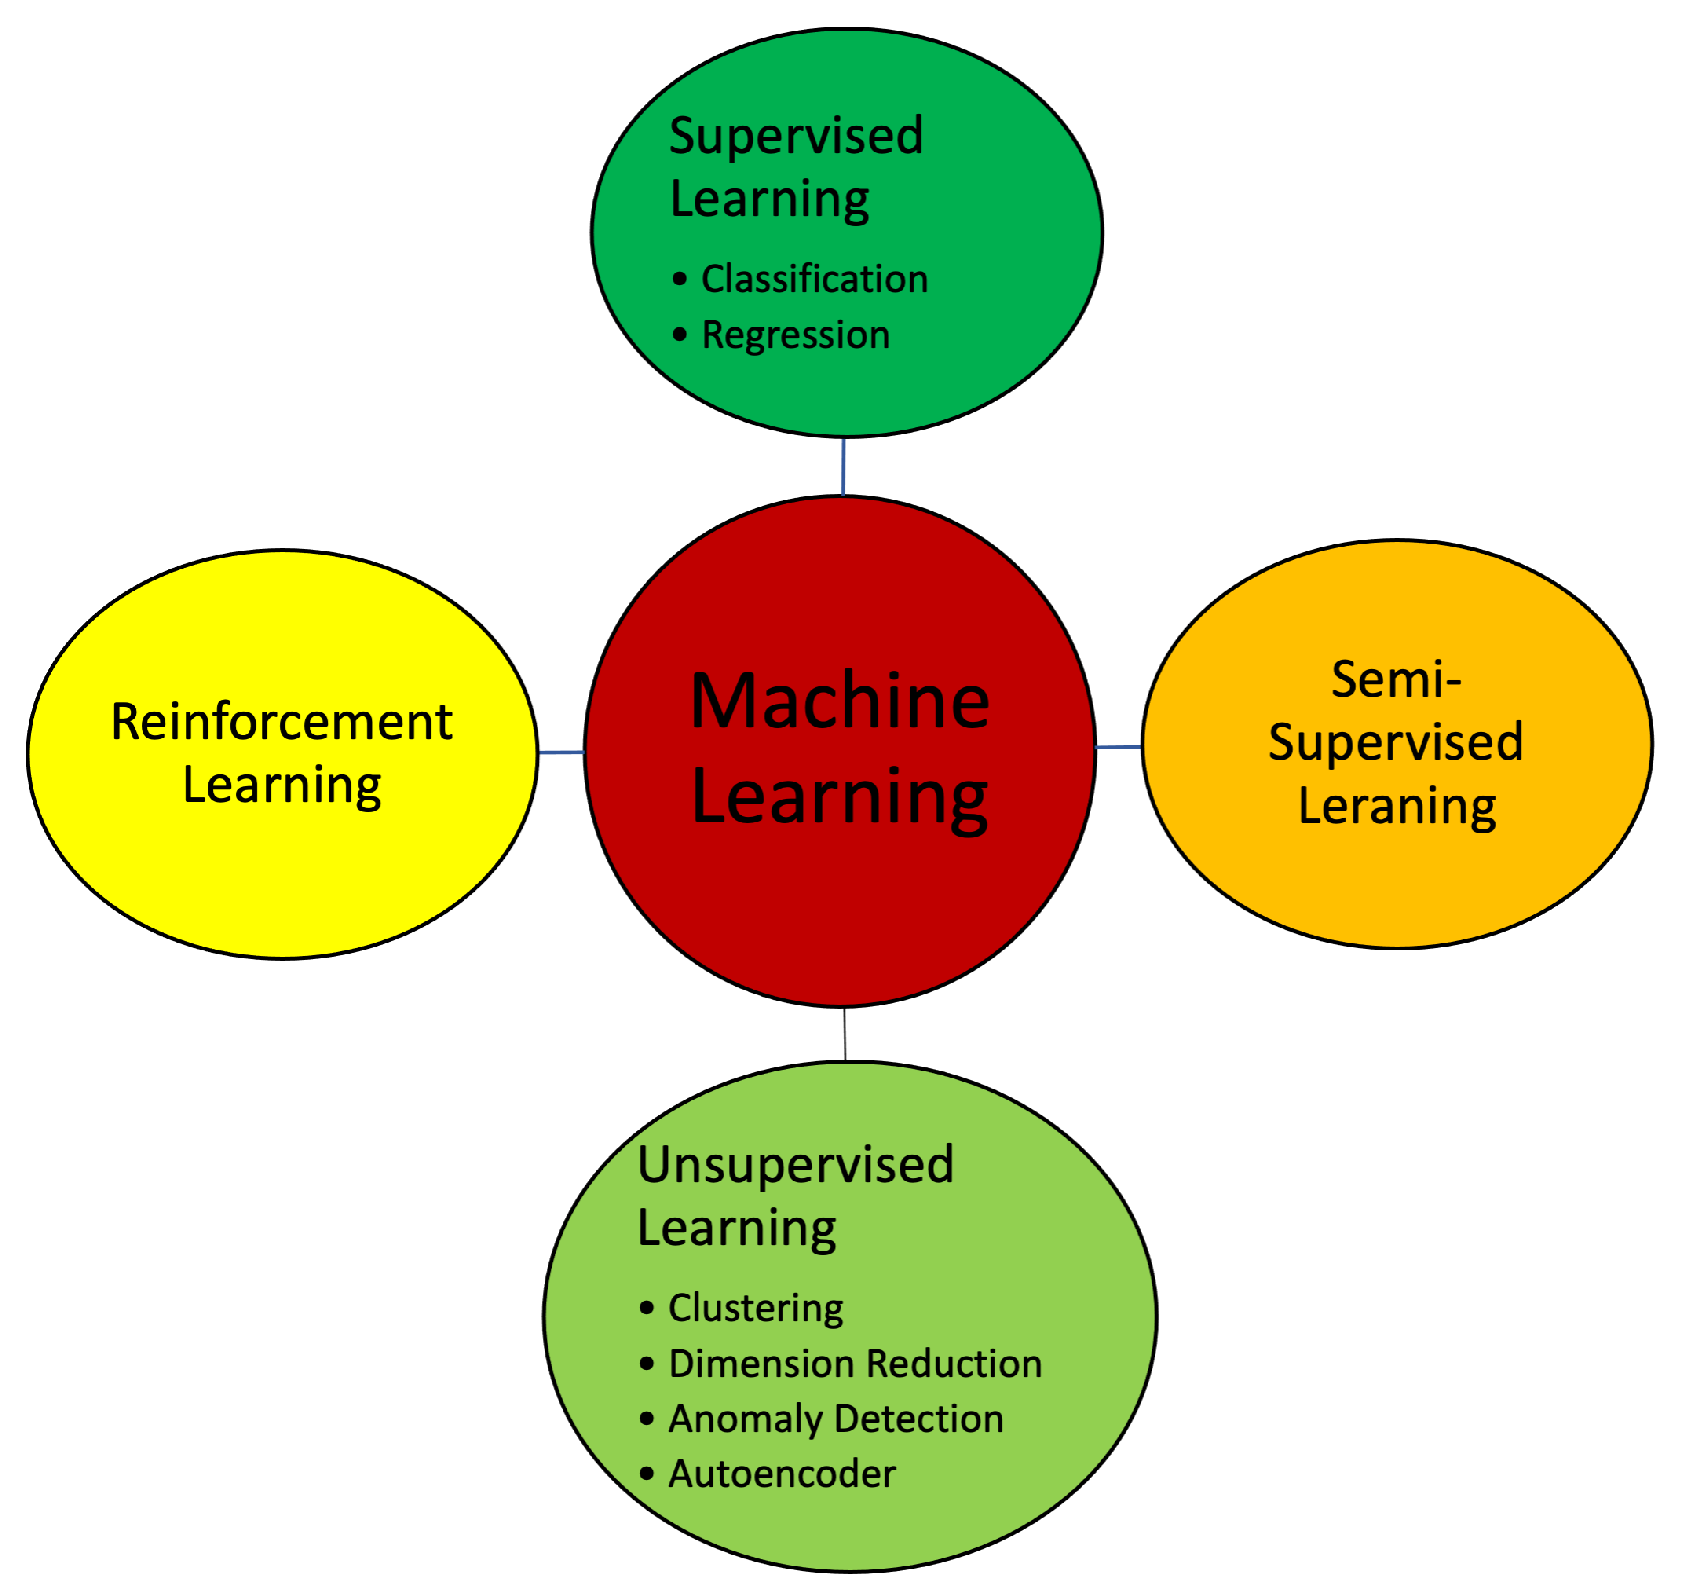
2.1. Types of Machine Learning
- Supervised Learning:
- Classification: In this task, the algorithm learns to predict discrete class labels for input data, e.g., classifying a manufactured product into defective or nondefective.
- Regression: Here, the algorithm learns to predict continuous numerical values. For instance, this includes predicting the energy consumption of a production line.
- Unsupervised Learning:
- Clustering: The algorithm groups similar data points together based on patterns or similarities in the input data. For example, this includes grouping machines with similar performance characteristics.
- Dimensionality Reduction: In this task, the algorithm reduces the number of input features while retaining important information. It aids in visualizing and understanding high-dimensional data and can be used as a preprocessing step for other machine learning tasks.
- Anomaly Detection (AD): Here, the algorithm learns the normal patterns in the data and identifies any data points that deviate significantly from those patterns, which often indicate anomalies or outliers. This method can be used, for example, to monitor signals of the process machinery to identify wear through abnormal behavior in the signal.
- Autoencoder (AE): An AE is a type of neural network that learns to encode and decode data; it is typically used for unsupervised learning and dimensionality reduction. It consists of an encoder network that compresses the input data into a lower-dimensional representation (latent space) and a decoder network that reconstructs the original data from the latent space. The goal of an AE is to minimize the reconstruction error, thereby forcing the model to learn a compressed representation that captures the most important features of the input data [10].
- Semisupervised Learning:
- Reinforcement Learning:
2.2. Performance Metrics for VQA
2.2.1. Evaluation of Artificial Intelligence Models
2.2.2. Evaluation of Explainable Artificial Intelligence Methods
- Identity: The principle of identity states that identical objects should receive identical explanations. This estimates the level of intrinsic nondeterminism in the method.
- Separability: Nonidentical objects cannot have identical explanations. If a feature is not actually needed for the prediction, then two samples that differ only in that feature will have the same prediction. In this scenario, the explanation method could provide the same explanation, even though the samples are different. For the sake of simplicity, this proxy is based on the assumption that every feature has a minimum level of importance, positive or negative, in the predictions.
- Stability: Similar objects must have similar explanations. This is built on the idea that an explanation method should only return similar explanations for slightly different objects.
- Selectivity: The elimination of relevant variables must negatively affect the prediction. To compute the selectivity, the features are ordered from the most to least relevant. One by one, the features are removed by setting it to zero, for example, and the residual errors are obtained to obtain the area under the curve (AUC).
- Coherence: It computes the difference between the prediction error over the original signal and the prediction error of a new signal where the nonimportant features are removed.
- Completeness: It evaluates the percentage of the explanation error from its respective prediction error.
- Congruence: The standard deviation of the coherence provides the congruence proxy. This metric helps to capture the variability of the coherence.
- Acumen: It is a new proxy proposed by the authors for the first time in [16], which is based on the idea that an important feature according to the XAI method should be one of the least important after it is perturbed. This proxy aims to detect whether the XAI method depends on the position of the feature. It is computed by comparing the ranking position of each important feature after perturbing it.
3. Visual Quality Assurance
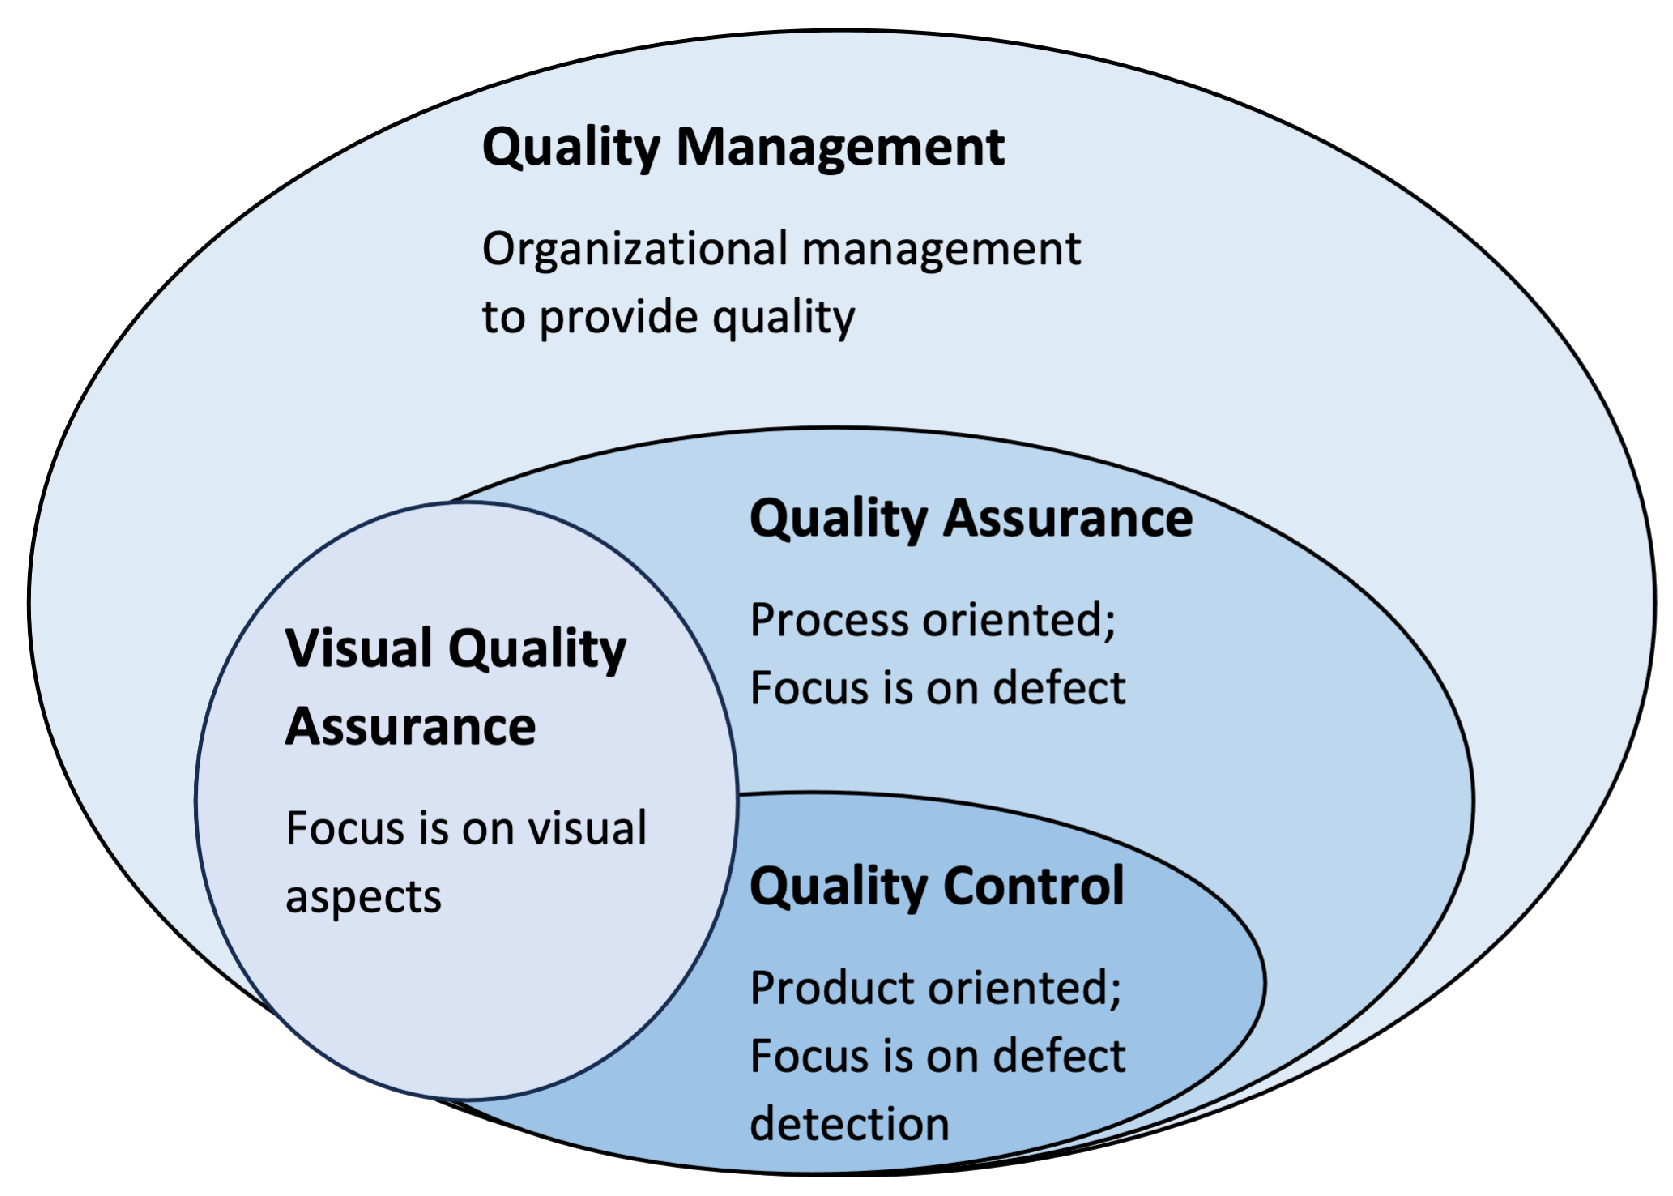
3.1. Quality Control
3.2. Quality Assurance
3.3. Visual Quality Assurance
- Visual Quality Control (VQC): This entails measuring and monitoring the quality of in-process products. By entrenching VQC measures at various processing levels and stages of production, more quality services are provided. It may therefore be said that VQC is a key element of VQA. VQA is process-oriented and thus provides additional control of the processes, such as assembly/processing/manufacturing processes.
- Process Optimization (PO): This entails measuring, monitoring, and regulating production process parameters that impact the performance of processes and the quality of outcomes. It involves setting acceptable ranges for these parameters and taking corrective action when they deviate from the defined thresholds.
- Predictive Maintenance (PM): This entails regulating and regularly calibrating the measurement equipment, as well as maintaining the components and machinery to prevent or predict quality losses.
- Root Cause Analysis (RCA): RCA involves analyzing data, identifying root causes of defects, and implementing corrective and preventive actions. The focus is on eliminating future defects and continuously raising the quality bar to achieve better results.
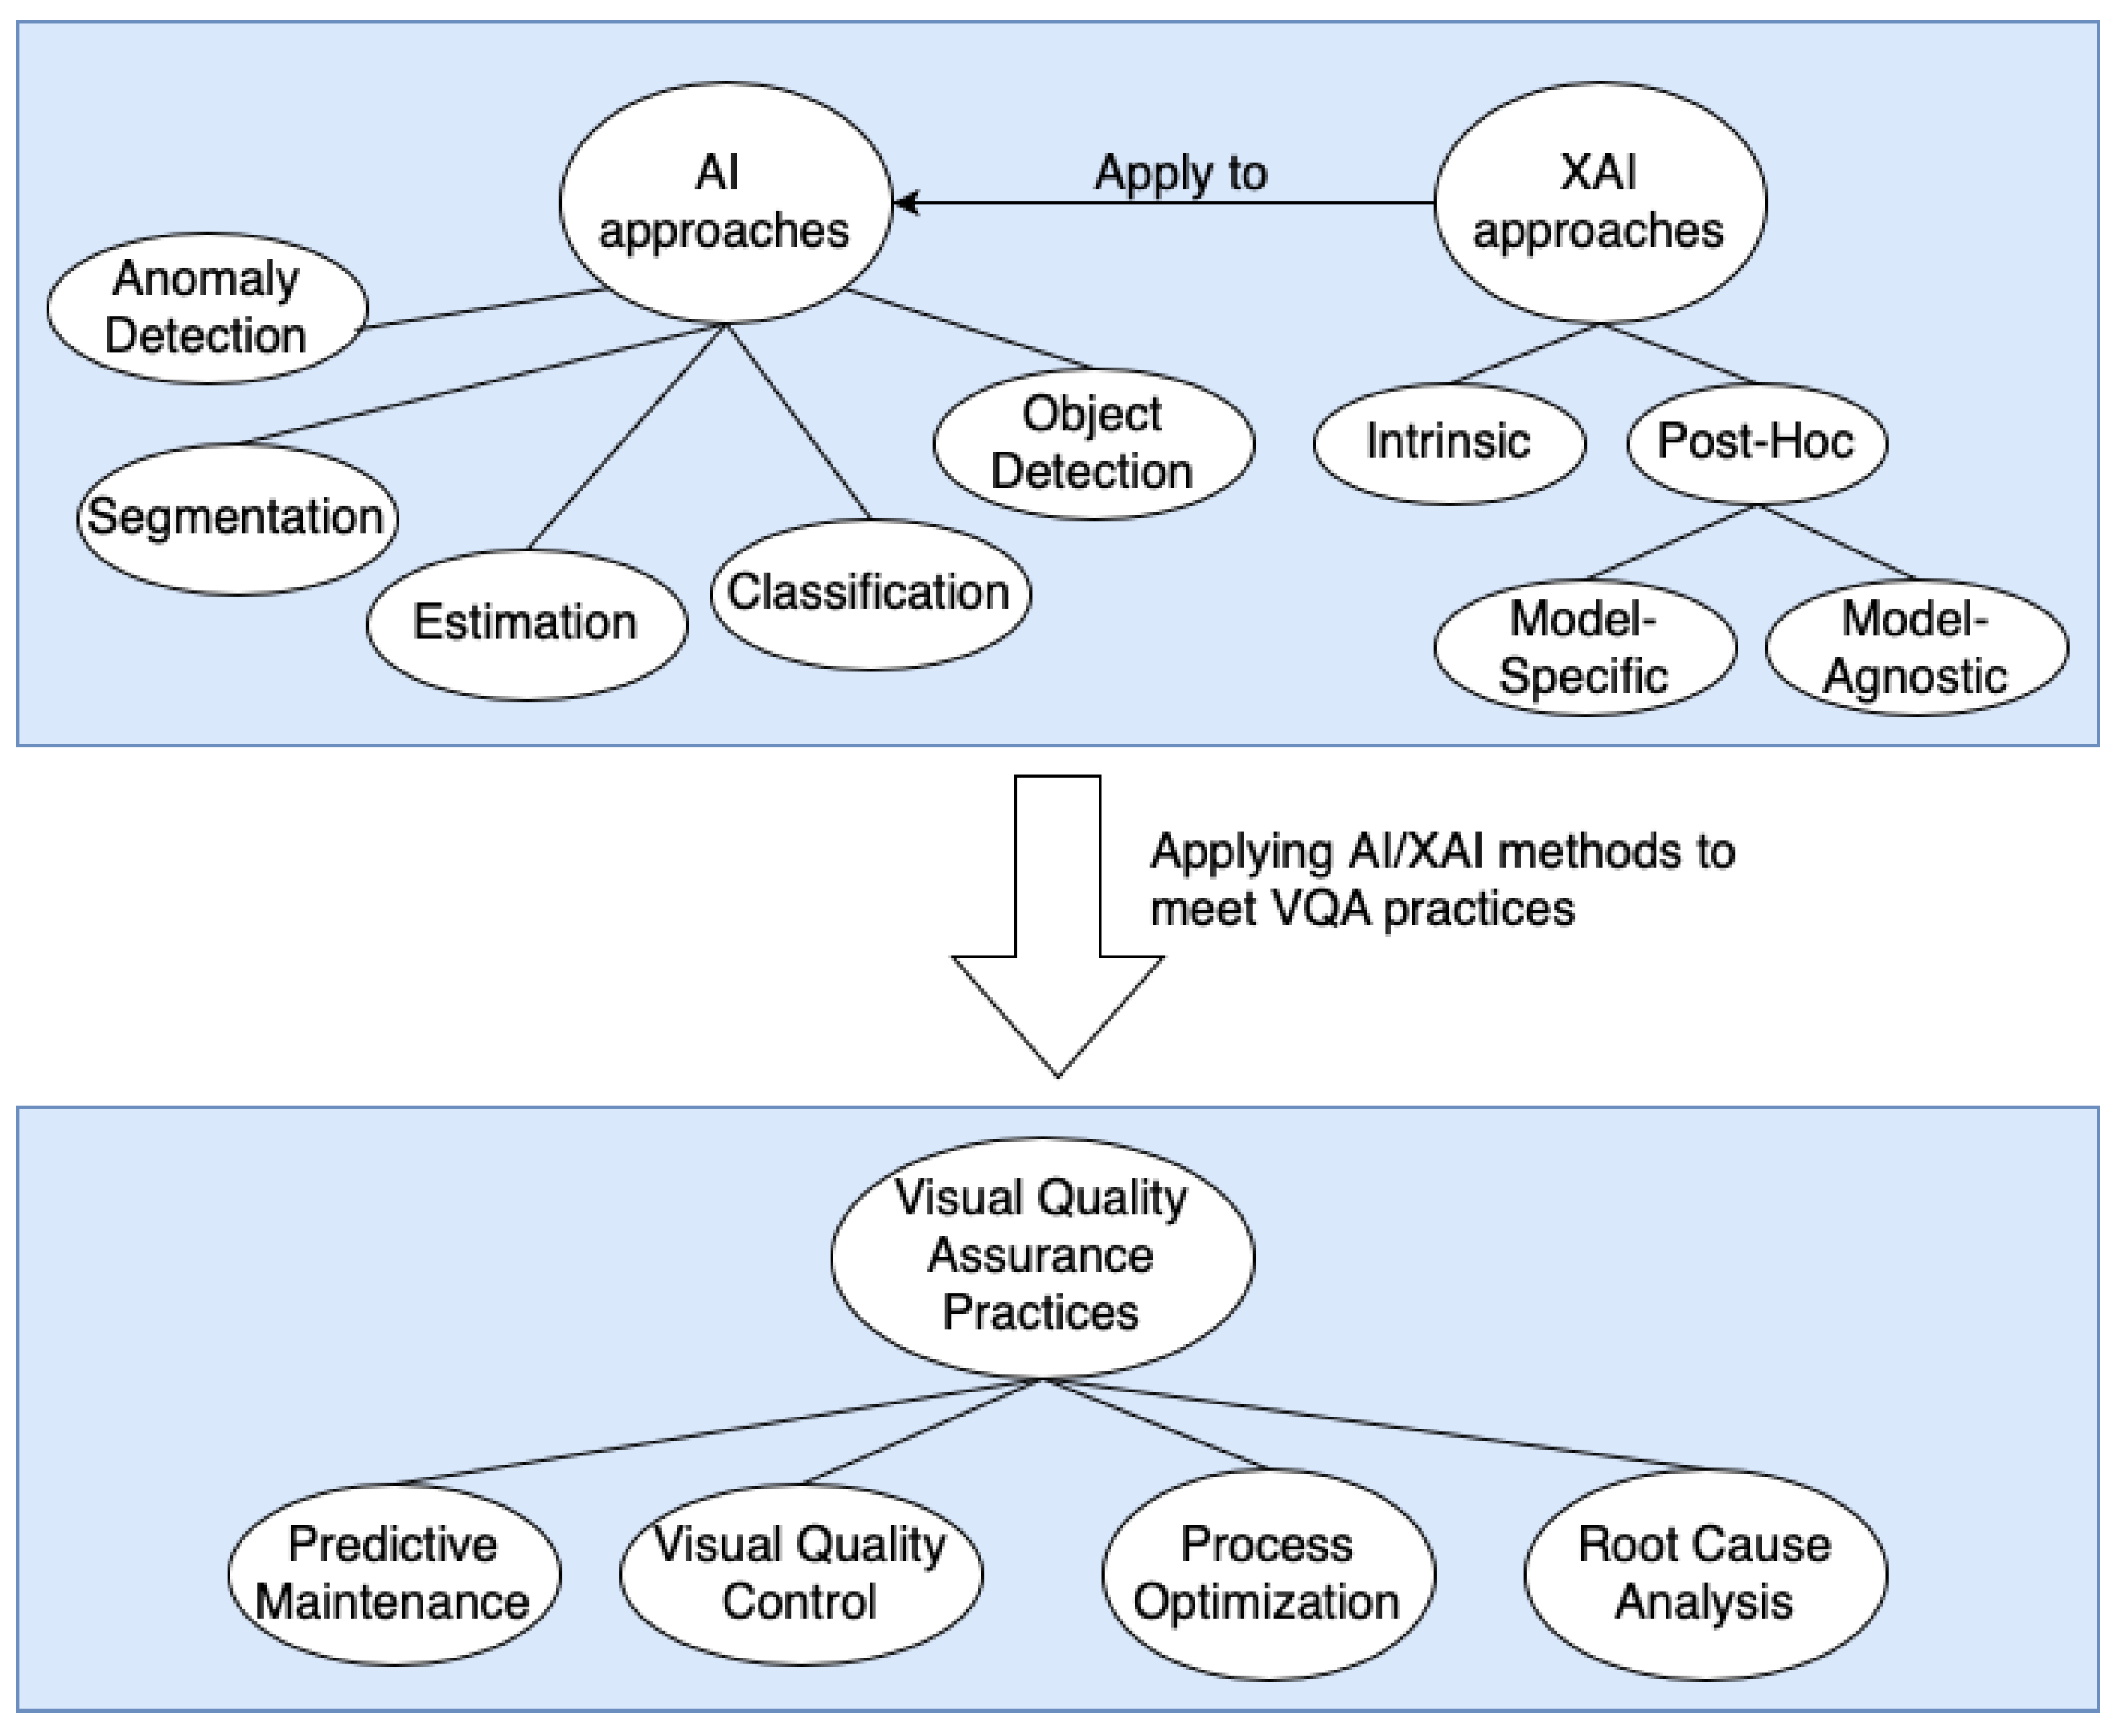
4. AI and XAI for Visual Quality Assurance
4.1. Artificial Intelligence Facilitates Visual Quality Assurance
- Classification (Class): In this approach, the algorithm learns to predict discrete class labels for input data and thus can facilitate VQA by categorizing data, products, or processes [9]. It can automate VQC and ensure that only defect-free products are delivered. Classification can help in identifying areas for improvement by categorizing defects, reducing waste, and saving energy by identifying defects in early process stages [22]. By inspecting images of machine spare parts, wear can be identified and the spare parts can be replaced to prevent the quality losses of the manufactured products [23].
- Estimation (Est): Estimation refers to the process of predicting or approximating an unknown or future value based on available data. It involves making an inference or calculation to estimate a parameter or outcome [9]. By analyzing historical data, the most suitable processing parameters [24], the remaining error-free time [25], or the defect length can be predicted [14].
- Object Detection (OD): Object detection is a computer vision task that involves identifying and localizing objects within images or videos. It combines object classification (assigning labels to objects) and object localization (drawing bounding boxes around objects). Object detection algorithms can accurately detect and locate multiple objects or flaws in products [26]. Thus, objection detection is a more comprehensive approach than classification, because occuring or predicting flaws can be additionally localized.
- Segmentation (Seg): Segmentation is a computer vision task that involves dividing images or videos into distinct regions based on visual characteristics. Similar to object detection, it can be used to localize defects or anomalies within products or processes, thereby ensuring accurate inspections and prompt corrective actions [27].
- Anomaly Detection (AD): In anomaly detection, the algorithm learns the normal patterns in the data and identifies any data points that deviate significantly from those patterns, thus often indicating anomalies or outliers [28]. This method can be used, for example, to monitor image or image-like data in manufacturing and take corrective actions promptly if potential issues or anomalies are identified [10]. In VQA, it can be used to detect rare or abnormal occurences in images, thus helping organizations to make data-driven decisions to improve processes.
4.2. Explainable Artificial Intelligence Facilitates Quality Assurance
- Intrinsic Explanation: The intrinsic explanation techniques enable the extraction of decision rules directly from the model’s architecture. ML algorithms like linear regression (LR), logistic regression (LogR), decision trees (DTs), and rule-based models are frequently employed to create intrinsic models [30].
- Post Hoc Explanation: Post hoc explanation techniques are designed to uncover the relationships between feature values and predictions. In contrast, models such as deep neural networks are often less interpretable, as they do not readily yield explicit decision rules from their structural components. When seeking ways to approximate a model’s behavior for decision understanding, we can categorize methods into model-specific and model-agnostic approaches [30].
- Model-Specific Explanation (Mod-Sp): Model-specific explanation techniques in XAI are tailored to particular contexts and conditions, thus leveraging the unique characteristics of the underlying algorithm or the specific architecture of an AI model. Reverse engineering approaches are applied to probe the internals of the algorithms. For example, class activation mapping (CAM) or gradient-weighted CAM (GradCAM) methods offer visual explanations specifically designed for CNN models. These CAM-based methods generate localization maps from convolutional layers, thereby revealing the crucial image regions that contribute to predicting a particular concept [30].
- Model-Agnostic Explanation (Mod-Ag): Model-agnostic explanation techniques focus on the relations between feature values and prediction results. These methods do not depend on or make assumptions about the specific ML model or algorithm being explained. These methods are designed to provide interpretability and explanations for a wide range of ML models, thus making them versatile and applicable across various domains [30].
4.3. Explainability of Visual Quality Assurance Processes
- Transparency in Visual Quality Assurance Practices: XAI provides transparency by offering clear insights into the decision-making processes of AI models used for VQA. Transparency is essential for assessing the quality of a model’s decision [31]. For example, ref. [32] used the GradCAM method to visualize the regions on which a CNN model is most focusing its attention for decision making to provide a human-readable explanation of the CNN model’s decision-making process.
- Interpretability of Visual Quality Assurance Practices: Interpretability refers to the ability to understand the underlying workings of an AI model. It involves comprehending how AI models make their decisions. Interpretability can be achieved through techniques that explain the internals of an AI model in a manner that humans can comprehend. These techniques are known as intrinsic methods [31]. In [33], intrinsic interpretable tree-based models were used to assure quality. Interpretability helps users comprehend how various factors impact product quality and enables the identification of the most influential parameters in a manufacturing process, thus allowing for better optimization and control.
- Trust in Visual Quality Assurance Decisions: When the decision-making process in a model is thoroughly understood, the model becomes transparent. Transparency promotes trust in the model [31]. This collaboration between humans and AI models enhances the efficiency and accuracy of VQA processes, thereby leading to more reliable results.
5. Systematic Literature Review
5.1. Research Questions
- RQ1: Which industry sectors are using AI and XAI approaches to provide VQA in manufacturing?
- RQ2: Which VQA practices in manufacturing are covered using AI and XAI approaches?
- RQ3: Which AI and XAI methods are used for VQA in manufacturing?
- RQ4: To what degree has XAI been adopted for VQA in manufacturing?
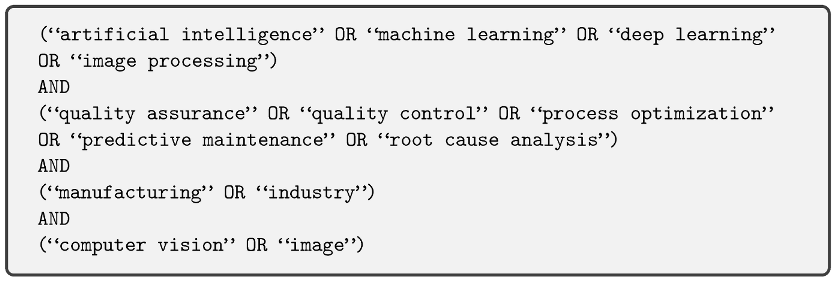
5.2. Search Process
6. Results of the Literature Review
6.1. Conducted SLR
6.2. Role of AI and XAI in VQA
6.2.1. Visual Quality Control
- It is not biased by the operator’s viewpoint;
- It can be adjusted to products changes, and no programming is necessary;
- It is not quickly weary;
- It is fast;
- It can see a wide spectrum of colors;
- It can operate in potentially dangerous settings;
- Its operators have fewer cognitive burdens.
6.2.2. Process Optimization
6.2.3. Predictive Maintenance
6.2.4. Root Cause Analysis

| Study | Industry Sector | VQA Practices | AI/XAI-Approaches | AI Method | XAI Method |
|---|---|---|---|---|---|
| [22,42,43,44,45,46,47,48,49,50] | Component Inspection | VQC | Class. | CNN | |
| [27,51] | Component Inspection | VQC | Seg. | CNN | |
| [52,53,54,55,56,57,58,59,60,61] | Component Inspection | VQC | OD | CNN | |
| [62,63] | Component Inspection | VQC | Est. | CNN | |
| [64] | Component Inspection | VQC | Class. | RF, DT, NB, SVM, KNN, AdaBoost | |
| [37] | Component Inspection | VQC | Class., Model-Ag. | CNN | SHAP |
| [36] | Component Inspection | VQC | Class., Model-Sp. | CNN | CAM |
| [65] | Component Inspection | VQC, PM | Est. | CNN | |
| [66] | Component Inspection | VQC | AD | CNN | |
| [67] | Component Inspection | VQC | OD, Est. | CNN | |
| [26] | Component Inspection | VQC, PO | OD, Est. | CNN | |
| [68] | Component Inspection | VQC | Class. | KNN, DT, RF, SVM, NB | |
| [69] | Component Inspection | VQC | Seg. | MLP | |
| [41] | AM | PO | Seg., Est. | CNN | |
| [70,71] | AM | VQC | Class. | RF, CART | |
| [72] | AM | VQC | Class., Model-Sp. | CNN, SVM | Smooth IG |
| [32,35] | AM | VQC | Class., Model-Sp. | CNN | GradCAM |
| [25] | AM | VQC, PM | Class., Est. | CNN, CPH | |
| [73] | AM | VQC | Est. | CNN | |
| [74] | AM | VQC | Class. | BPNN | |
| [33] | AM | VQC, RCA | Class., Intrinsic | CART, RF, XGBoost | Interpretable model |
| [75,76,77,78,79,80] | AM | VQC | Class. | CNN | |
| [39] | AM | VQC, PO, RCA | Est., Intrinsic | Multi-Otsu, RF, DT | Interpretable model |
| [81] | AM | VQC | Seg. | CNN | |
| [14] | AM | VQC | Est. | LR, GR, SVM | |
| [82,83,84,85,86] | Electronics | VQC | Class. | CNN | |
| [10,87] | Electronics | VQC | AD | CNN | |
| [23] | Electronics | PM | Class., | DLNN | |
| [88] | Electronics | VQC | Class. | CNN, LSTM | |
| [28] | Electronics | VQC | AD | osPCA, OnlinePCA, ABOD and LOF | |
| [89] | Electronics | PM | Est. | GAF, CNN | |
| [90] | Electronics | VQC | Est. | LogR, RF, SVM | |
| [91,92,93] | Electronics | VQC | Class. | SVM, k-means, GMM, KNN, RF | |
| [94] | Electronics | VQC | Seg., | CNN | |
| [95,96,97,98,99] | Electronics | VQC | OD | CNN | |
| [13,100] | Electronics | VQC | Est. | CNN | |
| [101] | Electronics | VQC | OD | CNN | |
| [102,103,104] | Machinery | VQC, PM | Class. | CNN | |
| [105] | Machinery | VQC | OD | CNN | |
| [106,107] | Machinery | VQC | Class. | CNN | |
| [108] | Machinery | VQC | Seg., OD | Otsu, CNN | |
| [109] | Machinery | PM | Est. | CNN, LSTM | |
| [16] | Machinery | PM | Est., Model-Ag. | CNN | LIME, SHAP |
| [16] | Machinery | PM | Est., Model-Sp. | CNN | LRP, Grad-CAM, ISCSal |
| [110] | Machinery | VQC, PM | AD | CNN | |
| [40] | Machinery | PO | Est. | CNN, LSTM | |
| [111] | Forming | VQC | Est. | CNN, RNN | |
| [112] | Forming | VQC | Class. | SVD, RF | |
| [113,114] | Forming | VQC | Class. | CNN | |
| [59] | Forming | VQC, PO | AD, Est. | CNN | |
| [115] | Forming | PO | Est. | CNN | |
| [116,117,118] | Textile | VQC | Class. | CNN | |
| [119] | Textile | VQC | OD, Class. | CNN | |
| [38] | Textile | VQC | Est. | MLP | |
| [120] | Textile | VQC | Seg. | CNN | |
| [121] | Textile | VQC | Class. | KNN | |
| [122] | Packaging | VQC | OD, Seg., Est. | CNN | |
| [123,124] | Packaging | VQC | Class. | CNN | |
| [125] | Packaging | VQC | AD | CNN | |
| [126,127,128] | Packaging | VQC | OD | CNN | |
| [27,129] | Packaging | VQC | Seg. | CNN | |
| [67] | Packaging | VQC | OD, Est. | CNN | |
| [130,131,132] | Food | VQC | Class. | CNN | |
| [130,132,133,134,135,136,137,138] | Food | VQC | Class. | KNN, SVM, DT, CART, RF, Fuzzy, PLS-DA, LDA, QDA, NB, AdaBoost | |
| [139] | Food | VQC | Seg. | Otsu, MBSAS | |
| [140,141] | Food | VQC | Class. | ANN | |
| [142] | Food | VQC | Est. | SVM, RF, GBM, M5, Cubist, LR | |
| [143,144,145,146] | Wood | VQC | OD | CNN | |
| [147] | Wood | VQC | Seg., Est. | CNN | |
| [148,149] | Other | VQC | Class. | XGBoost, SVM, KNN, LR, RF | |
| [62,148] | Other | VQC | Class. | ANN | |
| [150,151] | Other | VQC | Class. | CNN | |
| [152] | Other | VQC | Class. | CNN, SVM, RF, DT, NB | |
| [153] | Other | VQC | Class., Model-Sp. | CNN | GradCAM, ScoreCAM |
| [154] | Other | VQC | OD, Class. | CNN | |
| [155] | Other | VQC | Seg., Class. | Clustering, LogR, NB, CART, LDA | |
| [156] | Other | VQC | OD, AD | CNN | |
| [157] | Other | VQC | AD | CNN |
6.3. Answer to the Previously Designed Research Question
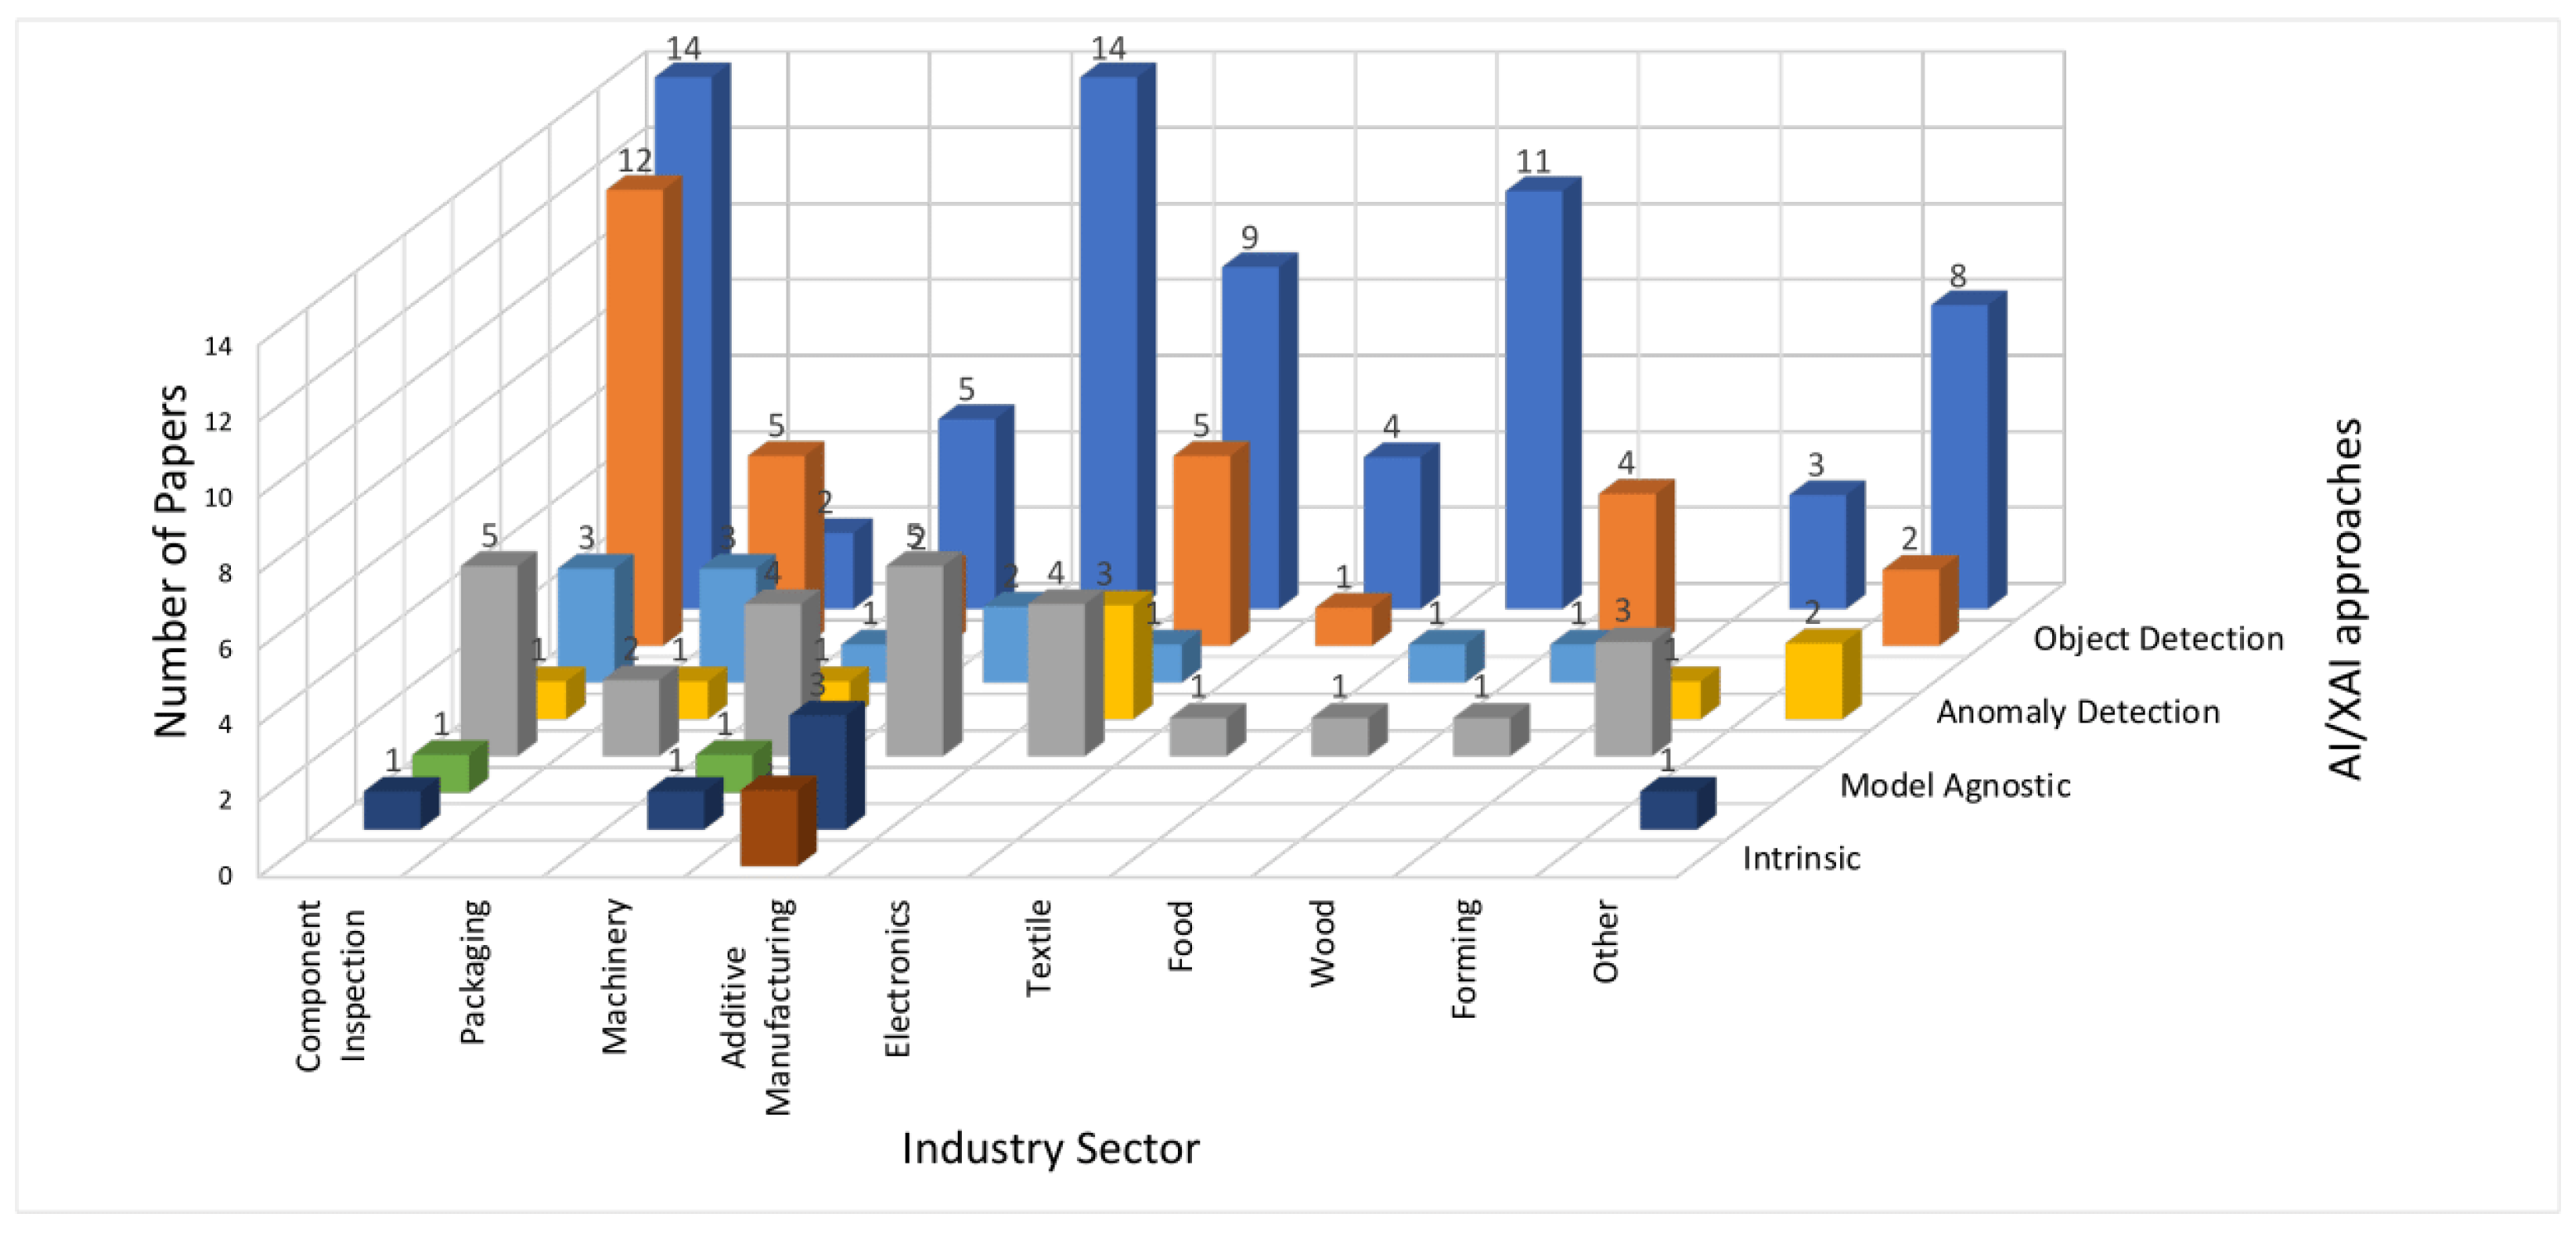
6.3.1. RQ1: Which Industry Sectors Are Using AI and XAI Approaches to Provide VQA in Manufacturing?
6.3.2. RQ2: Which VQA Practices in Manufacturing Are Covered Using AI and XAI Approaches?
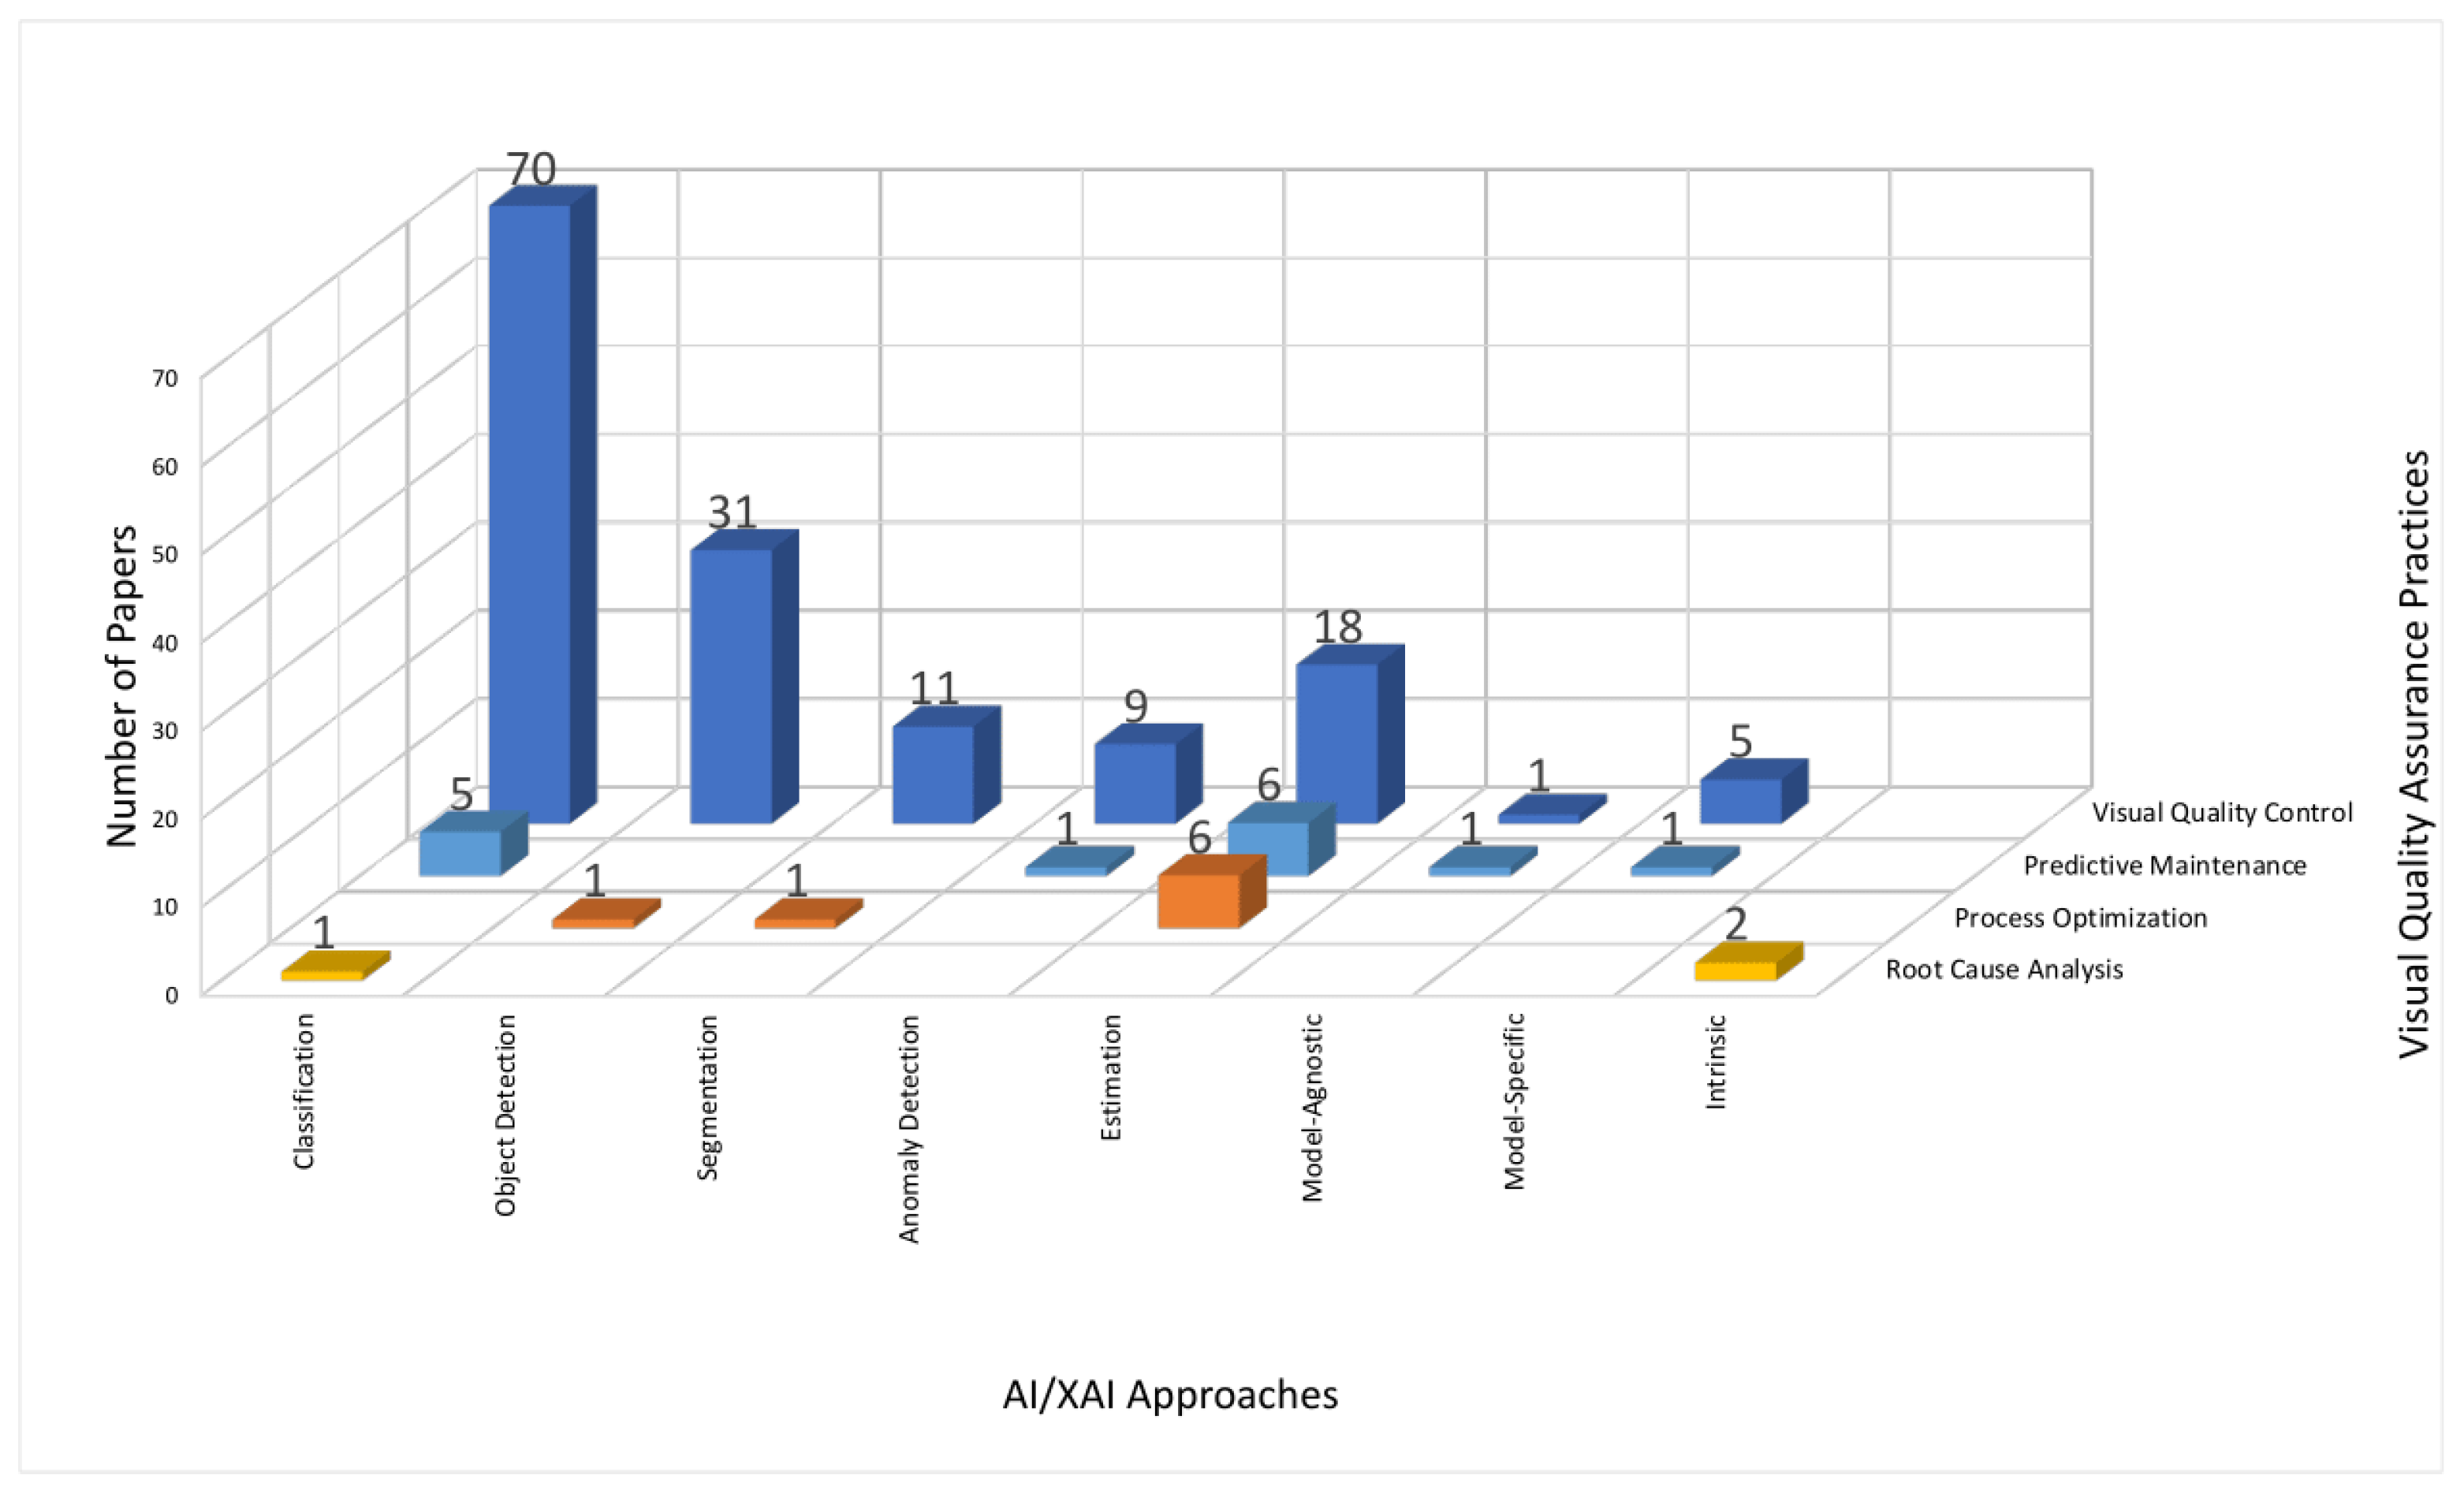
6.3.3. RQ3: Which AI and XAI Methods Are Used for VQA in Manufacturing?
6.3.4. To What Degree Has XAI Been Adopted for VQA in Manufacturing?
6.4. Benchmark Datasets
- NEU Surface Defect Dataset: This dataset is commonly used as a benchmark dataset in the field of computer vision and ML, particularly in the context of image-based QA and defect detection. This dataset is primarily focused on quality assessment and defect detection for steel surfaces. The NEU dataset includes 1800 grayscale images that represent six different types of defects: rolled-in scale, patches, crazing, pitted surface, inclusion, and scratches. The dataset consists of a significant number of samples for each defect class, which allows for robust training and evaluation of ML models. The studies [32,36,42,66,77] applied AI and XAI methods, such as CNN, CAM, and GradCAM, to this dataset.
- Severstal Steel Defect Dataset: The Severstal dataset is another publicly available dataset used for training and evaluating ML models, particularly for the task of detecting defects in steel sheets. This dataset is valuable in the field of computer vision, especially for semantic segmentation tasks, and it was used by [54,57] for VQA using CNN. It covers various types of defects commonly found on steel surfaces, such as, pitted surfaces, crazing, scratches, and patches. Each type of defect is associated with a specific class or label.
- COCO14 Dataset and VOC2012 Dataset: These two datasets are widely used computer vision datasets that focus on object detection, image segmentation, and captioning tasks used by various ML models, particularly DL models, for image analysis [59,60]. The dataset consists of a large collection of images, where each image contains a variety of objects.
- SLS Powder Bed Defects Dataset: The authors in [35] worked on GradCAM and used the SLS Powder Bed Defects dataset contributed by Erik Westphal and Hermann Seitz. This is a real manufacturing dataset that contains images of the powder bed surface of a selective laser sintering system. The images in this dataset were used to monitor and document the quality of the printing process. The data contains 8514 images of normal and defective powder bed images.
- KolektorSDD Dataset: The KolektorSDD dataset is a collection of images featuring surface cracks on plastic electronic commutators, which are used in various electronic devices. This dataset comprises 50 commutator samples, and each commutator has approximately eight different surfaces, thus resulting in a total of 399 images [105].
- Casting Product Image Data for Quality Inspection: This dataset focuses on casting manufacturing products, specifically submersible pump impellers. Casting defects are common in this industry and manual inspection is time-consuming and error-prone. To address this, the dataset contains 7348 grayscale images of casting products, which are divided into “Defective” or “Ok”. Consequently, DL methods, such as CNN, can be applied for automatic VQC [113].
- Turbofan Engine Degradation Simulation-2: The study [16] worked on time-series data using the gearbox, fast-charging batteries, and turbofan datasets from the full dataset, named Turbofan Engine Degradation Simulation-2. They applied CNN as a black box model to predict the remaining useful life and reviewed five XAI methods (LIME, SHAP, LRP, GradCAM, and ISCSal). This huge dataset is relevant to the VQA context, because it focuses on predicting component degradation and maintenance scheduling that are relevant to manufacturing. Moreover, they provided the source code to reproduce the experiments.
6.5. Comparison to Other Survey Papers
7. Discussion
8. Conclusions
Author Contributions
Funding
Conflicts of Interest
Abbreviations
| SLR | Systematic Literature Review |
| RQ | Research Question |
| AI | Artificial Intelligence |
| XAI | Explainable Artificial Intelligence |
| ML | Machine Learning |
| DL | Deep Learning |
| QM | Quality Management |
| QA | Quality Assurance |
| QC | Quality Control |
| VQA | Visual Quality Assurance |
| VQC | Visual Quality Control |
| PO | Process Optimization |
| PM | Predictive Maintenance |
| RCA | Root Cause Analysis |
| Class | Classification |
| Est | Estimation |
| OD | Object Detection |
| Seg | Segmentation |
| AD | Anomaly Detection |
| Mod-Ag | Model-Agnostic |
| Mod-Sp | Model-Specific |
| CNN | Convolutional Neural Network |
| LSTM | Long Short-Term Memory |
| RNN | Recurrent Neural Network |
| MLP | Multilayer Perceptron |
| BPNN | Back Propagation Neural Network |
| DLNN | Deep Learning Neural Network |
| ANN | Artifical Neural Network |
| RF | Random Forest |
| DT | Decision Tree |
| CART | Classification And Regression Tree |
| AdaBoost | Adaptive Boosting |
| XGBoost | eXtreme Gradient Boosting |
| SVM | Support Vector Machine |
| LR | Linear Regression |
| LogR | Logistic Regression |
| GR | Gaussian Regression |
| GMM | Gaussian Mixture Model |
| KNN | K-Nearest Neighbor |
| LDA | Linear Discriminant Analysis |
| QDA | Quadratic Discriminant Analysis |
| PLS-DA | Partial Least Squares Discriminant Analysis |
| CPH | Cox Proportional Hazards |
| MBSAS | Modified Basic Sequential Algorithmic Scheme |
| PCA | Principal Component Analysis |
| ABOD | Angle-Based Outlier Detection |
| LOF | Local Outlier Factor |
| GAF | Gramian Angular Field |
| SVD | Singular Value Decomposition |
| GBM | Generalized Boosting regression Model |
| SHAP | SHapley Additive exPlanations |
| CAM | Class Activation Mapping |
| GradCAM | Gradient-Weighted Class Activation Mapping |
| ScoreCAM | Score Class Activation Mapping |
| Smooth IG | Smooth Integrated Gradients |
| ISCSal | Image-Specific Class Saliency |
| LIME | Local Interpretable Model-Agnostic Explanations |
| tp | True Positive |
| tn | True Negative |
| fp | False Positive |
| fn | False Negative |
| acc | Accuracy |
| p | Precision |
| r | Recall |
| PR-AUC | Area under the Precision–Recall Curve |
| F1 | F Measure |
| IoU | Intersection of Union |
| MAE | Mean Absolute Error |
| MSE | Mean Squared Error |
| RMSE | Root Mean Squared Error |
References
- Ibidapo, T.A. From Industry 4.0 to Quality 4.0—An Innovative TQM Guide for Sustainable Digital Age Businesses; Springer: Cham, Switzerland, 2022. [Google Scholar]
- Jakubowski, J.; Stanisz, P.; Bobek, S.; Nalepa, G.J. Explainable anomaly detection for Hot-rolling industrial process. In Proceedings of the 2021 IEEE 8th International Conference on Data Science and Advanced Analytics (DSAA), Porto, Portugal, 6–9 October 2021; pp. 1–10. [Google Scholar] [CrossRef]
- Arora, A.; Gupta, R. A Comparative Study on Application of Artificial Intelligence for Quality Assurance in Manufacturing. In Proceedings of the 2022 4th International Conference on Inventive Research in Computing Applications (ICIRCA), Coimbatore, India, 21–23 September 2022; pp. 1200–1206. [Google Scholar] [CrossRef]
- Psarommatis, F.; Sousa, J.; Mendonça, J.P.; Kiritsis, D. Zero-defect manufacturing the approach for higher manufacturing sustainability in the era of industry 4.0: A position paper. Int. J. Prod. Res. 2022, 60, 73–91. [Google Scholar] [CrossRef]
- Ahmed, I.; Jeon, G.; Piccialli, F. From Artificial Intelligence to Explainable Artificial Intelligence in Industry 4.0: A Survey on What, How, and Where. IEEE Trans. Ind. Inform. 2022, 18, 5031–5042. [Google Scholar] [CrossRef]
- Tabassum, S.; Parvin, N.; Hossain, N.; Tasnim, A.; Rahman, R.; Hossain, M.I. IoT Network Attack Detection Using XAI and Reliability Analysis. In Proceedings of the 2022 25th International Conference on Computer and Information Technology (ICCIT), Cox’s Bazar, Bangladesh, 17–19 December 2022; pp. 176–181. [Google Scholar] [CrossRef]
- Machlev, R.; Heistrene, L.; Perl, M.; Levy, K.; Belikov, J.; Mannor, S.; Levron, Y. Explainable Artificial Intelligence (XAI) techniques for energy and power systems: Review, challenges and opportunities. Energy AI 2022, 9, 100169. [Google Scholar] [CrossRef]
- Le, T.T.H.; Prihatno, A.T.; Oktian, Y.E.; Kang, H.; Kim, H. Exploring Local Explanation of Practical Industrial AI Applications: A Systematic Literature Review. Appl. Sci. 2023, 13, 5809. [Google Scholar] [CrossRef]
- Huawei Technologies Co., Ltd. Artificial Intelligence Technology; Springer: Singapore, 2023. [Google Scholar]
- Maggipinto, M.; Beghi, A.; Susto, G.A. A Deep Convolutional Autoencoder-Based Approach for Anomaly Detection with Industrial, Non-Images, 2-Dimensional Data: A Semiconductor Manufacturing Case Study. IEEE Trans. Autom. Sci. Eng. 2022, 19, 1477–1490. [Google Scholar] [CrossRef]
- Hossin, M.; Sulaiman, M.N. A Review on Evaluation Metrics for Data Classification Evaluations. Int. J. Data Min. Knowl. Manag. Process 2015, 5, 1–11. [Google Scholar] [CrossRef]
- Minaee, S.; Boykov, Y.; Porikli, F.; Plaza, A.; Kehtarnavaz, N.; Terzopoulos, D. Image Segmentation Using Deep Learning: A Survey. arXiv 2020, arXiv:2001.05566. [Google Scholar] [CrossRef]
- Fan, X.; Wang, B.; Khokhar, M.Q.; Zahid, M.A.; Pham, D.P.; Yi, J. Real-Time ITO Layer Thickness for Solar Cells Using Deep Learning and Optical Interference Phenomena. Energies 2023, 16, 6049. [Google Scholar] [CrossRef]
- Rodríguez-Martín, M.; Fueyo, J.; Pisonero, J.; López-Rebollo, J.; Gonzalez-Aguilera, D.; García-Martín, R.; Madruga, F. Step heating thermography supported by machine learning and simulation for internal defect size measurement in additive manufacturing. Measurement 2022, 205, 112140. [Google Scholar] [CrossRef]
- Brabec, J.; Komárek, T.; Franc, V.; Machlica, L. On Model Evaluation under Non-constant Class Imbalance. arXiv 2020, arXiv:2001.05571. [Google Scholar]
- Solís-Martín, D.; Galán-Páez, J.; Borrego-Díaz, J. On the Soundness of XAI in Prognostics and Health Management (PHM). Information 2023, 14, 256. [Google Scholar] [CrossRef]
- for Quality, A.S. Quality Assurance vs Control, 2023. 07.05.2023.
- Szeliski, R. Computer Vision—Algorithms and Applications; Springer: Berlin/Heidelberg, Germany, 2022. [Google Scholar]
- Stojanov, D.; Lazarova, E.; Veljkova, E.; Rubartelli, P.; Giacomini, M. Predicting the outcome of heart failure against chronic-ischemic heart disease in elderly population – Machine learning approach based on logistic regression, case to Villa Scassi hospital Genoa, Italy. J. King Saud Univ.-Sci. 2023, 35, 102573. [Google Scholar] [CrossRef]
- Pesch, H.; Hamdani, M.; Forster, J.; Ney, H. Analysis of Preprocessing Techniques for Latin Handwriting Recognition. In Proceedings of the 2012 International Conference on Frontiers in Handwriting Recognition, Bari, Italy, 18–20 September 2012; pp. 280–284. [Google Scholar] [CrossRef]
- Chen, T.; Sampath, V.; May, M.C.; Shan, S.; Jorg, O.J.; Aguilar Martín, J.J.; Stamer, F.; Fantoni, G.; Tosello, G.; Calaon, M. Machine Learning in Manufacturing towards Industry 4.0: From ‘For Now’ to ‘Four-Know’. Appl. Sci. 2023, 13, 1903. [Google Scholar] [CrossRef]
- Kumar, R.; Patil, O.; Nath S, K.; Sangwan, K.S.; Kumar, R. A Machine Vision-based Cyber-Physical Production System for Energy Efficiency and Enhanced Teaching-Learning Using a Learning Factory. Procedia CIRP 2021, 98, 424–429. [Google Scholar] [CrossRef]
- Pheng, M.S.K.; David, L.G. Artificial Intelligence in Back-End Semiconductor Manufacturing: A Case Study. In Proceedings of the 2022 IEEE International Conference on Distributed Computing and Electrical Circuits and Electronics (ICDCECE), Ballari, India, 23–24 April 2022; pp. 1–4. [Google Scholar] [CrossRef]
- Rehman, R.U.; Zaman, U.K.U.; Aziz, S.; Jabbar, H.; Shujah, A.; Khaleequzzaman, S.; Hamza, A.; Qamar, U.; Jung, D.W. Process Parameter Optimization of Additively Manufactured Parts Using Intelligent Manufacturing. Sustainability 2022, 14, 15475. [Google Scholar] [CrossRef]
- Bauer, M.; Augenstein, C.; Schäfer, M.; Theile, O. Artificial Intelligence in Laser Powder Bed Fusion Procedures—Neural Networks for Live-Detection and Forecasting of Printing Failures. Procedia CIRP 2022, 107, 1367–1372. [Google Scholar] [CrossRef]
- Prezas, L.; Michalos, G.; Arkouli, Z.; Katsikarelis, A.; Makris, S. AI-enhanced vision system for dispensing process monitoring and quality control in manufacturing of large parts. Procedia CIRP 2022, 107, 1275–1280. [Google Scholar] [CrossRef]
- Yao, K.; Ortiz, A.; Bonnin-Pascual, F. A Weakly-Supervised Semantic Segmentation Approach Based on the Centroid Loss: Application to Quality Control and Inspection. IEEE Access 2021, 9, 69010–69026. [Google Scholar] [CrossRef]
- Susto, G.A.; Terzi, M.; Beghi, A. Anomaly Detection Approaches for Semiconductor Manufacturing. Procedia Manuf. 2017, 11, 2018–2024. [Google Scholar] [CrossRef]
- Jagatheesaperumal, S.K.; Pham, Q.V.; Ruby, R.; Yang, Z.; Xu, C.; Zhang, Z. Explainable AI Over the Internet of Things (IoT): Overview, State-of-the-Art and Future Directions. IEEE Open J. Commun. Soc. 2022, 3, 2106–2136. [Google Scholar] [CrossRef]
- Huang, J.; Wang, Z.; Li, D.; Liu, Y. The Analysis and Development of an XAI Process on Feature Contribution Explanation. In Proceedings of the 2022 IEEE International Conference on Big Data (Big Data), Osaka, Japan, 17–20 December 2022; pp. 5039–5048. [Google Scholar] [CrossRef]
- Ali, S.; Abuhmed, T.; El-Sappagh, S.; Muhammad, K.; Alonso-Moral, J.M.; Confalonieri, R.; Guidotti, R.; Del Ser, J.; Díaz-Rodríguez, N.; Herrera, F. Explainable Artificial Intelligence (XAI): What we know and what is left to attain Trustworthy Artificial Intelligence. Inf. Fusion 2023, 99, 101805. [Google Scholar] [CrossRef]
- Klamert, V.; Schmid-Kietreiber, M.; Bublin, M. A deep learning approach for real time process monitoring and curling defect detection in Selective Laser Sintering by infrared thermography and convolutional neural networks. Procedia CIRP 2022, 111, 317–320. [Google Scholar] [CrossRef]
- Huang, D.J.; Li, H. A machine learning guided investigation of quality repeatability in metal laser powder bed fusion additive manufacturing. Mater. Des. 2021, 203, 109606. [Google Scholar] [CrossRef]
- Xiao, Y.; Watson, M. Guidance on Conducting a Systematic Literature Review. J. Plan. Educ. Res. 2019, 39, 93–112. [Google Scholar] [CrossRef]
- Westphal, E.; Seitz, H. A machine learning method for defect detection and visualization in selective laser sintering based on convolutional neural networks. Addit. Manuf. 2021, 41, 101965. [Google Scholar] [CrossRef]
- Lee, S.Y.; Tama, B.A.; Moon, S.J.; Lee, S. Steel Surface Defect Diagnostics Using Deep Convolutional Neural Network and Class Activation Map. Appl. Sci. 2019, 9, 5449. [Google Scholar] [CrossRef]
- Sheu, R.K.; Chen, L.C.; Pardeshi, M.S.; Pai, K.C.; Chen, C.Y. AI Landing for Sheet Metal-Based Drawer Box Defect Detection Using Deep Learning (ALDB-DL). Processes 2021, 9, 768. [Google Scholar] [CrossRef]
- El-Geiheini, A.; ElKateb, S.; Abd-Elhamied, M.R. Yarn Tensile Properties Modeling Using Artificial Intelligence. Alex. Eng. J. 2020, 59, 4435–4440. [Google Scholar] [CrossRef]
- Feng, S.; Chen, Z.; Bircher, B.; Ji, Z.; Nyborg, L.; Bigot, S. Predicting laser powder bed fusion defects through in-process monitoring data and machine learning. Mater. Des. 2022, 222, 111115. [Google Scholar] [CrossRef]
- Kounta, C.A.K.A.; Kamsu-Foguem, B.; Noureddine, F.; Tangara, F. Multimodal deep learning for predicting the choice of cut parameters in the milling process. Intell. Syst. Appl. 2022, 16, 200112. [Google Scholar] [CrossRef]
- Yang, X.; Lakhal, O.; Belarouci, A.; Merzouki, R. Adaptive Deposit Compensation of Construction Materials in a 3D Printing Process. In Proceedings of the 2022 IEEE/ASME International Conference on Advanced Intelligent Mechatronics (AIM), Sapporo, Japan, 11–15 July 2022; pp. 658–663. [Google Scholar] [CrossRef]
- Tunali, M.M.; Yildiz, A.; Çakar, T. Steel Surface Defect Classification Via Deep Learning. In Proceedings of the 2022 7th International Conference on Computer Science and Engineering (UBMK), Diyarbakir, Turkey, 14–16 September 2022; pp. 485–489. [Google Scholar] [CrossRef]
- Enriquez, M.L.; Concepcion, R.; Relano, R.J.; Francisco, K.; Mayol, A.P.; Española, J.; Vicerra, R.R.; Bandala, A.; Co, H.; Dadios, E. Prediction of Weld Current Using Deep Transfer Image Networks Based on Weld Signatures for Quality Control. In Proceedings of the 2021 IEEE 13th International Conference on Humanoid, Nanotechnology, Information Technology, Communication and Control, Environment, and Management (HNICEM), Manila, Philippines, 28–30 November 2021; pp. 1–6. [Google Scholar] [CrossRef]
- Saiz, F.A.; Serrano, I.; Barandiarán, I.; Sánchez, J.R. A Robust and Fast Deep Learning-Based Method for Defect Classification in Steel Surfaces. In Proceedings of the 2018 International Conference on Intelligent Systems (IS), Funchal, Portugal, 25–27 September 2018; pp. 455–460. [Google Scholar] [CrossRef]
- Syam, W.P.; Rybalcenko, K.; Gaio, A.; Crabtree, J.; Leach, R.K. Methodology for the development of in-line optical surface measuring instruments with a case study for additive surface finishing. Opt. Lasers Eng. 2019, 121, 271–288. [Google Scholar] [CrossRef]
- Weiss, T.; Kick, M.; Grabmann, S.; Geiger, C.; Mayr, L.; Wudy, K.; Zaeh, M.F. A holistic approach for an intelligent laser beam welding architecture using machine learning for the welding of metallic bipolar plates for polymer electrolyte membrane fuel cells. Procedia CIRP 2022, 111, 810–815. [Google Scholar] [CrossRef]
- Ozdemir, R.; Koc, M. A Quality Control Application on a Smart Factory Prototype Using Deep Learning Methods. In Proceedings of the 2019 IEEE 14th International Conference on Computer Sciences and Information Technologies (CSIT), Lviv, Ukraine, 17–20 September 2019; Volume 1, pp. 46–49. [Google Scholar] [CrossRef]
- Mende, H.; Peters, A.; Ibrahim, F.; Schmitt, R.H. Integrating deep learning and rule-based systems into a smart devices decision support system for visual inspection in production. Procedia CIRP 2022, 109, 305–310. [Google Scholar] [CrossRef]
- Mih, A.N.; Cao, H.; Pickard, J.; Wachowicz, M.; Dubay, R. TransferD2: Automated Defect Detection Approach in Smart Manufacturing using Transfer Learning Techniques. In Proceedings of the 2023 IEEE International Conference on Omni-layer Intelligent Systems (COINS), Berlin, Germany, 23–25 July 2023; pp. 1–8. [Google Scholar] [CrossRef]
- Sun, X.; Gu, J.; Wang, M.; Meng, Y.; Shi, H. Wheel Hub Defects Image Recognition Base on Zero-Shot Learning. Appl. Sci. 2021, 11, 1529. [Google Scholar] [CrossRef]
- Tural, S.; Samet, R.; Aydin, S.; Traore, M. Deep Learning Based Classification of Military Cartridge Cases and Defect Segmentation. IEEE Access 2022, 10, 74961–74976. [Google Scholar] [CrossRef]
- Ünal, P.; Albayrak, Ö.; Kubatova, M.; Deveci, B.U.; Çırakman, E.; Koçal, Ç.; Murat Özbayoğlu, A. A Big Data Application in Manufacturing Industry-Computer Vision to Detect Defects on Bearings. In Proceedings of the 2022 IEEE International Conference on Big Data (Big Data), Osaka, Japan, 17–20 December 2022; pp. 6074–6083. [Google Scholar] [CrossRef]
- Jia, C.; Huang, F. A Novel Fault Inspection Method of Steel Plate Surface. In Proceedings of the 2022 4th International Conference on Artificial Intelligence and Advanced Manufacturing (AIAM), Hamburg, Germany, 7–9 October 2022; pp. 66–73. [Google Scholar] [CrossRef]
- Sampath, V.; Maurtua, I.; Martín, J.J.A.; Rivera, A.; Molina, J.; Gutierrez, A. Attention-Guided Multitask Learning for Surface Defect Identification. IEEE Trans. Ind. Inform. 2023, 19, 9713–9721. [Google Scholar] [CrossRef]
- Lindgren, E.; Zach, C. Industrial X-ray Image Analysis with Deep Neural Networks Robust to Unexpected Input Data. Metals 2022, 12, 1963. [Google Scholar] [CrossRef]
- Tao, X.; Zhang, D.; Ma, W.; Liu, X.; Xu, D. Automatic Metallic Surface Defect Detection and Recognition with Convolutional Neural Networks. Appl. Sci. 2018, 8, 1575. [Google Scholar] [CrossRef]
- Wang, S.; Xia, X.; Ye, L.; Yang, B. Automatic Detection and Classification of Steel Surface Defect Using Deep Convolutional Neural Networks. Metals 2021, 11, 388. [Google Scholar] [CrossRef]
- Wang, H.T.; Yu, K.W.; Hsieh, S.L.; Tsai, M.F. Using Deep Learning Technology for Abnormal Component Identification in Smart Manufacturing Cloud Platform. In Proceedings of the 2022 IET International Conference on Engineering Technologies and Applications (IET-ICETA), Changhua, Taiwan, 14–16 October 2022; pp. 1–2. [Google Scholar] [CrossRef]
- Popper, J.; Harms, C.; Ruskowski, M. Enabling reliable visual quality control in smart factories through TSN. Procedia CIRP 2020, 88, 549–553. [Google Scholar] [CrossRef]
- Zhu, H.; Wang, Y.; Fan, J. IA-Mask R-CNN: Improved Anchor Design Mask R-CNN for Surface Defect Detection of Automotive Engine Parts. Appl. Sci. 2022, 12, 6633. [Google Scholar] [CrossRef]
- Lema, D.G.; Pedrayes, O.D.; Usamentiaga, R.; Venegas, P.; García, D.F. Automated Detection of Subsurface Defects Using Active Thermography and Deep Learning Object Detectors. IEEE Trans. Instrum. Meas. 2022, 71, 4503213. [Google Scholar] [CrossRef]
- Buongiorno, D.; Prunella, M.; Grossi, S.; Hussain, S.M.; Rennola, A.; Longo, N.; Di Stefano, G.; Bevilacqua, V.; Brunetti, A. Inline Defective Laser Weld Identification by Processing Thermal Image Sequences with Machine and Deep Learning Techniques. Appl. Sci. 2022, 12, 6455. [Google Scholar] [CrossRef]
- Hartung, J.; Dold, P.M.; Jahn, A.; Heizmann, M. Analysis of AI-Based Single-View 3D Reconstruction Methods for an Industrial Application. Sensors 2022, 22, 6425. [Google Scholar] [CrossRef]
- Kulkarni, S.D.; Selvi, S.S.; Momin, M.Z.M.; Bharadwaj, N.S.; Navya, S.R.; Sudesh; Thanki, S.K.S. Machine Learning Based Classification of Welded Components. In Proceedings of the 2022 4th International Conference on Circuits, Control, Communication and Computing (I4C), Bangalore, India, 21–23 December 2022; pp. 89–94. [Google Scholar] [CrossRef]
- Jourdan, N.; Biegel, T.; Knauthe, V.; von Buelow, M.; Guthe, S.; Metternich, J. A computer vision system for saw blade condition monitoring. Procedia CIRP 2021, 104, 1107–1112. [Google Scholar] [CrossRef]
- Deshpande, A.M.; Minai, A.A.; Kumar, M. One-Shot Recognition of Manufacturing Defects in Steel Surfaces. Procedia Manuf. 2020, 48, 1064–1071. [Google Scholar] [CrossRef]
- Yao, K.; Ortiz, A.; Bonnin-Pascual, F. A DCNN-based arbitrarily-oriented object detector with application to quality control and inspection. Comput. Ind. 2022, 142, 103737. [Google Scholar] [CrossRef]
- Prakash, N.; Nieberl, D.; Mayer, M.; Schuster, A. Learning defects from aircraft NDT data. NDT E Int. 2023, 138, 102885. [Google Scholar] [CrossRef]
- Edris, M.Z.B.; Jawad, M.; Zakaria, Z. Surface defect detection and Neural Network recognition of automotive body panels. In Proceedings of the 2015 IEEE International Conference on Control System, Computing and Engineering (ICCSCE), Penang, Malaysia, 27–29 November 2015; pp. 117–122. [Google Scholar] [CrossRef]
- Dasari, S.K.; Cheddad, A.; Palmquist, J. Melt-Pool Defects Classification for Additive Manufactured Components in Aerospace Use-Case. In Proceedings of the 2020 7th International Conference on Soft Computing & Machine Intelligence (ISCMI), Stockholm, Sweden, 14–15 November 2020; pp. 249–254. [Google Scholar] [CrossRef]
- Wang, D.; Dou, W.; Ou, Y.; Yang, Y.; Tan, C.; Zhang, Y. Characteristics of droplet spatter behavior and process-correlated mapping model in laser powder bed fusion. J. Mater. Res. Technol. 2021, 12, 1051–1064. [Google Scholar] [CrossRef]
- Meister, S.; Wermes, M.; Stüve, J.; Groves, R.M. Cross-evaluation of a parallel operating SVM – CNN classifier for reliable internal decision-making processes in composite inspection. J. Manuf. Syst. 2021, 60, 620–639. [Google Scholar] [CrossRef]
- Gerdes, N.; Hoff, C.; Hermsdorf, J.; Kaierle, S.; Overmeyer, L. Snapshot hyperspectral imaging for quality assurance in Laser Powder Bed Fusion. Procedia CIRP 2020, 94, 25–28. [Google Scholar] [CrossRef]
- Ogunsanya, M.; Isichei, J.; Parupelli, S.K.; Desai, S.; Cai, Y. In-situ Droplet Monitoring of Inkjet 3D Printing Process using Image Analysis and Machine Learning Models. Procedia Manuf. 2021, 53, 427–434. [Google Scholar] [CrossRef]
- Roux, L.L.; Liu, C.; Ji, Z.; Kerfriden, P.; Gage, D.; Feyer, F.; Körner, C.; Bigot, S. Automatised quality assessment in additive layer manufacturing using layer-by-layer surface measurements and deep learning. Procedia CIRP 2021, 99, 342–347. [Google Scholar] [CrossRef]
- Tikhomirov, E.; Åhlén, M.; Strømme, M.; Lindh, J. In situ thermal image analysis of selective laser sintering for oral dosage form manufacturing. J. Pharm. Biomed. Anal. 2023, 231, 115396. [Google Scholar] [CrossRef]
- Fischer, F.G.; Zimmermann, M.G.; Praetzsch, N.; Knaak, C. Monitoring of the powder bed quality in metal additive manufacturing using deep transfer learning. Mater. Des. 2022, 222, 111029. [Google Scholar] [CrossRef]
- Schwerz, C.; Nyborg, L. A neural network for identification and classification of systematic internal flaws in laser powder bed fusion. CIRP J. Manuf. Sci. Technol. 2022, 37, 312–318. [Google Scholar] [CrossRef]
- Tu, Y.; Liu, Z.; Carneiro, L.; Ryan, C.M.; Parnell, A.C.; Leen, S.B.; Harrison, N.M. Towards an instant structure-property prediction quality control tool for additive manufactured steel using a crystal plasticity trained deep learning surrogate. Mater. Des. 2022, 213, 110345. [Google Scholar] [CrossRef]
- Tian, Q.; Guo, S.; Melder, E.; Bian, L.; Guo, W. Deep Learning-Based Data Fusion Method for In Situ Porosity Detection in Laser-Based Additive Manufacturing. J. Manuf. Sci. Eng. 2020, 143, 041011. [Google Scholar] [CrossRef]
- Bellens, S.; Probst, G.M.; Janssens, M.; Vandewalle, P.; Dewulf, W. Evaluating conventional and deep learning segmentation for fast X-ray CT porosity measurements of polymer laser sintered AM parts. Polym. Test. 2022, 110, 107540. [Google Scholar] [CrossRef]
- Silva, L.H.d.S.; Azevedo, G.O.d.A.; Fernandes, B.J.T.; Bezerra, B.L.D.; Lima, E.B.; Oliveira, S.C. Automatic Optical Inspection for Defective PCB Detection Using Transfer Learning. In Proceedings of the 2019 IEEE Latin American Conference on Computational Intelligence (LA-CCI), Guayaquil, Ecuador, 11–15 November 2019; pp. 1–6. [Google Scholar] [CrossRef]
- Ieracitano, C.; Paviglianiti, A.; Campolo, M.; Hussain, A.; Pasero, E.; Morabito, F.C. A novel automatic classification system based on hybrid unsupervised and supervised machine learning for electrospun nanofibers. IEEE/CAA J. Autom. Sin. 2021, 8, 64–76. [Google Scholar] [CrossRef]
- Thielen, N.; Jiang, Z.; Schmidt, K.; Seidel, R.; Voigt, C.; Reinhardt, A.; Franke, J. Clustering of Image Data to Enhance Machine Learning Based Quality Control in THT Manufacturing. In Proceedings of the 2021 IEEE 27th International Symposium for Design and Technology in Electronic Packaging (SIITME), Timisoara, Romania, 27–30 October 2021; pp. 287–291. [Google Scholar] [CrossRef]
- Lakhe, M.; Shinghare, P. Stitching Micro Images of PCB’s using Computer Vision System. In Proceedings of the 2022 International Conference on Signal and Information Processing (IConSIP), Pune, India, 26–27 August 2022; pp. 1–5. [Google Scholar] [CrossRef]
- Jarndal, A.; Mahmoud, M.S.; Mohammad Abbas, O. Fault Detection and Identification Based on Image Processing and Deep Learning. In Proceedings of the 2022 Advances in Science and Engineering Technology International Conferences (ASET), Dubai, United Arab Emirates, 21–24 February 2022; pp. 1–4. [Google Scholar] [CrossRef]
- Maggipinto, M.; Beghi, A.; Susto, G.A. A Deep Learning-based Approach to Anomaly Detection with 2-Dimensional Data in Manufacturing. In Proceedings of the 2019 IEEE 17th International Conference on Industrial Informatics (INDIN), Helsinki, Finland, 22–25 July 2019; Volume 1, pp. 187–192. [Google Scholar] [CrossRef]
- Zhang, Q.; Zhang, M.; Gamanayake, C.; Yuen, C.; Geng, Z.; Jayasekaraand, H.; Zhang, X.; Woo, C.W.; Low, J.; Liu, X. Deep Learning Based Defect Detection for Solder Joints on Industrial X-ray Circuit Board Images. In Proceedings of the 2020 IEEE 18th International Conference on Industrial Informatics (INDIN), Warwick, UK, 20–23 July 2020; Volume 1, pp. 74–79. [Google Scholar] [CrossRef]
- Ferraro, A.; Galli, A.; Moscato, V.; Sperlí, G. A novel approach for predictive maintenance combining GAF encoding strategies and deep networks. In Proceedings of the 2020 IEEE 6th International Conference on Dependability in Sensor, Cloud and Big Data Systems and Application (DependSys), Nadi, Fiji, 14–16 December 2020; pp. 127–132. [Google Scholar] [CrossRef]
- Vater, J.M.; Gruber, F.; Grählert, W.; Schneider, S.; Knoll, A.C. Prediction of Coating Adhesion on Laser-Cleaned Metal Surfaces of Battery Cells Using Hyperspectral Imaging and Machine Learning. Coatings 2021, 11, 1388. [Google Scholar] [CrossRef]
- Tiwari, D.; Miller, D.; Farnsworth, M.; Lambourne, A.; Jewell, G.W.; Tiwari, A. Inspection of Enamel Removal Using Infrared Thermal Imaging and Machine Learning Techniques. Sensors 2023, 23, 3977. [Google Scholar] [CrossRef]
- Long, Z.; Zhou, X.; Zhang, X.; Wang, R.; Wu, X. Recognition and Classification of Wire Bonding Joint via Image Feature and SVM Model. IEEE Trans. Compon. Packag. Manuf. Technol. 2019, 9, 998–1006. [Google Scholar] [CrossRef]
- Nguyen, V.H.; Pham, V.H.; Cui, X.; Ma, M.; Kim, H. Design and evaluation of features and classifiers for OLED panel defect recognition in machine vision. J. Inf. Telecommun. 2017, 1, 334–350. [Google Scholar] [CrossRef]
- Nguyen, H.G.; Franke, J. Deep learning-based optical inspection of rigid and deformable linear objects in wiring harnesses. Procedia CIRP 2021, 104, 1765–1770. [Google Scholar] [CrossRef]
- Schlosser, T.; Beuth, F.; Friedrich, M.; Kowerko, D. A Novel Visual Fault Detection and Classification System for Semiconductor Manufacturing Using Stacked Hybrid Convolutional Neural Networks. In Proceedings of the 2019 24th IEEE International Conference on Emerging Technologies and Factory Automation (ETFA), Zaragoza, Spain, 10–13 September 2019; pp. 1511–1514. [Google Scholar] [CrossRef]
- Deng, M.; Zhang, Q.; Zhang, K.; Li, H.; Zhang, Y.; Cao, W. A Novel Defect Inspection System Using Convolutional Neural Network for MEMS Pressure Sensors. J. Imaging 2022, 8, 268. [Google Scholar] [CrossRef] [PubMed]
- Tao, X.; Wang, Z.; Zhang, Z.; Zhang, D.; Xu, D.; Gong, X.; Zhang, L. Wire Defect Recognition of Spring-Wire Socket Using Multitask Convolutional Neural Networks. IEEE Trans. Compon. Packag. Manuf. Technol. 2018, 8, 689–698. [Google Scholar] [CrossRef]
- Hu, B.; Wang, J. Detection of PCB Surface Defects With Improved Faster-RCNN and Feature Pyramid Network. IEEE Access 2020, 8, 108335–108345. [Google Scholar] [CrossRef]
- Tham, M.L.; Chong, B.Y.; Tan, Y.H.; Wong, Y.K.; Chean, S.L.; Tan, W.K. Optimizing Deep Learning Inference to Detect PCB Soldering Defects. In Proceedings of the 2022 IEEE International Conference on Artificial Intelligence in Engineering and Technology (IICAIET), Kota Kinabalu, Malaysia, 13–15 September 2022; pp. 1–5. [Google Scholar] [CrossRef]
- Jiang, M.; Yu, M.; Li, B.; Zhang, H.; Zhu, Z. Al-Sn-Al Bonding Strength Investigation Based on Deep Learning Model. Processes 2022, 10, 1899. [Google Scholar] [CrossRef]
- Bhattacharya, A.; Cloutier, S.G. End-to-end deep learning framework for printed circuit board manufacturing defect classification. Sci. Rep. 2022, 12, 12559. [Google Scholar] [CrossRef]
- Duongthipthewa, O.; Meesublak, K.; Takahashi, A.; Mitsantisuk, C. Detection Welding Performance of Industrial Robot Using Machine Learning. In Proceedings of the 2023 International Technical Conference on Circuits/Systems, Computers, and Communications (ITC-CSCC), Jeju, Republic of Korea, 25–28 June 2023; pp. 1–6. [Google Scholar] [CrossRef]
- Knap, P.; Lalik, K.; Bałazy, P. Boosted Convolutional Neural Network Algorithm for the Classification of the Bearing Fault form 1-D Raw Sensor Data. Sensors 2023, 23, 4295. [Google Scholar] [CrossRef]
- Kiangala, K.S.; Wang, Z. An Effective Predictive Maintenance Framework for Conveyor Motors Using Dual Time-Series Imaging and Convolutional Neural Network in an Industry 4.0 Environment. IEEE Access 2020, 8, 121033–121049. [Google Scholar] [CrossRef]
- Xu, L.; Lv, S.; Deng, Y.; Li, X. A Weakly Supervised Surface Defect Detection Based on Convolutional Neural Network. IEEE Access 2020, 8, 42285–42296. [Google Scholar] [CrossRef]
- Oh, S.; Cha, J.; Kim, D.; Jeong, J. Quality Inspection of Casting Product Using CAE and CNN. In Proceedings of the 2020 4th International Conference on Imaging, Signal Processing and Communications (ICISPC), Kumamoto, Japan, 23–25 October 2020; pp. 34–38. [Google Scholar] [CrossRef]
- Mandapaka, S.; Diaz, C.; Irisson, H.; Akundi, A.; Lopez, V.; Timmer, D. Application of Automated Quality Control in Smart Factories—A Deep Learning-based Approach. In Proceedings of the 2023 IEEE International Systems Conference (SysCon), Vancouver, BC, Canada, 17–20 April 2023; pp. 1–8. [Google Scholar] [CrossRef]
- OOI, J.; TAY, L.C.; LAI, W.K. Bottom-hat filtering for Defect Detection with CNN Classification on Car Wiper Arm. In Proceedings of the 2019 IEEE 15th International Colloquium on Signal Processing & Its Applications (CSPA), Penang, Malaysia, 8–9 March 2019; pp. 90–95. [Google Scholar] [CrossRef]
- Aydemir, G.; Paynabar, K. Image-Based Prognostics Using Deep Learning Approach. IEEE Trans. Ind. Inform. 2020, 16, 5956–5964. [Google Scholar] [CrossRef]
- Kullu, O.; Cinar, E. A Deep-Learning-Based Multi-Modal Sensor Fusion Approach for Detection of Equipment Faults. Machines 2022, 10, 1105. [Google Scholar] [CrossRef]
- Lee, S.Y.; Tama, B.A.; Choi, C.; Hwang, J.Y.; Bang, J.; Lee, S. Spatial and Sequential Deep Learning Approach for Predicting Temperature Distribution in a Steel-Making Continuous Casting Process. IEEE Access 2020, 8, 21953–21965. [Google Scholar] [CrossRef]
- Chakrabarti, A.; Sukumar, R.P.; Jarke, M.; Rudack, M.; Buske, P.; Holly, C. Efficient Modeling of Digital Shadows for Production Processes: A Case Study for Quality Prediction in High Pressure Die Casting Processes. In Proceedings of the 2021 IEEE 8th International Conference on Data Science and Advanced Analytics (DSAA), Porto, Portugal, 6–9 October 2021; pp. 1–9. [Google Scholar] [CrossRef]
- Sundaram, S.; Zeid, A. Artificial Intelligence-Based Smart Quality Inspection for Manufacturing. Micromachines 2023, 14, 570. [Google Scholar] [CrossRef]
- Hu, Z.; Yin, Z.; Qin, L.; Xu, F. A Novel Method of Fault Diagnosis for Injection Molding Systems Based on Improved VGG16 and Machine Vision. Sustainability 2022, 14, 4280. [Google Scholar] [CrossRef]
- Tan, L.B.; Nhat, N.D.P. Prediction and Optimization of Process Parameters for Composite Thermoforming Using a Machine Learning Approach. Polymers 2022, 14, 2838. [Google Scholar] [CrossRef]
- Sajitha, N.; Priya, S.P. Artificial Intelligence based Optimization with Extreme Gradient Boosting for Fabric Defect Detection and Classification Model. In Proceedings of the 2023 International Conference on Sustainable Computing and Data Communication Systems (ICSCDS), Erode, India, 23–25 March 2023; pp. 509–515. [Google Scholar] [CrossRef]
- Kim, H.; Jung, W.K.; Park, Y.C.; Lee, J.W.; Ahn, S.H. Broken stitch detection method for sewing operation using CNN feature map and image-processing techniques. Expert Syst. Appl. 2022, 188, 116014. [Google Scholar] [CrossRef]
- Yu, W.; Lai, D.; Liu, H.; Li, Z. Research on CNN Algorithm for Monochromatic Fabric Defect Detection. In Proceedings of the 2021 6th International Conference on Image, Vision and Computing (ICIVC), Qingdao, China, 23–25 July 2021; pp. 20–25. [Google Scholar] [CrossRef]
- Gonzalez, D.G.; Castilla, Y.C.; Shaharadaby, S.; Mackay, A.; Soares, L.; Guimarães, P.; Morais, F.; Puga, J.; Meneses, F.; Moreira, A.; et al. A Ubiquitous Service-Oriented Automatic Optical Inspection Platform for Textile Industry. Procedia Comput. Sci. 2022, 196, 217–225. [Google Scholar] [CrossRef]
- Liu, Z.; Zhang, C.; Li, C.; Ding, S.; Dong, Y.; Huang, Y. Fabric defect recognition using optimized neural networks. J. Eng. Fibers Fabr. 2019, 14, 1558925019897396. [Google Scholar] [CrossRef]
- Yıldız, K.; Buldu, A.; Demetgul, M. A thermal-based defect classification method in textile fabrics with K-nearest neighbor algorithm. J. Ind. Text. 2016, 45, 780–795. [Google Scholar] [CrossRef]
- Pahwa, R.S.; Nwe, T.L.; Chang, R.; Jie, W.; Min, O.Z.; Ho, S.W.; Qin, R.; Rao, V.S.; Yang, Y.; Neumann, J.T.; et al. Deep Learning Analysis of 3D X-ray Images for Automated Object Detection and Attribute Measurement of Buried Package Features. In Proceedings of the 2020 IEEE 22nd Electronics Packaging Technology Conference (EPTC), Erode, India, 23–25 March 2020; pp. 221–227. [Google Scholar]
- Tatu, S.I.; Singh, S.K.; Bansod, S.; Pal, P. Fault Detection In Bottle Caps And Label Alignment Using Convolutional Neural Network. In Proceedings of the 2023 Third International Conference on Advances in Electrical, Computing, Communication and Sustainable Technologies (ICAECT), Bhilai, India, 5–6 January 2023; pp. 1–5. [Google Scholar] [CrossRef]
- Malesa, M.; Rajkiewicz, P. Quality Control of PET Bottles Caps with Dedicated Image Calibration and Deep Neural Networks. Sensors 2021, 21, 501. [Google Scholar] [CrossRef] [PubMed]
- Ke, M.; Lin, C.; Huang, Q. Anomaly detection of Logo images in the mobile phone using convolutional autoencoder. In Proceedings of the 2017 4th International Conference on Systems and Informatics (ICSAI), Hangzhou, China, 11–13 November 2017; pp. 1163–1168. [Google Scholar] [CrossRef]
- Jarkas, O.; Hall, J.; Smith, S.; Mahmud, R.; Khojasteh, P.; Scarsbrook, J.; Ko, R.K. ResNet and Yolov5-enabled non-invasive meat identification for high-accuracy box label verification. Eng. Appl. Artif. Intell. 2023, 125, 106679. [Google Scholar] [CrossRef]
- Horputra, P.; Phrajonthong, R.; Kaewprapha, P. Deep Learning-Based Bottle Caps Inspection in Beverage Manufacturing and Packaging Process. In Proceedings of the 2021 9th International Electrical Engineering Congress (iEECON), Pattaya, Thailand, 10–12 March 2021; pp. 499–502. [Google Scholar] [CrossRef]
- Bin Roslan, M.I.; Ibrahim, Z.; Aziz, Z.A. Real-Time Plastic Surface Defect Detection Using Deep Learning. In Proceedings of the 2022 IEEE 12th Symposium on Computer Applications & Industrial Electronics (ISCAIE), Penang, Malaysia, 21–22 May 2022; pp. 111–116. [Google Scholar] [CrossRef]
- Zipfel, J.; Verworner, F.; Fischer, M.; Wieland, U.; Kraus, M.; Zschech, P. Anomaly detection for industrial quality assurance: A comparative evaluation of unsupervised deep learning models. Comput. Ind. Eng. 2023, 177, 109045. [Google Scholar] [CrossRef]
- Loddo, A.; Di Ruberto, C.; Armano, G.; Manconi, A. Automatic Monitoring Cheese Ripeness Using Computer Vision and Artificial Intelligence. IEEE Access 2022, 10, 122612–122626. [Google Scholar] [CrossRef]
- Juncker, M.; Khriss, I.; Brousseau, J.; Pigeon, S.; Darisse, A.; Lapointe, B. A Deep Learning-Based Approach for Quality Control and Defect Detection for Industrial Bagging Systems. In Proceedings of the 2020 IEEE 19th International Conference on Cognitive Informatics & Cognitive Computing (ICCI*CC), Beijing, China, 26–28 September 2020; pp. 60–67. [Google Scholar] [CrossRef]
- Hamim, M.A.; Tahseen, J.; Hossain, K.M.I.; Akter, N.; Asha, U.F.T. Bangladeshi Fresh-Rotten Fruit & Vegetable Detection Using Deep Learning Deployment in Effective Application. In Proceedings of the 2023 IEEE 3rd International Conference on Computer Communication and Artificial Intelligence (CCAI), Taiyuan, China, 26–28 May 2023; pp. 233–238. [Google Scholar] [CrossRef]
- Rezagholi, F.; Hesarinejad, M.A. Integration of fuzzy logic and computer vision in intelligent quality control of celiac-friendly products. Procedia Comput. Sci. 2017, 120, 325–332. [Google Scholar] [CrossRef]
- Fazel-Niari, Z.; Afkari-Sayyah, A.H.; Abbaspour-Gilandeh, Y.; Herrera-Miranda, I.; Hernández-Hernández, J.L.; Hernández-Hernández, M. Quality Assessment of Components of Wheat Seed Using Different Classifications Models. Appl. Sci. 2022, 12, 4133. [Google Scholar] [CrossRef]
- Hu, Q.; Sellers, C.; Kwon, J.S.I.; Wu, H.J. Integration of surface-enhanced Raman spectroscopy (SERS) and machine learning tools for coffee beverage classification. Digit. Chem. Eng. 2022, 3, 100020. [Google Scholar] [CrossRef]
- Lopes, J.F.; Ludwig, L.; Barbin, D.F.; Grossmann, M.V.E.; Barbon, S. Computer Vision Classification of Barley Flour Based on Spatial Pyramid Partition Ensemble. Sensors 2019, 19, 2953. [Google Scholar] [CrossRef]
- Kosmowski, F.; Worku, T. Evaluation of a miniaturized NIR spectrometer for cultivar identification: The case of barley, chickpea and sorghum in Ethiopia. PLoS ONE 2018, 13, e0193620. [Google Scholar] [CrossRef] [PubMed]
- Ghasemi-Varnamkhasti, M.; Goli, R.; Forina, M.; Mohtasebi, S.S.; Shafiee, S.; Naderi-Boldaji, M. Application of Image Analysis Combined with Computational Expert Approaches for Shrimp Freshness Evaluation. Int. J. Food Prop. 2016, 19, 2202–2222. [Google Scholar] [CrossRef]
- Angel, L.; Lizcano, S.; Viola, J. Assessing the state of maturation of the pineapple in its perolera variety using computer vision techniques. In Proceedings of the 2015 20th Symposium on Signal Processing, Images and Computer Vision (STSIVA), Bogota, Colombia, 2–4 September 2015; pp. 1–6. [Google Scholar] [CrossRef]
- De Souza, J.H.R.; de Moraes-Neto, V.F.; Cassol, G.Z.; dos Santos Camelo, M.C.; da Silva, L.K.S. Use of colorimetric data and artificial neural networks for the determination of freshness in fish. Food Chem. Adv. 2022, 1, 100129. [Google Scholar] [CrossRef]
- Baiocco, G.; Almonti, D.; Guarino, S.; Tagliaferri, F.; Tagliaferri, V.; Ucciardello, N. Image-based system and artificial neural network to automate a quality control system for cherries pitting process. Procedia CIRP 2020, 88, 527–532. [Google Scholar] [CrossRef]
- Cernadas, E.; Fernández-Delgado, M.; Fulladosa, E.; Muñoz, I. Automatic marbling prediction of sliced dry-cured ham using image segmentation, texture analysis and regression. Expert Syst. Appl. 2022, 206, 117765. [Google Scholar] [CrossRef]
- Urbonas, A.; Raudonis, V.; Maskeliūnas, R.; Damaševičius, R. Automated Identification of Wood Veneer Surface Defects Using Faster Region-Based Convolutional Neural Network with Data Augmentation and Transfer Learning. Appl. Sci. 2019, 9, 4898. [Google Scholar] [CrossRef]
- Guo, Y.; Zeng, Y.; Gao, F.; Qiu, Y.; Zhou, X.; Zhong, L.; Zhan, C. Improved YOLOV4-CSP Algorithm for Detection of Bamboo Surface Sliver Defects With Extreme Aspect Ratio. IEEE Access 2022, 10, 29810–29820. [Google Scholar] [CrossRef]
- Vargas, V.M.; Gutiérrez, P.A.; Rosati, R.; Romeo, L.; Frontoni, E.; Hervás-Martínez, C. Exponential loss regularisation for encouraging ordinal constraint to shotgun stocks quality assessment. Appl. Soft Comput. 2023, 138, 110191. [Google Scholar] [CrossRef]
- Vargas, V.M.; Gutiérrez, P.A.; Rosati, R.; Romeo, L.; Frontoni, E.; Hervás-Martínez, C. Deep learning based hierarchical classifier for weapon stock aesthetic quality control assessment. Comput. Ind. 2023, 144, 103786. [Google Scholar] [CrossRef]
- Zabulis, L.; Lipnickas, A.; Augustauskas, R. Application of computer vision methods for automated wooden planks length measurement. In Proceedings of the 2022 18th Biennial Baltic Electronics Conference (BEC), Tallinn, Estonia, 4–6 October 2022; pp. 1–6. [Google Scholar] [CrossRef]
- Konstantopoulos, G.; Koumoulos, E.P.; Charitidis, C.A. Classification of mechanism of reinforcement in the fiber-matrix interface: Application of Machine Learning on nanoindentation data. Mater. Des. 2020, 192, 108705. [Google Scholar] [CrossRef]
- Li, H.C.; Tsai, M.C.; Lee, T.X. A Stray Light Detection Model for VR Head-Mounted Display Based on Visual Perception. Appl. Sci. 2022, 12, 6311. [Google Scholar] [CrossRef]
- Taseva, A.R.; Persoons, T.; D’Arcy, D.M. Application of an AI image analysis and classification approach to characterise dissolution and precipitation events in the flow through apparatus. Eur. J. Pharm. Biopharm. 2023, 189, 36–47. [Google Scholar] [CrossRef] [PubMed]
- Byvshev, P.; Truong, P.A.; Xiao, Y. Image-Based Renovation Progress Inspection with Deep Siamese Networks. In ICMLC ’20: Proceedings of the 2020 12th International Conference on Machine Learning and Computing; Association for Computing Machinery: New York, NY, USA, 2020; pp. 96–104. [Google Scholar] [CrossRef]
- Jiang, T.; Hu, X.J.; Yao, X.H.; Tu, L.P.; Huang, J.B.; Ma, X.X.; Cui, J.; Wu, Q.F.; Xu, J.T. Tongue image quality assessment based on a deep convolutional neural network. BMC Med. Inform. Decis. Mak. 2021, 21, 147. [Google Scholar] [CrossRef]
- Riedel, H.; Mokdad, S.; Schulz, I.; Kocer, C.; Rosendahl, P.L.; Schneider, J.; Kraus, M.A.; Drass, M. Automated quality control of vacuum insulated glazing by convolutional neural network image classification. Autom. Constr. 2022, 135, 104144. [Google Scholar] [CrossRef]
- Lin, Y.H.; Ting, Y.H.; Huang, Y.C.; Cheng, K.L.; Jong, W.R. Integration of Deep Learning for Automatic Recognition of 2D Engineering Drawings. Machines 2023, 11, 802. [Google Scholar] [CrossRef]
- Qin, F.; Liu, D.; Sun, B.; Ruan, L.; Ma, Z.; Wang, H. Identification of Alfalfa Leaf Diseases Using Image Recognition Technology. PLoS ONE 2016, 11, e0168274. [Google Scholar] [CrossRef]
- Ban, G.; Yoo, J. RT-SPeeDet: Real-Time IP–CNN-Based Small Pit Defect Detection for Automatic Film Manufacturing Inspection. Appl. Sci. 2021, 11, 9632. [Google Scholar] [CrossRef]
- Tayeh, T.; Aburakhia, S.; Myers, R.; Shami, A. Distance-Based Anomaly Detection for Industrial Surfaces Using Triplet Networks. In Proceedings of the 2020 11th IEEE Annual Information Technology, Electronics and Mobile Communication Conference (IEMCON), Vancouver, BC, Canada, 4–7 November 2020; pp. 0372–0377. [Google Scholar] [CrossRef]
- Antoniadi, A.M.; Du, Y.; Guendouz, Y.; Wei, L.; Mazo, C.; Becker, B.A.; Mooney, C. Current Challenges and Future Opportunities for XAI in Machine Learning-Based Clinical Decision Support Systems: A Systematic Review. Appl. Sci. 2021, 11, 5088. [Google Scholar] [CrossRef]


| Metrics | Formula | Evaluation Focus | Source |
|---|---|---|---|
| Accuracy (acc) | In general, the accuracy metric measures the ratio of correct predictions over the total number of instances evaluated. | [11] | |
| Precision (p) | Precision is used to measure the positive patterns that are correctly predicted from the total predicted patterns in a positive class. | [11] | |
| Recall (r) | Recall is used to measure the fraction of positive patterns that are correctly classified. | [11] | |
| F Measure (F1) | This metric represents the harmonic mean between recall and precision values. | [11] | |
| Intersection over Union (IoU) | IoU is one of the most commonly used metrics in semantic segmentation or object detection. It is defined as the area of intersection between the predicted segmentation map and the ground truth, which is divided by the area of union between the predicted segmentation map and the ground truth. | [12] | |
| Dice Coefficient | The cice coefficient is another popular metric for image segmentation, which can be defined as twice the overlap area of the predicted and ground truth maps divided by the total number of pixels in both images. The dice coefficient is very similar to the IoU. | [12] | |
| Mean Absolute Error (MAE) | For regression tasks often found in quality assurance scenarios, the use of metrics like the mean absolute error (MAE) is paramount. These metrics quantify the differences between predicted and actual continuous values, regardless of the direction. | [13] | |
| Mean Squared Error (MSE) | The MSE is also used for regression tasks and has a greater penalty for large error. | [13] | |
| Root Mean Squared Error (RMSE) | The RMSE is another commonly used metric for evaluating the performance of regression models. It is closely related to the MSE, but it gives more weight to larger errors due to the square root operation. | [14] |
| ID | Inclusion Criteria |
| 1 | Searching with the search string only within the abstract. |
| 2 | The full text of the returned studies is accessible. |
| 3 | The literature is written in English. |
| 4 | Searching with the search string only within the abstract. |
| 5 | The literature was published between 2015–2023. |
| ID | Exclusion Criteria |
| 1 | The literature is a review. |
| 2 | The context of quality assurance, manufacturing, AI, or vision is missing. |
| Database | Results after Search String Query | Results after Applying Selection Criteria |
|---|---|---|
| IEEE Xplore | 117 | 64 |
| Science Direct | 74 | 41 |
| ACM Digital Library | 4 | 1 |
| MDPI | 65 | 30 |
| Scopus | 80 | 9 |
| Total | 340 | 143 |
| Survey | Scope, Results, Direction |
|---|---|
| [5] | Scope:
|
| [8] | Scope:
|
| [158] | Scope:
|
| Our Study | Scope:
|
Disclaimer/Publisher’s Note: The statements, opinions and data contained in all publications are solely those of the individual author(s) and contributor(s) and not of MDPI and/or the editor(s). MDPI and/or the editor(s) disclaim responsibility for any injury to people or property resulting from any ideas, methods, instructions or products referred to in the content. |
© 2023 by the authors. Licensee MDPI, Basel, Switzerland. This article is an open access article distributed under the terms and conditions of the Creative Commons Attribution (CC BY) license (https://creativecommons.org/licenses/by/4.0/).
Share and Cite
Hoffmann, R.; Reich, C. A Systematic Literature Review on Artificial Intelligence and Explainable Artificial Intelligence for Visual Quality Assurance in Manufacturing. Electronics 2023, 12, 4572. https://doi.org/10.3390/electronics12224572
Hoffmann R, Reich C. A Systematic Literature Review on Artificial Intelligence and Explainable Artificial Intelligence for Visual Quality Assurance in Manufacturing. Electronics. 2023; 12(22):4572. https://doi.org/10.3390/electronics12224572
Chicago/Turabian StyleHoffmann, Rudolf, and Christoph Reich. 2023. "A Systematic Literature Review on Artificial Intelligence and Explainable Artificial Intelligence for Visual Quality Assurance in Manufacturing" Electronics 12, no. 22: 4572. https://doi.org/10.3390/electronics12224572
APA StyleHoffmann, R., & Reich, C. (2023). A Systematic Literature Review on Artificial Intelligence and Explainable Artificial Intelligence for Visual Quality Assurance in Manufacturing. Electronics, 12(22), 4572. https://doi.org/10.3390/electronics12224572