Abstract
The rise of social networks and the increasing amount of time people spend on them have created a perfect place for the dissemination of false narratives, propaganda, and manipulated content. In order to prevent the spread of disinformation, content moderation is needed. However, manual moderation is unfeasible due to the large amount of daily posts. This paper studies the impact of using different loss functions on a multi-label classification problem with an imbalanced dataset, consisting of 20 persuasion techniques and only 950 samples, provided by SemEval’s 2021 Task 6. We used machine learning models, such as Naive Bayes and Decision Trees, and a custom deep learning architecture, based on DistilBERT and Convolutional Layers. Overall, the machine learning models achieved far worse results than the deep learning model, using Binary Cross Entropy, which we considered our baseline deep learning model. To address the class imbalance problem, we trained our model using different loss functions, such as Focal Loss and Asymmetric Loss. The latter providing the best results, particularly for the least represented classes.
1. Introduction
Social networks have become increasingly popular, and the amount of time people spend on them has made it possible for false information and hate discourse to spread easily. The dissemination of false propaganda and hate speech can be referred to as a persuasion attempt. In 2016 this problem was presented to the public sphere after the USA Presidential Elections, with political campaigns being allegedly pushed into Facebook groups in order to manipulate the users [1].
Researchers have been studying this problem and trying to create systems to automatically detect persuasion attempts. There are multiple ways to approach this challenge, depending on how fine-grained the detection shall be. Although simply detecting the presence of a persuasion attempt is a good start, it does not give us much information about the episode in hand. For that reason, a fine-grained list of persuasion techniques have been proposed such as the one by Da San Martino [2].
When using a list of techniques as robust as the one cited, the problem’s complexity increases. Since these techniques are not mutually exclusive, the problem would now be perceived as a multi-label classification problem. SemEval’s 2021 edition proposed a task [3], alongside a dataset, to address the problem using most of the persuasion techniques proposed by Da San Martino [2]. With a high number of techniques, the annotation process is slower, which can lead to a small number of samples. And in fact, this is true in this dataset, which contains only 950 samples. On top of that, the dataset also suffers from a clear class imbalance.
Scarce data settings with an accentuated class imbalance often lead to poor results, especially for the least represented classes. And because of that, data augmentation is a common approach when facing these constraints. Unfortunately, as there is no ubiquitous list of persuasion techniques, it is very difficult to augment the current data with external datasets. Creating synthetic data can also be problematic due to the underlying complex nature of the original data and its skewed data distribution. An approach that has been suggested to improve the training process of imbalanced datasets [4] is the usage of different loss functions.
In this paper we propose a model architecture for the detection of persuasion attempts on social networks, using an imbalanced dataset, and study how the result of that model is affected by using different loss functions. The structure of the document is as follows: the Section 2 of the paper contains a literature review of the state of the art and an approach to a similar problem. In the Section 3, we explore the work dataset and perform some initial tests on it. The Section 4 contains the model proposal and its parameters. In the Section 5, we present the research results, and in the Section 6, we discuss those and point out possible directions for future work.
2. Literature Review
There are multiple papers tackling multi-label detection of persuasion attempts and hate speech on social networks. In 2019, a group of researchers conducted a study to identify hate speech and abusive language on Indonesian Twitter [5]. They aimed at identifying the hate speech and abusive language (three labels) on a surface level, but also on a deeper level, with the target (five new additional labels) and the strength (three new additional labels). During the study, the researchers conducted two experiments: in the first one they would only identify the hate speech on a surface level, without target and strength, whilst in the second they would classify the hate speech using all the available labels. To tackle the problem, they used Support Vector Machine, Naive Bayes, Random Forest classifiers and problem transformation techniques like Binary Relevance (BR), Label Powerset (LP). The best results were achieved using Random Forests with Label Powerset for both first and second experiment. However, whilst the result of the first experiment is fairly good, with an accuracy of 77.36%, the results for the second experiment were lacking, with an accuracy of only 66.12%. In order to improve the results, the researchers proposed as future work the usage of hierarchical multi-label classification, the re-balancing of the dataset and the usage of word embeddings.
Re-balancing a dataset in a multi-label problem can be quite challenging due to relationships between labels that cannot be discarded. For that reason, popular re-sampling techniques such as SMOTE and Adaptative Synthetic sampling have no use. Augmenting the dataset by collecting more data is also a difficult approach due to the annotation process. One of the strategies proposed [4] to tackle class imbalance in multi-label classification problems is to experiment with different loss functions. The study shows that, although commonly used, Binary Cross Entropy does not provide great results for the least represented classes in an imbalanced multi-label classification problem. By using other loss functions such as Focal Loss and Distributed Balanced Loss, the Micro F1-score of classes present in less than 35 samples and more than eight samples went from 66.28% to 76.16% and 80.25% accuracy, respectively.
The SemEval task we proposed to solve [3] was tackled by many groups with different approaches, although most of them revolved around the use of transformers. Some of those groups [6,7] tried to mitigate the scarcity of data and the class imbalance by augmenting the dataset using different techniques. The results were far from positive, when techniques such as random swap, synonym replacement, random deletion and random insertion were used to augment the dataset, the model’s performance decreased. The back-translation technique was the technique that yielded the best results by slightly improving the model’s performance.
By using an ensemble of five different transformers, MinD [8] achieved the best result with a Micro F1-score of 0.593 on the test set. They were also able to augment the dataset using external data which contained some of the persuasion techniques used. Unlike the other participants, which used Binary Cross Entropy as a loss function, they used Focal Loss. Other teams like Volta [9] and AIMH [10], which were placed in second and fourth, respectively, also used transformers to tackle this task, with one team using BERT and the other using RoBERTa for their final submission.
NLPIITR [7] was one of the few teams to try traditional machine learning models, each separately, and then also using them in an ensemble. However, due to the results on the dev set, they opted for a fine-tuned RoBERTa.
Although traditional machine learning approaches are worth trying, it is clear that they might not suffice as the number of classes increases. More robust pre-trained models might be a better alternative. The idea that the choice of the loss functions plays an important role in the model’s result is reinforced by MinD. Nonetheless, this might not be true since there are a lot of differences between that system and the other SemEval’s models.
3. Problem Study
In this section we inspect the dataset we will be working with (Section 3.1) and we do some initial experiments using NLP (Section 3.2) and ML techniques (Section 3.3).
3.1. Data Analysis
The data we worked with were provided by the SemEval’s 2021 Task 6 [3] organization team. English memes were collected from 26 Facebook groups related to politics, COVID-19,vaccines, and gender equality. The memes were annotated using the persuasion techniques described on Table 1. The annotation process occurred in two phases: In the first phase, each annotator separately annotated a meme; in the second phase, all annotators gathered with a consolidator to discuss and choose the final labels [3].

Table 1.
Statistics about the persuasion techniques.
The annotated dataset consisted of 950 memes: 687 for training, 63 for development, and 200 for testing. The average number of sentences per meme is 1.68, with a maximum of 13 sentences. For the task at hand, only textual elements are considered. Table 1 provides a distribution of labels for the task, listing occurrences by class, ordered from the most frequent to the least represented.
By looking at Table 1, we can spot a clear imbalance between classes, with Loaded Language, Name Calling and Smears appearing on over 25% of the samples while Bandwagon, Irrelevant Data, Confusion, Reductio ad Hitlerum and Repetition are present in less than 2% of the data. This imbalance explains why some models are not able to predict labels such as Bandwagon, Red Herring and Obfuscation, Intentional vagueness, Confusion [6,8].
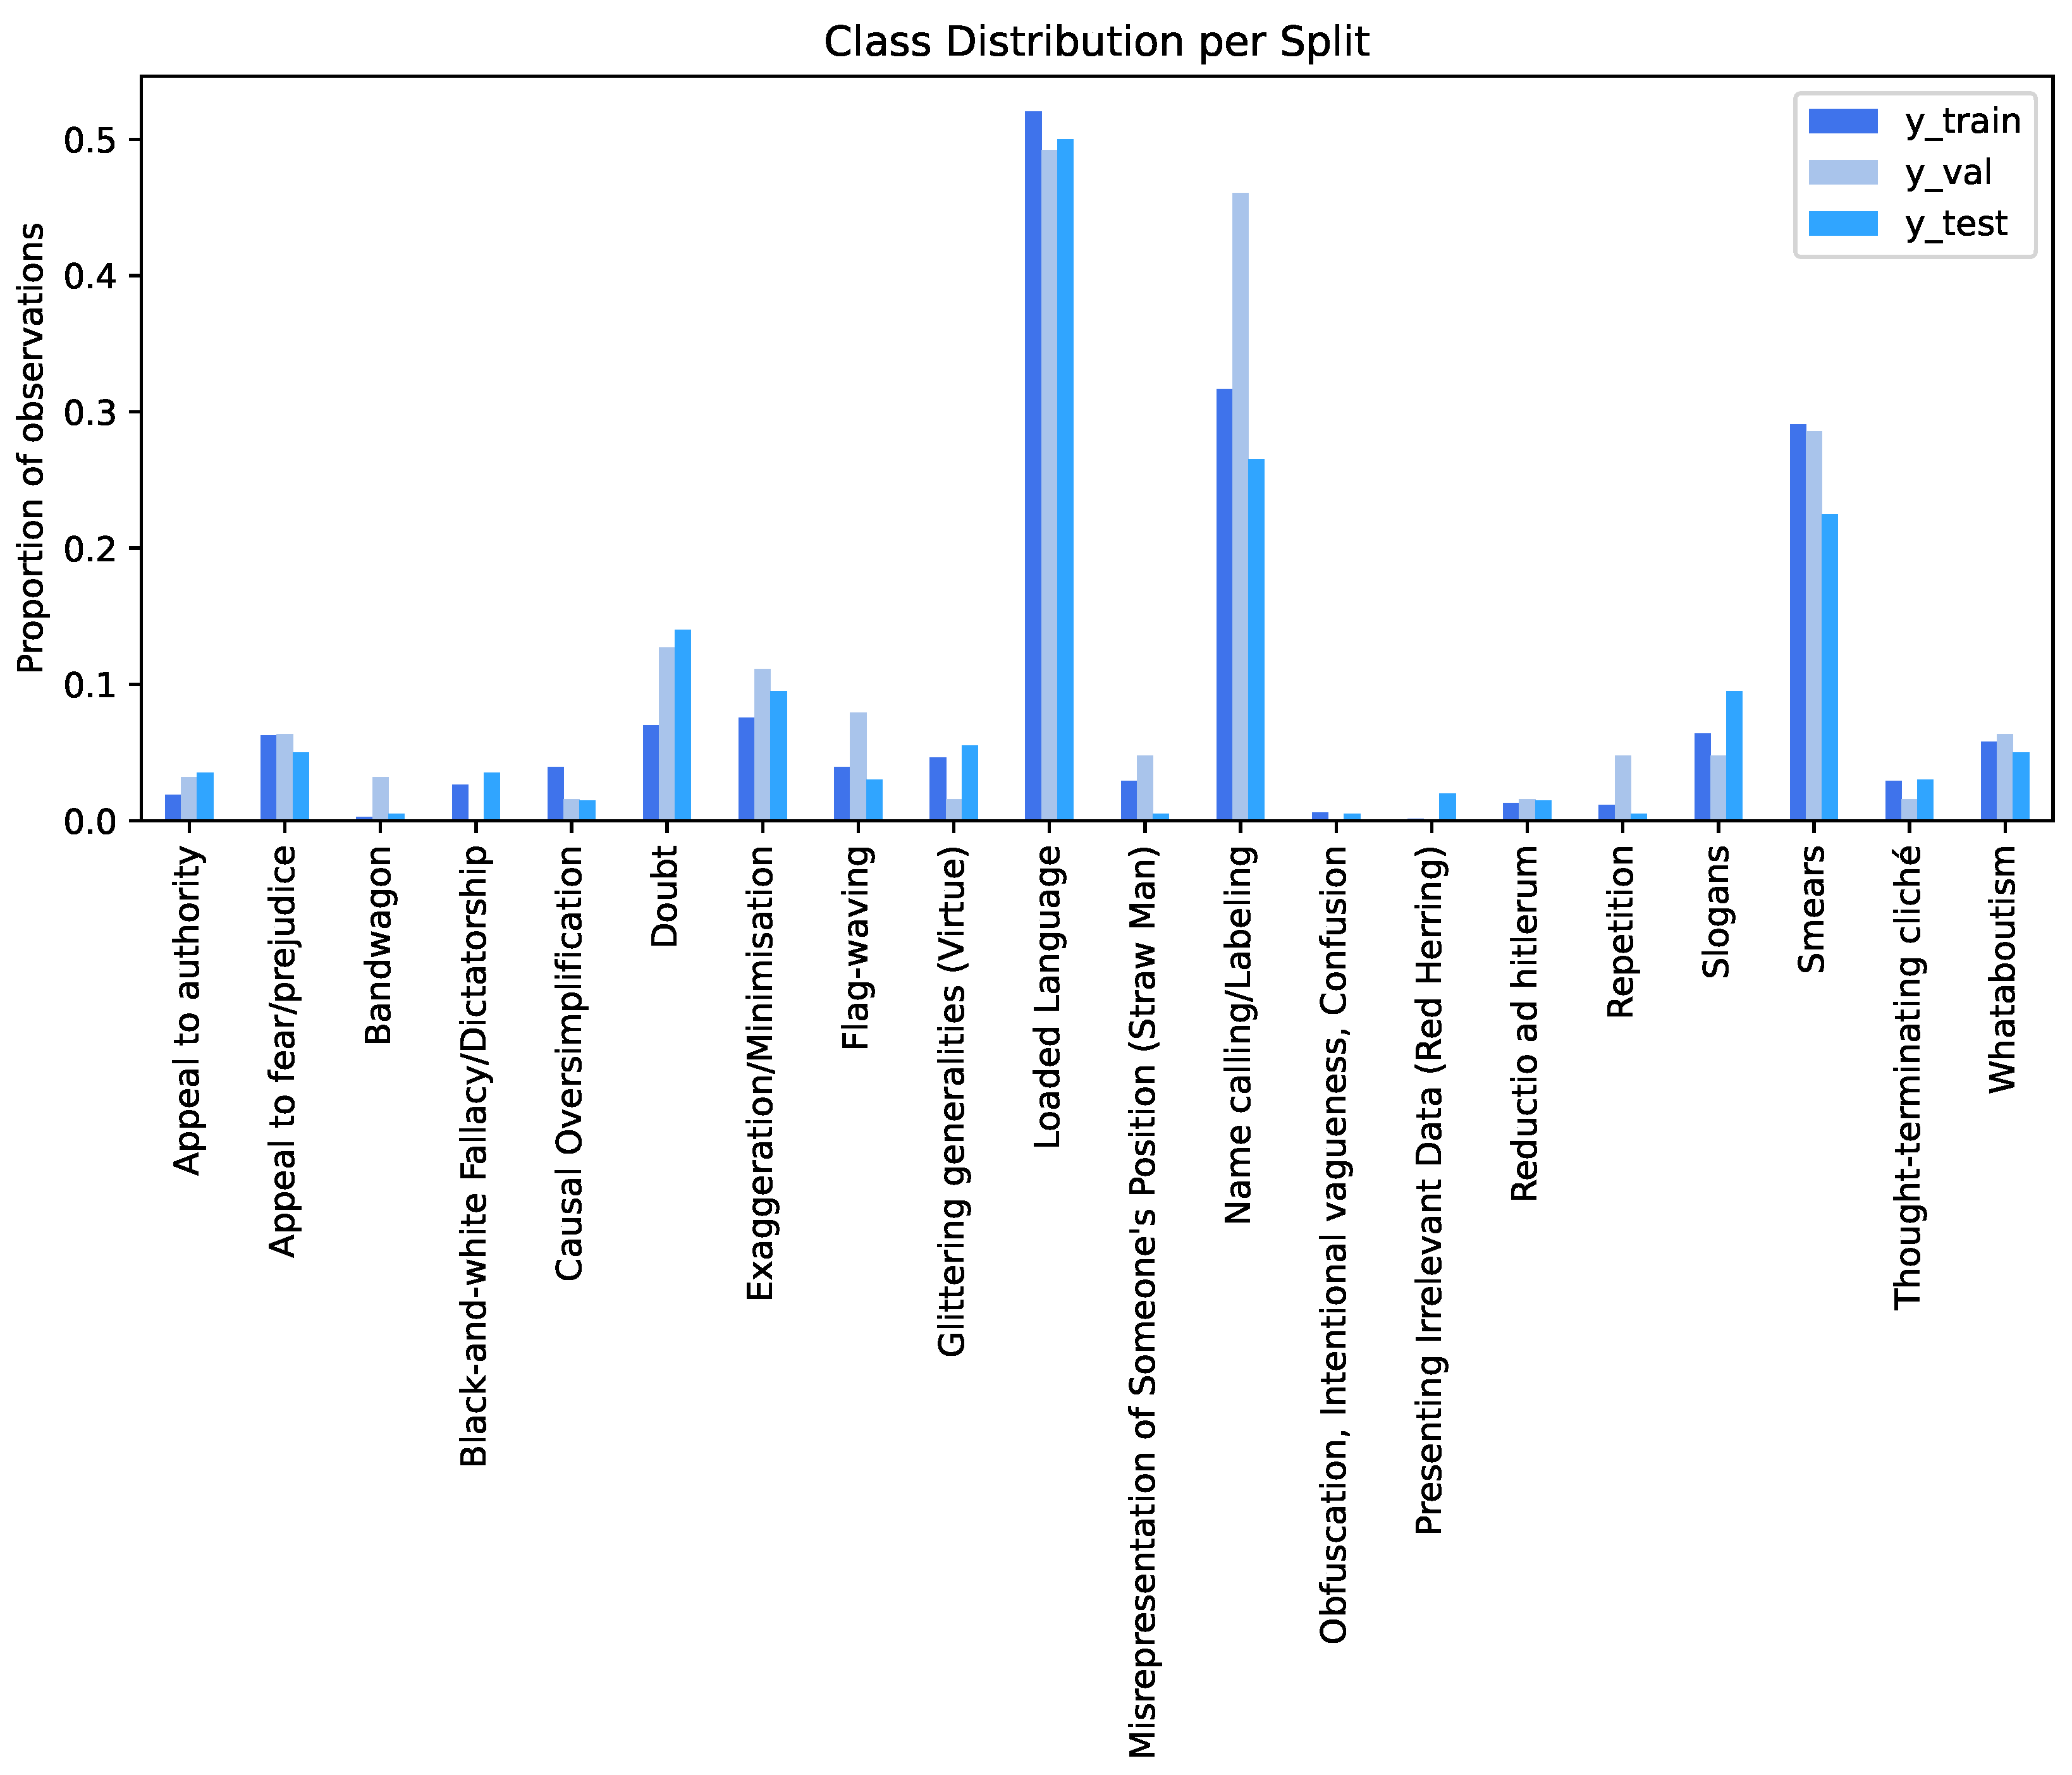
The dataset was distributed in two different phases: Development and test. During the first phase the training and development data were released; however, no gold labels (Y) were released for the latter. During the test phase the labels for the development set were released as well as the test data, without the gold labels. To understand if the datataset’s splits (train, dev/validation, test) are balanced a graphic was plotted (as shown in Figure 1). When looking at it, we realize that not only are the splits are not balanced, but some classes are not even present in certain splits. For instance, Black and white Fallacy, Red Herring and Obfuscation are completely missing from the development/validation split.
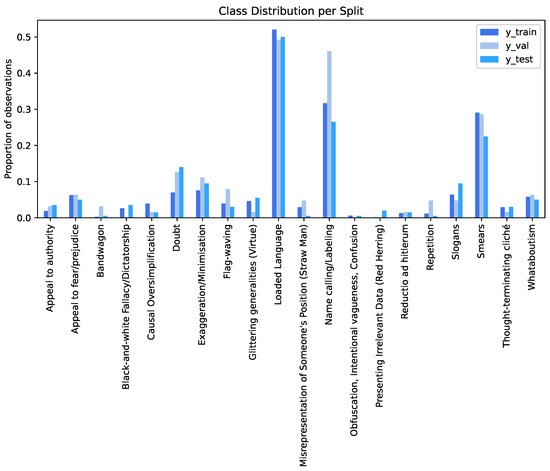
Figure 1.
Class distribution per split on sub-task 1.
The provided dataset is represented in JSON format files. The content of those files is a list of dictionaries. Each dictionary represents a data entry and they consist of three fields: id, labels, and text. The labels represent the predictions (Y), arranged in a list of strings. The text field is a string containing the textual contents of the original meme.
3.2. Data Pre-Processing
Changing the representation of the labels was the first step. Rather than having an unpractical list of strings, we created a list of integers where each position represents a label. If that label is present, we represent it as 1, otherwise 0.
The second step was to implement a data pre-processing pipeline in order to reduce the dataset’s textual elements dimension and complexity. The pipeline has the following steps:
- Case converting;
- Positional Tagging;
- Tokenization;
- Stop-words removal;
- Lemmatization.
The pipeline was implemented using standard Python functions and NLTK. The latter was very helpful for positional tagging, stop-word removal and lemmatization (we used WordNetLemmatizer). The input tokenization was made at word level.
The results of pre-processing are presented on Table 2. The reduction of the corpus dimension stems from the aggregation of words with the same lemma and stop-word removal. That way, only the most meaningful words will be converted to a vector during the feature extraction.
Table 2.
Corpus dimension before and after pre-processing.
3.3. ML Models
After cleaning the data, we trained some models using classical ML approaches. These initial experiments should enable us to better understand the problems posed by the data.
We used both training and dev sets to train the model, and for evaluation, K-fold cross-validation was used with .
The classifier’s parameters were not chosen using advanced techniques, but rather a random search of parameters. Multiple values were tested; however, only the models yielding the best results are presented.
To convert the textual elements into features we used Word2vec. The Gensim library provided a Word2vec model pre-trained on the Google News dataset.
On Table 3 we can observe the results of each machine learning model using the Micro and Macro F1-scores as evaluation metrics.
Table 3.
Results using Word2vec as feature extraction technique.
Binary Relevance and Label Powerset techniques were used in order to model our multi-label problem into smaller binary classification and multiclass classification problems. We thought about also using the Classifier Chains technique; however, we were afraid that due to the class imbalance, this method could introduce severe overfitting for the most represented classes.
We measured the model’s performance for each class using the F1-score metric, which is given by
The overall performance of the model was measured using Macro and Micro F1-score, just like on the SemEval [3] challenge, in which the Micro F1-score was the official metric.
The models achieving better results were the ones using KNeighbors and Naive Bayes. Out of the four models, the one with the smaller Micro F1-score was the one using Naive Bayes with BR; nonetheless, this model also presents the highest Macro F1-score. This happens because the model is giving a higher importance to the least represented classes. The rule-based models also present a good balance between Micro and Macro F1-scores even though they could benefit from another feature extraction method, such as TF-IDF.
Although the results from model MW7 outperform the majority baseline in the challenge [3] and one participant’s submission, they are still not very promising, confirming the need for more sophisticated deep learning approaches.
4. Proposed System
After confirming that traditional machine learning models were not suitable for the problem at hand, we decided to explore and propose a deep learning architecture based on the most used concept by other participants: The transformer.
4.1. Architecture
Transformers were very popular amongst other participants, with most of them using either BERT or RoBERTa or sometimes even an ensemble of transformers.
Fine-tuning a transformer is an expensive process and, because of that, we decided to go with DistilBERT [11]. This transformer is much smaller than the ones previously cited, as it reduces the original BERT model’s size by 40% and its inference time is 60% faster while retaining 97% of its functionality.
Rather than simply fine-tuning it on the task dataset we opted for adding an additional CNN. These have proved to produce good results when it comes to multi-label text classification [12,13] as they are able to recognize patterns in the text. These patterns can be simpler or more complex depending on the kernel’s size; for instance, a kernel with size 2 would be similar to using bi-grams. When compared with LSTMs, they are less expensive in time as they are highly parallelizable due to their non sequential nature.
Our proposed architecture is very similar to the one used in [14], but we tweaked it by using a slightly larger transformer, in terms of tunable hyperparameters, a linear layer at the end of it, and by using elu instead of relu as the activation function.
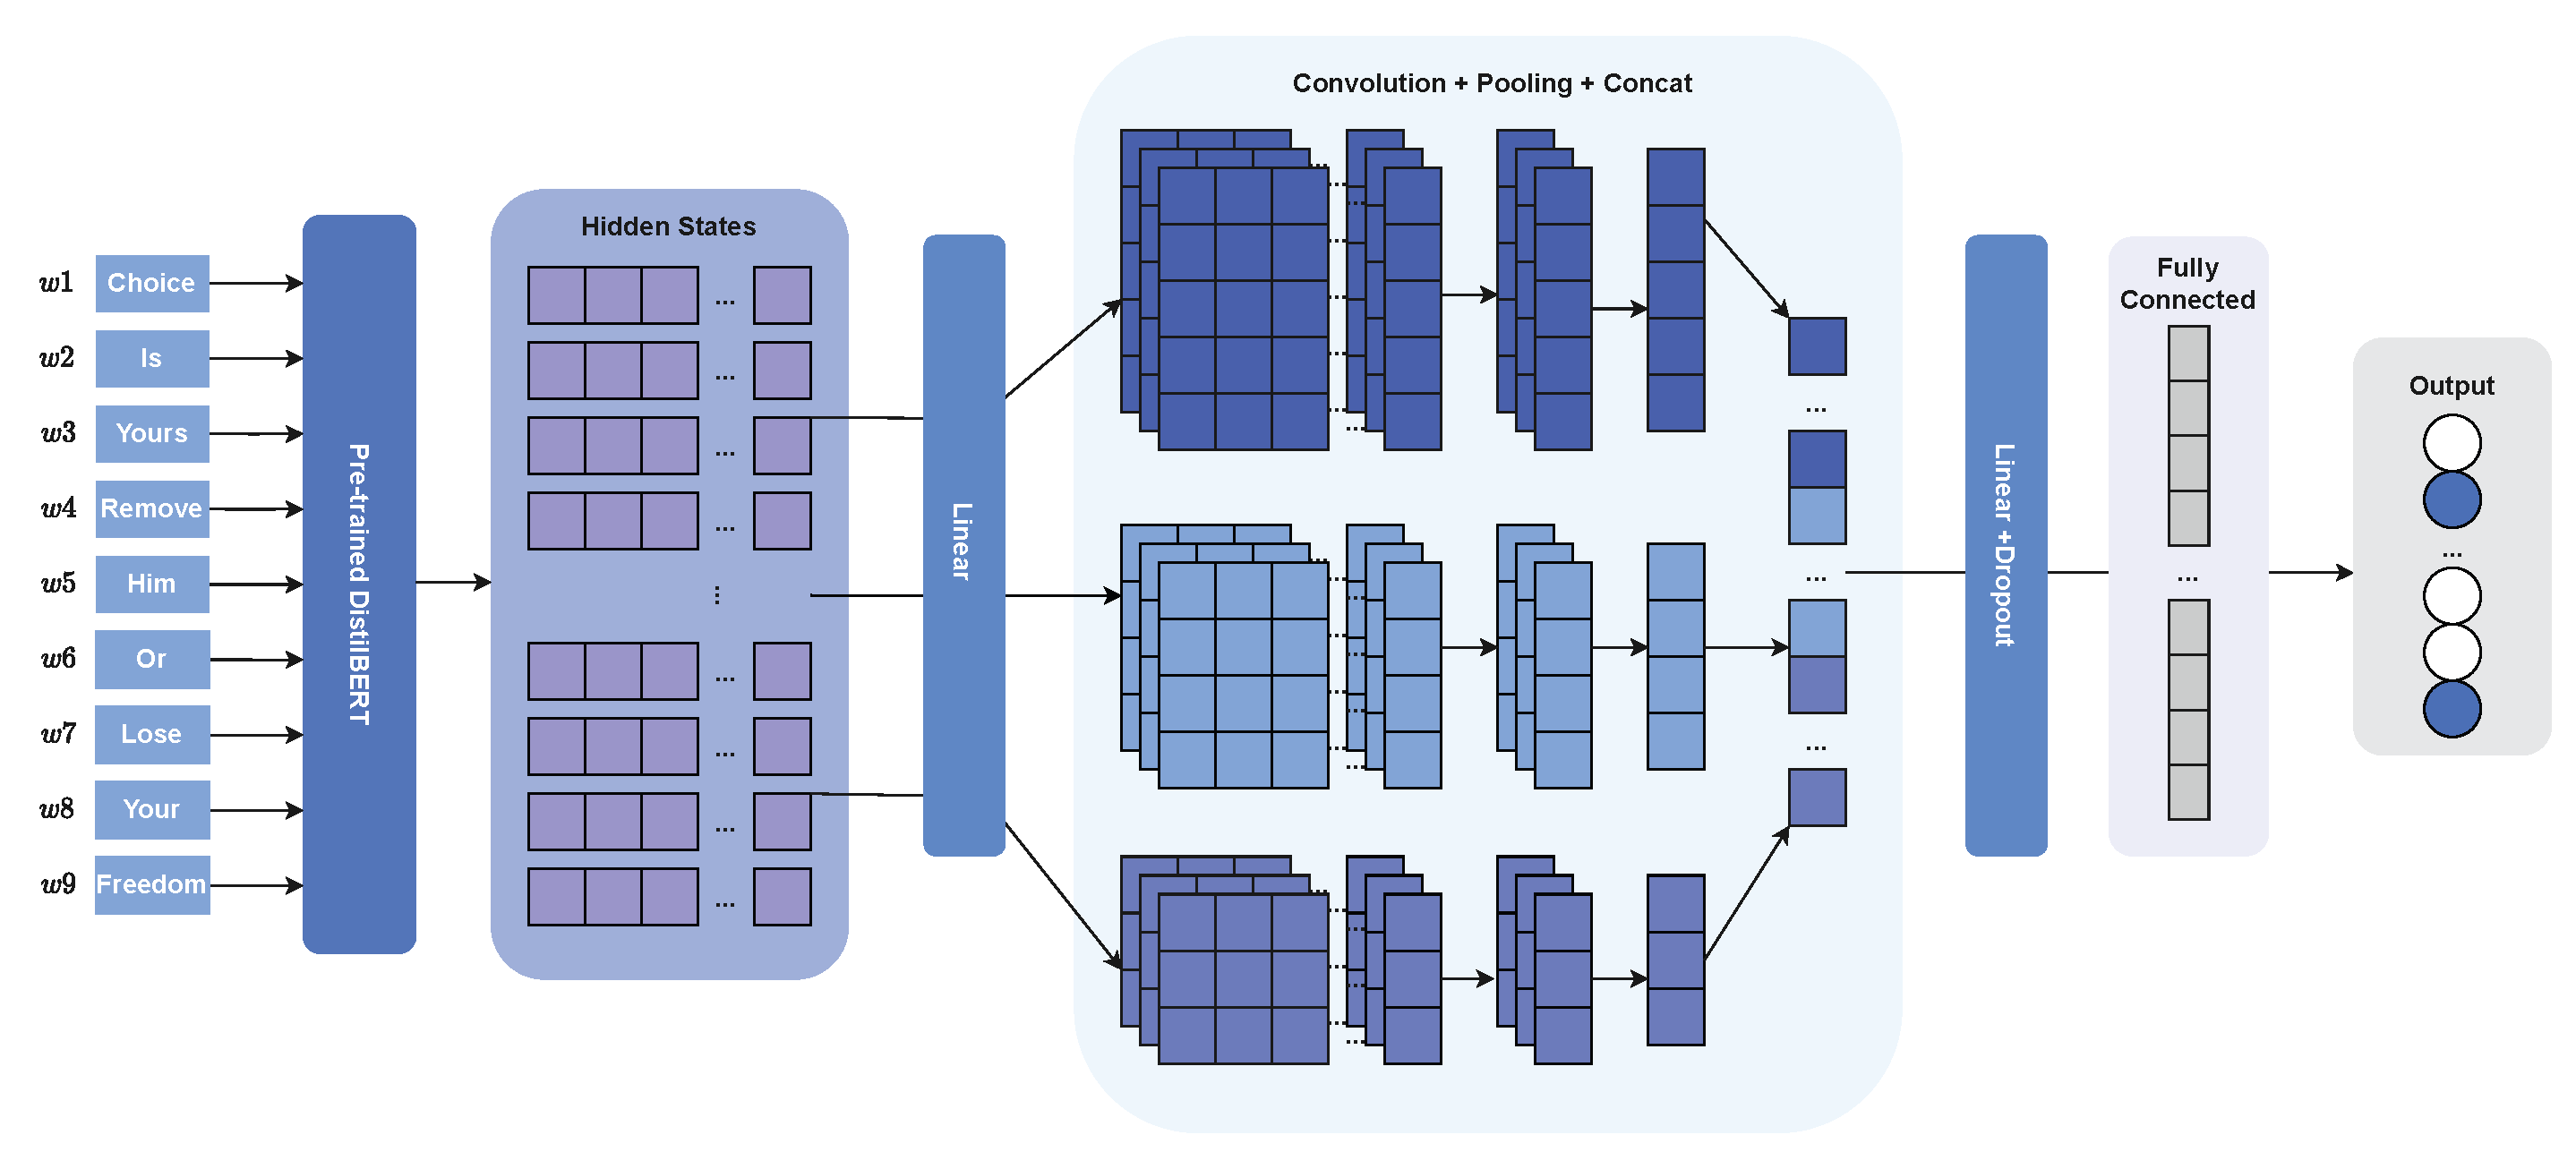
In Figure 2 we can see the architecture chosen for our system. Combining a transformer with convolutional neural networks has been tried before [15], providing good results, with the transformer creating the contextual representation vector and the CNN helping in the classification. The text embeddings are passed into a pre-trained DistilBERT model, which returns an input sequence representation, also known as hidden state, of size 768. The representation is passed to a linear layer and its output is then passed to a list of convolutional layers. A pooling operation is then applied to all the convolutional layers in order to extract the most important features. The results of the pooling operation in each layer are concatenated and passed to another group of linear and dropout layers. Finally, they are fed into a fully connected layer where each neuron represents a label. The activation function used at the end of each linear layer (except for the last one) as well as after the convolutional layers is elu, as it tends to converge faster and give better results than other activation functions such as relu.

Figure 2.
Final model architecture.
4.2. Experiment’s Methodology
After defining the architecture, we defined an experimentation methodology in order to stay aligned with our goals.
Instead of using the dev dataset for validation, we will merge the training and dev datasets to create a new training set and we will use the stratified k cross-validation technique (with ), as we did previously. That way we can use the test dataset only to evaluate the final model, which prevents us from overfitting it to this particular dataset.
The first step in the process would be to train a model using the defined architecture with binary cross-entropy (BCE) as loss function and take it as our baseline. After that we would train new models using different loss functions and see how the choice of the loss function impacts the model’s performance.
The overall model’s performance and performance per class are measured using the same metrics as the other participants, so that we can compare the results. These metrics were defined in Section 3.
5. Results
5.1. Baseline System
In order for our model to learn we need to choose a loss function and an optimizer. We used AdamW optimizer due to its fast convergence and the usage of L2 regularization. As for the loss function, we chose BCE, as we defined before, which can be defined as BCE = BCE() =, where y is the true value and p is the predicted probability of belonging to the class:
The set of hyperparameters for our baseline model is presented in Table 4. The values chosen, except for kernel dimensions and hidden layer dimension, were not chosen for any particular reason apart from being in a range of common values for each hyperparameter. Kernel dimension’s value was the one chosen by [14] and, for the hidden layer dimension, we went with the same dimension as the DistilBERT hidden state.
Table 4.
Baseline system hyperparameters.
By running the experiments for the baseline model, we confirmed the expected: a great improvement over the experiments on Section 3 with a Micro F1-score of 0.516, yet there was still some inability to make correct predictions for the least represented classes, with 13 out of 20 classes having an F1-score of 0, as can be observed in Table 5. This inability is greatly reflected on the Macro F1-score (0.116), which gives the same weight to each class.
Table 5.
F1-score for each class on final architecture’s baseline model.
5.2. Loss Functions
When dealing with imbalanced datasets in multi-label classification tasks the choice of the loss function can have a huge impact on the model’s performance, especially on the least represented classes [4]. Although Binary Cross Entropy can be used, it might not be the most suitable loss function for this problem as it does not deal with the imbalanced data problem. By not doing so, the system will struggle to properly compute the gradient for less popular classes, which will result in the inability to accurately predict in the cases that are hardest to classify.
Hard-to-classify examples are defined as misclassified ones (for instance a false positive). This issue was addressed in [16] where the researchers took Binary Cross Entropy as a starting point and added a modulating factor of . This type of loss would be called FL and would be given by
Setting reduces the relative loss for well-classified examples, putting more focus on hard misclassified examples. When an example is misclassified (), the modulating factor is nearer to 1 and the loss is unaffected. As gets closer to 1 the factor goes to 0 and the loss for well-classified examples is down-weighted.
In the original paper [16], the researchers found produced the best results, and, because of that, we also set the parameter with the same value.
Although effective when it comes to classify hard to predict classes, Focal Loss presents a trade-off: Setting high to sufficiently down-weight the contribution from easy negatives may eliminate the gradients from the rare positive samples. This behaviour can be troublesome, especially in situations where predicting a false negative is more costly. To address this issue a new loss function was proposed: ASL [17].
Asymmetric Loss relies on two principles, Asymmetric Focusing and Asymmetric Probability Shifting. The first principle decouples the focusing levels of the positive and negative samples so that and are the respective focusing parameters. Using it, we can redefine the loss as follows:
This mechanism is able to reduce the contribution of negative samples to the loss when their probability is low; however, it might not be very effective when class imbalance is very high. Rather than just reducing the contributions, Asymmetric Probability Shifting fully discards negative samples when their probability is very low. This principle, , is given by:
where the probability margin is a tunable hyperparameter.
By integrating into , we obtain the definition of Asymmetric Loss:
With ASL, we use both soft thresholding and hard thresholding to reduce the loss function contribution of easy negative samples. Soft thresholding uses the focusing parameters , and hard thresholding uses the probability margin m.
For our experiments, we followed the values suggested by the original paper [17] researchers, with , and . By setting , the positive samples will incur simple cross entropy loss, and control the level of asymmetric focusing via a single hyperparameter, .
Table 6 presents the F1-score per class in models using Focal Loss and Asymmetric Loss. These experiments show the importance of choosing the right loss function, as both Focal Loss and Asymmetric Loss improved our model’s performance, especially when considering the less represented classes. This statement is confirmed when comparing Table 5 and Table 6.
Table 6.
F1-score for each class using different loss functions.
Moving from the analysis per label to the overall performance, when training using Focal Loss and using Asymmetric Loss, the model assessment results are displayed in Table 7.
Table 7.
Micro and Macro F1-scores for different loss functions.
5.3. Final Evaluation
In order to compare our system’s results with the ones from SemEval, we trained our model in the dev+train set and used the test set for evaluation.
When we compare the results between our model (FM) and the best system in the SemEval challenge (MinD), we realize that they are very similar for most of the classes, as we can see in Table 8. With the two most represented classes (Loaded Language and Name Calling) achieving very good results and other classes such as Smears and five other classes having acceptable results. Nonetheless, the model is still unable to predict classes such as Red Herring and Bandwagon, which re-affirms the impact of having few samples in an imbalanced dataset.
Table 8.
Comparing results per class between FM model and MinD.
The system’s Micro and Macro F1-scores are presented in Table 9, where our model would be placed in 3rd. It performed worse than two other models; however, it should be taken into account that it is also the smallest model, containing the fewest tunable hyperparameters of all three. The MinD [8] model uses an ensemble of five transformers, such as RoBERTa and BERT and XLNET. The Volta [9] model is smaller when compared with MinD, since it uses only one transformer followed by two linear layers and dropout, but the base transformer is a RoBERTa Large, which has 355 million tunable parameters. In comparison, our whole model has around 68 million parameters.
Table 9.
Comparison between the FM model and the systems participating in SemEval.
6. Discussion
The experiences in this work show the importance of studying and tweaking a system during the training phase. They also show that loss functions, although sometimes overlooked, might have a significant impact on the final results. A comparison between our model and other SemEval’s systems is presented in Table 9, with our FM model being ranked in third place.
By using different loss functions, we doubled the number of classes having Micro F1-score over 0.3 (when comparing BCE with ASL) and we went from being unable to predict thirteen classes to only missing out on four classes.
This work also shows that, by having a deeper understanding of our dataset and its limitations (such as an extreme class imbalance), we can properly approach a problem using fewer computational resources, in our case by fine-tuning a model with fewer parameters, and still achieve similar results.
One possible future application for our model is to create an inference server and expose the model capabilities through an API that can be queried to moderate content on platforms and reinforce community guidelines. It should be noted that the prediction’s quality might be affected by the platform purpose and the type of content shared in it, given that the model was trained mainly on public domain data related to politics, COVID-19, vaccines and other polarizing subjects.
Despite having achieved acceptable results, in order to improve our automatic detection of persuasion attempts, it would be interesting to study the power of generative AI to create synthetic data for the dataset augmentation. Some ethical problems might arise with this approach due to the fact that annotating the data, which means identifying the persuasion techniques, can be very subjective. Relying on an external source might not be advisable given that these models can have some internal bias [18], or may even fail to produce useful data. Another, more feasible approach, would be to use new data from SemEval 2023 Task 3 [19], once it is made available to the public, in order to augment the dataset. Rather than using text from memes, this task’s dataset is composed of articles; nonetheless, the scope of the task is still to identify some of the persuasion techniques we are using.
Regarding the architecture, in the future, we can try other configurations for the CNN layers and see how different kernel sizes and number of branches can affect the final model’s performance.
Author Contributions
Conceptualization, J.S.; Methodology, R.T.; Software, R.T.; Validation, J.S.; Writing—original draft, R.T.; Writing—review & editing, J.S.; Supervision, J.S. All authors have read and agreed to the published version of the manuscript.
Funding
This research received no external funding.
Data Availability Statement
For more information about the dataset, please refer to Appendix A of SemEval-2021 Task 6’s description paper.
Conflicts of Interest
The authors declare no conflict of interest.
References
- Guo, B.; Ding, Y.; Yao, L.; Liang, Y.; Yu, Z. The Future of False Information Detection on Social Media: New Perspectives and Trends. ACM Comput. Surv. 2020, 53, 1–36. [Google Scholar] [CrossRef]
- Da San Martino, G.; Yu, S.; Barrón-Cedeño, A.; Petrov, R.; Nakov, P. Fine-Grained Analysis of Propaganda in News Article. In Proceedings of the 2019 Conference on Empirical Methods in Natural Language Processing and the 9th International Joint Conference on Natural Language Processing (EMNLP-IJCNLP), Hong Kong, China, 3–7 November 2019; pp. 5636–5646. [Google Scholar] [CrossRef]
- Dimitrov, D.; Bin Ali, B.; Shaar, S.; Alam, F.; Silvestri, F.; Firooz, H.; Nakov, P.; Da San Martino, G. SemEval-2021 Task 6: Detection of Persuasion Techniques in Texts and Images. In Proceedings of the 15th International Workshop on Semantic Evaluation (SemEval-2021), Online, 5–6 August 2021; pp. 70–98. [Google Scholar] [CrossRef]
- Huang, Y.; Giledereli, B.; Köksal, A.; Özgür, A.; Ozkirimli, E. Balancing Methods for Multi-label Text Classification with Long-Tailed Class Distribution. arXiv 2021, arXiv:2109.04712. [Google Scholar]
- Ibrohim, M.O.; Budi, I. Multi-label Hate Speech and Abusive Language Detection in Indonesian Twitter. In Proceedings of the Third Workshop on Abusive Language Online, Florence, Italy, 1 August 2019; pp. 46–57. [Google Scholar] [CrossRef]
- Abujaber, D.; Qarqaz, A.; Abdullah, M.A. LeCun at SemEval-2021 Task 6: Detecting Persuasion Techniques in Text Using Ensembled Pretrained Transformers and Data Augmentation. In Proceedings of the 15th International Workshop on Semantic Evaluation (SemEval-2021), Online, 5–6 August 2021; pp. 1068–1074. [Google Scholar] [CrossRef]
- Gupta, V.; Sharma, R. NLPIITR at SemEval-2021 Task 6: RoBERTa Model with Data Augmentation for Persuasion Techniques Detection. In Proceedings of the 15th International Workshop on Semantic Evaluation (SemEval-2021), Online, 5–6 August 2021; pp. 1061–1067. [Google Scholar] [CrossRef]
- Tian, J.; Gui, M.; Li, C.; Yan, M.; Xiao, W. MinD at SemEval-2021 Task 6: Propaganda Detection using Transfer Learning and Multimodal Fusion. In Proceedings of the 15th International Workshop on Semantic Evaluation (SemEval-2021), Online, 5–6 August 2021; pp. 1082–1087. [Google Scholar] [CrossRef]
- Gupta, K.; Gautam, D.; Mamidi, R. Volta at SemEval-2021 Task 6: Towards Detecting Persuasive Texts and Images using Textual and Multimodal Ensemble. In Proceedings of the 15th International Workshop on Semantic Evaluation (SemEval-2021), Online, 5–6 August 2021; pp. 1075–1081. [Google Scholar] [CrossRef]
- Messina, N.; Falchi, F.; Gennaro, C.; Amato, G. AIMH at SemEval-2021 Task 6: Multimodal Classification Using an Ensemble of Transformer Models. In Proceedings of the 15th International Workshop on Semantic Evaluation (SemEval-2021), Online, 5–6 August 2021; pp. 1020–1026. [Google Scholar] [CrossRef]
- Sanh, V.; Debut, L.; Chaumond, J.; Wolf, T. DistilBERT, a distilled version of BERT: Smaller, faster, cheaper and lighter. arXiv 2019, arXiv:1910.01108. [Google Scholar]
- Alshubaily, I. TextCNN with Attention for Text Classification. arXiv 2021, arXiv:2108.01921. [Google Scholar]
- Yu, L.; Chen, L.; Dong, J.; Li, M.; Liu, L.; Zhao, B.; Zhang, C. Detecting Malicious Web Requests Using an Enhanced TextCNN. In Proceedings of the 2020 IEEE 44th Annual Computers, Software, and Applications Conference (COMPSAC), Madrid, Spain, 13–17 July 2020; pp. 768–777. [Google Scholar] [CrossRef]
- Zhu, X.; Wang, J.; Zhang, X. YNU-HPCC at SemEval-2021 Task 6: Combining ALBERT and Text-CNN for Persuasion Detection in Texts and Images. In Proceedings of the 15th International Workshop on Semantic Evaluation (SemEval-2021), Online, 5–6 August 2021; pp. 1045–1050. [Google Scholar] [CrossRef]
- Safaya, A.; Abdullatif, M.; Yuret, D. KUISAIL at SemEval-2020 Task 12: BERT-CNN for Offensive Speech Identification in Social Media. In Proceedings of the Fourteenth Workshop on Semantic Evaluation, Barcelona (online), 12–13 December 2020; pp. 2054–2059. [Google Scholar] [CrossRef]
- Lin, T.; Goyal, P.; Girshick, R.B.; He, K.; Dollár, P. Focal Loss for Dense Object Detection. arXiv 2017, arXiv:1708.02002. [Google Scholar]
- Baruch, E.B.; Ridnik, T.; Zamir, N.; Noy, A.; Friedman, I.; Protter, M.; Zelnik-Manor, L. Asymmetric Loss For Multi-Label Classification. arXiv 2020, arXiv:2009.14119. [Google Scholar]
- Bayer, M.; Kaufhold, M.A.; Reuter, C. A Survey on Data Augmentation for Text Classification. ACM Comput. Surv. 2022, 55, 1–39. [Google Scholar] [CrossRef]
- Piskorski, J.; Stefanovitch, N.; Da San Martino, G.; Nakov, P. SemEval-2023 Task 3: Detecting the Category, the Framing, and the Persuasion Techniques in Online News in a Multi-lingual Setup. In Proceedings of the 17th International Workshop on Semantic Evaluation (SemEval-2023), Toronto, ON, Canada, 13–14 July 2023; pp. 2343–2361. [Google Scholar] [CrossRef]
Disclaimer/Publisher’s Note: The statements, opinions and data contained in all publications are solely those of the individual author(s) and contributor(s) and not of MDPI and/or the editor(s). MDPI and/or the editor(s) disclaim responsibility for any injury to people or property resulting from any ideas, methods, instructions or products referred to in the content. |
© 2023 by the authors. Licensee MDPI, Basel, Switzerland. This article is an open access article distributed under the terms and conditions of the Creative Commons Attribution (CC BY) license (https://creativecommons.org/licenses/by/4.0/).