Article

Estimation of Lithium-Ion Battery State of Charge Based on Genetic Algorithm Support Vector Regression under Multiple Temperatures

1
College of Computer Science and Engineering, Sichuan University of Science and Engineering, Zigong 643033, China
2
Sichuan Key Provincial Research Base of Intelligent Tourism, Zigong 643000, China
*
Author to whom correspondence should be addressed.
These authors contributed equally to this work.
Electronics 2023, 12(21), 4433; https://doi.org/10.3390/electronics12214433
Submission received: 5 October 2023 / Revised: 21 October 2023 / Accepted: 25 October 2023 / Published: 27 October 2023
(This article belongs to the Special Issue Advanced Energy Supply and Storage Systems for Electric Vehicles)

Abstract

:
In the energy crisis and post-epidemic era, the new energy industry is thriving, encompassing new energy vehicles exclusively powered by lithium-ion batteries. Within the battery management system of these new energy vehicles, the state of charge (SOC) estimation plays a pivotal role. The SOC represents the current state of charge of the lithium-ion battery. This paper proposes a joint estimation algorithm based on genetic algorithm (GA) simulating biogenetic properties and support vector regression (SVR) to improve the prediction accuracy of lithium-ion battery SOC. Genetic algorithm support vector regression (GASVR) is proposed to address the limitations of traditional SVR, which lacks guidance on parameter selection. The model attains notable accuracy. GASVR constructs a set of solution spaces, generating initial populations that adhere to a normal distribution using a stochastic approach. A fitness function calculates the fitness value for each individual. Based on their fitness, the roulette wheel method is employed to generate the next-generation population through selection, crossover, and mutation. After several iterations, individuals with the highest fitness values are identified. These top individuals acquire parameter information, culminating in the training of the final SVR model. The model leverages advanced mathematical techniques to address SOC prediction challenges in the Hilbert space, providing theoretical justification for handling intricate nonlinear problems. Rigorous testing of the model at temperatures ranging from −20 C to 25 C under three different working conditions demonstrates its superior accuracy and robustness compared to extreme gradient boosting (XGBoost), random forest regression (RFR), linear kernel function SVR, and the original radial basis kernel function SVR. The model proposed in this paper lays the groundwork and offers a scheme for predicting the SOC within the battery management system of new energy vehicles.

1. Introduction

1.1. Background

From the 20th century onwards, the issue of global climate change has grown progressively more severe. In 2005, Korea’s carbon dioxide (CO 2 ) emissions reached 591 million tonnes, marking a substantial increase of 98.7 % compared to the levels recorded in 1990 [1]. In 2013, “China’s per capita carbon emissions reached 7.2 tonnes, surpassing the per capita emissions of the European Union, which were at 6.8 tonnes. This high level of emissions poses challenges for carbon reduction efforts” [2]. China’s coal chemical industry consumed about 9.68 billion tonnes of coal going into 2019, accounting for 24.1 % of the country’s coal consumption, second only to the power sector. The coal chemical industry’s CO 2 emissions amounted to approximately 5 billion tonnes [3,4]. In 2022, China’s total energy-related carbon emissions were about 12.1 billion tonnes. The USA’s carbon emissions totaled 4.7 billion tonnes [5]. Since 2019, the global climate change and energy crisis have been growing in prominence, further exacerbated by the impact of the COVID-19 pandemic. On 22 September 2020, “Chinese President Xi Jinping announced at the 75th session of the United Nations General Assembly that China will adopt more favorable policies and measures to strive to peak CO 2 emissions by 2030 and work towards the goal of becoming carbon neutral by 2060” [6]. Following the introduction of the “double carbon target” (referring to China’s carbon peak and carbon neutrality goals), China has embarked on a vigorous development path focusing on new energy, nuclear energy, smart grids, and other industries. These efforts aim to facilitate the transformation and upgrade of traditional industrial structure. For instance, “in Beijing, China, a policy has been implemented to limit the number of fuel-powered vehicles based on their license plate numbers. This approach, known as the odd-even license plate scheme, aims to reduce carbon emissions and alleviate urban congestion. New energy vehicles that rely solely on rechargeable lithium-ion batteries as their power source are exempt from the limitations imposed by the odd-even license plate scheme and can travel without restrictions”. Indeed, the government’s backing has created an advantageous environment for the growth and development of this industry, contributing to significant progress and advancements in the production and adoption of new energy vehicles in China. Current electric vehicles powered by lithium batteries still hold great potential for development. In the future, by combining supercapacitors and a lithium battery in the car’s energy storage equipment, it may become possible to compete with traditional lithium batteries [7,8].
Lithium-ion batteries, widely employed in the new energy vehicle industry, are known for their high energy density, long lifespan, and excellent safety features. As a result, it finds extensive application in diverse fields, including cell phone batteries, rechargeable batteries, and portable power solutions. To ensure lithium-ion batteries’ safe and efficient performance, it is crucial to precisely assess and monitor their state of charge (SOC). The utilization of Battery Management System (BMS) to accurately assess the SOC in lithium-ion batteries can effectively harness the potential of new energy vehicles [9] and give reasonable charging recommendations to extend the remaining service life of lithium batteries. The SOC of lithium-ion batteries is not directly measurable. Instead, it is influenced by various factors such as voltage, current, usage time, and temperature [10]. The SOC exhibits a nonlinear characteristic, adding complexity to its estimation and monitoring. Therefore, it is meaningful to establish an accurate evaluation of the SOC of lithium-ion batteries under different temperatures. This approach will ensure the stability and safety of new energy vehicle operations, enabling them to maintain high efficiency. By achieving this, we can fully utilize lithium-ion batteries as the primary energy supply module, helping to address the challenges of global warming and the energy crisis.

1.2. Related Work and Research Gap

The definition of the SOC provided by the United States Advanced Battery Consortium (US-ABC) is widely accepted and used in various contexts. The SOC refers to the ratio of the remaining charge in a battery to its rated capacity under specific discharge conditions and environmental factors.
S O C = Q C / C I
In Equation (1): Q C is the remaining capacity of the battery. C I is the capacity of the battery when discharged at a constant current I. The traditional approaches for estimating the SOC of batteries can be classified into three main methods: Coulomb counting, the open-circuit voltage (OCV) method, and the Kalman filtering method [11,12]. In the case of the Coulomb counting method, its accuracy largely depends on the precise measurement of the current during battery discharge and the accuracy of the initial measured SOC of the battery. When the initial SOC is estimated accurately, the error in calculating the battery’s SOC using the integration of charge and discharge currents during the cycle will be smaller. However, it is generally challenging to calculate the initial SOC precisely, and there are inevitably errors in measuring the battery current during the cycle. These errors accumulate over time, increasing the level of inaccuracy in estimating the SOC using the Coulomb counting method. When the correct initial SOC is provided, the Mean Square Error (MSE) can be reduced by 1.05% compared to the case where an incorrect initial SOC is used, which results in an MSE of 7.3% [13,14]. This method offers the advantages of high accuracy and simplicity in the calculation. However, the OCV method is associated with a relatively long measurement time, making it impractical for meeting the requirements of online estimation of the SOC [15]. The standard and modified Kalman filter are widely employed. In the field of automated vehicles, Neel P. Bhatt and Xin Xia et al. (2023) proposed an integrated localization method based on the fusion of an inertial dead reckoning model and 3D LiDAR-based map matching [16]. In their experiments, the Kalman filter is utilized for stability analysis. Xin Xia and Runsheng Xu et al. (2023) utilize the consensus Kalman information filter (CKIF) to merge shared information from connected vehicles, proposing secure cooperative localization for connected automated vehicles (CAVs) [17]. In the literature on SOC prediction using Kalman filtering, Sepasi and Ghorbani et al. (2014) extended the application of the Kalman filter method to assess the SOC in battery packs [12]. This approach leveraged the dynamic characteristics of gas and liquid flows within the battery to improve the accuracy and effectiveness of SOC estimation. Ning and Deng et al. (2022) employed the Kalman filter method to jointly estimate the health condition and SOC of a 48 V battery system. The study conducted showed that their method achieved remarkable results, with average absolute errors of less than 0.88% for SOC estimation and 0.64% for capacity estimation [18]. Poloni and Figueroa-Santos et al. (2018) proposed a method for estimating the SOC of lithium iron phosphate batteries (LiFePO4) by extracting SOC-related features from the impedance spectrum [19]. Wang and Zhao et al. (2023) proposed an impedance-based algorithm for estimating the SOC of batteries. By employing the impedance spectrum method for calibration, it is possible to reduce the maximum absolute error to less than 5.4% in estimating the SOC of batteries [20]. Wadi and Abdel-Hafez et al. (2023) proposed a method to enhance the accuracy of SOC estimation by employing an iterated Extended Kalman Filter (EKF) with correction terms that are independent of output errors [21]. Wang and Wang et al. (2023) conducted tests on lithium-ion batteries under different temperatures and introduced an enhanced EKF model for SOC estimation [22]. Their proposed model demonstrated remarkable performance, with SOC estimation errors within 3% under variable and 1% under low temperatures. Du and Shao et al. (2022) presented a collaborative algorithm for estimating batteries’ SOC and the state of health (SOH) of batteries. Their approach combined the least squares method and EKF to improve SOC estimation accuracy [23]. Lin and Li et al. (2023) introduced a model that combines an EKF with an RC equivalent circuit for battery state estimation [24]. Through experimental analysis, they observed that this model exhibited superior accuracy compared to the commonly used EKF model. Wang and Lu et al. (2019) developed a method to estimate the SOC of lithium-ion batteries. They employed a dual EKF approach to improve the estimation accuracy with the characteristics of the batteries [25]. Their experiments demonstrated that this method effectively eliminates measurement noise and ensures the accuracy of model estimation. Luan and Qin et al. (2023) presented a novel approach for estimating the SOC of batteries by developing an equivalent circuit model using a particle swarm optimization algorithm [26]. Qiu and Li et al. (2019) introduced an improved EKF for estimating the SOC of vanadium redox batteries (VRBs) [27]. Their research demonstrated that this method outperformed the traditional EKF method concerning convergence speed and accuracy.
In addition to conventional approaches, novel artificial intelligence algorithms utilizing extensive datasets have emerged to estimate the battery’s SOC. The data-driven approaches do not need to consider the internal characteristics of the battery and use the previously existing data and experience to predict the results in unknown cases [28,29]. Omer Ali and Ishak et al. (2022) introduced an online estimation method for SOC using Gaussian process regression. Their experiments demonstrated that the Gaussian process regression model, optimized with an RBF kernel, achieved an estimation error of less than 2% [30]. Zhang and Xia et al. (2021) proposed an optimization technique for backpropagation neural networks using time series models [31]. Mao and Song et al. (2022) introduced a backpropagation neural network enhanced by the Levy flight-optimized particle swarm algorithm [15]. Anton and Nieto et al. (2013) conducted a study utilizing support vector machine (SVM) models. They employed a single SVM model to assess the SOC and validated the model using untrained battery data. The study demonstrated that the accuracy of the SVM model for SOC estimation could reach as high as 97% [32]. Zhang and Li et al. (2019) proposed an evaluation model based on sparse least squares SVM. This model addressed the issue of over-fitting encountered in traditional SVM and demonstrated higher accuracy than the cardless trace Erdmann filter model [33]. Hu and Ma et al. (2022) developed a deep neural network for estimating the SOC of batteries. Their model achieved a maximum error of 2.5% in SOC estimation during charging, with an MSE of 0.8% [34]. M.S. and M.A. et al. (2020) utilized an enhanced firefly algorithm in conjunction with a time-delay neural network model to forecast SOC. The prediction outcomes yielded a Root Mean Square Error (RMSE) below 1% [35]. Duan and Song et al. (2020) introduced a gated recurrent unit recurrent neural network model with an activation function layer. The model demonstrated improved accuracy compared to the recurrent neural network model, with an enhancement ranging from 0.1% to 0.4% when the measurement data contained noise. The RMSE of the proposed model remained stable at approximately 1.9% [36]. Javid and Abdeslam et al. (2021) introduced an online recurrent neural network for long and short-term memory, which was optimized using an online gradient learning method. The proposed model demonstrated superior performance to the Kalman filter model through experimental verification, highlighting its improved accuracy and effectiveness [37].
The SOC of lithium-ion batteries is a critical parameter for assessing the mileage of new energy vehicles. Most research focused on training and evaluating SOC models has primarily emphasized applying one or two temperature states above 0 C. While these models demonstrate good accuracy in estimating the SOC of lithium-ion batteries at room temperature, there remains a significant gap in evaluating SOC across a broader temperature range, including 0 C and below. Addressing this limitation and improving the applicability of SOC estimation models across various temperature conditions requires further research.
Researchers have achieved relatively high accuracy in predicting the behavior of lithium-ion batteries using the support vector regression(SVR) model. Exploring the use of advanced mathematical techniques to address SOC prediction problems is also a promising avenue. The application of genetic algorithm(GA) to optimize SVR models for prediction tasks is relatively less explored compared to other methods. Additional research is needed to thoroughly investigate the potential benefits and limitations of employing GA in conjunction with SVR for prediction tasks and to evaluate its performance in different contexts.

1.3. Contributions

Due to the relatively short mileage and long charging time associated with new energy vehicles, accurate prediction of SOC is crucial for promoting the adoption of new energy electric vehicles. Consequently, this paper presents the development of a data-driven prediction model for SOC. The primary contributions of this work can be summarized in three key aspects:
  • By adopting a data-driven approach, this paper introduces a combined estimation model that integrates GA for biological features and SVR.
  • Addressing the complex nonlinear characteristics of SOC, this research tackles the SOC prediction problem within the realm of Hilbert space. This approach underscores the capacity of advanced mathematical techniques in resolving intricate problems.
  • The model’s sensitivity to temperature variations is comprehensively analyzed and emphasized. The GASVR model exhibits superior accuracy and robustness when compared to traditional models that rely on Euclidean space.

1.4. Structure of This Paper

The rest of the article consists of the following sections. Section 2 will introduce GA and data acquisition and processing, along with an explanation of SVR models. Section 3 will discuss the workflow of GASVR and conduct relevant testing and evaluation of the model using different data inputs and multiple temperatures. Section 4 summarizes the experimental results and proposes further directions.

2. Antecedent Theory

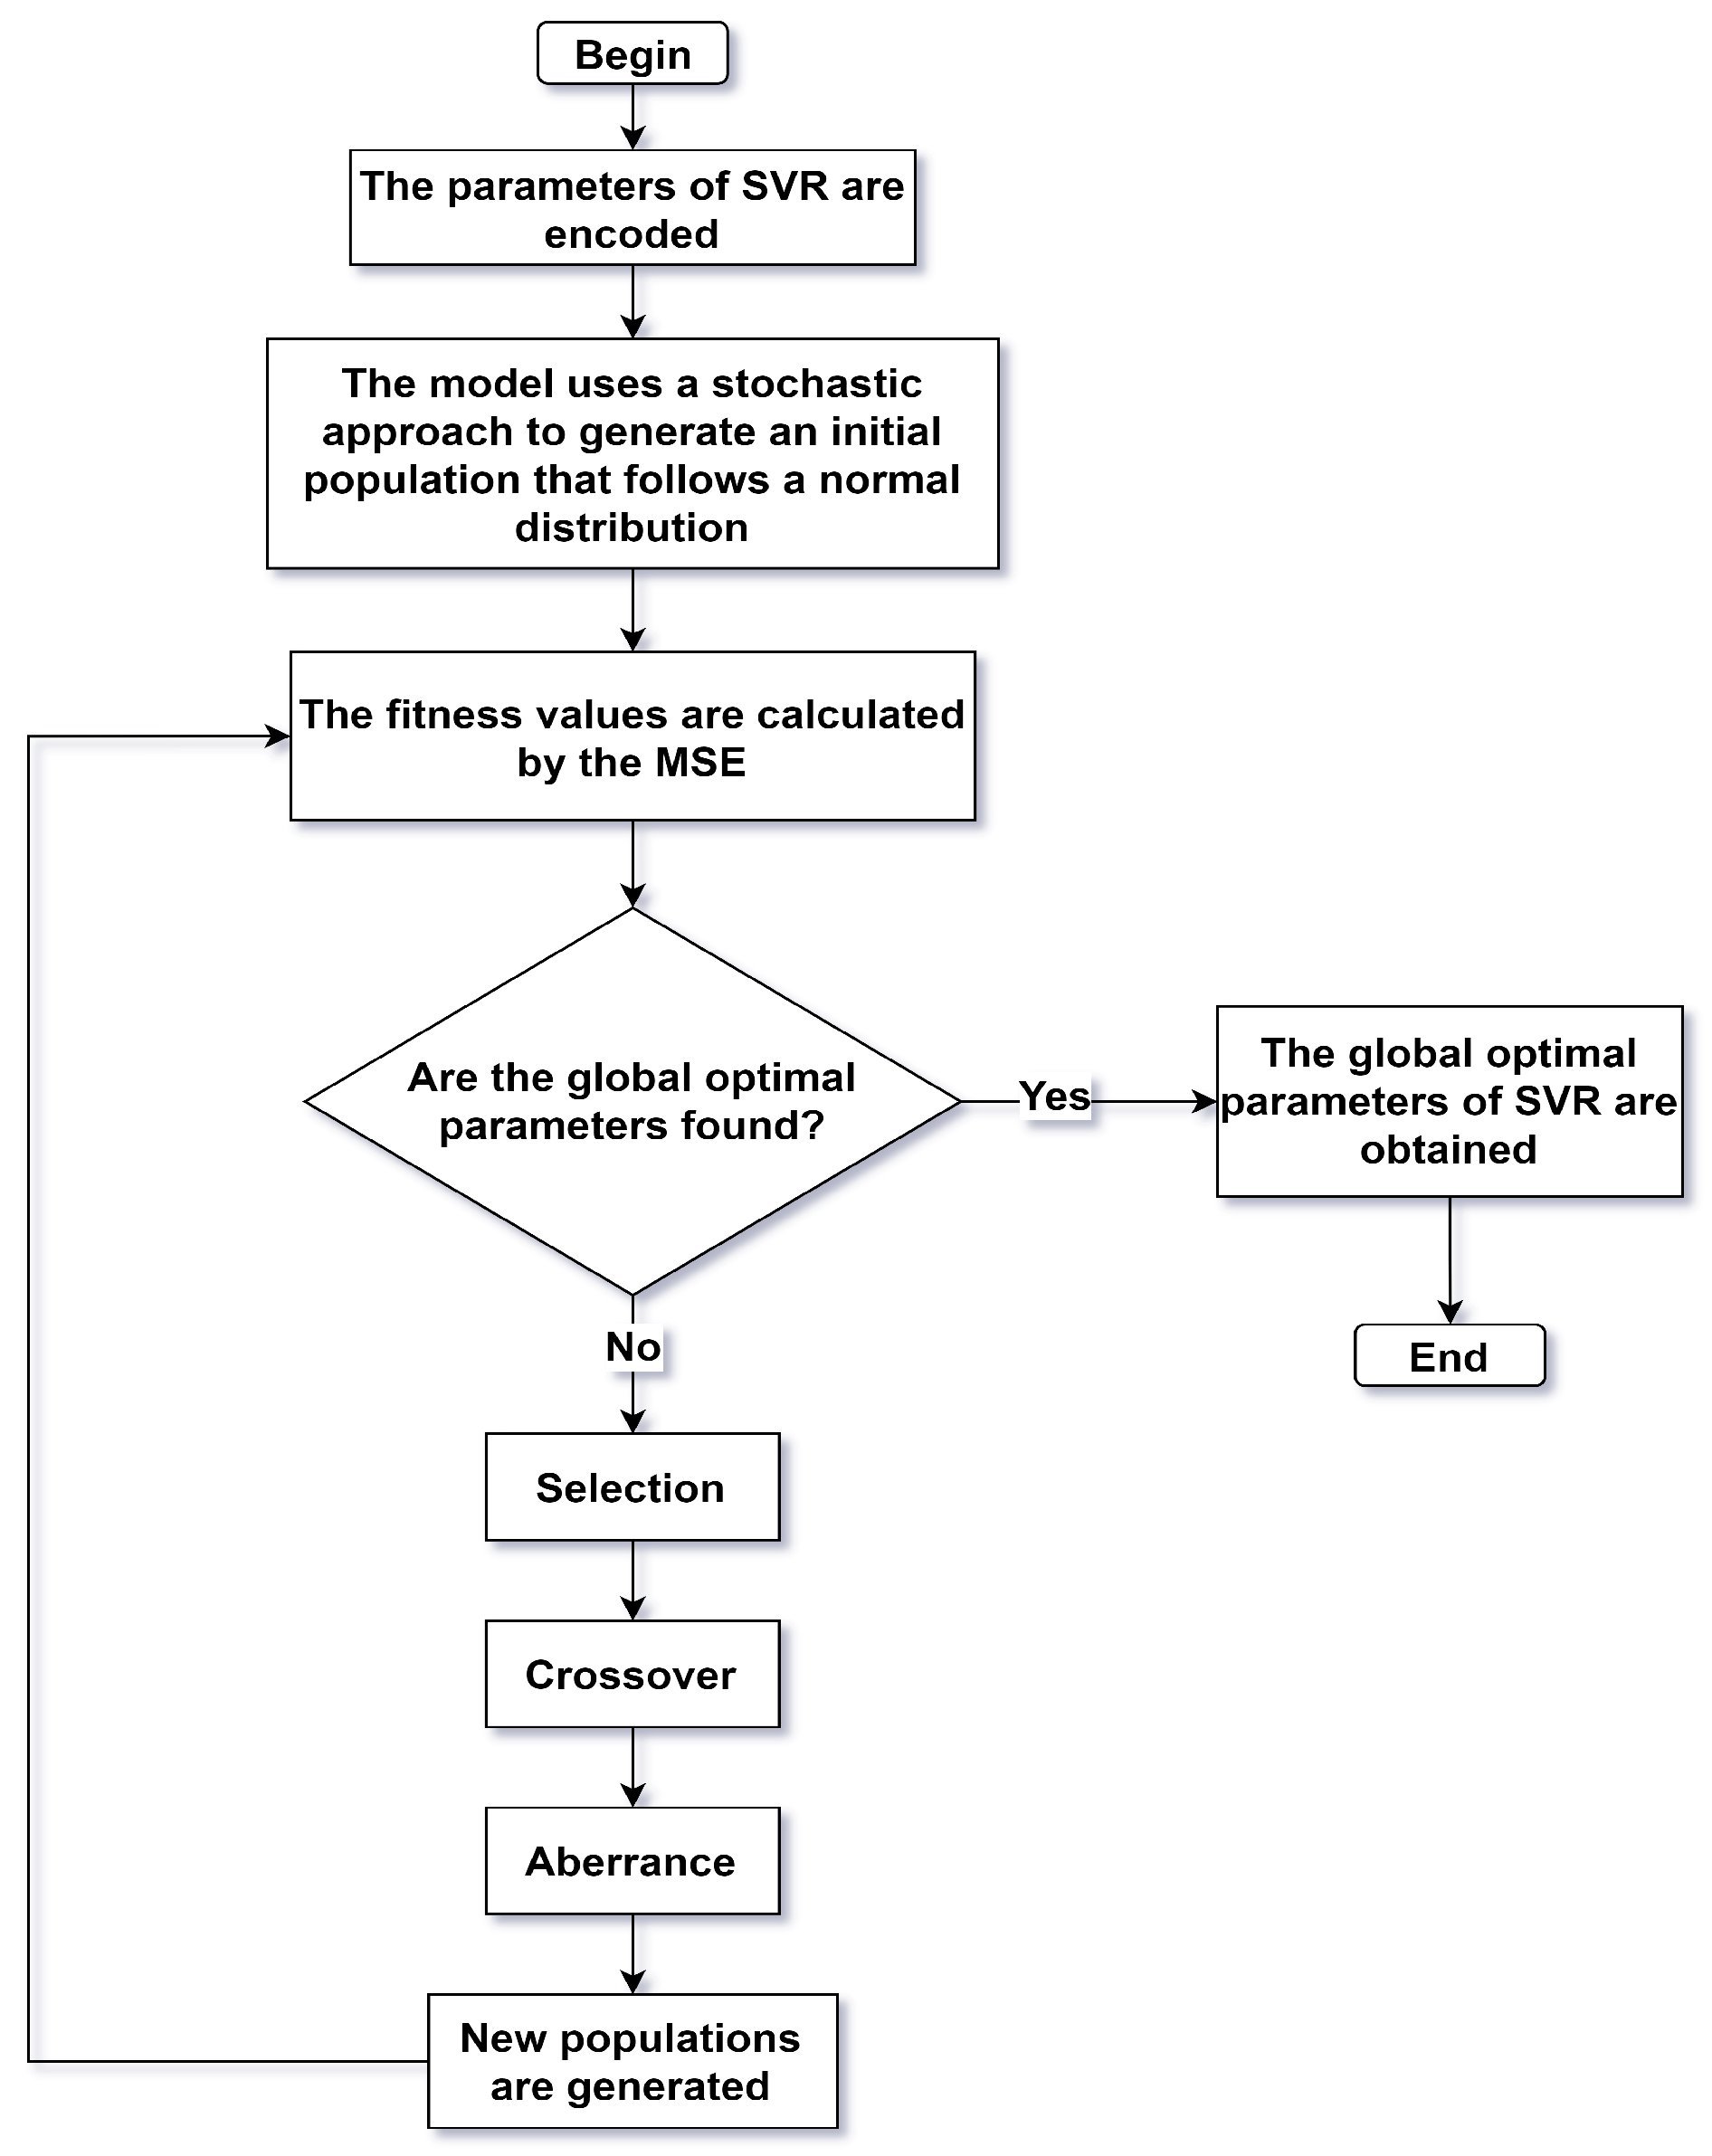
2.1. Genetic Algorithm

The concept of GA was initially introduced by Professor J. Holland (1975) from the University of Michigan, USA [38]. He developed this algorithm based on the principles of natural selection and biological genetics. The GA is a population-based optimization algorithm that aims to find the global optimal solution through a series of steps, including evaluating the fitness of individuals, selecting promising individuals for reproduction, combining their genetic material through crossover, and introducing random variations through mutation. This algorithm applies the principles of natural selection and genetic inheritance to improve the population iteratively and converge toward the optimal solution. It is considered a novel approach to intelligence-based optimization. The configuration of the genetic algorithm in this paper is shown in Table 1. During the execution of the GA, individuals in the population are evaluated based on their fitness, which represents their ability to solve the given problem. Individuals with higher fitness have a greater chance of surviving and passing their genetic material to the next generation through selection mechanisms, such as roulette wheel selection or tournament selection. This process mimics the natural selection mechanism, where individuals with advantageous traits have higher chances of survival. Through the repeated iteration of selection, crossover, and mutation, the populations undergo continuous evolution, gradually improving its overall fitness. Over time, this iterative process leads to the convergence of the population towards the optimal solution, represented by the individuals with the highest fitness. We obtain the optimal parameters or solutions for the given problem by selecting the best individuals from the final population. Figure 1 illustrates the overall flow of the GA. The GA are advanced intelligent algorithms that offer several advantages, including ease of implementation, robustness, parallel processing capability, and the ability to evaluate multiple individuals simultaneously. These features have led to the widespread adoption of GA in various fields. The simplicity of implementing GA allows researchers and practitioners from diverse domains to apply them effectively [39,40,41,42].

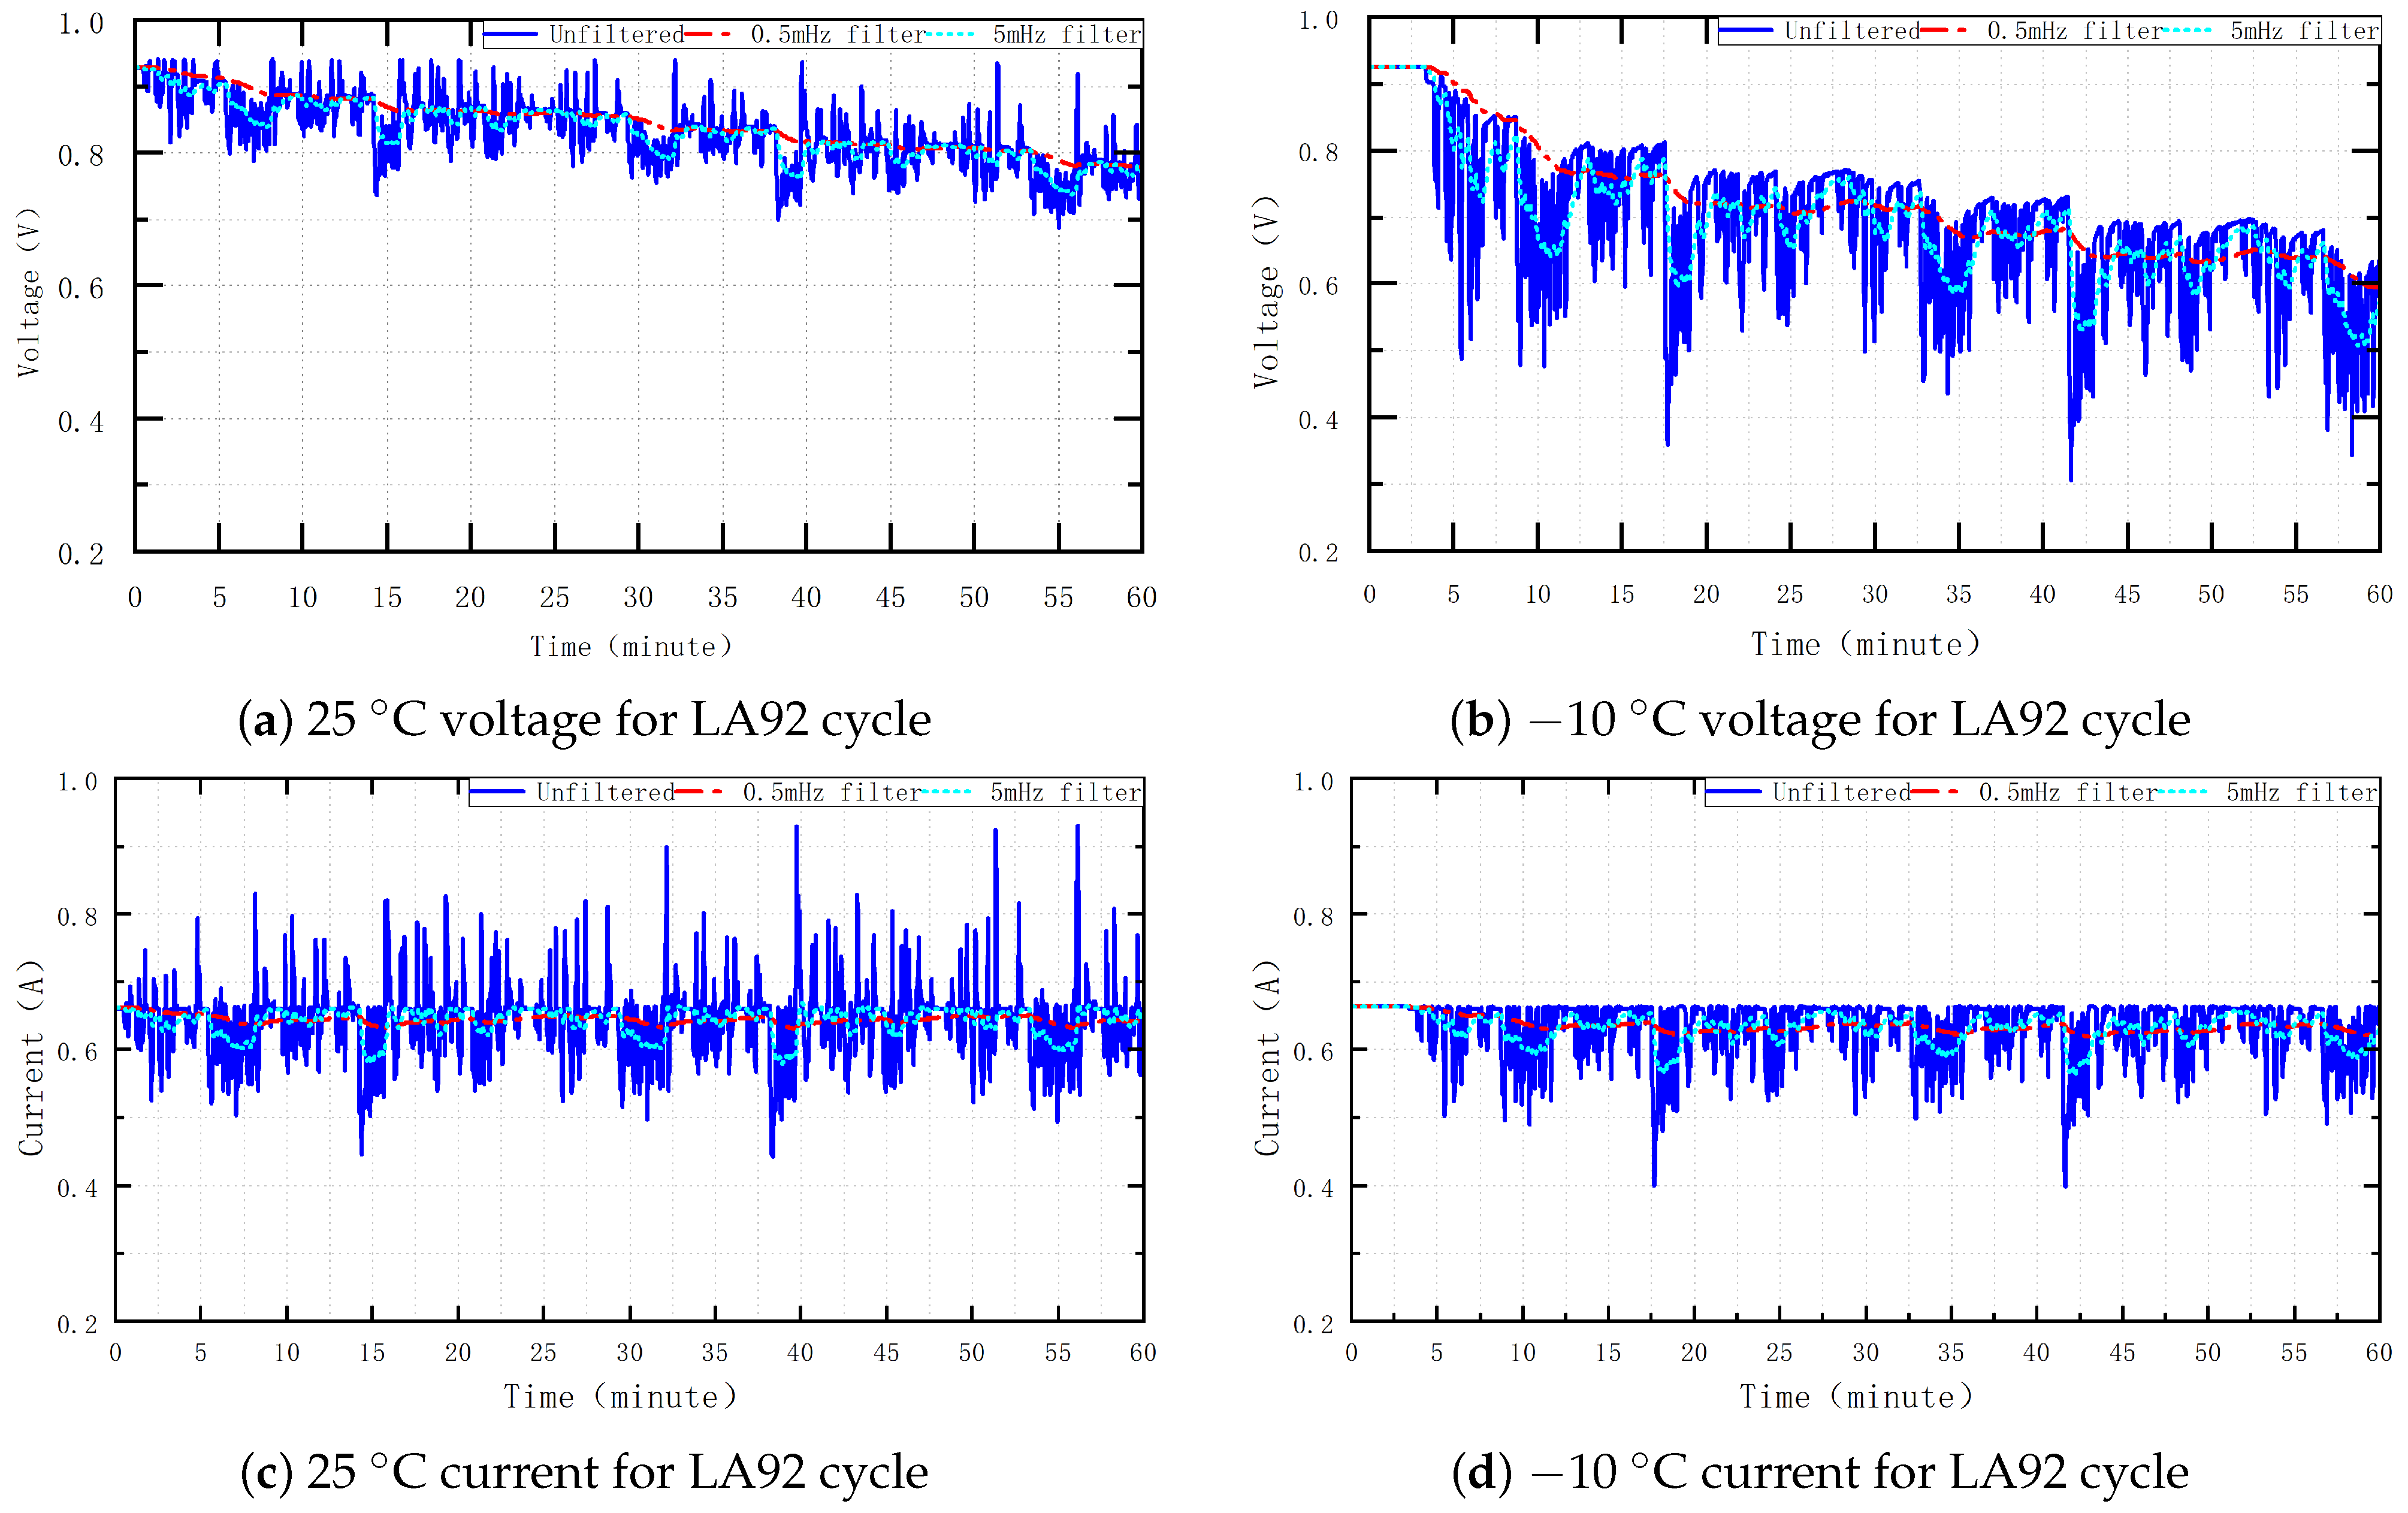
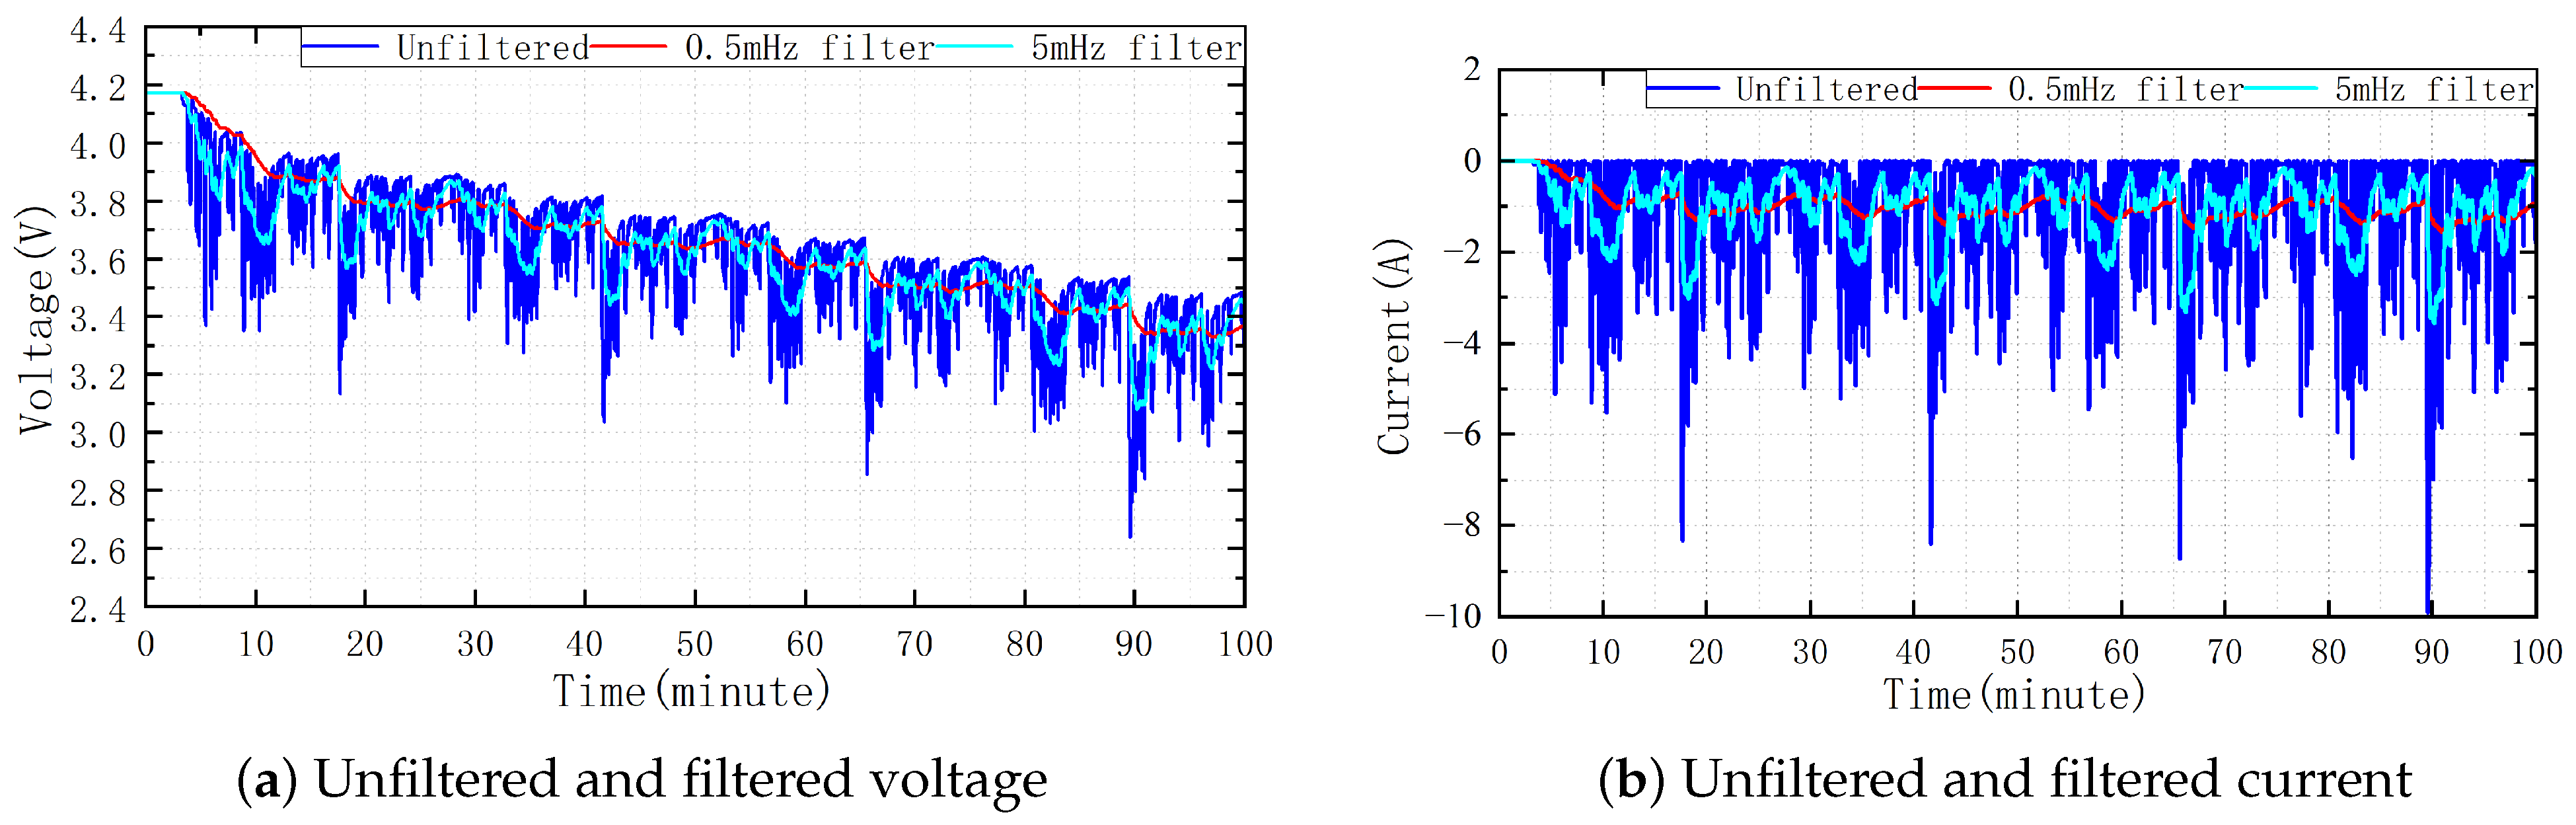
2.2. Data Processing

Two different types of lithium-ion batteries were involved in training the SOC evaluation model. Specifically, the chosen energy battery was the Panasonic NCR18650PF cylindrical battery, and the selected power battery was the Turnigy Graphene 65C pouch battery. Vidal and Malysz et al. (2022) collected open-source data for both cells. The original data can be found in [43,44]. We can obtain data for each cell through some laboratory equipment listed in Table 2 [45]. These devices include battery cyclers for precise measurement of voltage and current and constant temperature chambers for accurate regulation of the associated temperature.
In their study, Vidal and Malysz et al. (2022) [45] calculated power curves for electric vehicles using different driving cycles, including the standard Urban Dynamometer Driving Schedule (UDDS), New European Driving Cycle (NEDC), and the Los Angeles City cycle (LA92). The power scaling analyses were conducted separately for the Panasonic NCR18650PF cylindrical battery (energy battery) and the Turnigy Graphene 65C pouch battery (power battery). Vidal and Malysz et al. (2022) restructure, slice, and filter the data using a first-order low-pass Butterworth filter. A common approach is to normalize or standardize the input variables, eliminating the effect of unit differences in the input features and facilitating faster model convergence. Normalization typically involves scaling the input features to a specific range, such as [0, 1]. Min–max normalization is involved in the data. The normalization formula is given in Equation (2).
X * = ( n e w m a x n e w m i n ) / ( X m a x X m i n ) ( X X min ) + n e w m i n
In Equation (2), n e w m a x and n e w m i n represent the maximum and minimum values of the normalized interval, respectively. By normalizing the data, we can avoid finding the hyperplane of the local optimal solution and missing the global optimal solution in the support vector machine due to too large values. In Figure 2, the normalized voltage and current data for 25 C and −10 C are shown. It can be observed that the voltage deviation is relatively large with increasing time. The amplitude of the unfiltered voltage and current is relatively large. There are more spikes in voltage and current, which make SOC estimation more challenging. The amplitude of the voltage and current after normalization and low-pass filtering is relatively smaller. Because the original data were stored in .mat format files, the Python language was used for the design of the associated models in this paper. Therefore, the datasets were converted into CSV format by writing the code for data extraction using Matlab software(R2022b) to facilitate the application of the relevant model written in the Python language. The training data accounted for about 67% of the data, and the testing data was about 33% of the data. Test data are used to validate the good performance and generalization of the model under different cyclic criteria (LA92, NEDC, and UDDS criteria are chosen in this paper). At different temperatures (25 C, 10 C, 0 C, −10 C, −20 C are chosen in this paper), the model is verified to be sensitive to changes in temperatures and its effectiveness in extreme temperatures.

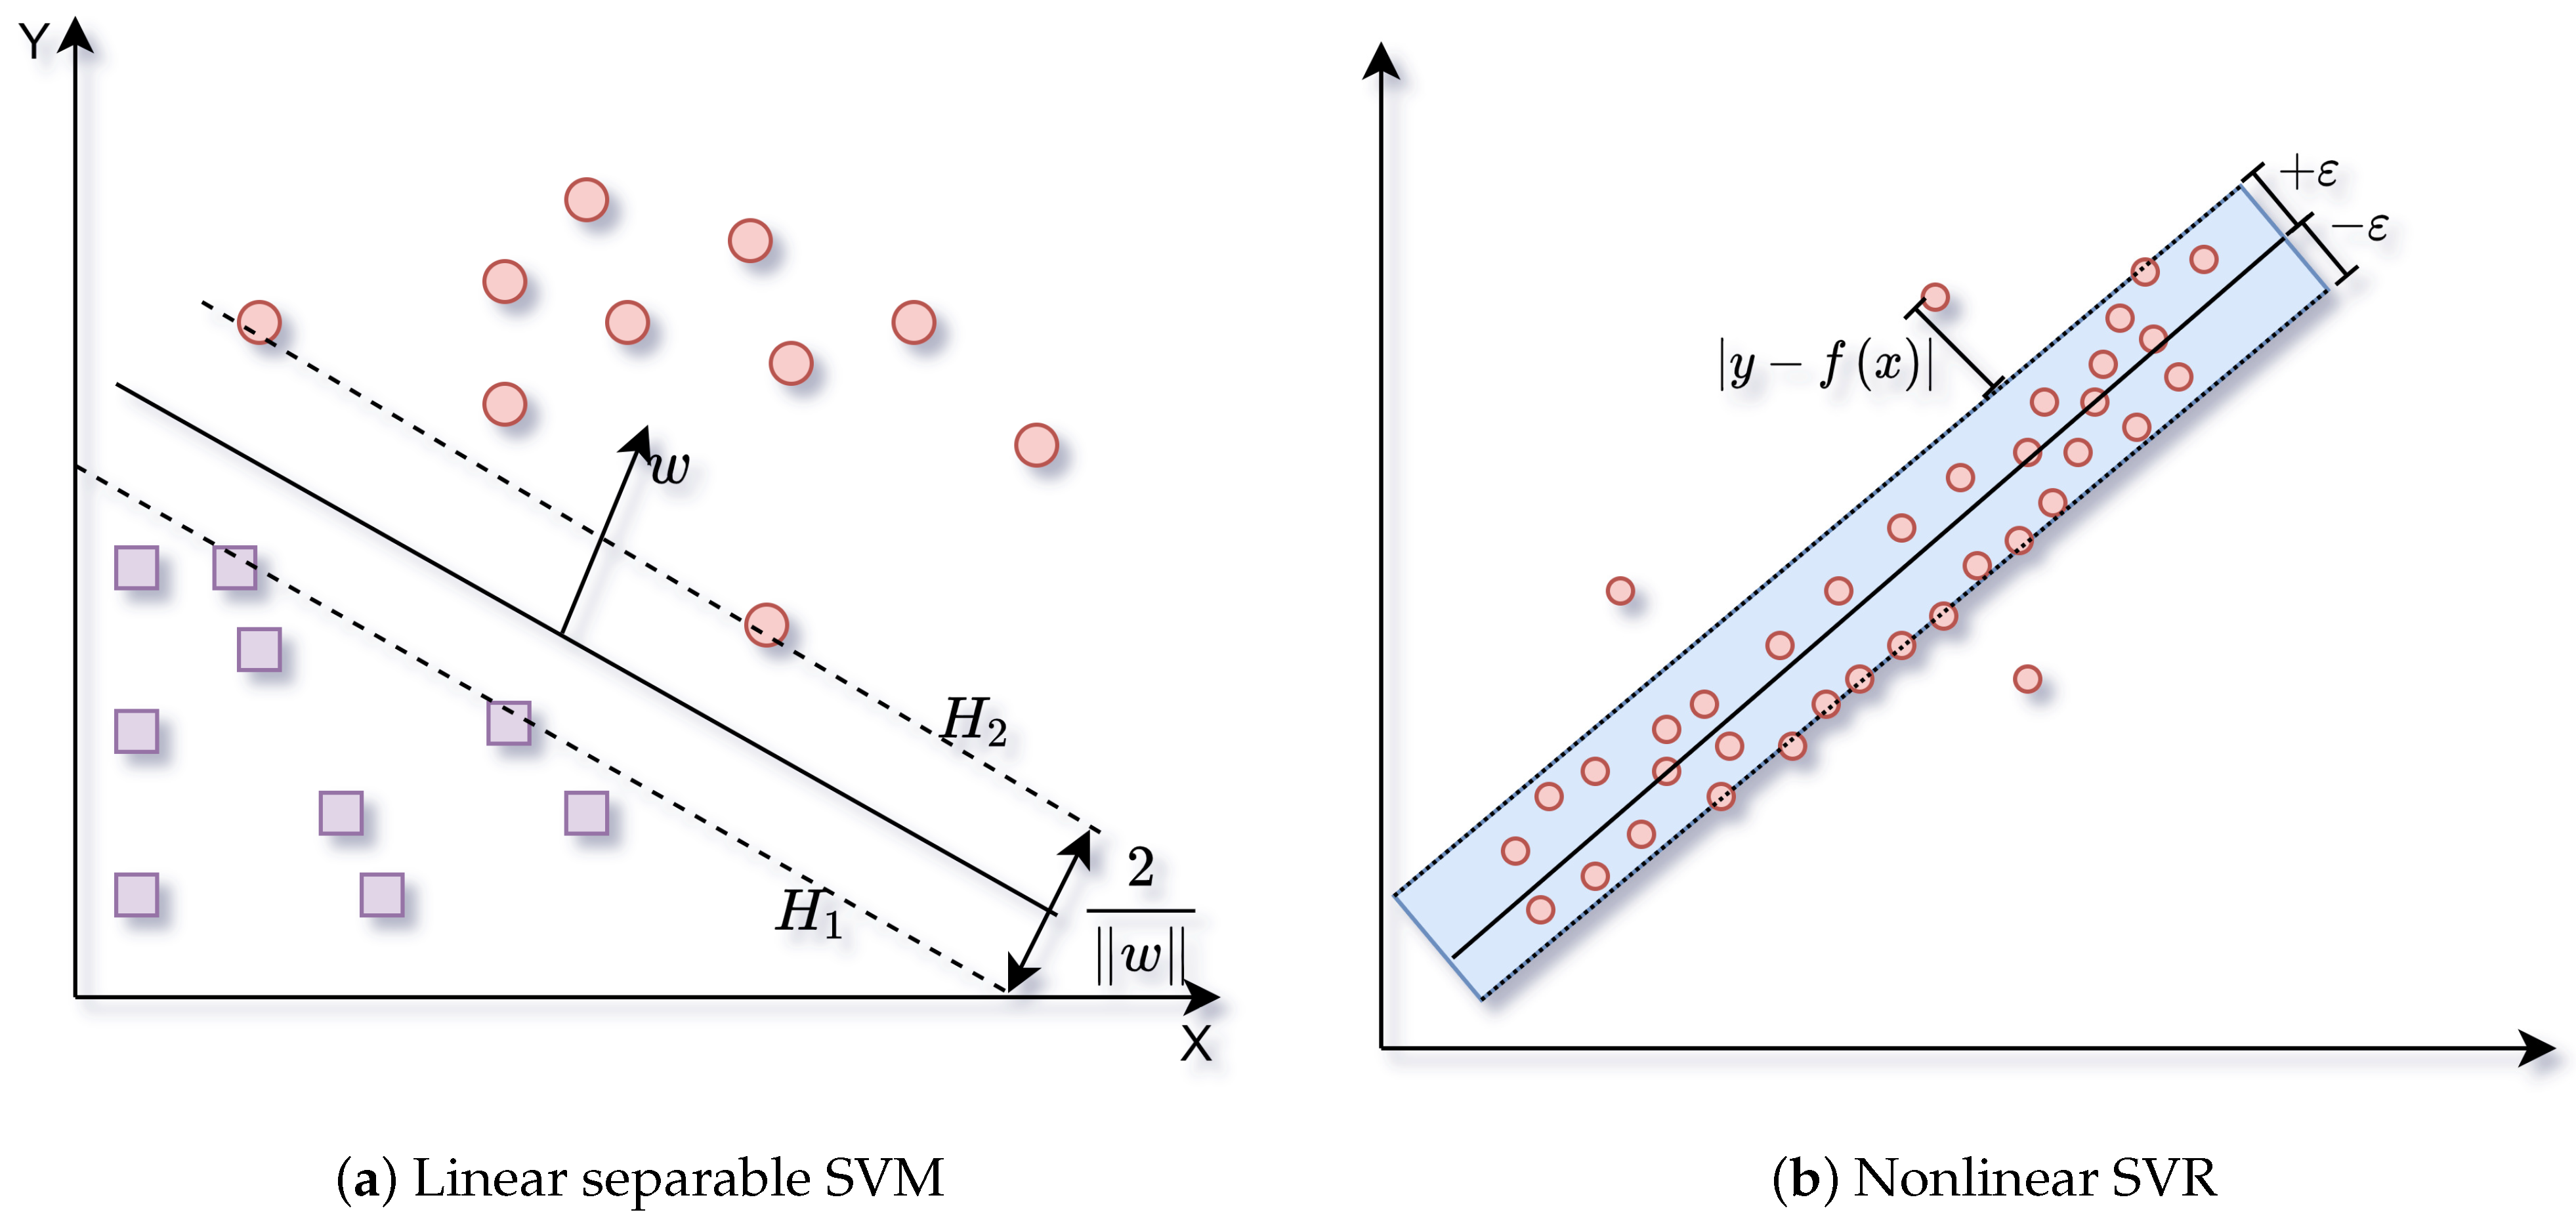
2.3. Support Vector Regression

The support vector machine (SVM) is a supervised machine learning algorithm initially developed by Vapnik. It was first introduced as a solution to the problem of binary classification in linearly separable cases. The introduction of the ε -insensitive loss function allowed SVM to handle data points that are not perfectly separable by a hyperplane. The loss function allows for a margin of tolerance ( ε ) where data points can be misclassified but still contribute to the objective function. It helps SVM to find a decision boundary that maximizes the margin and allows some errors. Figure 3a shows the points that fall on H 1 and H 2 are support vectors. As shown in Figure 3a, no points fall in the middle of the interval between H 1 and H 2 , indicating that the model can correctly handle the dichotomous classification problem. If the gap between H 1 and H 2 is larger, it means that the model generalizes well and can tolerate some errors. If the interval is smaller, the model’s accuracy may improve but is prone to over-fitting. The method was extended to the regression problem, and SVR was proposed. In the SVR model, C is the penalty factor. The larger the penalty factor C is, the more severely the penalty punishes for samples with training error greater than ε . The ε specifies the error size allowed by the regression function. When the ε is smaller, the regression function fits the training set better, but may cause the model to lack generalization ability. As shown in Figure 3b, the f ( x ) calculated by SVR is an estimation of the predicted value y. If the predicted value is within the + ε and ε interval, no loss is calculated. In Figure 3b, points that fall outside the blue interval will be penalized. The degree of penalty is determined by the penalty factor C.

3. GASVR Model and Result

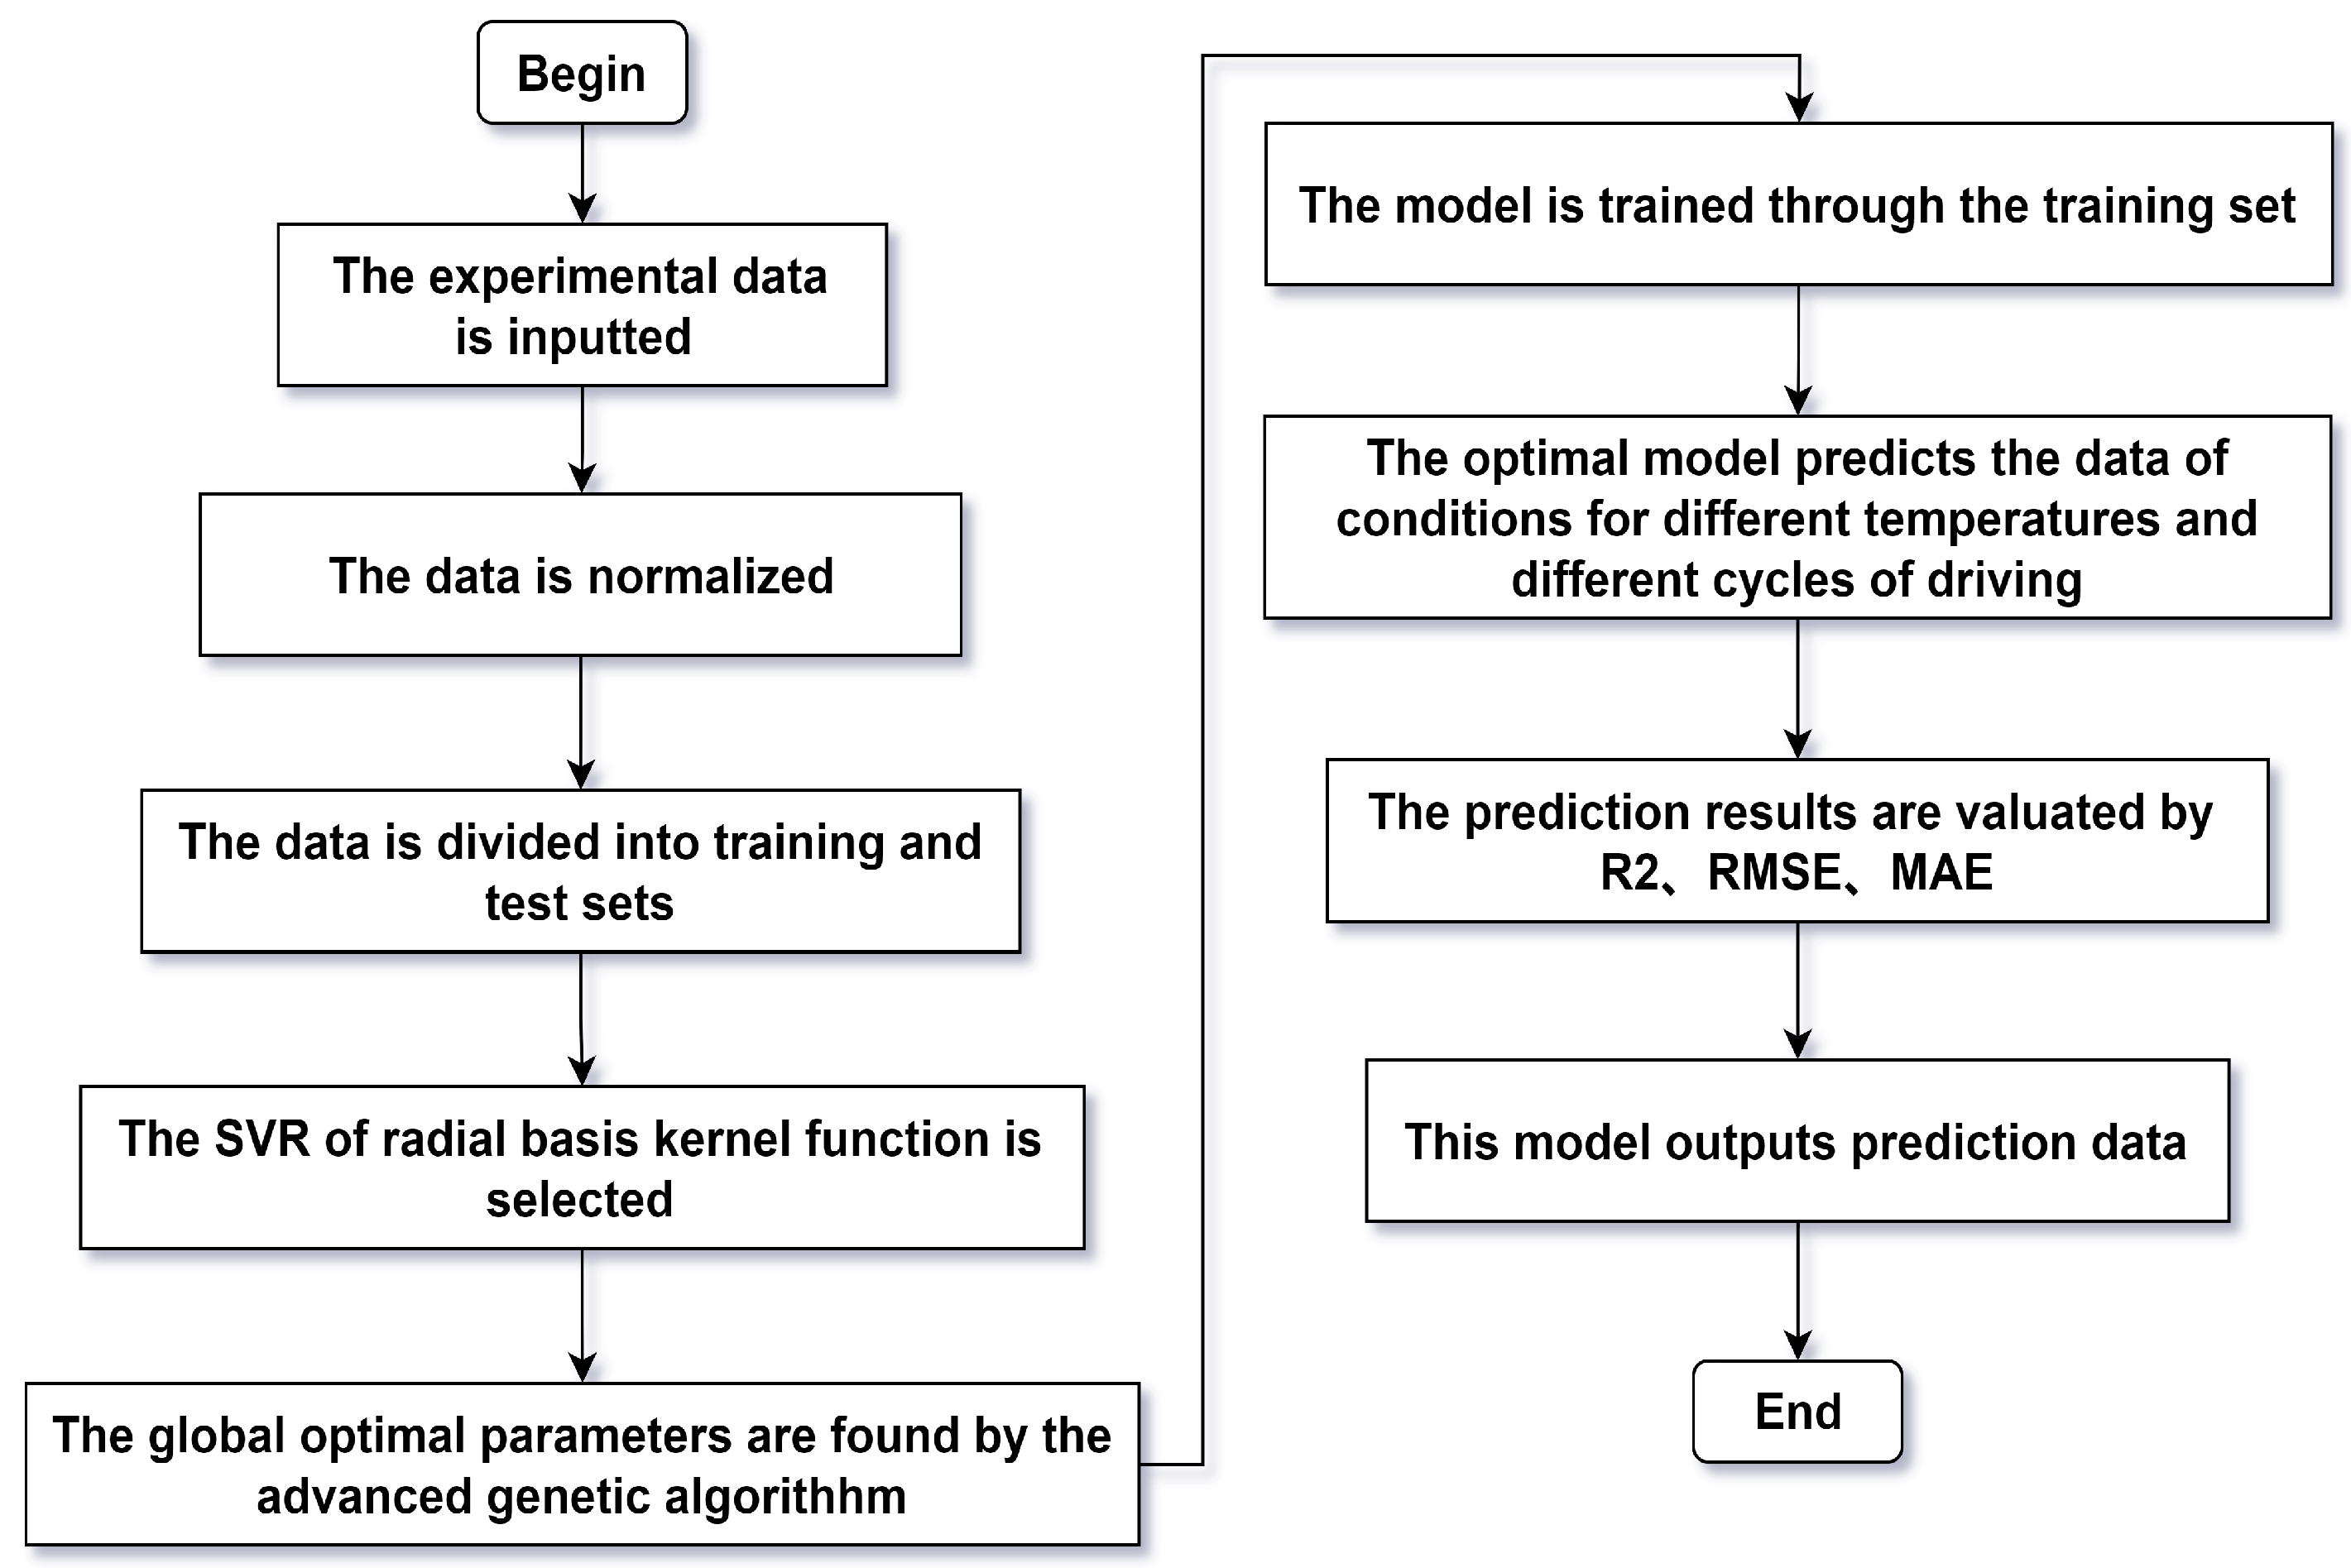
3.1. GASVR (Using the GA to Optimize SVR)

The SVR model is an extension of the support vector machine (SVM) model for the domain of regression problems. While SVM is primarily used for classificatory tasks, SVR is designed to handle regression tasks with the goal of predicting continuous numerical values. Indeed, SVR has gained significant popularity in academic and industrial settings due to its effectiveness in solving nonlinear regression problems. SVR offers several advantages contributing to its wide adoption in various domains [46,47,48,49]. While SVR offers numerous advantages, users must carefully adjust the model’s parameters to achieve optimal performance. The proper selection of parameter plays a crucial role in maximizing the effectiveness of SVR for fitting nonlinear relationships and ensuring robustness. It is crucial to carefully set the model’s parameters for effectively constructing SVR models. Failure to do so can lead to undesirable outcomes such as over-fitting or under-fitting. The right balance in parameter selection is essential for obtaining accurate and reliable predictions from SVR models. In the model proposed in this paper, the radial basis kernel function is chosen for its suitability in solving the problem. However, it should be noted that there is no universal guideline for selecting the specific parameters associated with this model. Deciding these parameters relies on careful experimentation and adjustment to achieve optimal performance. We propose employing a heuristic GA to address the parameter selection challenge. This algorithm simulates the genetics and evolution observed in biological populations, allowing the model to perform an optimal parameter search. By applying the GA, we can effectively explore the parameter space and identify the globally optimal hyperplane for our model. This approach enables us to obtain an optimized model that maximizes performance and accuracy. By the principles of genetics and evolution, we can overcome the limitations of manual parameter adjustment and enhance the efficiency and effectiveness of our model. Figure 4 shows the flow chart of the model building.
For the construction of our proposed model, the steps are as follows.
Step 1: The experimental data are read into the model designed in this paper.
Step 2: The normalized experimental data are obtained by Equation (2). The normalized data are regard as the model input dataset.
Step 3: The experimental data are divided into the dataset and the test set.
Step 4: The SVR of the radial basis kernel function is selected.
Step 5: Initial populations are generated. There are two general approaches for generating initial populations. The method of randomly generating samples is used with the condition of no prior knowledge about the problem to be solved. With some prior knowledge, the prior knowledge can be used to construct a set of solution spaces, and then the initial samples are randomly selected in this solution space. The model in this paper restricts the initial population to a set of solutions that satisfy the requirements. We use a randomized approach to generate initialized populations following a normal distribution. It ensures the diversity of the initialized population, reduces the probability of locally optimal solutions, and improves the efficiency of search.
Step 6: The model in this paper is trained with different parameters and is evaluated by the MSE method as an adaptive evaluation function.
Step 7: Based on the fitness from step 6, the model generates the next-generation population through selection, crossover, and mutation. The selection operation applies a roulette wheel to screen populations with high fitness into the next generation. The fitness of individual X i is f X i . The probability of being selected as the next generation is
p X i = N f X i / j = 1 N f X i
In Equation (3), N is the size of populations (sizePop). The crossover operation is performed by the linear combination of two chromosomes with probability p ( p 0 , 1 ). The crossover operation is expressed in mathematical language as X 1 = p X 1 + 1 p X 2 X 2 = p X 2 + 1 p X 1 .
Step 8: The SVR model is retrained and tested with the next generation of parameters. If the desired effect is achieved, the model proceeds to the next step; otherwise, it continues to repeat step 7 and step 8.
Step 9: The training finish and the global optimal parameters are obtained for the model with optimal SVR. After finally obtaining the optimal model proposed in this paper, we measure the model’s performance by different test sets. After continuous experiments, the GASVR in this paper finally achieves good results.

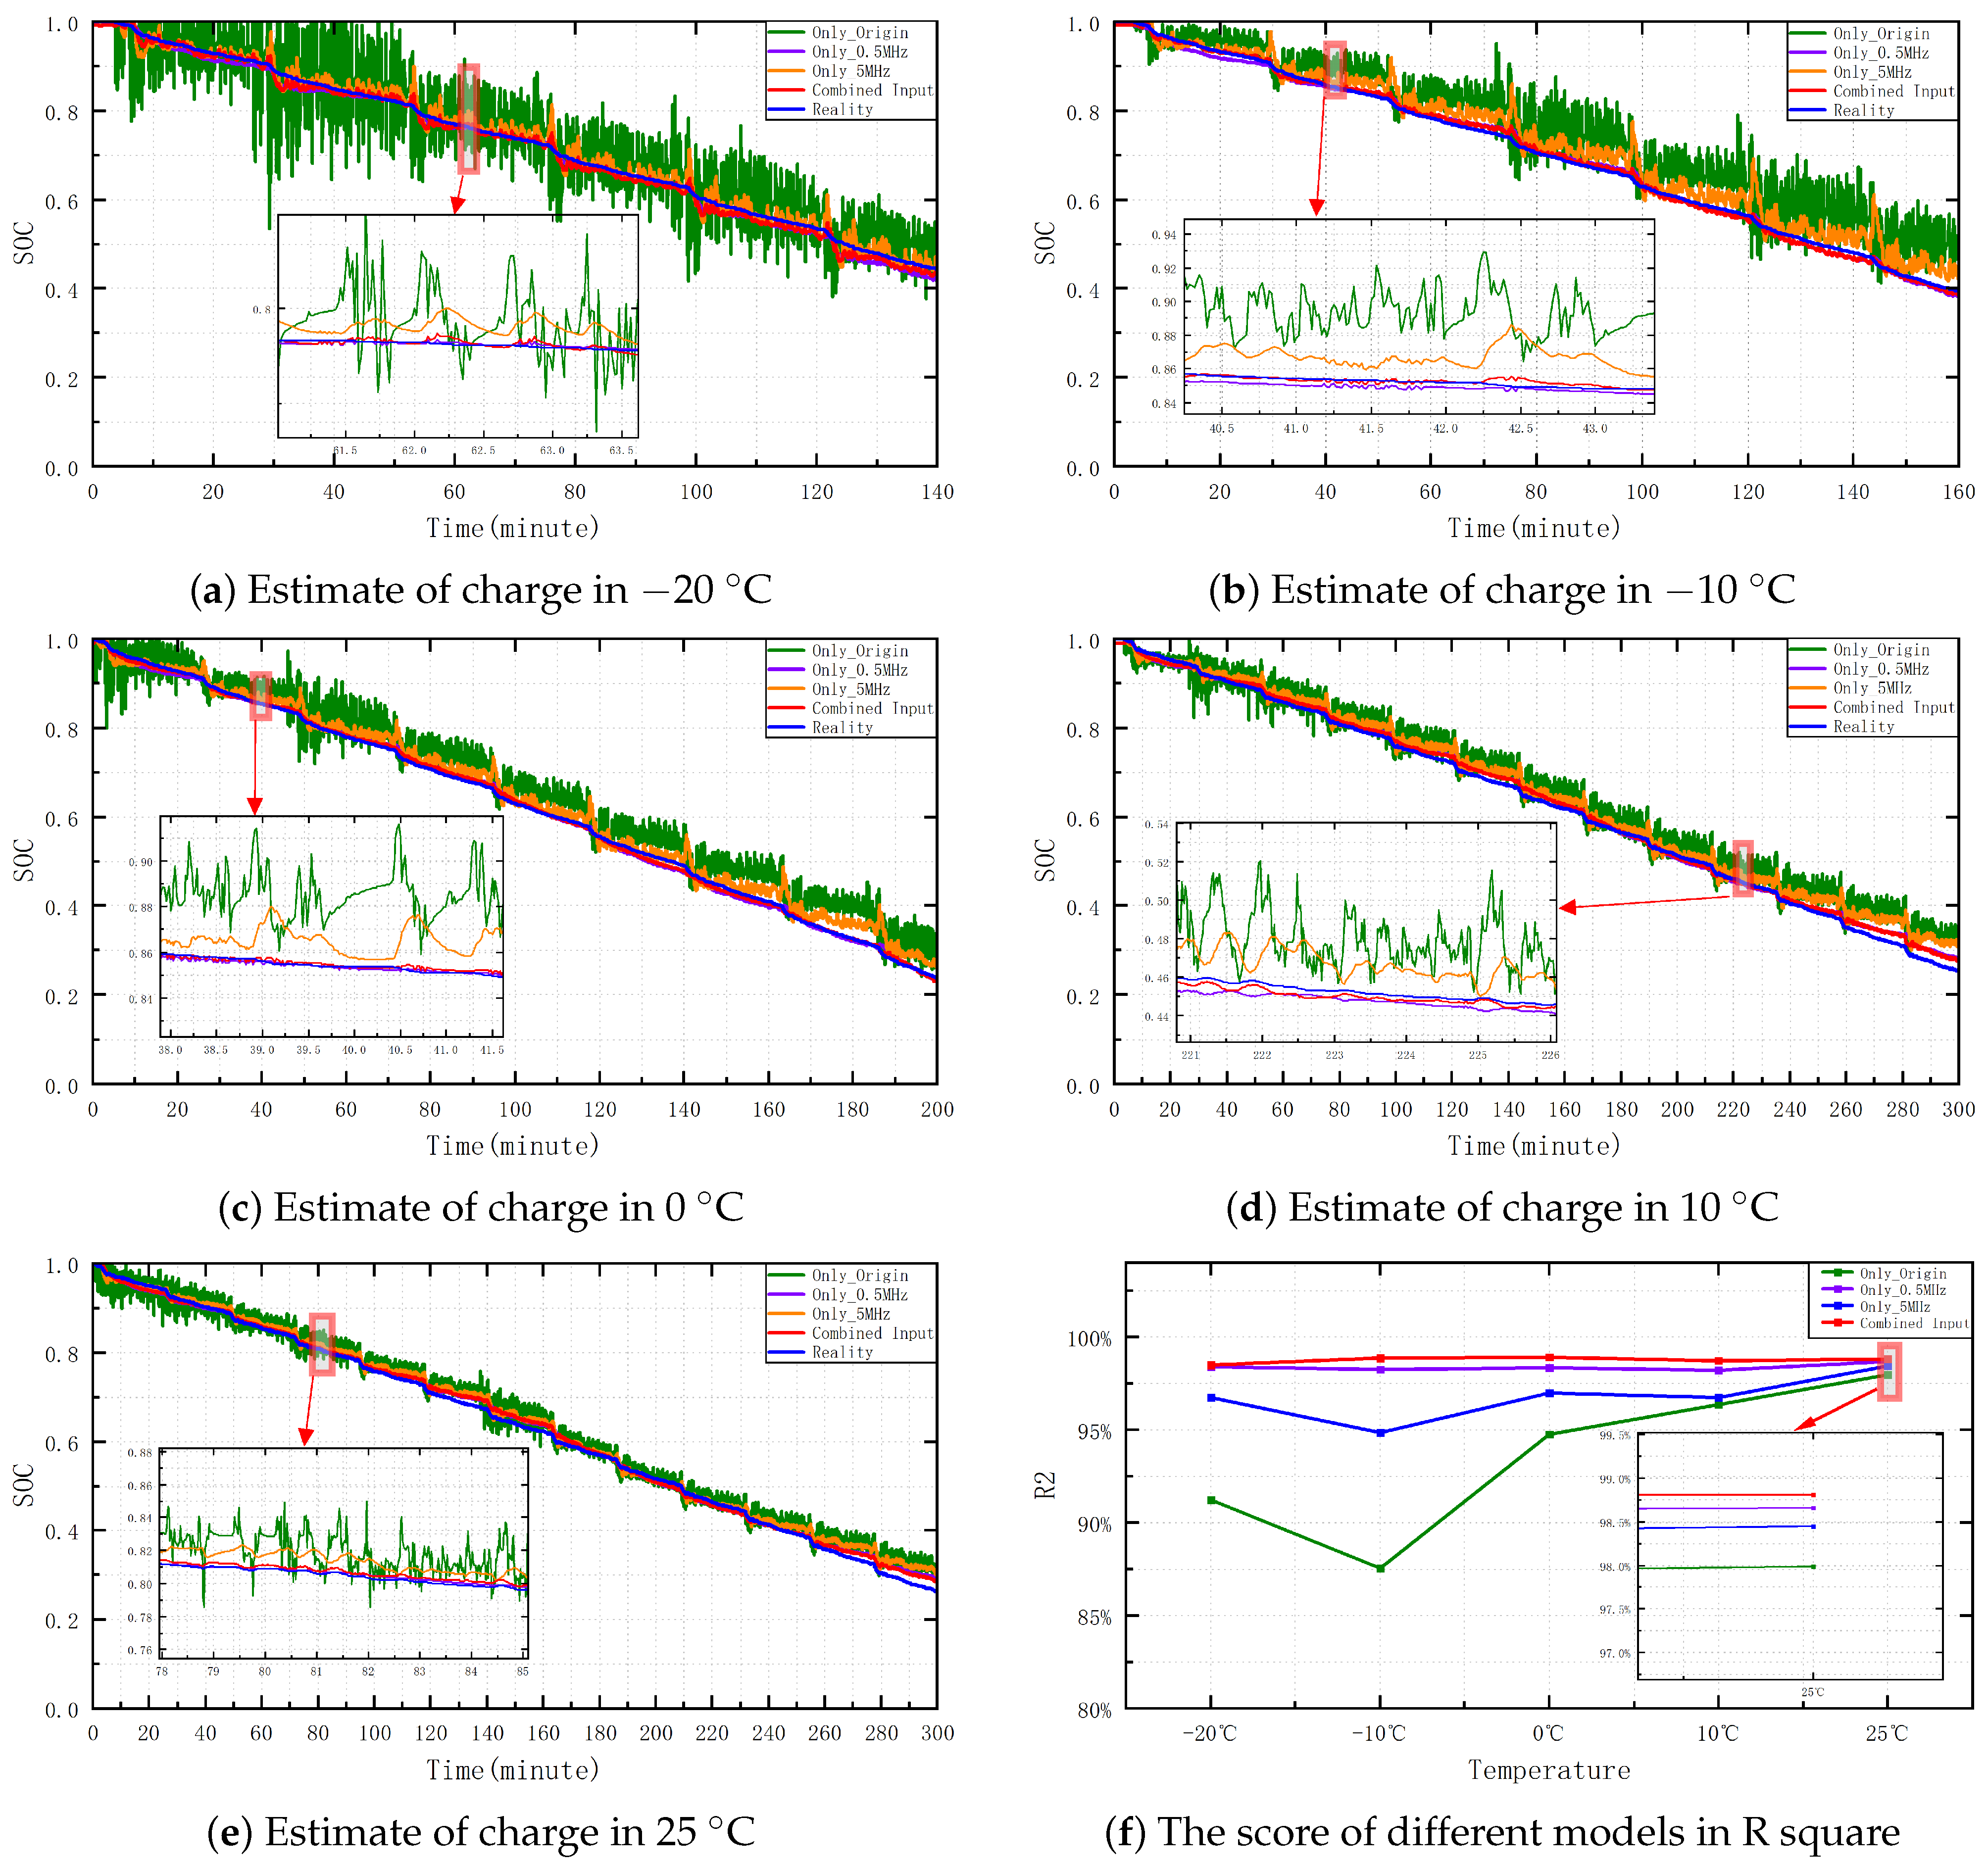
3.2. Impact of Input Data on the Model

The quality of the input data plays a crucial role in the performance of the lithium-ion battery SOC estimation model. It is vital to ensure that the input data are reliable and free from noise or outliers. When using multiple dimensions of data for estimation, handling the differences of dimensions is essential to avoid over-fitting. This paper employs different input data to evaluate the impact of input data on the performance of the GASVR model. Figure 5a,b shows the unprocessed voltage and current data. More spike voltages and spike currents quickly affect the accuracy of the model evaluation. The filtered voltage and current, at 0.5 mHZ and 5 mHZ, are smoother than the original voltage and current. In this study, we conducted training using different input configurations to investigate their impact on the model’s performance for lithium-ion battery SOC estimation. Specifically, we trained four models with different input settings:
Original Input: The model was trained by applying the original voltage, current, and temperature data without additional processing.
Low-Pass Filtered Input (0.5 mHZ): This model employed the voltage, current, and temperature data after applying a low-pass filter with a frequency of 0.5 mHZ. The lower frequency was chosen to retain more of the lower-frequency components of the signals while still attenuating higher-frequency noise.
Low-Pass Filtered Input (5 mHZ): Similarly, the model applies the voltage, current, and temperature data that underwent a low-pass filter with a frequency of 5 mHZ. This filtering process aimed to remove high-frequency noise and fluctuations from the input signals.
Combined Input: The model in this paper utilized a combination of the voltage, current, and temperature data obtained from both the 0.5 mHZ and 5 mHZ low-pass filtered outputs. This combined input aimed to incorporate information from higher and lower frequency components. This method provides a more comprehensive representation of the battery’s behavior.
By training and evaluating models for the different input dataset, we aimed to investigate the influence of different input configurations on the accuracy and robustness of the SOC estimation. In Figure 6a–e, we use data from the UDDS standard to verify the fitting ability of the model. The model fit of the input data raw voltage and current versus temperature is unsuitable, deviating from the relatively sizable actual value, and the prediction results fluctuate widely. The model in this paper employs the combined input data. The model has the most minor error and can fit the real value better. In Figure 6f, the R2 score evaluates the prediction accuracy of different models at different temperatures. The R2 scores of the model with the original data as input are the worst regardless of the temperature. However, the proposed model with combined input data performs best among the models shown in Figure 6f. The GASVR can predict the SOC of lithium-ion batteries more accurately. The accuracy of all four models decreased when fitting the SOC in the −10 C environment. The model with raw data as input has the most significant decline. Table 3 shows that employing the joint inputs can be the model to reach the optimum. This result may be due to combining information from high-frequency and low-frequency components. However, the input data are the original input resulting in poorer accuracy, possibly due to the large number of spike voltages and currents. The ability to have larger datasets would provide deeper insights, generalizability, and reliability of results. For example, in the domain of automated cars, Wei Liu and Xin Xia et al. (2021) designed the vehicle attitude angle observer based on the square-root cubature Kalman filter (SCKF) to estimate the roll and pitch [50]. In the future, incorporating important parameters such as the roll and pitch to predict the SOC is a worthwhile area to investigate and explore.

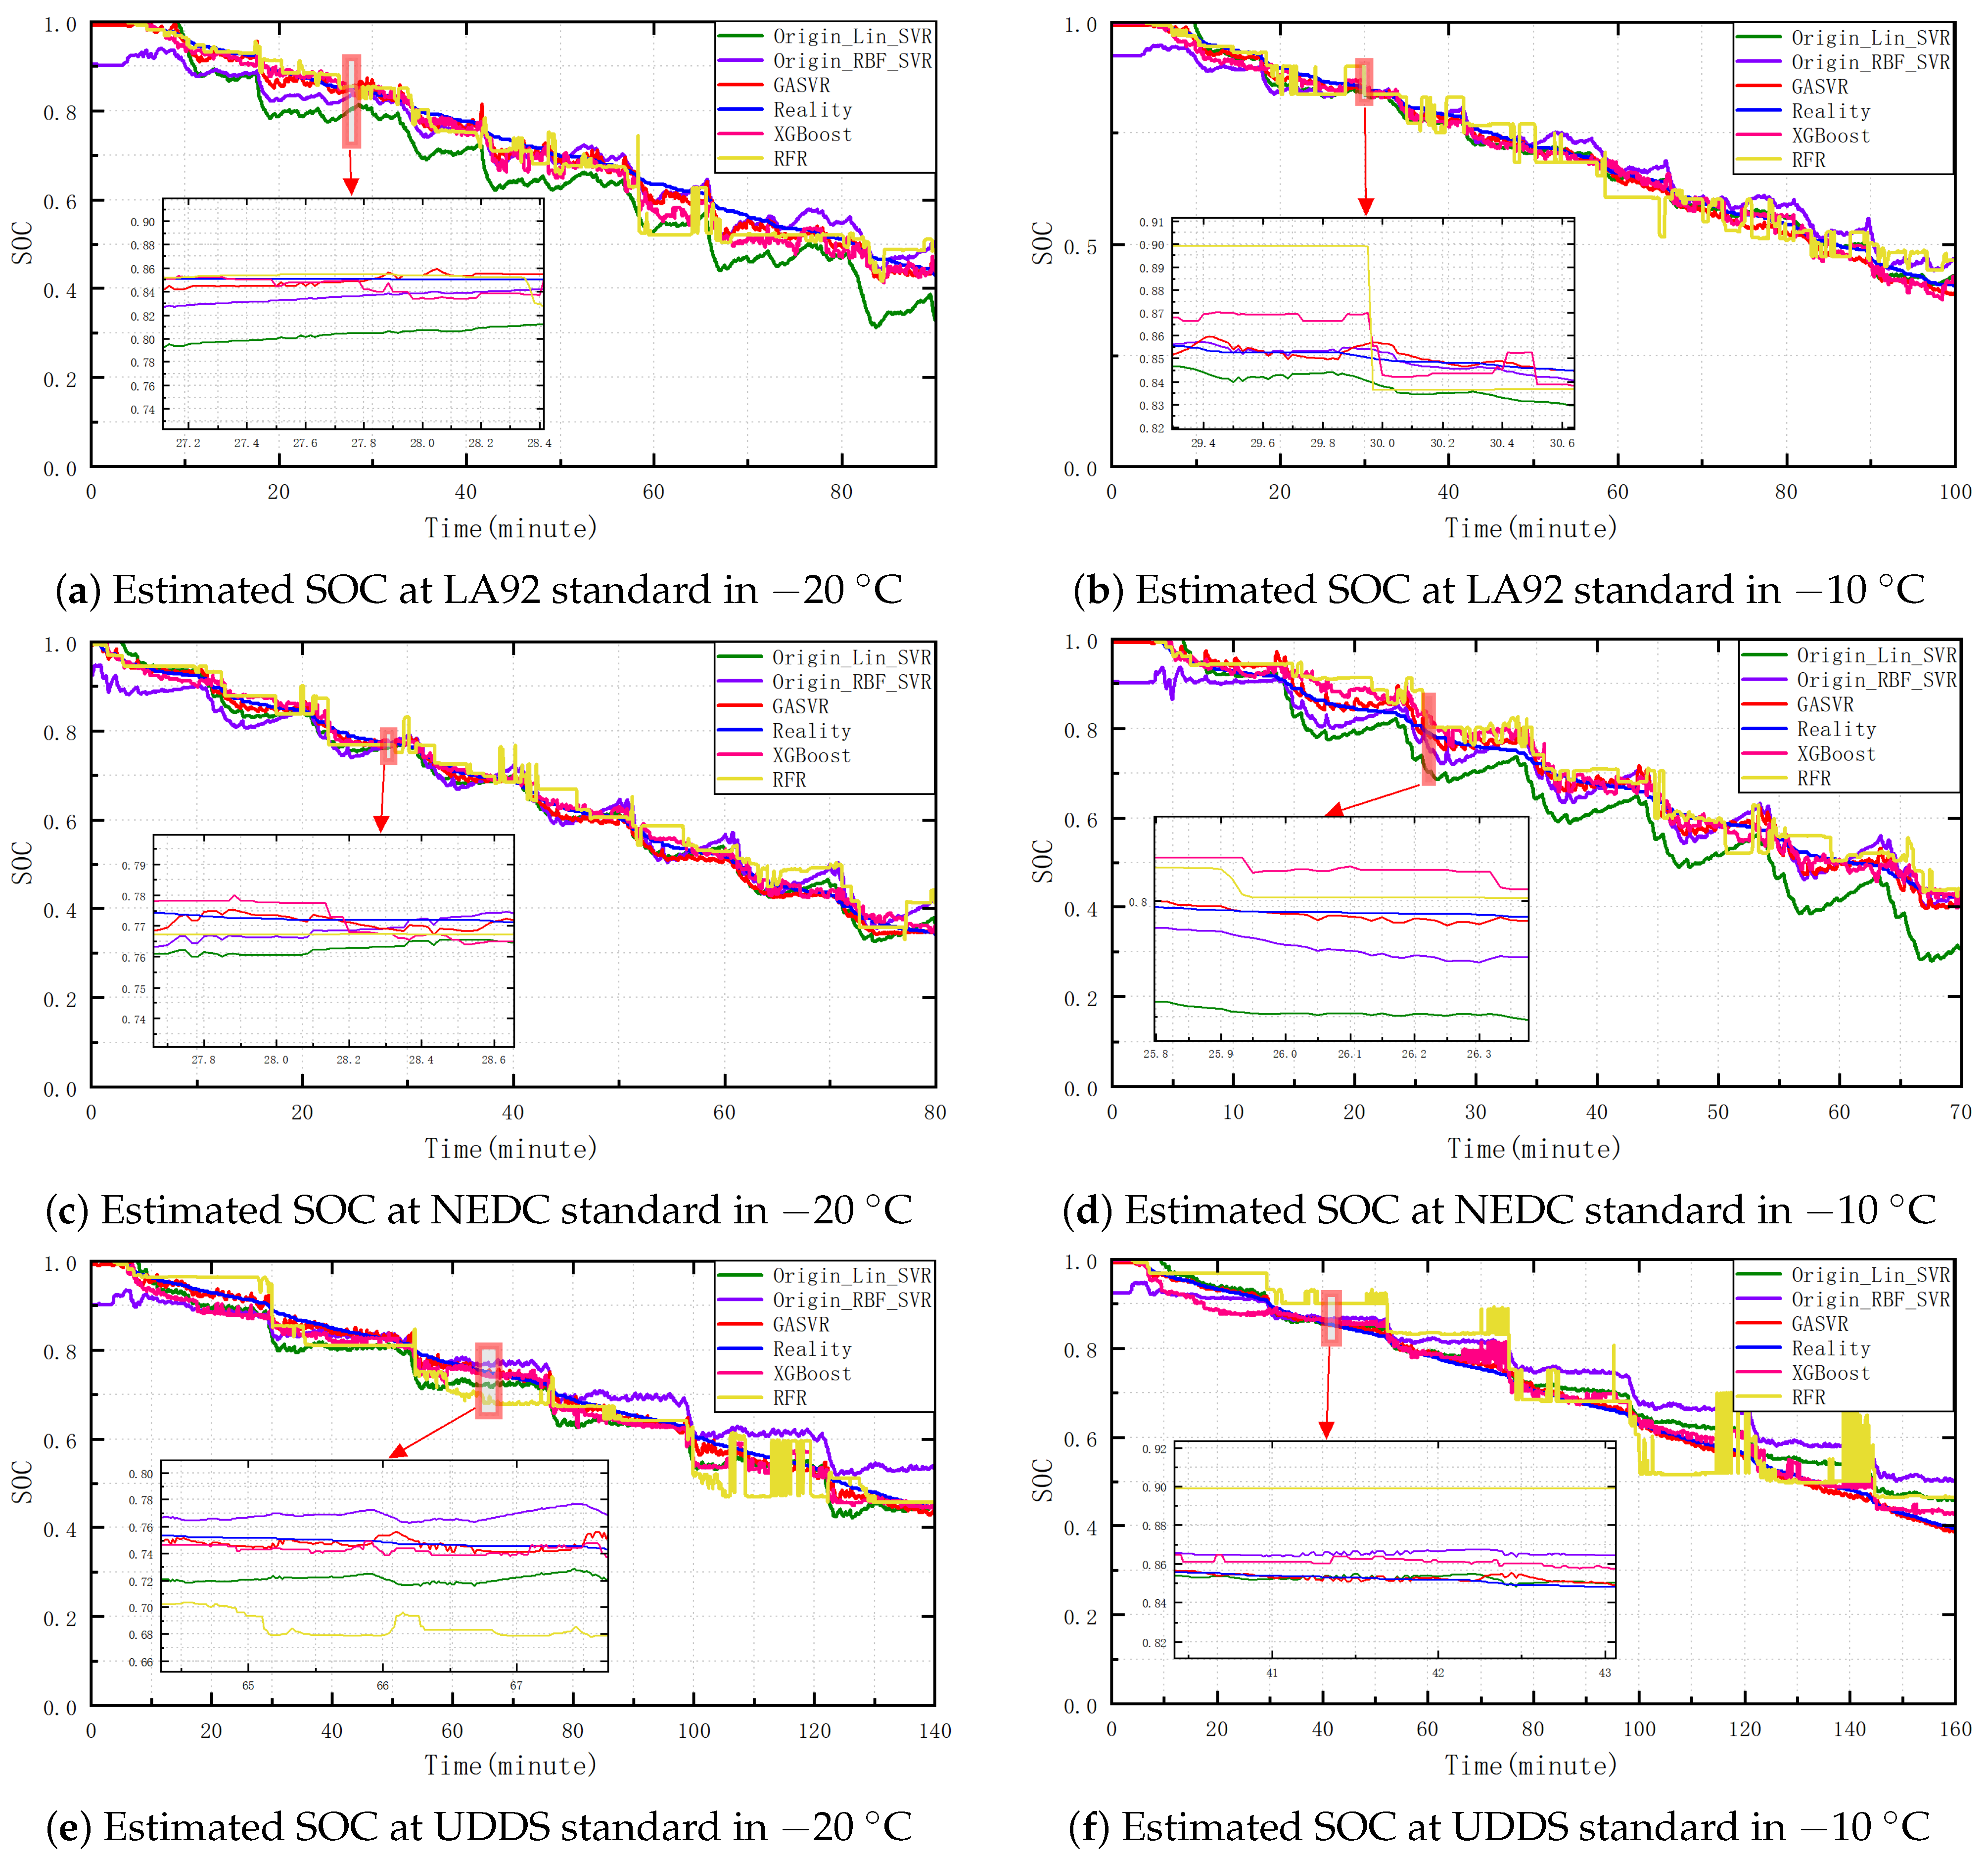
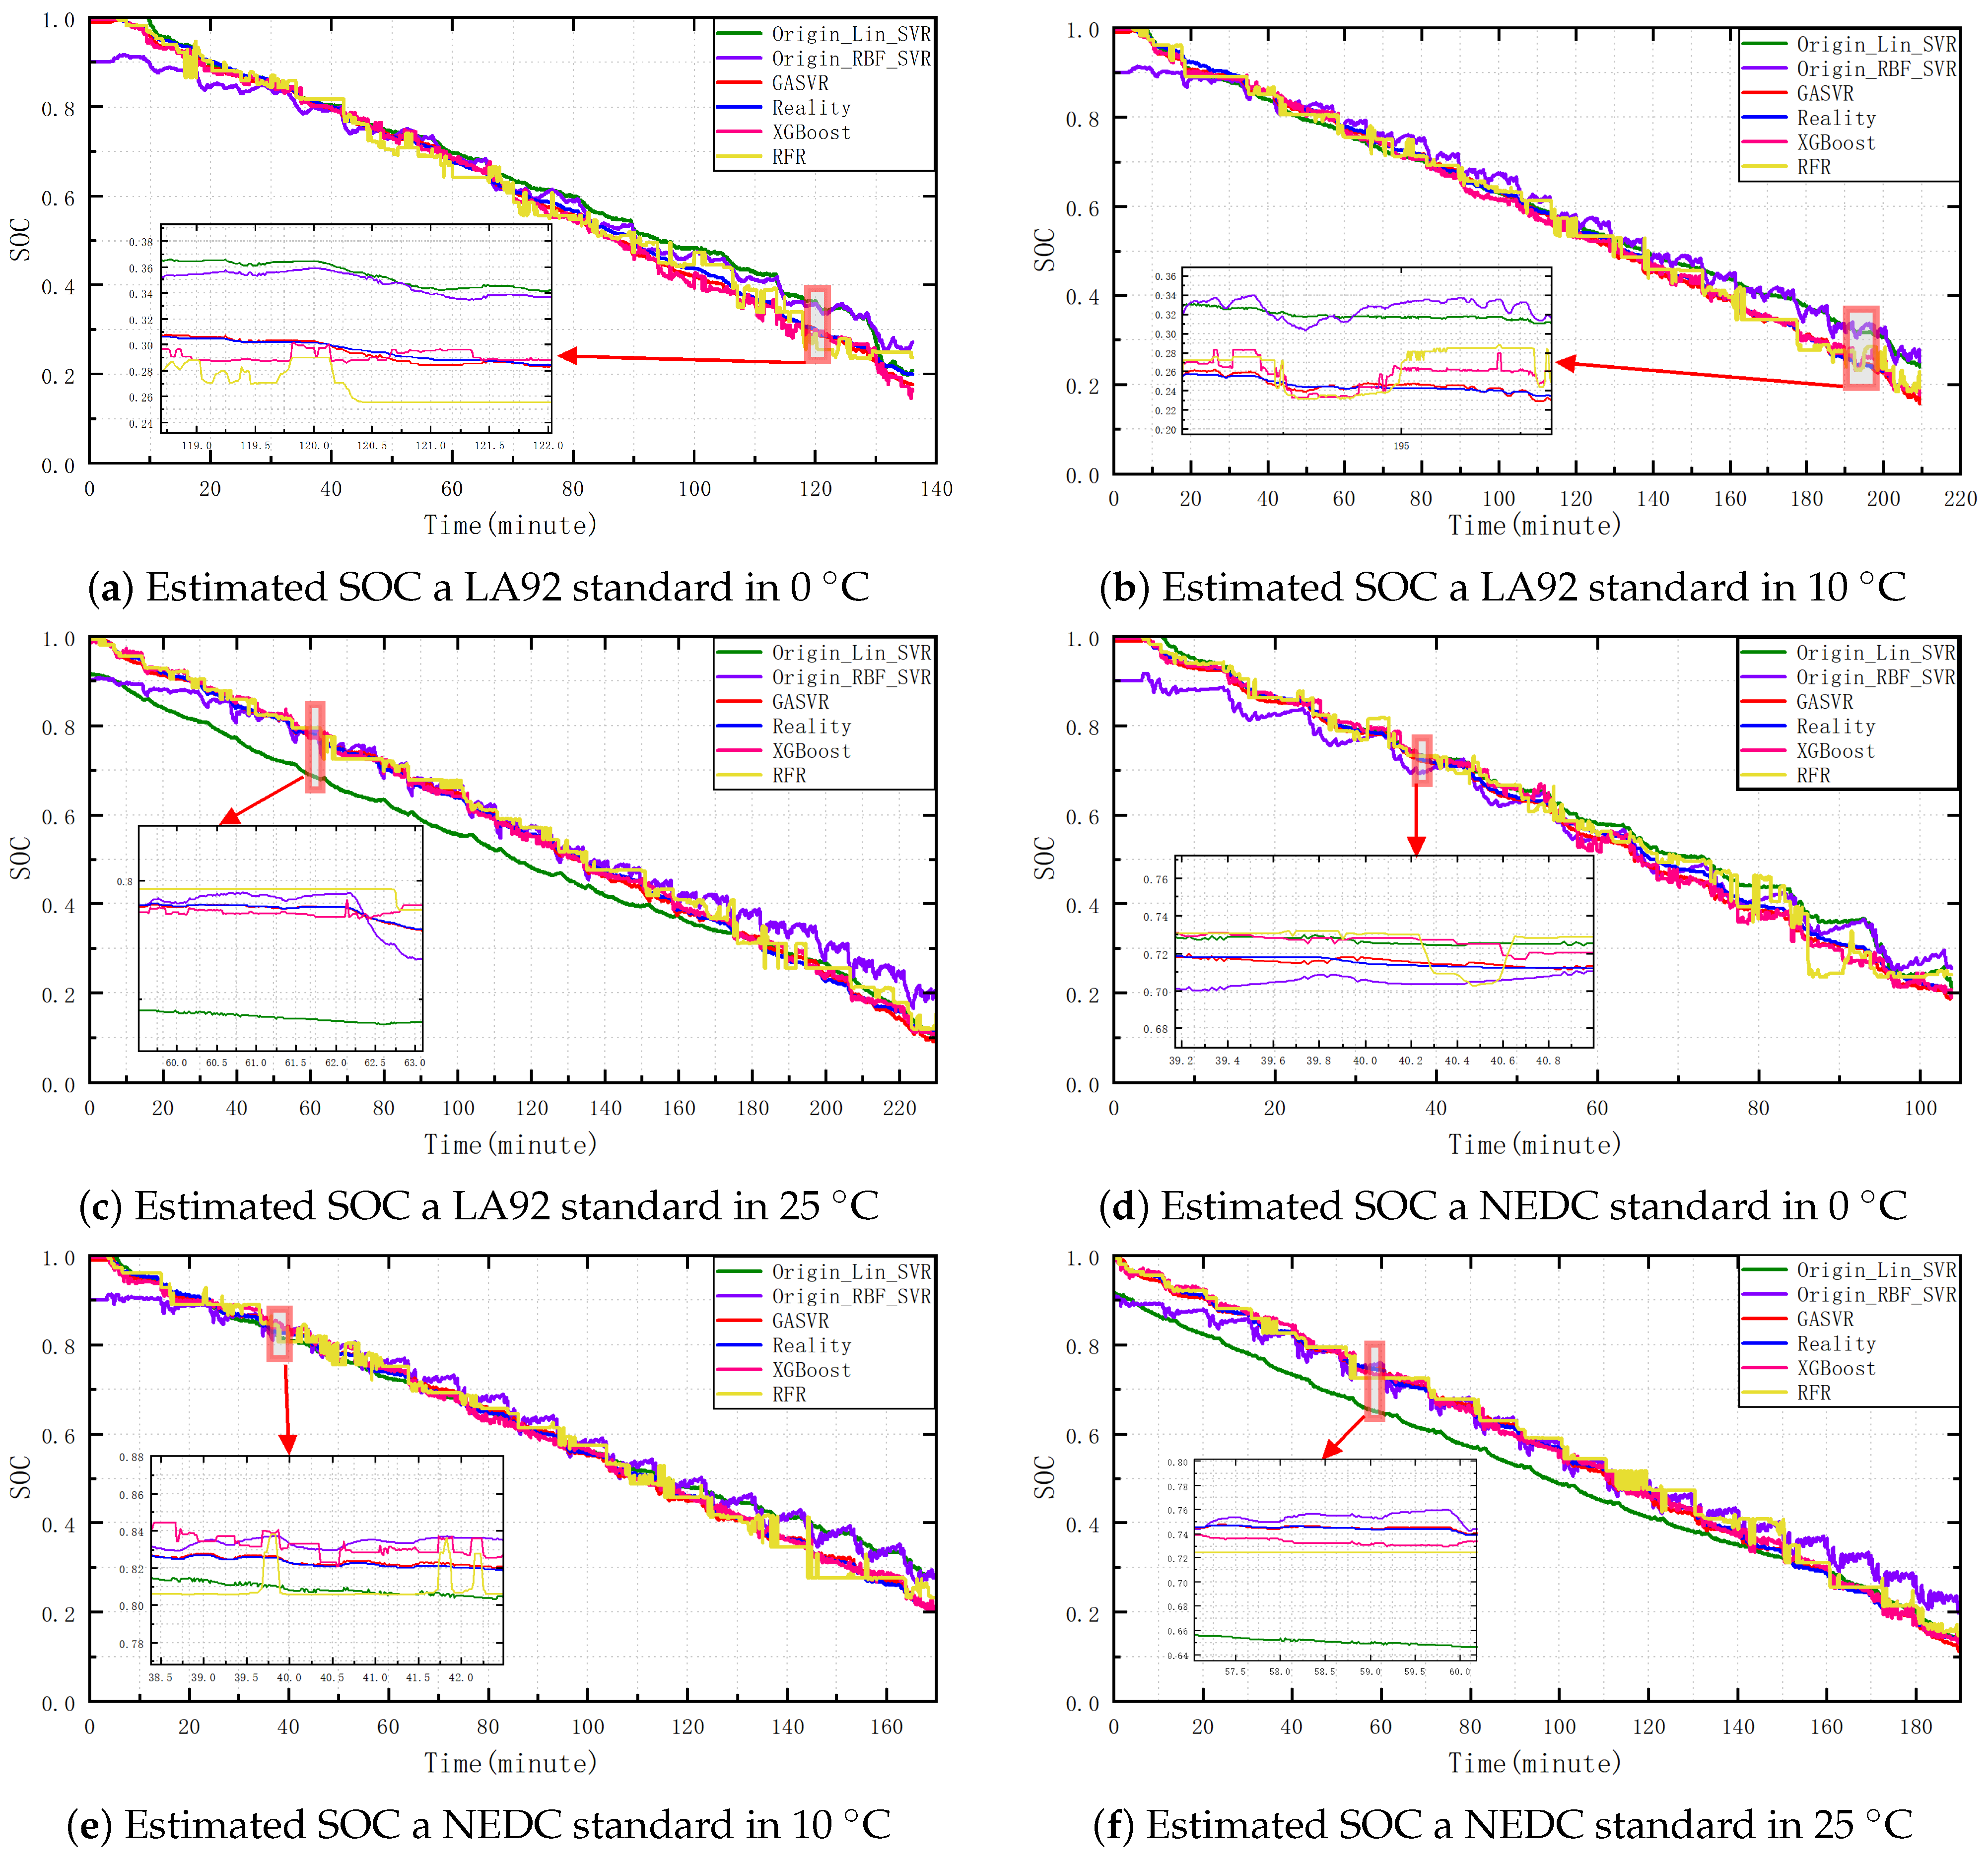
3.3. Impact of Temperature

Estimating the SOC of lithium-ion batteries becomes more challenging at 0 C and below due to the temperature sensitivity of SOC and battery resistance. The proposed model will be verified using three working conditions at −20 C and −10 C. This evaluation will provide insights into the model’s performance under challenging temperature conditions. In Figure 7, the comparison model predicts poorly at extreme weather temperatures and fails to achieve the desired goal. The extreme gradient boosting (XGBoost) model has better accuracy in comparing models. However, it has excellent instability. The random forest regression(RFR) model is more stable than XGBoost, but the accuracy is not very high. The temperature influence the chemical composition inside the lithium battery. This reason could cause the relatively poor accuracy of the comparison model. The GASVR fits the SOC at extreme temperatures better and has better accuracy and robustness. Using the R2 score to measure the model in the above scenario, the results derived from Table 4 are the same as in Figure 6. The GA proposed in this paper optimizes the SVR model best, and the GASVR also achieves the expected results. In daily life, people have different behaviors towards driving new energy electric vehicles. The acceleration of driving new energy vehicles in winter may cause lithium-ion battery SOC to be more challenging to estimate. In the future, if more general driving behavior datasets can be collected, this will help to improve the practicality and accuracy of estimating SOC in extreme weather.

3.4. Results

The effect of three kinds of lithium-ion battery SOC estimation at 0 C, 10 C, and 25 C is demonstrated to verify the validity and accuracy of the model in Figure 8 and Figure 9. The unoptimized linear kernel function model and the radial basis kernel function model show poor fitting performance. The RFR model and XGBoost model demonstrate better prediction accuracy above 0 C. However, the detailed plot indicates that the XGBoost model fits better than the RFR model. However, the proposed model achieves improved accuracy for predicting the SOC by utilizing the GA to enhance the accuracy. The GASVR model could better fit the SOC curves of different standards above 0 C. The GA optimization enables the model to effectively handle the complexities of the data and provide more accurate predictions. From the comparison of Figure 9d, the model proposed in this paper exhibits the highest R2 score under the UDDS criterion. The high R2 score indicates a strong correlation between the predicted real SOC and validates the proposed model’s effectiveness in capturing the lithium-ion battery’s SOC dynamics. Interestingly, the unoptimized radial basis kernel function model outperforms the unoptimized linear kernel function model in the evaluation metric at 25 C. The RFR model is better than the XGBoost model. However, the opposite result is shown in the unoptimized radial basis kernel function model and the RFR model at the other two temperatures (−10 C and −20 C). The GASVR model improves accuracy compared to the comparison model. Due to irregular user driving manners and different standards of battery manufacturing, the GASVR will have potential limitations and computational complexity. If the computational complexity of the SVR is optimized in the future, this method will enable the model to operate in real-time embedded systems with limited computational resources.

3.5. Model Evaluation Methods

Indeed, there are various evaluation methods to assess the accuracy of regression-based models. Three commonly used metrics are Mean Squared Error (MSE), Mean Absolute Error (MAE), and R-squared (R2) score. The R2 score represents the proportion of the variance in the dependent variable explained by the independent variables. A R2 score close to 1 indicates that the model can explain a large portion of the variance (statistics) in the data, which suggest a good prediction. A high R2 score implies that the predicted values are close to the valid values and the model captures the underlying patterns and relationships in the data. This evaluation method can indicate the accuracy of the model’s fit to the overall data. The formula is
R 2 = 1 i = 1 n y i y ^ i 2 / i = 1 n y i y ¯ 2
In Equation (4), y i is the real value, y ¯ is the mean of the sample, and y ^ i is the predicted value. The meaning of these variables also applies to the following equation. RMSE is a measure derived from the MSE by taking the square root. It evaluates the residuals of the model by considering the standard deviation of the data. RMSE is particularly sensitive to outliers in the data and magnifies their impact on the overall error measurement. A lower RMSE value indicates a higher model accuracy. When the RMSE value is smaller, it implies that the residuals of the entire dataset are also smaller. A smaller RMSE means the predicted values are closer to the real values, resulting in a more accurate model. The RMSE formula is
R M S E = i = 1 n y i y ^ i 2 n
The MAE is calculated by taking the average absolute differences between the predicted and real values. Unlike RMSE, MAE does not consider the squared differences and only measures the magnitude of the errors. when the direction of errors is not critical, MAE is commonly used as an evaluation metric. The focus is on the overall magnitude of the errors. The MAE formula is
M A E = i = 1 n y i y ^ i / n
When evaluating regression-based models, the most effective method is typically the RMSE. RMSE considers the squared differences between the predicted and real values, measuring the magnitude of the errors. Table 5 gives the models’ evaluation results using the above method, showing the difference between the predicted and real values of the different models. Table 5 shows that the proposed model’s accuracy is significantly higher than the comparison model’s accuracy. The GASVR demonstrates a high accuracy fit for the test data, as evidenced by its low RMSE and MAE scores. The RMSE and MAE scores measure the model’s predictive performance, with lower scores indicating a closer alignment between the predicted and real values. Compared to the other models, the proposed model outperforms them regarding both RMSE and MAE, suggesting its superior predictive capability. By incorporating a heuristic GA, the model in this paper achieves improved global search capability and prediction accuracy. This optimization process leads to a significant improvement in the prediction accuracy of the model. The GA ensures that the model not only performs well in terms of local optimum but also attains a higher level of accuracy by considering the global optimum. Consequently, the GASVR stands out for its superior prediction accuracy, making it valuable in lithium-ion battery SOC estimation.

4. Conclusions

Due to the poor results of the traditional radial basis kernel functions SVR, there is no general guideline selecting relevant parameters. Therefore, the lithium-ion battery SOC is estimated with a heuristic GA to optimize the radial basis kernel function SVR in this paper. The results of the comparison models to estimate the SOC are unsatisfactory. The proposed model simulates the genetic characteristics of organisms in nature and uses a GA to find the global optimal solution of the model parameters. The predictions were performed at −10 C and −20 C temperatures, applying lithium-ion battery data from three working conditions, which verifies that the model has adaptability at extreme temperatures. The performance of the model was tested at three different temperatures of 25 C, 10 C, and 0 C, which verifies that the GASVR could predict the unknown test set better with high accuracy. In addition, this paper compensates for the results of estimating only a single temperature and for the estimation with extreme temperatures (−10 C, −20 C). We verify the GASVR superiority by comparing the models.
In the future, we will focus on achieving a joint estimation of essential parameters such as SOC, battery state of health, and remaining useful life. This research would improve the joint estimation model’s accuracy and robustness, giving it better application value in the new energy vehicle industry. Therefore, the new energy vehicle industry will contribute to the early realization of the “double carbon goal” and initiatives to combat climate change and mitigate the energy crisis.

Author Contributions

The corresponding author C.C. confirms the contributions of the authors to this manuscript were as follow: C.C.: Discussion, Validation, Writing—review & editing, Supervision. Z.L.: Discussion, Validation, Methodology, Writing—original draft. J.W.: Discussion, Validation, Visualization, Conceptualization. All authors have read and agreed to the published version of the manuscript.

Funding

This work was supported by the National Natural Science Foundation of China (No. 42074218) and the Sichuan Key Provincial Research Base of Intelligent Tourism (No. ZHZJ22-02). This work was supported by Sichuan University of Science & Engineering High Performance Computing Center of Science & Engineering provided computational.

Data Availability Statement

Not applicable.

Conflicts of Interest

The authors declare no conflict of interest.

Abbreviations

The following abbreviations are used in this manuscript:
SOCstate of charge
SVRsupport vector regression
SVMsupport vector machine
GAgenetic algorithm
XGBoostextreme gradient boosting
RFRrandom forest regression

References

  1. Um, B.-H.; Kim, Y.-S. Review: A chance for korea to advance algal-biodiesel technology. J. Ind. Eng. Chem. 2009, 15, 1–7. [Google Scholar] [CrossRef]
  2. Jian, S. Environmental protection policy, technological innovation and dynamic effects of carbon emission intensity: Simulation analysis based on three-sector dsge model. J. Chongqing Univ. Soc. Sci. Ed. 2020, 26, 31–45. [Google Scholar] [CrossRef]
  3. Cai, T.; Liu, H.; Bao, X. Analysis and research on carbon dioxide utilization technology in coal chemical industry. Chain Coal 2017, 44, 98–105. [Google Scholar] [CrossRef]
  4. Zhang, Y.; Wang, Y.; Tian, Y. Comparative studies on carbon dioxide emissions of typical modern coal chemical processes. Chem. Ind. Eng. Prog. 2016, 35, 4060–4064. [Google Scholar] [CrossRef]
  5. Dong, R. International Energy Agency: Analysis of Global CO2 Emissions in 2022. China Power Enterp. Manag. 2023, 7, 94–95. Available online: https://kns.cnki.net/kcms2/article/abstract?v=A67obWUfw0k2M7nn3Vatj_HwL8pmrWFlEHIUwsuEs4Lc04b-6UX5jIP0PzvmdaIJFn6ox_Gc72q7ADS_xUJ3psFiXpzDbHuRTYSaUOpHigDN5kCYhQZa6yrREUimoNWydzcfczHH-PqyWsWmE495uw==&uniplatform=NZKPT&language=CHS (accessed on 19 October 2023).
  6. Zhang, Y.; Hao, Y. Esg performance, financing constraints and high-quality innovation of coal companies under carbon peaking and carbon neutrality goals. Min. Res. Dev. 2023, 194–201. [Google Scholar] [CrossRef]
  7. Corti, F.; Gulino, M.-S.; Laschi, M.; Lozito, G.M.; Pugi, L.; Reatti, A.; Vangi, D. Time-domain circuit modelling for hybrid supercapacitors. Energies 2021, 14, 6837. [Google Scholar] [CrossRef]
  8. Yang, H. Estimation of supercapacitor charge capacity bounds considering charge redistribution. IEEE Trans. Power Electron. 2018, 33, 6980–6993. [Google Scholar] [CrossRef]
  9. Zheng, Y.; Ouyang, M.; Han, X.; Lu, L.; Li, J. Investigating the error sources of the online state of charge estimation methods for lithium-ion batteries in electric vehicles. J. Power Sources 2018, 377, 161–188. [Google Scholar] [CrossRef]
  10. Cao, C. Research on Modeling and SOC Estimation of LiFePO4 Battery Considering Temperature Effect. Master’s Thesis, Hefei University of Technology, Hefei, China, 2017. [Google Scholar]
  11. He, H.; Zhang, X.; Xiong, R.; Xu, Y.; Guo, H. Online model-based estimation of state-of-charge and open-circuit voltage of lithium-ion batteries in electric vehicles. Energy 2012, 39, 310–318. [Google Scholar] [CrossRef]
  12. Sepasi, S.; Ghorbani, R.; Liaw, B.Y. Improved extended kalman filter for state of charge estimation of battery pack. J. Power Sources 2014, 255, 368–376. [Google Scholar] [CrossRef]
  13. Ma, X.; Tao, Q.; Yin, W.-B.; Qiu, D.-F.; Zhang, J.-D.; Zhao, B. On-line estimation of power battery soc based on fpga. DEStech Trans. Comput. Sci. Eng. 2018. Available online: https://1library.net/document/q5wvvvrq-line-estimation-power-battery-soc-based-fpga.html#fulltext-content (accessed on 19 October 2023).
  14. Li, J.; Barillas, J.K.; Guenther, C.; Danzer, M.A. A comparative study of state of charge estimation algorithms for lifepo4 batteries used in electric vehicles. J. Power Sources 2013, 230, 244–250. [Google Scholar] [CrossRef]
  15. Mao, X.; Song, S.; Ding, F.J. Optimal BP neural network algorithm for state of charge estimation of lithium-ion battery using PSO with Levy flight. J. Energy Storage 2022, 49, 104139.1–104139.5. [Google Scholar] [CrossRef]
  16. Xia, X.; Bhatt, N.P.; Khajepour, A.; Hashemi, E. Integrated inertial-lidar-based map matching localization for varying environments. IEEE Trans. Intell. Veh. 2023, 1–12. [Google Scholar] [CrossRef]
  17. Xia, X.; Xu, R.; Ma, J. Secure cooperative localization for connected automated vehicles based on consensus. IEEE Sens. J. 2023, 23, 25061–25074. [Google Scholar] [CrossRef]
  18. Gao, Y.; Liu, K.; Zhu, C.; Zhang, X.; Zhang, D. Co-estimation of state-of-charge and state-of-health for lithium-ion batteries using an enhanced electrochemical model. IEEE Trans. Ind. Electron. 2022, 69, 2684–2696. [Google Scholar] [CrossRef]
  19. Poloni, T.; Figueroa-Santos, M.A.; Siegel, J.B.; Stefanopoulou, A.G. Integration of non-monotonic cell swelling characteristic for state-of-charge estimation. In Proceedings of the 2018 Annual American Control Conference (ACC), Milwaukee, WI, USA, 27–29 June 2018; pp. 2306–2311. [Google Scholar] [CrossRef]
  20. Wang, L.; Zhao, X.; Deng, Z.; Yang, L. Application of electrochemical impedance spectroscopy in battery management system: State of charge estimation for aging batteries. J. Energy Storage 2023, 57, 106275. [Google Scholar] [CrossRef]
  21. Wadi, A.; Abdel-Hafez, M.; Hashim, H.A.; Hussein, A.A. An invariant method for electric vehicle battery state-of-charge estimation under dynamic drive cycles. IEEE Access 2023, 11, 8663–8673. [Google Scholar] [CrossRef]
  22. Wang, M.; Wang, G.; Xiao, Z.; Sun, Y.; Zheng, Y. State of charge estimation of lifepo4 in various temperature scenarios. Batteries 2023, 9, 43. [Google Scholar] [CrossRef]
  23. Du, C.-Q.; Shao, J.-B.; Wu, D.-M.; Ren, Z.; Wu, Z.-Y.; Ren, W.-Q. Research on co-estimation algorithm of soc and soh for lithium-ion batteries in electric vehicles. Electronics 2022, 11, 181. [Google Scholar] [CrossRef]
  24. Lin, Q.; Li, X.; Tu, B.; Cao, J.; Zhang, M.; Xiang, J. Stable and accurate estimation of soc using exogenous kalman filter for lithium-ion batteries. Sensors 2023, 23, 467. [Google Scholar] [CrossRef]
  25. Wang, L.; Lu, D.; Liu, Q.; Liu, L.; Zhao, X. State of charge estimation for lifepo4 battery via dual extended kalman filter and charging voltage curve. Electrochim. Acta 2019, 296, 467. [Google Scholar] [CrossRef]
  26. Luan, Z.; Qin, Y.; Hu, B.; Zhao, W.; Wang, C. Estimation of state of charge for hybrid unmanned aerial vehicle li-ion power battery for considering rapid temperature change. J. Energy Storage 2023, 59, 106479. [Google Scholar] [CrossRef]
  27. Qiu, Y.; Li, X.; Chen, W.; Duan, Z.M.; Yu, L. State of charge estimation of vanadium redox battery based on improved extended kalman filter. ISA Trans. 2019, 94, 326–337. [Google Scholar] [CrossRef]
  28. Lipu, M.S.H.; Hannan, M.A.; Hussain, A.; Ayob, A.; Saad, M.H.M.; Karim, T.F.; How, D.N.T. Data-driven state of charge estimation of lithium-ion batteries: Algorithms, implementation factors, limitations and future trends. J. Clean. Prod. 2020, 277 Pt 2, 124110.1–124110.29. [Google Scholar] [CrossRef]
  29. Qian, C.; Xu, B.; Xia, Q.; Ren, Y.; Yang, D.; Wang, Z. A dual-input neural network for online state-of-charge estimation of the lithium-ion battery throughout its lifetime. Materials 2022, 15, 5933. [Google Scholar] [CrossRef]
  30. Ali, O.; Ishak, M.K.; Ahmed, A.B.; Salleh, M.F.M.; Ooi, C.A.; Khan, M.F.A.J.; Khan, I. On-line wsn soc estimation using gaussian process regression: An adaptive machine learning approach. Alex. Eng. J. 2022, 61, 9831–9848. [Google Scholar] [CrossRef]
  31. Zhang, G.; Xia, B.; Wang, J.J. Intelligent state of charge estimation of lithium-ion batteries based on l-m optimized back-propagation neural network. J. Energy Storage 2021, 44 Pt B, 103442.1–103442.16. [Google Scholar] [CrossRef]
  32. Anton, J.C.Á.; Nieto, P.J.G.; de Cos Juez, F.J.; Sanchez Lasheras, F.; Gonzalez Vega, M.; Roqueni Gutierrez, M.N. Battery state-of-charge estimator using the svm technique. Appl. Math. Model. 2013, 37, 6244–6253. [Google Scholar] [CrossRef]
  33. Zhang, L.; Li, K.; Du, D.; Zhu, C.; Zheng, M. A sparse least squares support vector machine used for soc estimation of li-ion batteries. IFAC-PapersOnLine 2019, 52, 256–261. [Google Scholar] [CrossRef]
  34. Hu, C.; Ma, L.; Guo, S.; Guo, G.; Han, Z. Deep learning enabled state-of-charge estimation of lifepo4 batteries: A systematic validation on state-of-the-art charging protocols. Energy 2022, 246, 123404. [Google Scholar] [CrossRef]
  35. Lipu, M.S.H.; Hannan, M.A.; Hussain, A.; Ayob, A.; Saad, M.H.M.; Muttaqi, K.M. State of charge estimation in lithium-ion batteries: A neural network optimization approach. Electronics 2020, 9, 1546. [Google Scholar] [CrossRef]
  36. Duan, W.; Song, C.; Peng, S.; Xiao, F.; Shao, Y.; Song, S. An improved gated recurrent unit network model for state-of-charge estimation of lithium-ion battery. Energies 2020, 13, 6366. [Google Scholar] [CrossRef]
  37. Javid, G.; Abdeslam, D.O.; Basset, M. Adaptive online state of charge estimation of evs lithium-ion batteries with deep recurrent neural networks. Energies 2021, 14, 758. [Google Scholar] [CrossRef]
  38. Yan, C.; Li, M.; Zhou, X. Application of improved genetic algorithm in function optimization. Appl. Res. Comput. 2019, 36, 2982–2985. [Google Scholar] [CrossRef]
  39. Chen, Q.; Hu, X. Design of intelligent control system for agricultural greenhouses based on adaptive improved genetic algorithm for multi-energy supply system. Energy Rep. 2022, 8, 12126–12138. [Google Scholar] [CrossRef]
  40. Ozcalici, M.; Bumin, M. Optimizing filter rule parameters with genetic algorithm and stock selection with artificial neural networks for an improved trading: The case of borsa istanbul. Expert Syst. Appl. 2022, 208, 118120. [Google Scholar] [CrossRef]
  41. Zhu, J.; Wang, G.; Li, Y.; Duo, Z.; Sun, C. Optimization of hydrogen liquefaction process based on parallel genetic algorithm. Int. J. Hydrogen Energy 2022, 47, 27038–27048. [Google Scholar] [CrossRef]
  42. Mota, B.; Faria, P.; Vale, Z. Residential load shifting in demand response events for bill reduction using a genetic algorithm. Energy 2022, 260, 124978. [Google Scholar] [CrossRef]
  43. Kollmeyer, P. Panasonic 18650PF Li-ion Battery Data; Mendeley Data, V1; University of Wisconsin Madison, McMaster University: Madison, WI, USA, 2018. [Google Scholar] [CrossRef]
  44. Kollmeyer, P.; Skells, M. Turnigy Graphene 5000 mAh 65C Li-ion Battery Data; Mendeley Data, V1; University of Wisconsin Madison, McMaster University: Madison, WI, USA, 2020. [Google Scholar] [CrossRef]
  45. Vidal, C.; Malysz, P.; Naguib, M.; Emadi, A.; Kollmeyer, P.J.J. Estimating battery state of charge using recurrent and non-recurrent neural networks. J. Energy Storage 2022, 47, 103660.1–103660.12. [Google Scholar] [CrossRef]
  46. Onyekwena, C.C.; Xue, Q.; Li, Q.; Wan, Y.; Feng, S.; Umeobi, H.I.; Liu, H.; Chen, B. Support vector machine regression to predict gas diffusion coefficient of biochar-amended soil. Appl. Soft Comput. 2022, 127, 109345. [Google Scholar] [CrossRef]
  47. Jana, D.K.; Bhunia, P.; Adhikary, S.D.; Bej, B. Optimization of effluents using artificial neural network and support vector regression in detergent industrial wastewater treatment. Clean. Chem. Eng. 2022, 3, 100039. [Google Scholar] [CrossRef]
  48. Sharin, S.N.; Radzali, M.K.; Sani, M.S.A. A network analysis and support vector regression approaches for visualising and predicting the COVID-19 outbreak in malaysia. Healthc. Anal. 2022, 2, 100080. [Google Scholar] [CrossRef] [PubMed]
  49. Li, S.; Xu, K.; Xue, G.; Liu, J.; Xu, Z. Prediction of coal spontaneous combustion temperature based on improved grey wolf optimizer algorithm and support vector regression. Fuel 2022, 324, 124670. [Google Scholar] [CrossRef]
  50. Liu, W.; Xia, X.; Xiong, L.; Lu, Y.; Gao, L.; Yu, Z. Automated vehicle sideslip angle estimation considering signal measurement characteristic. IEEE Sens. J. 2021, 21, 21675–21687. [Google Scholar] [CrossRef]
Figure 1. The overall flowchart of the GA.
Electronics 12 04433 g001
Figure 2. Voltage and current at −10 C and 25 C, respectively.
Electronics 12 04433 g002
Figure 3. SVM and SVR.
Electronics 12 04433 g003
Figure 4. The overall flowchart of the model.
Electronics 12 04433 g004
Figure 5. Unfiltered and filtered data.
Electronics 12 04433 g005
Figure 6. Effect of different input data for model accuracy at UDDS standard.
Electronics 12 04433 g006
Figure 7. Comparison of models accuracy.
Electronics 12 04433 g007
Figure 8. Comparison of models accuracy for LA92 and NEDC standard.
Electronics 12 04433 g008
Figure 9. Comparison of models accuracy for UDDS standard and R 2 histogram.
Electronics 12 04433 g009
Table 1. GA configuration.
CharacteristicsValue
The objective function min c , e , g 1 n i = 1 n ( y ^ i y i ) 2
Initial population size100
Chromosome length3
Mutation probability0.0175
Crossover probability0.7
Calculation the fitnessMSE
※ In objective function, c: the penalty factor, e: the tolerance to error, g: the coefficient of the kernel function. The y ^ i is estimated value. The y i is real value.
Table 2. Battery datasets and lab equipment.
Battery DatasetsPanasonicTurnigy
Cycler ManufacturerDigatron Firing CircultsDigatron Firing Circults
Test Channel25 A, 0–18 V channel75 A, 0–5 V channel
Data Acquisition10 Hz10 Hz
Accuracy±0.1% full scale±0.1% full scale
Thermal chamberCincinatti Subzero ZP8Envirotronics
Internal volume8 cu. Ft8 cu. Ft
Accuracy±0.5 C±0.5 C
Table 3. The score of different input types in R square at UDDS standard.
Input Types−20 C−10 C0 C10 C25 C
Original Input91.24%87.52%94.78%96.38%97.98%
Low-Pass Filtered Input (0.5 mHZ)98.38%98.25%98.34%98.18%98.65%
Low-Pass Filtered Input (5 mHZ)96.75%94.83%94.95%96.74%98.44%
Combined Input98.47%99.85%98.91%98.70%98.81%
Table 4. R square score.
StandardTemperatureOrigin_Lin_SVROrigin_RBF_SVRXGBoostRFRGASVR
UDDS−20 C88.89%88.66%90.08%93.31%98.47%
UDDS−10 C95.21%92.35%97.89%90.50%98.85%
LA92−20 C70.44%94.89%93.51%94.93%98.79%
LA92−10 C95.83%96.51%98.10%96.41%99.94%
NEDC−20 C75.04%96.88%87.55%94.17%98.60%
NEDC−10 C98.01%95.29%98.13%96.65%99.50%
Table 5. Accuracy of the model under different evaluation methods.
StandardEvaluation MethodTemperatureOrigin_LinOrigin_SVRXGBoostRFRGASVR
LA92 R 2 −20 C70.44%95.88%93.51%98.93%98.79%
LA92 R 2 −10 C95.82%95.50%99.10%98.41%98.94%
LA92 R 2 0 C96.43%95.89%98.35%98.21%98.83%
LA92 R 2 10 C96.73%95.37%98.57%98.56%98.89%
LA92 R 2 25 C92.85%95.96%97.61%98.44%98.91%
NEDC R 2 −20 C75.03%95.28%87.55%94.17%98.60%
NEDC R 2 −10 C97.01%96.80%98.13%96.65%98.50%
NEDC R 2 0 C96.19%96.10%98.26%97.85%98.77%
NEDC R 2 10 C96.92%95.88%98.43%98.28%98.92%
NEDC R 2 25 C94.36%96.15%98.16%98.28%98.92%
LA92RMSE−20 C9.65%4.01%4.36%3.86%1.95%
LA92RMSE−10 C4.10%3.80%1.87%2.13%1.50%
LA92RMSE0 C3.79%3.17%1.69%1.89%0.97%
LA92RMSE10 C3.57%3.52%1.43%1.57%1.02%
LA92RMSE25 C5.33%3.45%2.12%1.76%0.98%
NEDCRMSE−20 C9.02%3.92%5.43%3.54%2.06%
NEDCRMSE−10 C2.70%3.40%1.89%2.31%1.39%
NEDCRMSE0 C4.18%3.02%1.67%1.78%1.12%
NEDCRMSE10 C4.35%3.10%1.16%1.12%0.84%
NEDCRMSE25 C5.37%3.17%1.97%1.49%0.95%
LA92MAE−20 C8.48%3.26%4.38%3.23%1.57%
LA92MAE−10 C2.45%3.18%1.67%2.28%1.30%
LA92MAE0 C3.95%2.33%1.36%1.54%0.97%
LA92MAE10 C3.69%2.73%1.14%1.13%0.84%
LA92MAE25 C4.59%3.14%2.63%1.32%0.84%
NEDCMAE−20 C7.27%3.16%5.40%3.12%1.63%
NEDCMAE−10 C1.96%2.90%1.40%2.78%1.15%
NEDCMAE0 C2.44%2.58%1.22%1.54%0.93%
NEDCMAE10 C2.33%3.32%1.28%1.47%0.73%
NEDCMAE25 C4.61%3.18%1.86%1.18%0.77%
Disclaimer/Publisher’s Note: The statements, opinions and data contained in all publications are solely those of the individual author(s) and contributor(s) and not of MDPI and/or the editor(s). MDPI and/or the editor(s) disclaim responsibility for any injury to people or property resulting from any ideas, methods, instructions or products referred to in the content.

