Abstract
With the rapid development of 5G, artificial intelligence, the internet of things (IoT) and other technologies, the number of intelligent terminal devices is growing explosively, bringing huge challenges to the existing communication network and cloud computing service mode. The dense edge computing system (DECS), which combines mobile edge computing (MEC) with an ultra-dense network (UDN), has the potential to significantly improve low latency of communications and enhance the quality of experience (QoE) of user equipments (UEs). In this paper, to achieve energy-efficient MEC, computation efficiency (CE) is maximized by jointly optimizing computation offloading, subchannel allocation and power allocation, which yields a challenging non-convex problem. Specially, due to the heterogeneity of UE battery capacities and residual energy, the residual energy of UEs should be taken into consideration in order to achieve better QoE. Therefore, we develop a residual energy-based computation efficiency (RECE) optimization scheme to maximize CE, where the optimization problem is divided into three subproblems. Firstly, the computation offloading subproblem is addressed by a many-to-one matching strategy. Secondly, the subchannel allocation subproblem is dealt with by adopting the graph coloring algorithm. Finally, the power allocation subproblem is solved by the concave–convex procedure (CCCP) method. The numerical results illustrate that UEs’ CE can be optimized based on their residual energy in the proposed RECE scheme. Additionally, compared to a scheme without considering UE residual energy, the system CE can be much enhanced, and the UE energy consumption can be significantly reduced in the RECE scheme.
1. Introduction
A large number of emerging applications and services put forward high requirements for low latency and high data rates. Meanwhile, the terminal devices of the internet of things (IoT) have high demands for large numbers of connections and computing. However, the traditional macrocell networks cannot meet the access demand of massive intelligent terminal devices and the requirements of quantitative traffic surges. Therefore, plenty of low-power small cells are deployed into the macrocell networks and construct an ultra-dense network (UDN), which is considered to be a promising network paradigm [1]. However, due to the limited computing resource and battery capacity, the user equipments (UEs) cannot meet the requirements of computing and the communication transmission delay of vertical services such as the IoT and the Internet of Vehicles (IoV). Mobile cloud computing (MCC) enables UEs to transfer computing-intensive tasks to powerful and centralized remote clouds for processing. However, since the UEs are far away from the remote cloud, MCC cannot meet the demands of delay-sensitive services. To address this problem, by deploying servers with sufficient computing and storage resources at the edge of a radio access network (RAN), mobile edge computing (MEC) technology can achieve the goal of low task delay and low-UE-energy consumption [2].
In a UDN, the network environment is complex due to the deployment of plenty of heterogeneous small cells, such as microcells, picocells, femtocells and remote radio head (RRH) nodes. UEs can associate with these small cells for data transmission. As the spectrum resource is limited, small cells usually refuse the channel resource. On the one hand, a UDN can gain a lot of benefits, but on the other hand, it also brings some challenges. For instance, the interference can be very serious and the transmission efficiency of tasks can be affected due to the co-channel deployment. Moreover, energy consumption cannot be neglected due to the intensive deployment of small cells. Many studies have focused on improving the efficiency of UDNs through resource allocation [3].
Due to the blossoming of new mobile applications, running these applications on UEs is constrained by the limited computing resources and battery capacity. Therefore, MEC technology has attracted much extensive attention. By equipping the wireless access nodes with powerful computing servers, UEs can offload their tasks to these servers, so that the tasks can be executed by MEC servers. Thus, the task latency can be reduced and the energy of the UEs can be saved. In addition, the pressure of the core network can be relieved through computation offloading. The concept of MEC was proposed by the European Telecommunications Standards Institute (ETSI) in 2014 [4], and the majority of the work has been completed to optimize the computation offloading strategies. The state-of-the-art research on computation offloading in MEC was summarized in [5].
A dense edge computing system (DECS), which integrates MEC with UDN, can meet the application needs of high computing efficiency, low latency, wide connection and high security, and has become a new mobile network development trend [6]. In a DECS, the task processing capability can be synced close to the UE side by equipping massive small-cell base stations (SBSs) with MEC servers. Thus, MEC can better support new services, greatly reduce network congestion and improve the reliability of the network. Large numbers of researches have focused on reducing system latency, reducing energy consumption or obtaining their trade-off through computation offloading and resource allocation.
In the study of task offloading for reducing latency, cooperation, interference and environment change are usually considered. In order to take advantage of cooperation opportunities brought about by the DECS, the authors in [7] optimized site clustering, transmit power allocation and computation offloading to minimize task delay. When the sites are deployed with the same frequency, co-tier interference influence system performance. In order to avoid interference, orthogonal channels were allocated between small cells, and computation offloading with small-cell base station dormancy was optimized to minimize task delay when meeting the small-cell base station energy consumption constraints in [8]. In [9], the interference was mitigated by disconnecting some links, and the average processing delay per UE was evaluated with the tools of stochastic geometry in scenarios where the UE’s task can be partitioned and offloaded to multiple MEC servers. In a fast-changing environment where a UE moves randomly, the authors developed a novel UE-oriented computation offloading strategy to reduce system delay under a price budget constraint; see [10]. In [11], to reduce the task discard rate and task latency in a time-varying environment, a deep reinforcement learning algorithm with multi-branch architecture was proposed by jointly optimizing the computation offloading strategy and resource allocation.
As the battery capacities of UEs are limited, massive existing studies are concerned with the energy consumption reduction in UEs in order to enhance their quality of experience (QoE). In [12], considering different task priorities in a cloud-assisted MEC system, the computation offloading strategy was investigated to reduce the target UE’s energy consumption without degrading the UE’s quality of service (QoS). As resource allocation plays a key role in MEC for computing and communications, joint resource allocation and computation offloading optimization could bring much benefit in the aspect of minimizing energy consumption in [13,14,15]. In particular, the delay requirements constraint was considered in a heterogeneous network where interference existed; see [13]. In [14], both the randomness of UE service types and the co-tier interference were taken into account. The weighted network energy consumption was reduced in the DECS with splitting C-plane and U-plane in [15].
Taking into account both latency and energy consumption, many studies have focused on the trade-off between these two factors by constructing a cost function where the task delay and energy consumption are weighted. In these studies, the cost is usually minimized by computation offloading and resource allocation or task scheduling. In [16], the authors developed an improved gray-wolf optimization algorithm to optimize the computation offloading so as to reduce the system cost. In [17], the system cost of the MEC-assisted UDN was reduced through computation offloading strategies, subchannel assignments and power allocation. In [18], assuming that the task cannot be divided into subtasks and each task can only upload through one subchannel, a heuristic computation offloading algorithm was proposed. In [19], considering that the sites are divided into multiple clusters, and UE is accessed through non-orthogonal multiple access (NOMA) with uplink co-tier interference, the system cost where the weights is decided by the remaining energy of UE was minimized. In [20], computation offloading, base station selection and resource scheduling were jointly optimized to minimize the system cost. Considering an UE holding a directed acyclic graph (DAG)-based application, in [21], the task scheduling was optimized by solving a multiobjective optimization where both the application’s execution latency and the UE’s energy consumption were simultaneously minimized.
As is well known, previous studies have paid a lot of attention to energy efficiency and communication efficiency. However, most of them ignore the system efficiency in terms of computation bits per Joule. As an important metric, computation efficiency (CE) [22], defined as the system computation bits per consumed energy, has recently attracted increasing attention. In [23], the subchannels, transmit power and computing resources were jointly allocated to maximize the weighted sum-CE. However, the weights of CE were all set to one, without considering the heterogeneity of UEs.
Recently, many studies on CE have taken fairness into consideration, typically adopting the max–min fairness criterion [24,25,26,27,28]. In [24], in a wireless-powered MEC network where NOMA and the time division multiple access (TDMA) were considered, CE was maximized through the energy harvesting time, computation resource, offloading power and time optimization. In an OFDMA-based MEC network, the authors of [25] optimized the transmit power, subchannel and computation resource allocation to maximize the minimum UE’s CE with strict delay and energy consumption constraints. In [26], the max–min fairness of the CE optimization problem was nvestigated in mmWave-MEC with NOMA, where the beamforming and resource allocation were jointly optimized. The CE optimization problem for the mmWave-MEC with reconfigurable intelligent surface (RIS) was addressed in [27]. In [28], the total downlink and uplink CE was optimized with carrier scheduling and resource allocation while the UE QoS was guaranteed in the NOMA heterogeneous networks.
There are also some studies on CE optimization from the perspectives of user cooperation [29], security [30], and unmanned aerial vehicle (UAV) scenarios [31,32]. For example, in [29], the energy beamforming and resource allocation in the power and time domains were jointly optimized to maximize the CE while considering UE cooperation in the NOMA-enabled wireless-powered MEC networks. In a MEC network with a passive malicious eavesdropper, the secure CE maximization problem was studied through jointly optimizing computing resource and power allocation in [30]. In the UAV-enabled MEC communication systems, system CEs were maximized through joint computing scheduling, the UAV trajectory, and resource allocation under the partial computation offloading mode [31] and the binary computation offloading strategy [32].
In the DECS, massive heterogeneous UEs offload their tasks to the MEC servers to reduce task latency and save energy. In practice, the battery capacities and residual energy of UEs are different. For UEs with low residual energy, compared with UEs with high residual energy, for the purpose of gaining a good QoE and saving energy, they are eager to achieve more system computation bits with the least energy consumption. Therefore, the UE CE maximization needs to consider priorities based on their residual energy. Although numerous existing studies focus on optimizing CE, the influence of UE residual energy on CE optimization is usually ignored. In this paper, taking into account the effects of UE’s residual energy on CE optimization, we develop a residual energy-based computation efficiency (RECE) optimization scheme to maximize the CE in the DECS where the computation offloading strategy, subchannel allocation, and UE transmit power are jointly optimized. The main contributions of the paper are summarized as follows:
- From the perspective of energy-efficient communications and computations, the CE matrix is introduced. In addition, considering the heterogeneity of UE residual energy, the computation offloading strategy, subchannel, and UE transmit power allocations are jointly optimized to maximize the weighted sum-CE, where the weights depend on UE residual energy;
- Due to the interference between UEs, the formulated CE maximization problem is NP-hard. To deal with this complex problem, we divide it into three subproblems. The computation offloading is first decided based on a matching game. Then, the subchannel assignment subproblem is solved with the coloring method. Finally, the UE transmit power allocation is decided with the aid of the CCCP method to maximize the system CE;
- Simulation results show that UE CE can be optimized based on UE residual energy in the proposed RECE scheme. Moreover, compared with the scheme without considering the difference in UE residual energy, the RECE scheme can achieve greater system CE, consume less energy, and process more data.
The structure of the paper is organized as follows. The considered system model and the residual energy-based CE maximization problem formulation are given in Section 2. In Section 3, the RECE algorithm is proposed to optimize computation offloading and resource allocation so as to solve the problem. Section 4 demonstrates the simulation results and presents a discussion. Section 5 presents the conclusion of the paper.
2. System Model and Problem Formulation
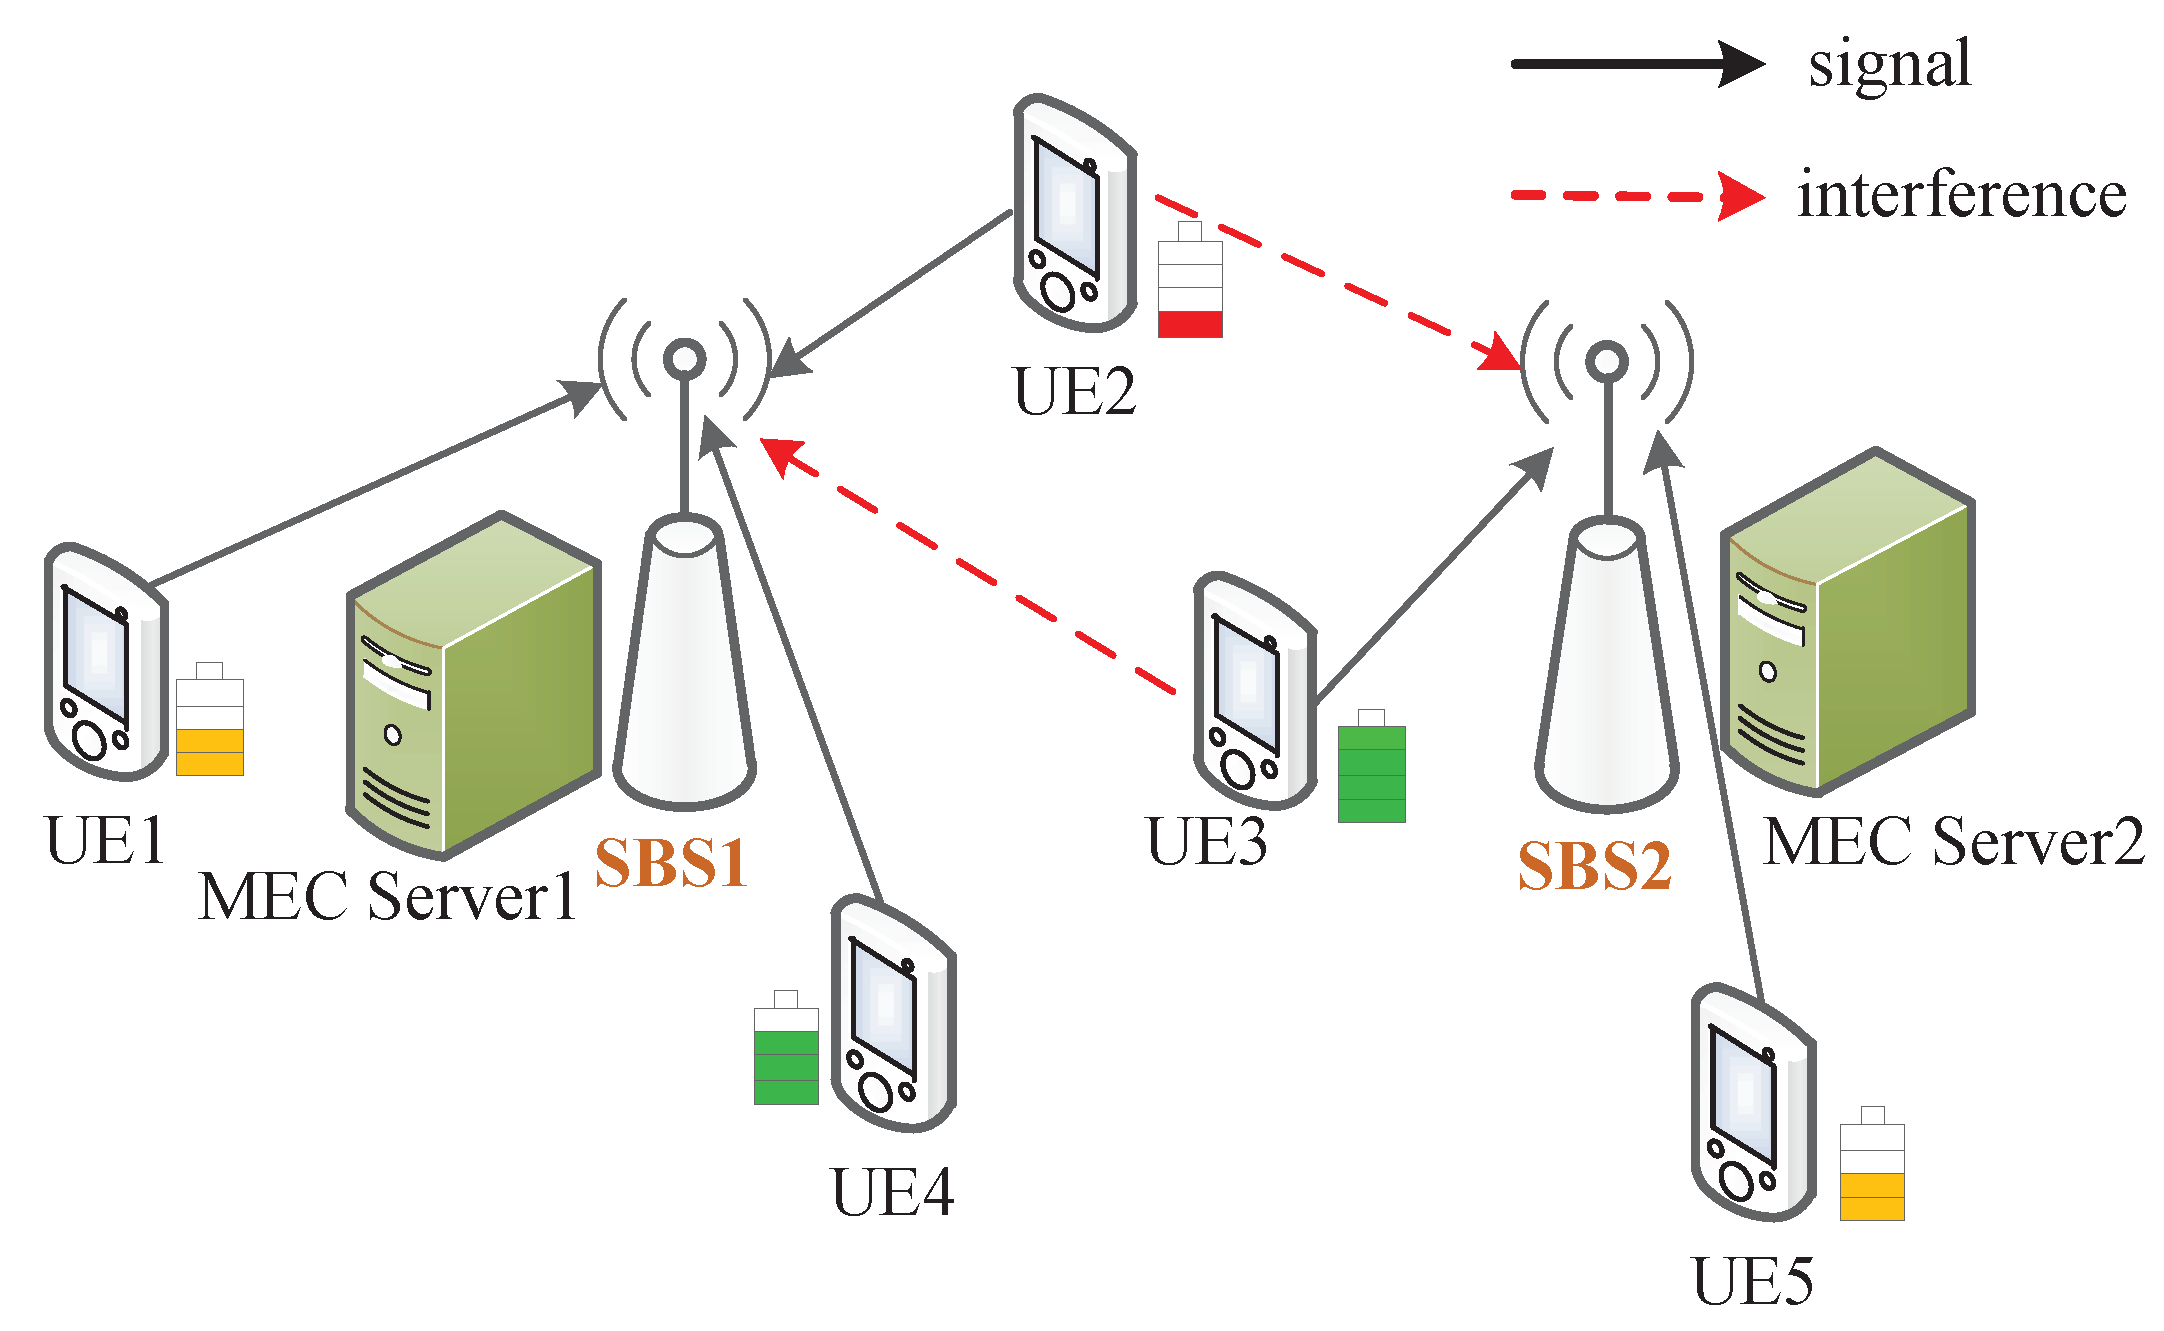
As shown in Figure 1, an OFDMA-based DECS consists of S SBS with a single antenna and M single-antenna UEs. Each SBS is equipped with an MEC server to provide computation services for UEs. The residual battery levels of UEs are different. We assume that the computation task is indivisible, the binary offloading mode is used, and all UEs offload their tasks to MEC severs for computing, with each UE offloading tasks to only one MEC server. When UEs offload their tasks by occupying the same subchannels, the interference cannot be neglected. For instance, as shown in Figure 1, UE 2 and UE 3 offload their task to MEC server 1 and MEC server 2, respectively, by occupying the same subchannel. UE 2 introduces interference to SBS 2 and UE 3 also causes interference for SBS 1.
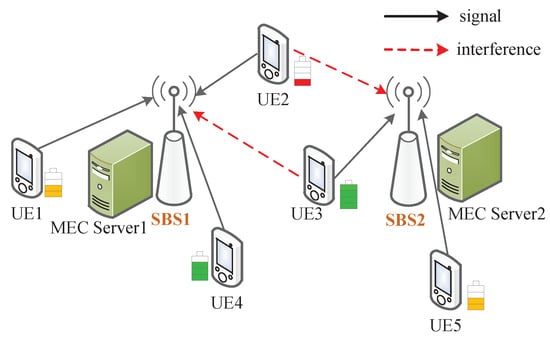
Figure 1.
An MEC network consisting of multiple SBSs, each equipped with an MEC server and massive UEs with different residual energy levels.
2.1. Communication Model
We assume that there are K subchannels in the DECS, and the bandwidth of each subchannel is Hz. The subchannel set, the UE set, and the SBS (MEC server) set are denoted by , and , respectively. The subchannels can be reused by multiple UEs such that interference between UEs exists. is defined as the task offloading indicator variable. Specifically, if UE m offloads its tasks to a MEC server s, and otherwise. is an indicator variable for subchannel assignment. Specifically, if subchannel k is occupied by UE m for computation offloading to a MEC server s, and otherwise. We let T denote the OFDMA time block. Similar to [25], we assume that the subchannels between the MEC servers and UEs keep constant during each block with duration T, which is perfectly known at SBSs. Therefore, the achievable rate of UE m can be expressed as
where and are the transmit power of UE m and channel gain from UE m to SBS s on subchannel k, respectively. is the interference SBS s suffers on subchannel k. is the variance of additive Gaussian white noise.
2.2. Computation Model
It is assumed that the computing frequency of UE m is and that UE m requires cycles to compute one bit of its task. Hence, if UE m computes its task locally, the local computed bits of UE m during the entire block T can be expressed as
The energy consumed in local computing can be calculated as
where denotes the energy coefficient of UE m, which relates to the chip’s hardware architecture.
When UE tasks are offloaded to MEC servers, the number of computed bits for UE m during the entire time block T can be given by
The energy consumption of UE m in the offloading process with duration T can be modeled as
where denotes the power amplifier coefficient, and is the circuit power for the offloading process on each subchannel.
Similar to [33], the energy consumption for execution can be ignored due to fact that the cable power supply can power MEC servers. Moreover, the time and the time of result feedback can be neglected because of the MEC severs’ strong computation capability and the small number of bits related to the computation results [27].
Therefore, the CE of UE m can be defined as
2.3. Problem Formulation
In this paper, we consider a scenario where each UE has a computing-intensive task which needs to be offloaded to the MEC servers, and all MEC servers have strong computation capabilities. Hence, whether UEs choose to compute their task locally or offload their tasks to the MEC server is out of the scope of this paper. Therefore, the match between UEs and the MEC servers is the concern of this paper. Considering the difference in the residual energy of UEs, we use weight to denote the CE preference of UE m and set . represents the percentage of residual energy of UE m. We note that when is very small, the weight is very large, and it dominates the computation process. Therefore, in order to avoid this, we add a constant c to the residual energy ratio of all UEs and make the following transformation: . In this paper, we set for simplicity. In order to save energy for UEs, we optimize the CE through the UE offloading strategy, subchannel allocation, and power allocation. Therefore, the residual energy-based CE maximization problem can be formulated as
where is the minimum data rate of UE m. and denote the thresholds of transmit power on subchannel k and the total transmit power of UE m, respectively. Constraint C1 guarantees the UE rate requirements in the offloading process. Constraints C2 and C3 provide a power constraint for each subchannel and each UE, respectively. Constraint C4 denotes that each UE is only allocated one subchannel. Constraints C5 and C6 indicate that each UE can only choose one MEC server for computation offloading. It is apparent that the the objective function in Problem (7) is the sum of CEs. Therefore, it is a non-convex problem. Moreover, since the binary offloading indicator variable and the binary subchannel allocation variable are binary variables, and the continuous power allocation variables are coupled, obtaining the solution of Problem (7) directly is difficult.
3. Residual Energy-Based Computation Offloading and Resource Allocation Scheme
In this section, to deal with Problem (7), a residual energy-based computation offloading and resource allocation scheme is designed. Firstly, a matching-based computation offloading strategy is presented to obtain the binary offloading indicator variable while taking into account the difference in UE residual energy. Then, a coloring-based subchannel assignment scheme is developed to allocate subchannels to UEs according to their residual energy. Finally, in order to attain the maximum weighted CE, we develop a CCCP-based UE power allocation algorithm.
3.1. Matching-Based Computation Offloading Strategy
Since each UE offloads its task to only one MEC server while each MEC server can execute multiple UE tasks, we can adopt the many-to-one matching theory to solve the computation offloading problem. The matching can be denoted by a triplet of :
- (1)
- is two disjointed sets of players. In this paper, denotes the set of UEs that offload tasks to the MEC servers, and is the set of MEC servers that execute the computation tasks.
- (2)
- denotes the preference lists of the UEs and the MEC servers. Each UE maintains a preference list , where the preferences on MEC servers are ordered in a descending order, i.e., , which means that UE m prefers MEC server s to in task offloading. Furthermore, each MEC server maintains a UE preference list in a descending order, i.e., .
- (3)
- denotes the matching between the UEs and the MEC servers. Each UE can be matched with at most one MEC server, i.e., and , where is the cardinality of matching result . Moreover, each MEC server can be matched with multiple UEs, i.e., and .
Subsequently, the definition of the considered many-to-one matching can be described as follows:
Definition 1.
Given the UE set and the MEC server set , the matching game for computation offloading is defined as a many-to-one function, such that
- (1)
- and , ;
- (2)
- and , ;
- (3)
- .
In the computation offloading process, each UE is willing to be associated with the MEC server with the best channel condition so as to obtain a high offloading rate. Therefore, the preference function of UE m can be defined as below:
Therefore, each UE can calculate its preference on each MEC server according to (8) and construct its preference list .
For the sake of reducing the energy of UEs with low residual energy, each MEC server makes a choice regarding whether to accept UE requests based on the MEC server’s preference function. A MEC server prefers a UE with good channel condition and low residual energy. Hence, the MEC server s ranks UEs according to the following preference function:
Thus, each MEC server can calculate its preference on each UE according to (9) and construct its preference list .
Algorithm 1 summarizes the steps of the many-to-one matching-based computation offloading strategy. In the first place, all UEs and MEC servers are not matched. Therefore, the unmatched UE set and the unmatched MEC server set are initialized as all UEs and all MEC servers, respectively. In the matching process, every unmatched UE builds its preference list based on (8) and sends an offloading request to its most preferred MEC server in the preference list. Subsequently, each unmatched MEC server calculates , which is the number of offloading requests received, and marks UEs that sent the offloading requests by the set . If is not more than the number of subchannels, all UEs in are allowed to communicate with the MEC server s for task offloading. Otherwise, the unmatched MEC server s establishes its preference list based on (9). The first K UEs in are allowed offloading of their tasks, and the offloading requests of other UEs in are rejected. Then, the the unmatched UE set and the unmatched MEC server set are updated. The matching process is not finished until all UEs and MEC servers are matched. Finally, the offloading indicator can be obtained from the matching result . In order to evaluate the matching results, we define the blocking pairs and stable matching.
| Algorithm 1 The UE–MEC server matching algorithm. |
| Input: All UE data rate demands . |
| Output: Stable matching . |
| 1: Initialize the unmatched UE set , and the unmatched MEC server set . |
| 2: while do |
| 3: for all unmatched UE do |
| 4: UE m builds its preference list based on (8) in a descending order; |
| 5: UE m sends an offloading request to the first MEC server in ; |
| 6: end for |
| 7: while do |
| 8: for all unmatched MEC server do |
| 9: Count the number of requests received by MEC server s as and denote the set of these UEs as ; |
| 10: if then |
| 11: MEC server s allows these UEs offloading of their tasks; |
| 12: Remove MEC server from and , and remove these UEs from ; |
| 13: end if |
| 14: if then |
| 15: MEC server s updates its preference list in a descending order according to (9) and allows the first K UEs in offloading of their tasks; |
| 16: Remove MEC server from and , and remove these UEs from ; |
| 17: end if |
| 18: end for |
| 19: end while |
| 20: For all UEs matched with MEC server s, ; |
| 21: end while |
Definition 2.
For every UE m/MEC server s (, ), which are matched with / , a blocking pair exists when a UE n and a MEC server t pair satisfies and .
Definition 3.
If there are no blocking pairs in a matching , the matching is said to be stable.
Theorem 1.
The proposed UE and MEC server matching generated by Algorithm 1 is stable.
Proof of Theorem 1.
This proof is similar to [34]. For the purpose of proving that the proposed matching algorithm is stable, we should verify the nonexistence of blocking pairs in Algorithm 1. As shown in Lines 5 and 15 of Algorithm 1, the UE task can be offloaded to the MEC server that provides the best channel gain, while each MEC server deals with the tasks offloaded by those UEs that provide the first K largest ratio of channel gain to the residual energy, which is calculated in (9). This guarantees that no blocking pair exists in the matching results obtained by adopting Algorithm 1. Consequently, Theorem 1 is proved. □
3.2. Coloring-Based Subchannel Assignment Scheme
When the UEs and the MEC servers are well matched, all UEs can offload their tasks to the target MEC servers and each MEC server should allocate subchannels to the UEs offloading tasks to it. UEs in the same MEC servers are assigned subchannels in an orthogonal way. In order to improve the frequency spectrum utilization, UEs in different MEC servers reuse the subchannels. Therefore, co-tier interference between UEs exists, and the original Problem (7) can be changed into the following formula:
From the optimization objective function in (7), it can be seen that the performance of each UE is affected by the power of UEs occupying the same channel, and the power of each UE can also cause interference with other UEs using the same channel. is the interference of SBS s caused by other UEs on subchannel k. Therefore, to alleviate serious co-tier interference, it should be decided which subchannels are to be reused in the subchannel allocation process. In this subsection, a coloring-based subchannel assignment algorithm is developed, which takes the residual energy of UEs into account. The idea of this algorithm is that UEs that may interfere with each other try to avoid using the same channel. If it is unavoidable, each UE chooses the channel occupied by the UE with a higher remaining energy ratio, so that the interference can be alleviated by reducing the energy of that UE.
Since each MEC server has K subchannels, the number of colors is set to be K in the coloring-based subchannel assignment algorithm. The algorithm includes two parts, i.e., the graph construction procedure in Algorithm 2 and the coloring procedure in Algorithm 3. When coloring all the nodes, different subchannels are allocated to different colors. The detailed steps of the algorithms are as follows:
- (1)
- Graph is constructed. In the graph, the node set consists of all UEs in the network. Thus, . is the edge set and the edges between UEs are established so that they can be allocated to different colors. Therefore, UEs in the same MEC servers are connected by edges. For UEs in different MEC servers, whether there is an edge between them depends on the distance between the UEs and the MEC servers. For instance, we suppose that there are two MEC servers, i.e., the MEC server i and j, and the UE m is served by the MEC server i. The distance between UE m and the MEC server j should be calculated. If is less than the threshold , then the distance between all UEs in the MEC server j and the MEC server i should be judged. In the MEC server j, if the distance from UE n and the MEC server i is less than , edges are constructed between UE m and UE n. Otherwise, the UE in the MEC server j that is closest to the MEC server i is chosen to construct edge with UE m. If UE m and UE n are connected by the edge, they should be added to each other’s edge sets. The edge set of UE m is denoted by . Thus, UE n and UE m should be added to edge sets and , respectively.
- (2)
- Coloring. After graph construction is completed, the node degrees are calculated. All nodes are saved in the degree list according to degree, from high to low. The color set used by UEs is initialized in as . The graph is colored starting from the node with the highest degree. If there are several nodes with the same degree, one is chosen at random. When coloring, if a node has multiple color choices, the color assigned by the UE with the highest residual energy ratio in its adjacent MEC servers is selected so that serious interference with the data transmission of UEs with low residual energy ratio can be mitigated with power allocation. The details are as follows:
- (a)
- For all nodes in the degree list , colors assigned by the nodes in their edge sets are found and added to the color set . Then, the colored nodes are moved from the edge set . Therefore, includes the nodes without being colored. The remaining color set that can be used by node m is updated as . We select the first node from the degree list and assume that this node is node m. Then, its color is chosen from .
- (b)
- If there is more than one color in , one is chosen to add to node m randomly, and this color is added to the color set . Otherwise, the colors used by other nodes in the same MEC server are found with node m. The color sets and are updated. The color with the least color utilization in is assigned to node m. If there are multiple optional colors for node m, we select the color with the highest residual energy ratio.
| Algorithm 2 Graph construction algorithm. |
| Input: The stable matching A, the UE set and the MEC server set . |
| Output: Graph . |
| 1: All UEs in construct the nodes of the graph. |
| 2: for MEC server do |
| 3: for UE do |
| 4: if they all match with the MEC server i then |
| 5: Build edge between UE m and UE n. Add UE n and m to the edge set and , respectively. |
| 6: end if |
| 7: if UE m and UE n match with the MEC server i and j, respectively, then |
| 8: Calculate the distance between UE m and MEC server j. |
| 9: if then |
| 10: for UE n matching with the MEC server j do |
| 11: Calculate the distance between UE n and MEC server i. |
| 12: if then |
| 13: Establish edge between UE m and UE n. Add UE n and m to the edge set and , respectively. |
| 14: end if |
| 15: if is the smallest value then |
| 16: Build edge between UE m and UE n, and add UE n to the edge set of UE m. |
| 17: end if |
| 18: end for |
| 19: end if |
| 20: end if |
| 21: end for |
| 22: end for |
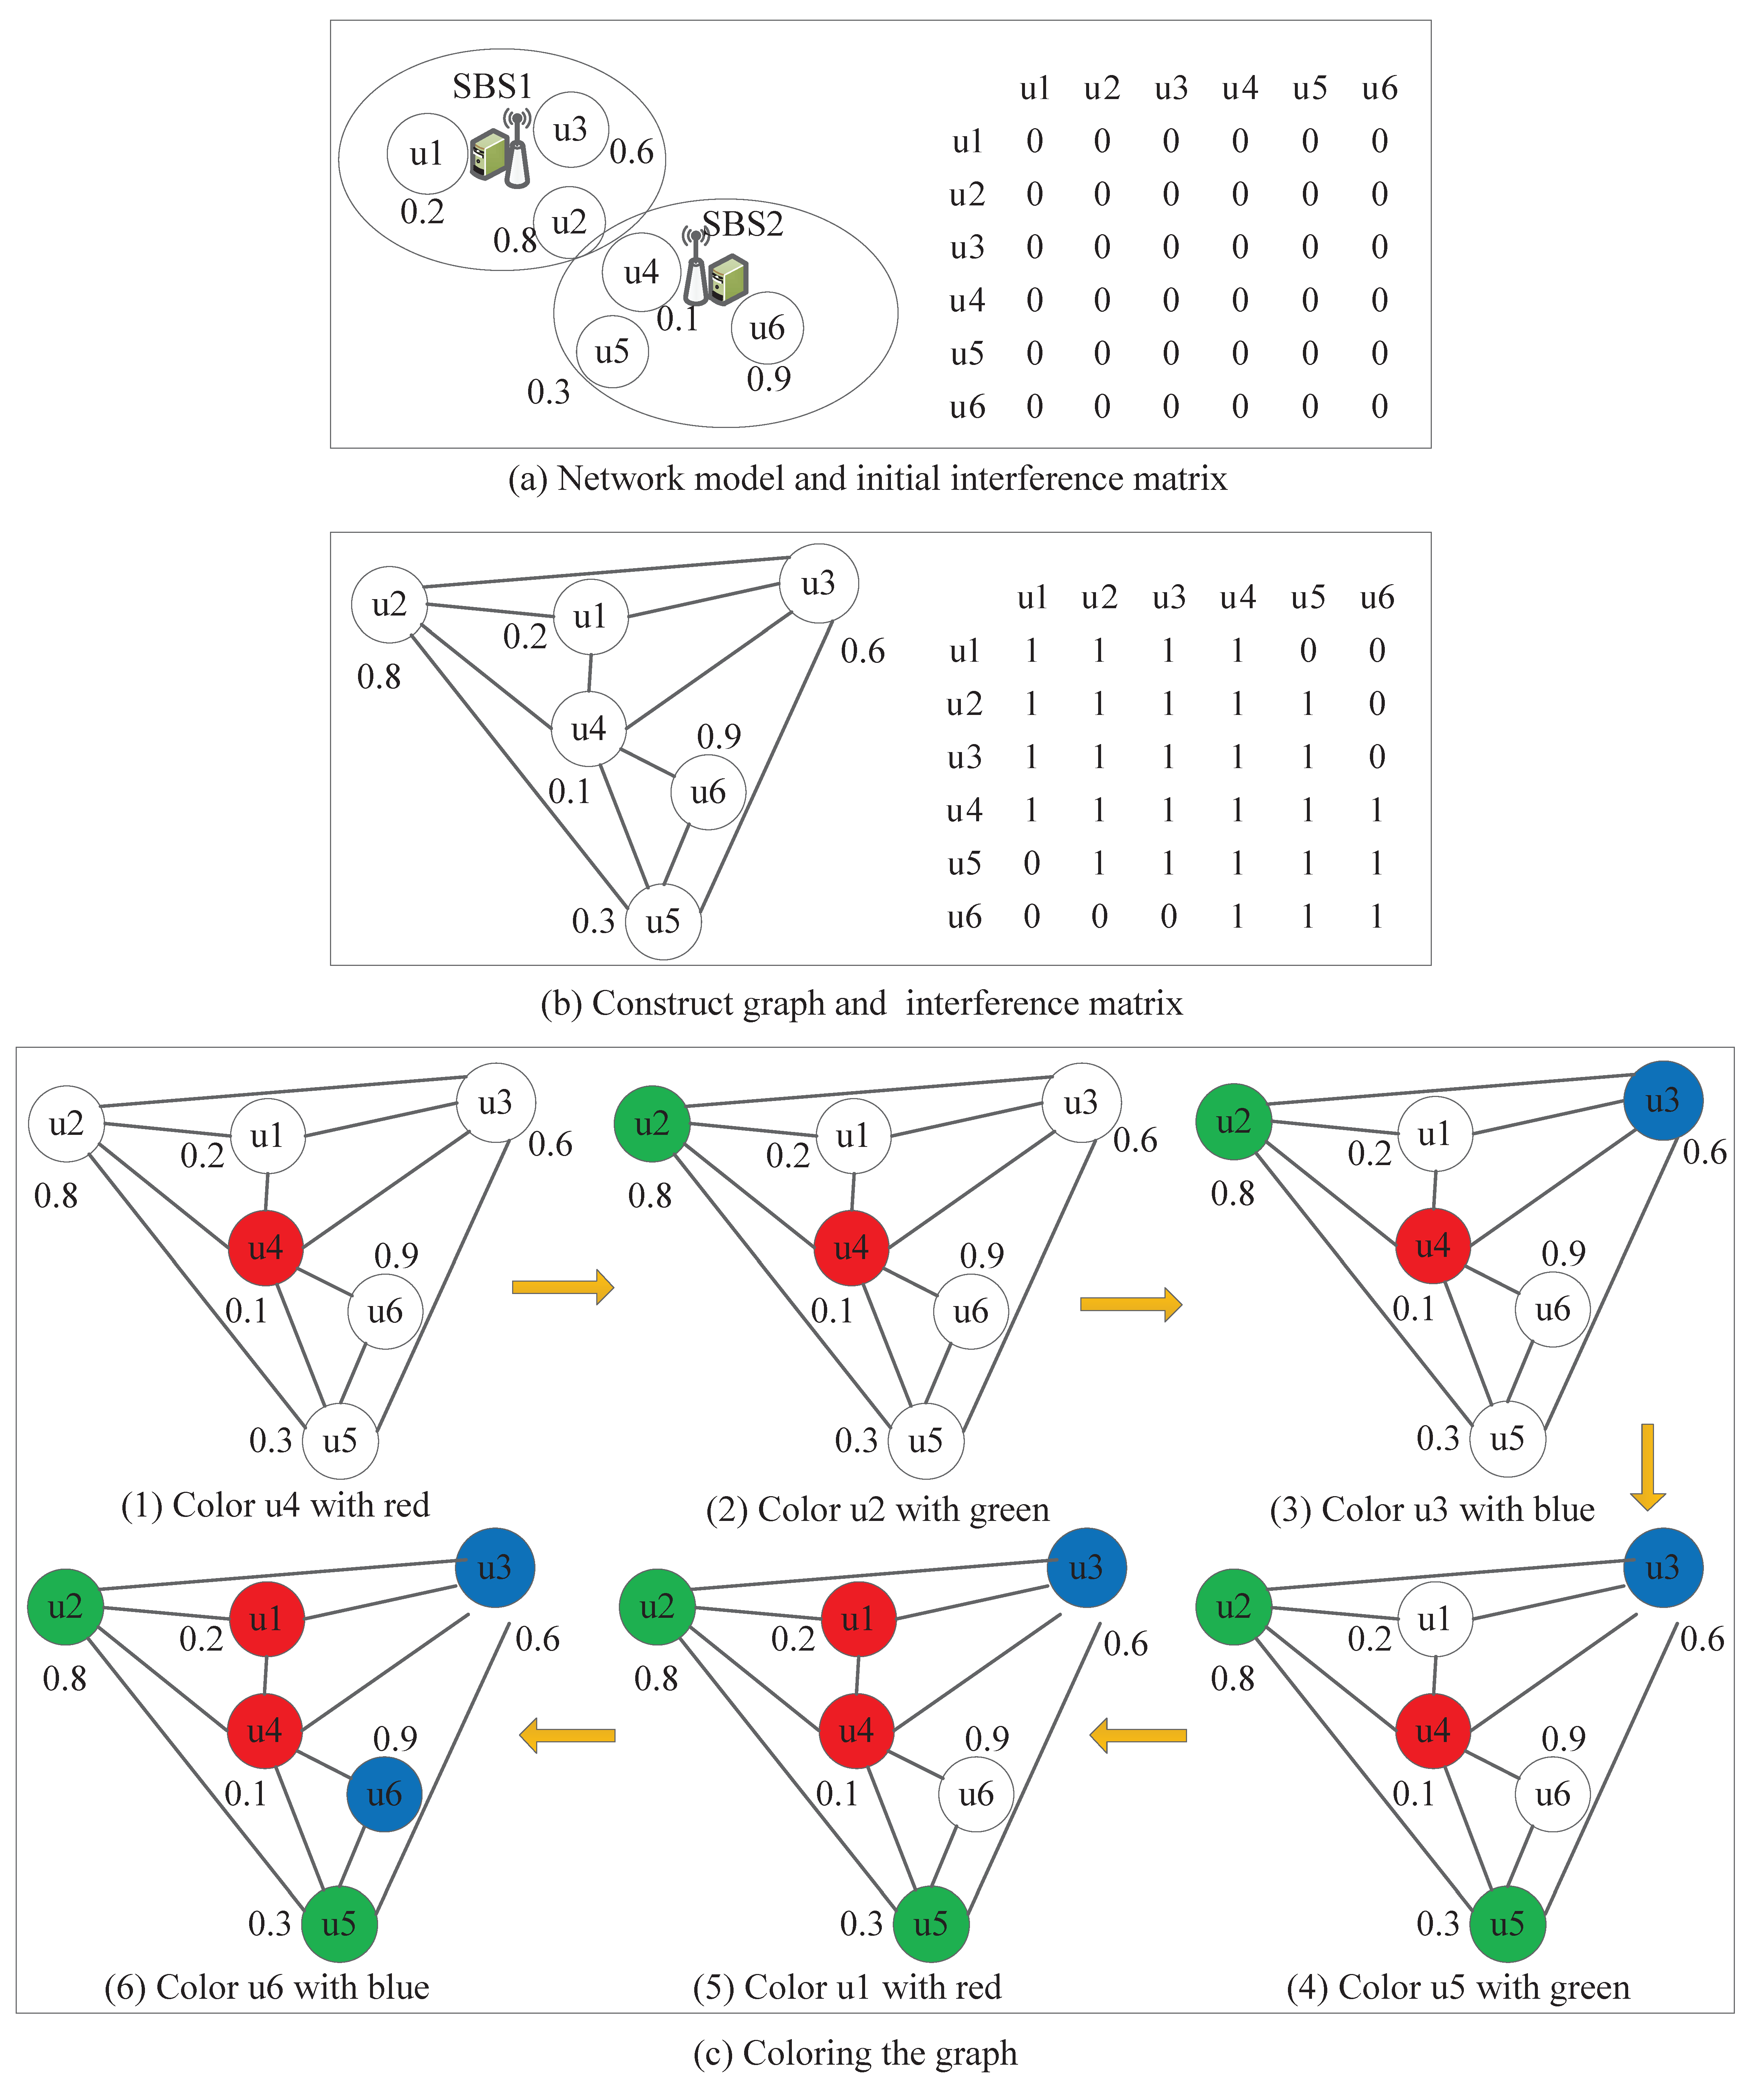
Figure 2 illustrates the procedure of graph construction and coloring. As shown in Figure 2a, the network model includes two SBSs, two MEC servers and six UEs. Especially u1, u2, and u3 offload their tasks to MEC server 1, and u4, u5, and u6 offload their tasks to MEC server 2. The value around each UE denotes the residual energy ratio. An interference matrix is constructed, and its elements denote whether there exists an edge between two nodes. All elements in the interference matrix are initialized as zero, which means there is no edge between nodes. In Figure 2b, the distance between UE and MEC servers is calculated, and graph is built according to the distance threshold . Simultaneously, the elements in the interference matrix are updated. Then, the edge set of each UE is constructed, i.e., , , , , , and . The coloring procedure of the graph is shown in Figure 2c and the number of colors is assumed to be 3, i.e., . The degrees of all nodes are calculated and all nodes are stored in the degree list, , by ranking the degrees in descending order, i.e., . The degrees of these UEs are 5, 4, 4, 4, 3, and 2, respectively. The coloring steps are detailed below.
| Algorithm 3 Coloring algorithm. |
| Input: The graph , the color set . |
| Output: The subchannel allocation variable . |
| 1: for node in the graph do |
| 2: Calculate the degree of node m and initialize the color set . |
| 3: end for |
| 4: Sort all nodes into the list in descending order according to their degree. |
| 5: for node do |
| 6: if m is not colored then |
| 7: for node do |
| 8: if node n use color i then |
| 9: Add color i into the color set and move node n from . |
| 10: Update the color set . |
| 11: end if |
| 12: end for |
| 13: if then |
| 14: Choose one color from for node m randomly. Add this color into . |
| 15: end if |
| 16: if then |
| 17: for node do |
| 18: if node n and node j are in the same MEC server, and node j is colored then |
| 19: Update the color set and . |
| 20: end if |
| 21: end for |
| 22: for color do |
| 23: Calculate the number of utilization of color c. |
| 24: end for |
| 25: Select the least utilized color and assign it to node m. |
| 26: if color c has the same utilization ratio as color d then |
| 27: Select the color used by the node with higher residual energy ratio and assign it to node m. |
| 28: end if |
| 29: end if |
| 30: end if |
| 31: end for |
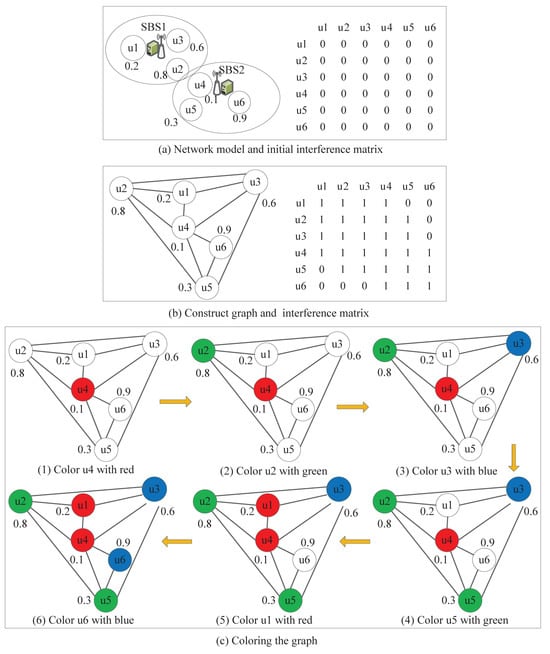
Figure 2.
Graph construction and coloring procedure.
- (1)
- Select the first node in , i.e., . Its edge color set is and its color set can be calculated as . Therefore, we can color with red, which is randomly chosen from .
- (2)
- Choose the second node from , i.e., . Update and . Choose one color from at random and color with green.
- (3)
- Select the third node from , i.e., . Update and . Thus, can be colored with blue.
- (4)
- Choose the fourth node from , i.e., . Update . Since the nodes and in are served by the same MEC with , and only is colored with red, the edge color set of can be updated as . Accordingly, its color set can be updated as . The utilization numbers of green and blue are both one, while the residual energy ratio of colored with green is less than that of colored with blue. Therefore, can be colored with green.
- (5)
- Select the fifth node from , i.e., . Update . Since the nodes and in are served by the same MEC with , and and are colored by green and blue, respectively, the edge color set of can be updated as and its color set can be updated as . Then, can be colored with red.
- (6)
- Choose the last node from , i.e., . Update and . Thus, can be colored with blue.
3.3. CCCP-Based UE Power Allocation Algorithm
After the computation offloading and subchannel assignment are accomplished, UE power should be optimized to improve CE. Therefore, Problem (7) can be rewritten as
Furthermore, Theorem 2 is introduced to transform Problem (11) into the following, which can be proven with the same method as that used in [35].
Theorem 2.
If is obtained by addressing Problem (11), then there exists such that is also a solution to Problem (12):
In addition, if and , satisfies and .
For the sake of easy handling, we change the optimization function of Problem (12) into the following form:
where the two convex functions are and . Furthermore, we rewrite constraint C1 as follows:
It can be seen that C1′ is convex. Therefore, according to Theorem 2, solving Problem (15) can produce the solution of the original problem.
Due to the fact that is differentiable, we can adopt the CCCP method to solve Problem (15). Therefore, the optimal transmit power of UE m on subchannel k can be derived as
where and . The two Lagrange multipliers, i.e., and , are introduced to solve the problem. Algorithm 4 shows the steps of the proposed power allocation algorithm. Correspondingly, the total procedure of the RECE algorithm is demonstrated in Algorithm 5.
| Algorithm 4 CCCP-based power allocation algorithm. |
| Input: All UE data rate requirements . |
| Output: Optimal power . |
| 1: Initialization: Set and . Set and for all UEs and MEC servers, calculate and . |
| 2: while or do |
| 3: Use CCCP to solve (15), the optimal power is obtained according to (16). |
| 4: Update and . |
| 5: Set . |
| 6: end while |
| Algorithm 5 RECE algorithm. |
| Input: All UE minimum data rate . |
| Output: Stable matching A*, the subchannel allocation variable B*, the optimal power allocation P*. |
| 1: Initialize the UE set , the MEC server set , the subchannel set and SUEs’ target data rate . |
| 2: Obtain the stable UE and MEC server matching according to Algorithm 1. |
| 3: Construct graph by Algorithm 2. |
| 4: Use Algorithm 3 to attain the subchannel allocation . |
| 5: Adopt Algorithm 4 to acquire the optimal power allocation . |
3.4. Complexity Analysis
The computational complexity of the RECE scheme (Algorithm 5) includes four parts, i.e., from Algorithm 1 to Algorithm 4. In Algorithm 1, the complexity of each UE sorting S MEC servers in its preference list is . Therefore, the sorting complexity for M UEs is . When the UEs submit their offloading requests, each MEC server should make a decision to accept or reject the request. Considering the worst case where each MEC server should deal with M requests, the sorting complexity for S MEC servers is . The complexity of the stable matching is . In Algorithm 2, the complexity of graph construction for UEs is . In Algorithm 3, the complexity of degree calculation for M nodes is . The sorting complexity of nodes according to their degrees is . In order to allocate K colors to M nodes, the complexity is denoted as . Since the number of colors K is lesser than the number of nodes, the complexity of Algorithm 3 is . We assume that updating and needs and iterations, respectively, in Algorithm 4. Hence, the complexity of Algorithm 4 can be calculated as . Therefore, we can derive the complexity of the proposed RECE scheme as .
4. Numerical Results
In our simulation, we consider an OFDMA-based dense edge computing network in a m2 square area. Many SBSs and UEs are located in this area at random. Large-scale channel fading is considered and the parameters are similar to those in [36]. Table 1 shows the specific simulation parameters. To investigate the performance of the proposed RECE scheme, the following schemes are compared:

Table 1.
Values of simulation parameters.
- (1)
- Base scheme: UEs offload their tasks to the MEC servers with the best channel condition and they offload their tasks with maximum transmit power.
- (2)
- Residual energy-based energy saving (REES) scheme: The difference in UE residual energies is considered. UEs offload their tasks based on the proposed matching algorithm and the subchannel assignment based on the proposed coloring algorithm. Power allocation is used to minimize the total energy consumption.
- (3)
- Equal weighted computation efficiency (EWCE) maximization scheme. The difference from the RECE scheme is that this scheme does not consider the difference in UE residual energies in the computation offloading, subchannel assignment, and power allocation processes.
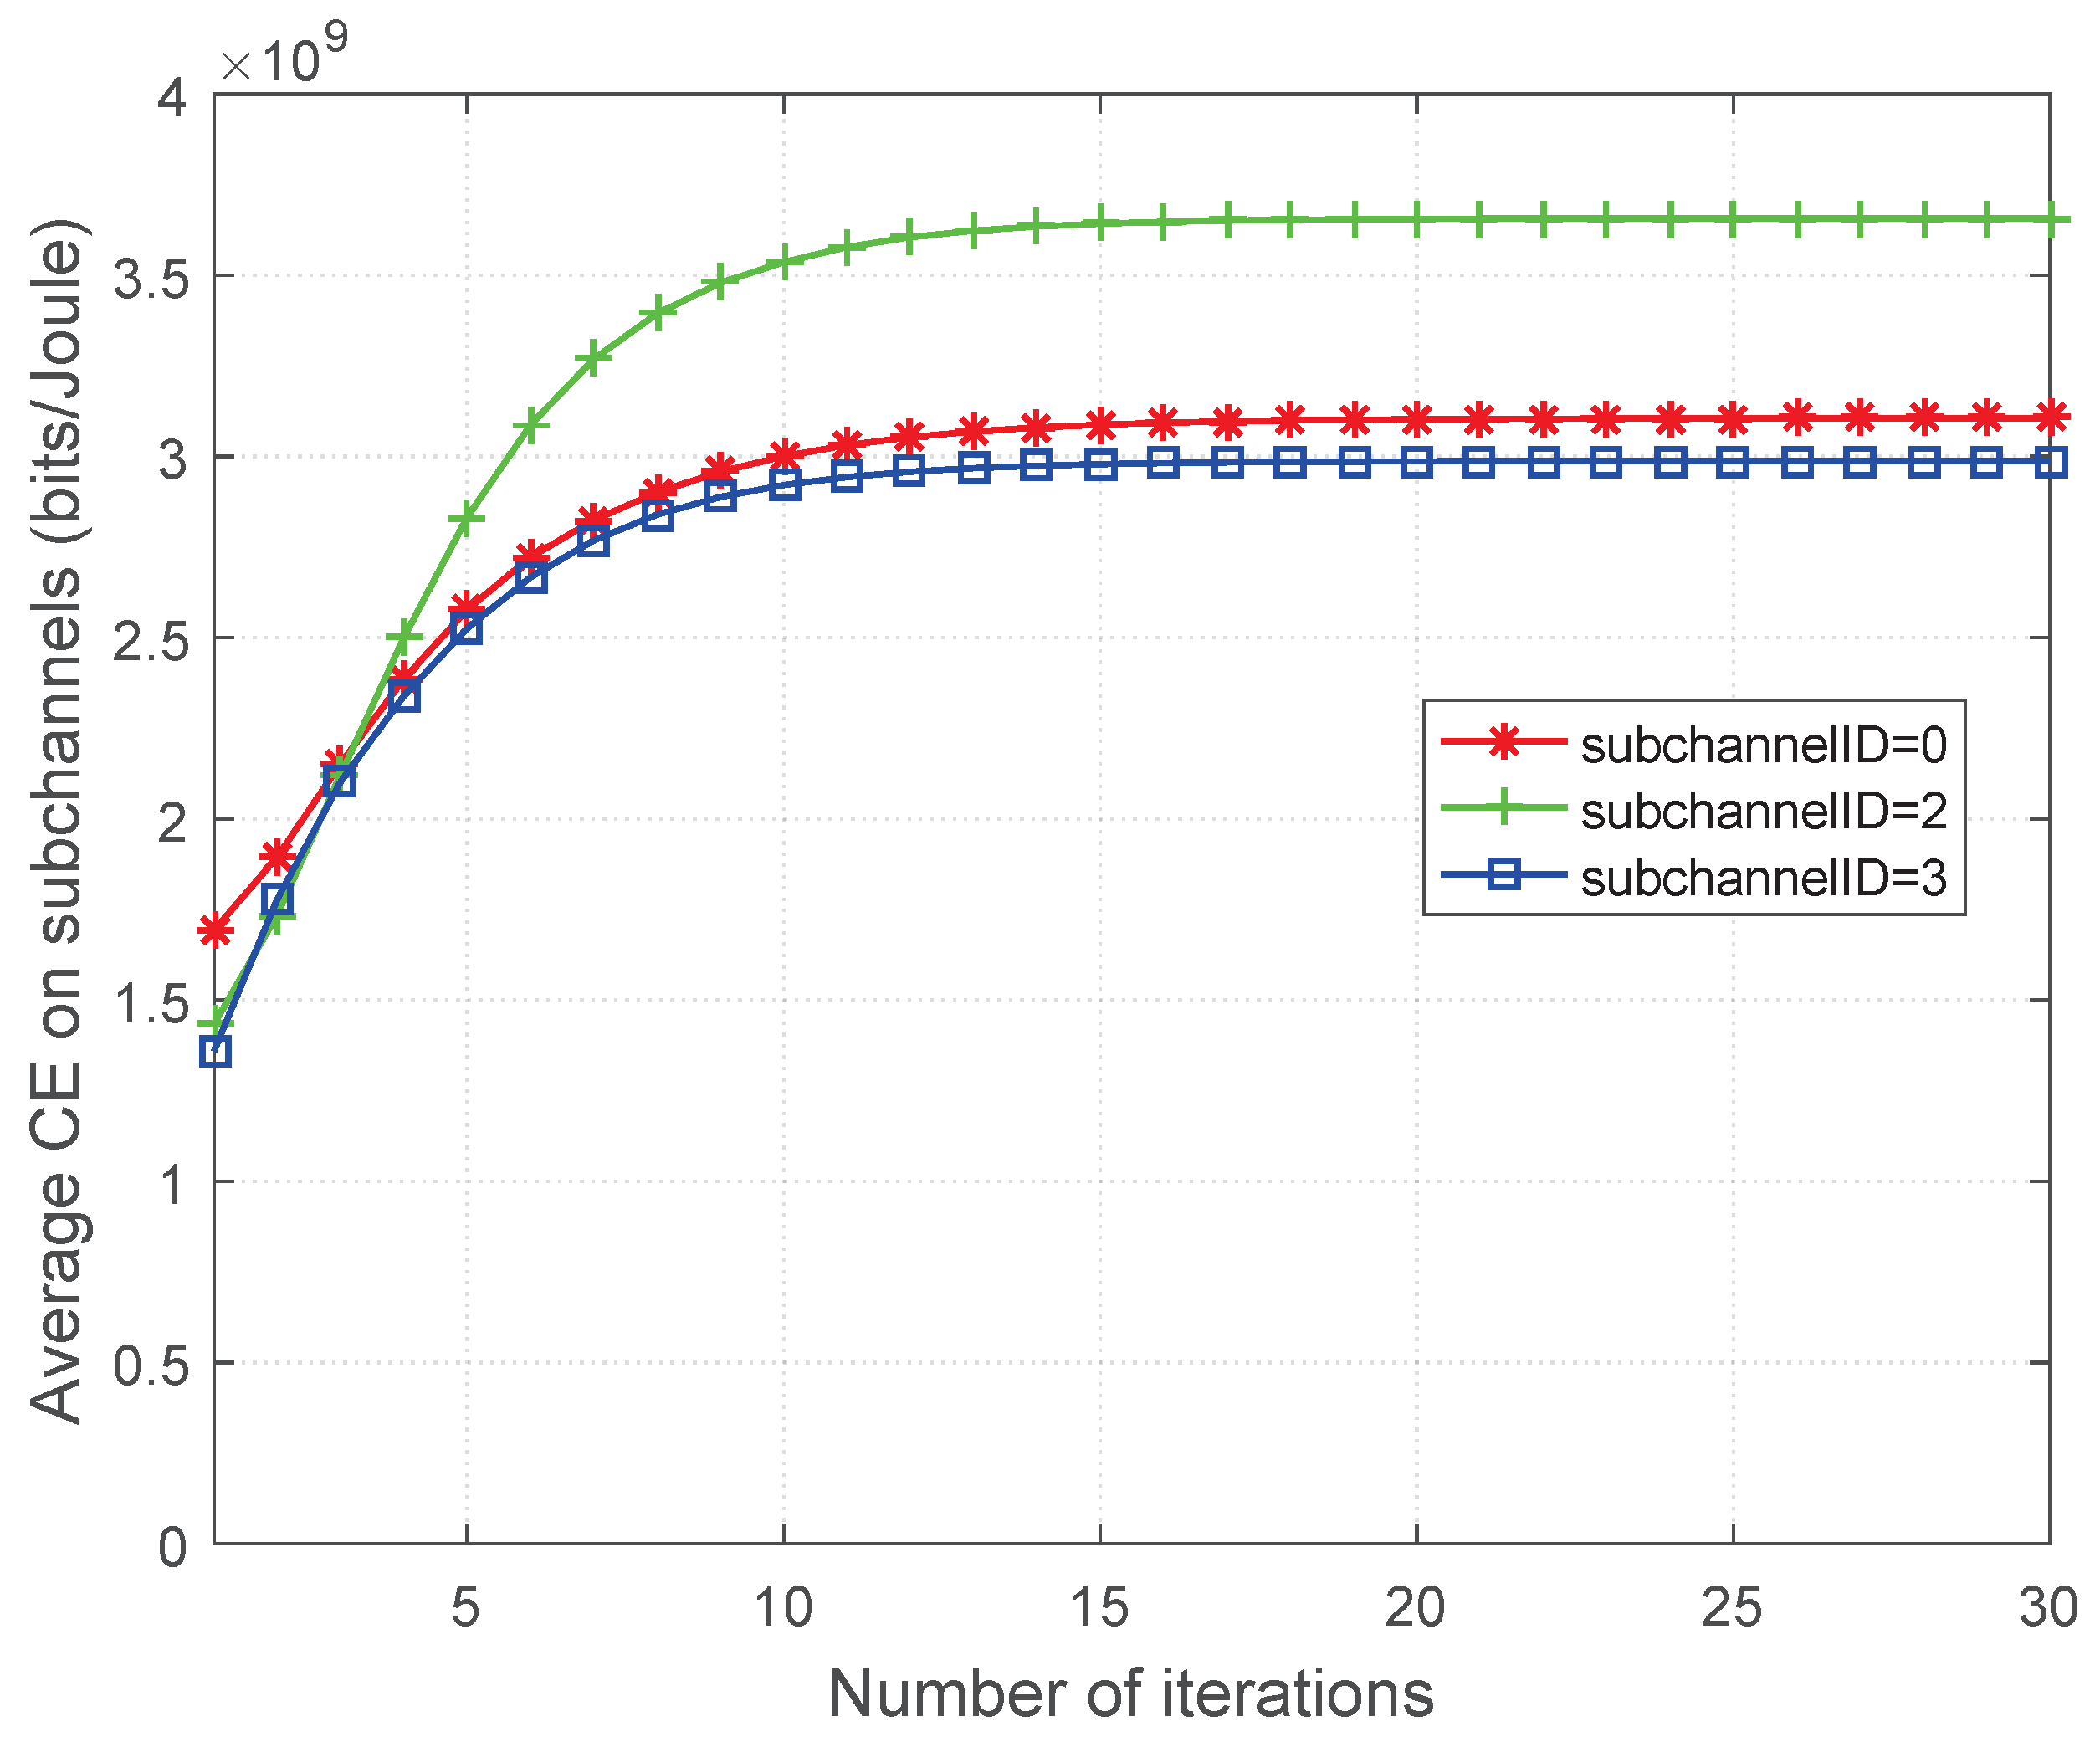
Figure 3 shows the convergence of the proposed RECE scheme on different subchannels when there are 20 MEC servers and 100 UEs. It can be observed that the average CE on each subchannel converges to a constant with several iterations, which indicates that our proposed RECE scheme is computationally efficient.
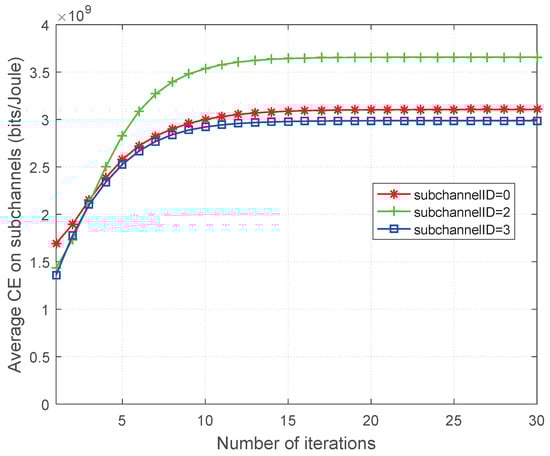
Figure 3.
The CE on a random subchannel versus the number of iterations.
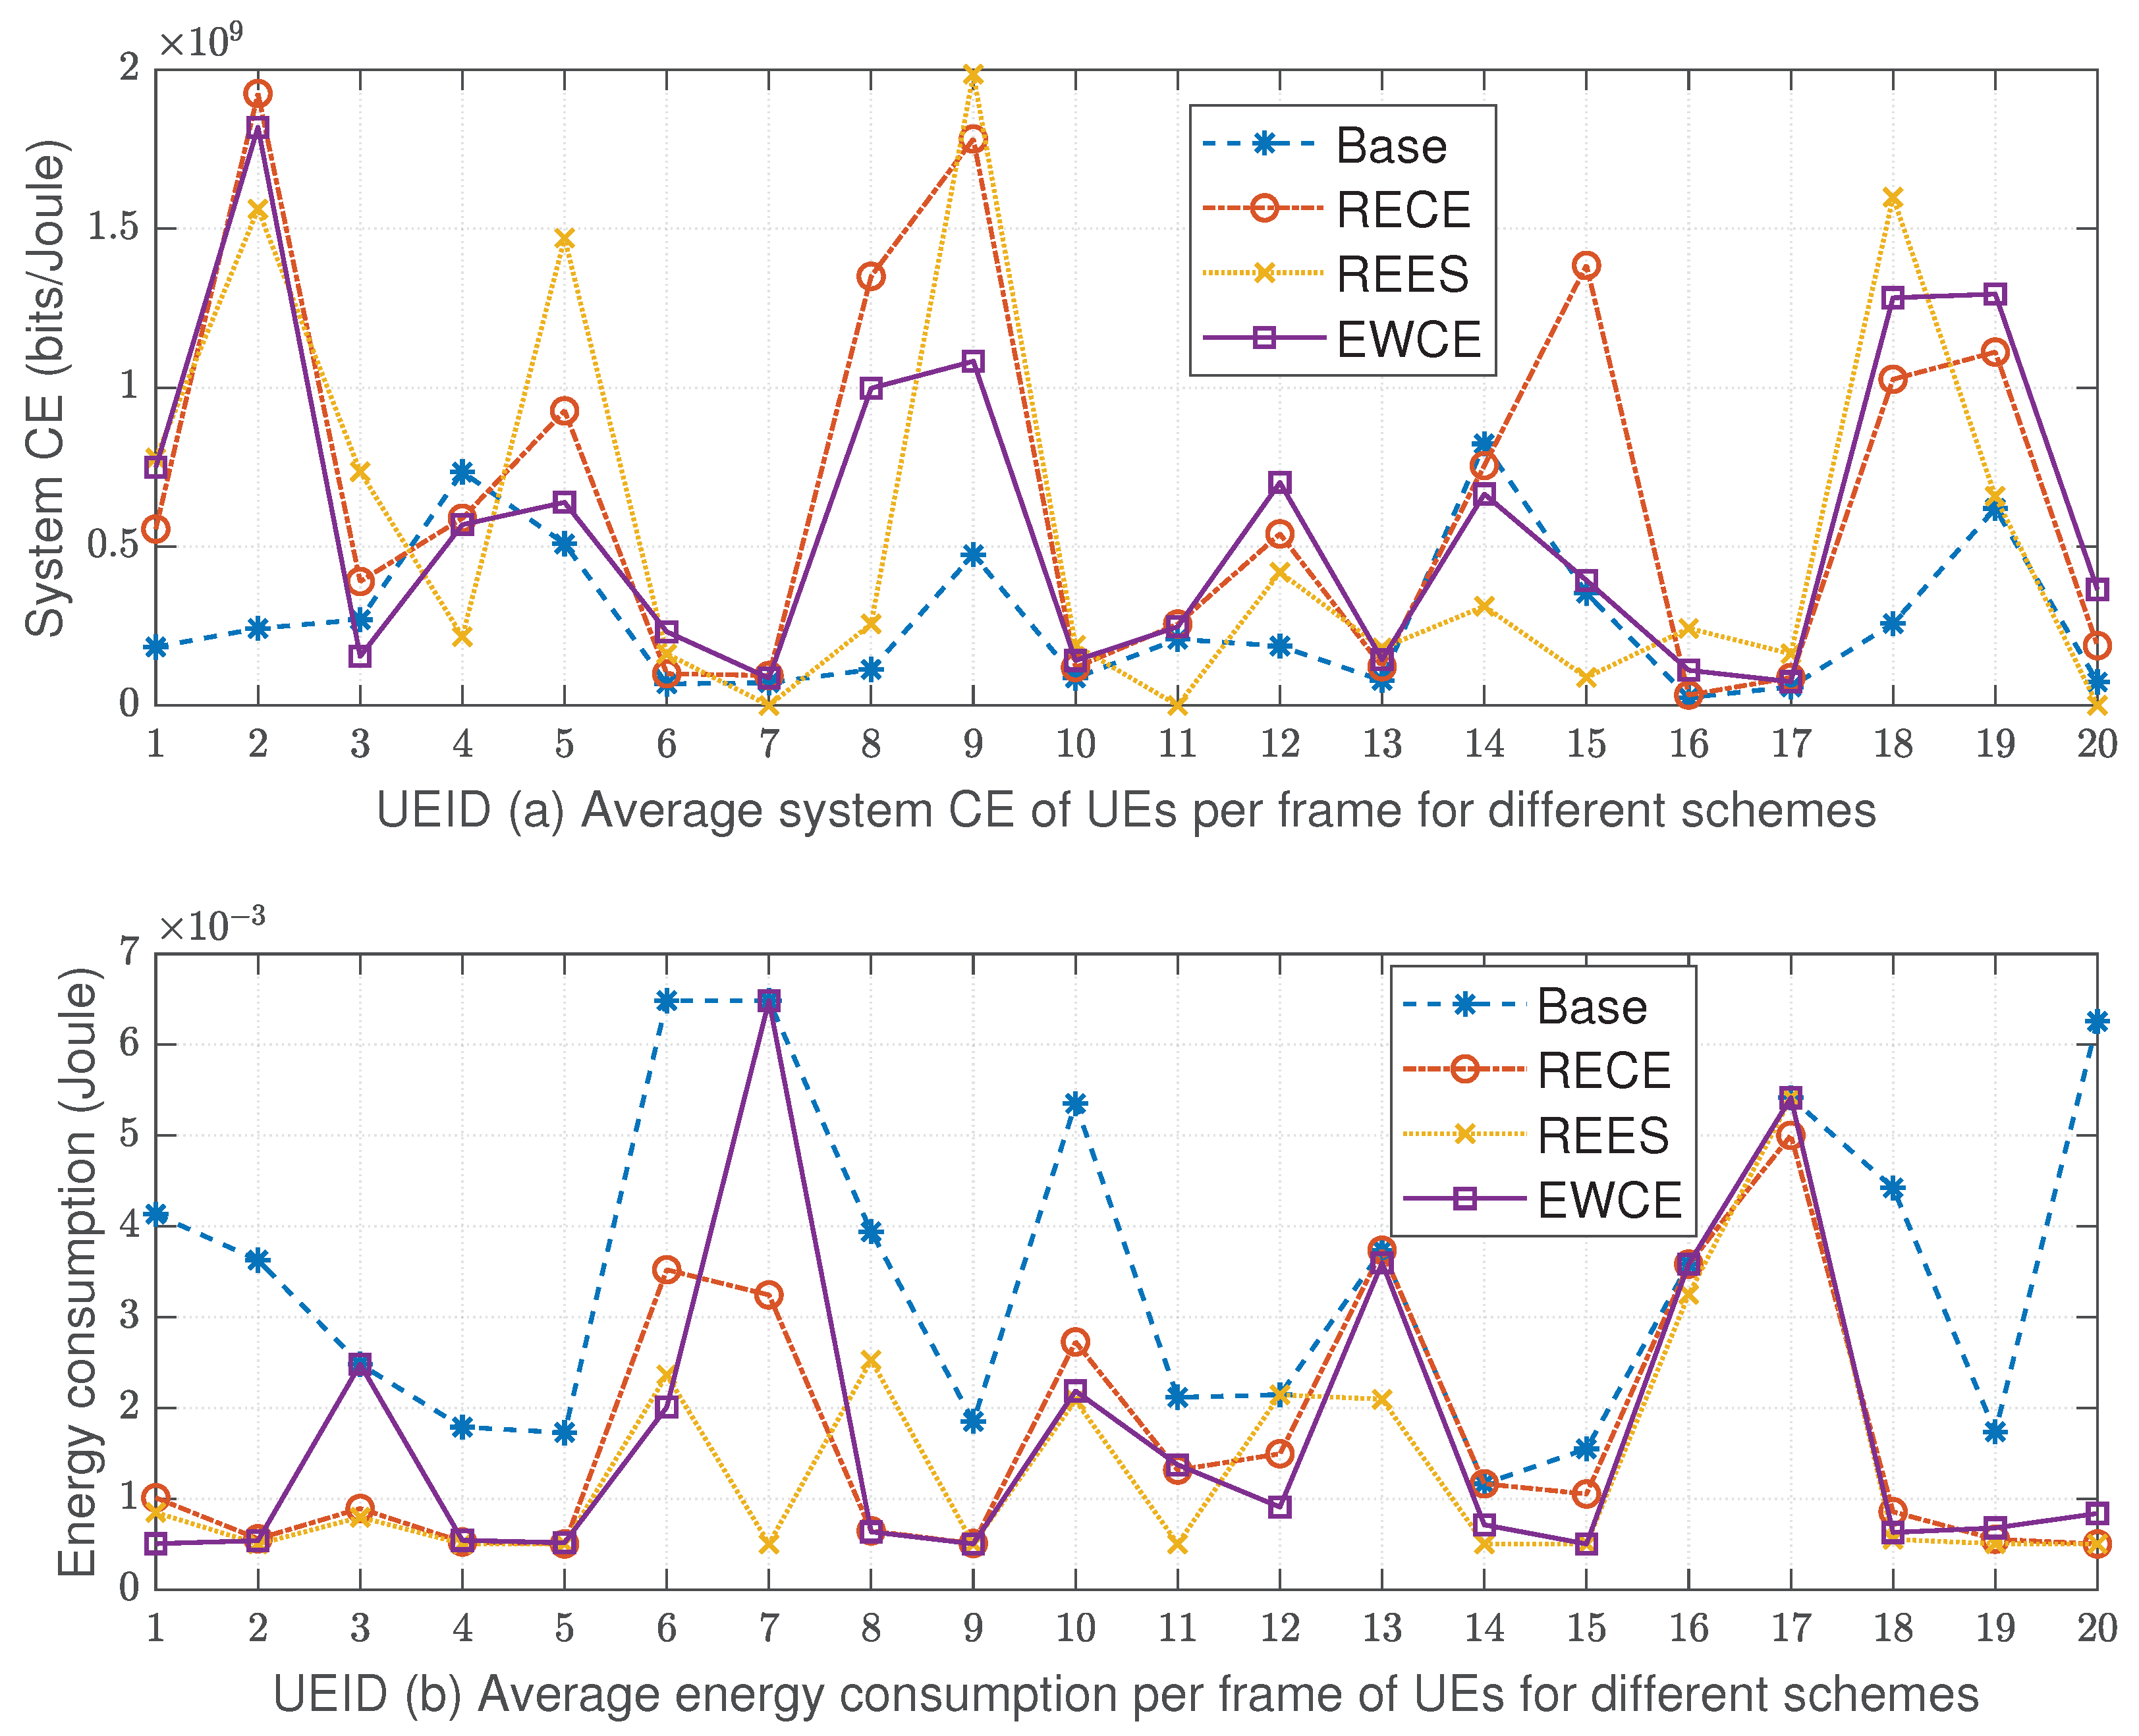
Figure 4 illustrates the CE of UEs and the average energy consumption per frame in different schemes. In this simulation, 20 UEs are chosen from 100 UEs to be compared when the number of MEC servers is 20. The values of CE and energy for all UEs are, respectively, given in Table 2 and Table 3. Figure 4a depicts the CE of UEs in different schemes. It can be seen that most UEs can achieve a higher CE in the EWCE and RECE schemes than the Base and REES schemes. This is because the CE of UEs is optimized in the EWCE and RECE schemes. Moreover, we can see that compared with the EWCE scheme, UE 1, 6, 12, 18, 19, and 20 obtain lower CEs in the RECE scheme. The reason is that these UEs have higher energy and the priorities of CE optimization are lower than others in the RECE scheme, while all UEs have the same priorities in the EWCE scheme. Although UE 7 and 17 also have high energy and low priorities, their CE in all schemes is almost the same and is very low due to the bad channel condition. In addition, it can be observed that the CEs of UE 4, 5, 8, 9, 14, and 15 are higher in the RECE scheme than those in the EWCE scheme. Figure 4b shows the average energy consumption per frame of UEs. Since UEs use the maximum transmit power to offload their tasks, the initial residual energy can be seen from the Base scheme. Therefore, the energy consumption of all UEs in the Base scheme is larger than that in other schemes. It can be seen that the residual energy of UE 6, 7, 17, and 20 is higher than that of others, while the residual energy of UE 14 and 15 is lower than that of others. In the REES scheme, most UEs use the lowest transmit power to save energy. Thus, the energy consumption of most UEs in the REES scheme is less than that in other schemes. Compared with the EWCE scheme, UE 7 and 17 in the proposed RECE scheme consume less energy, while their CE is almost the same as that in the EWCE scheme. For UEs with low residual energy, i.e., UE 14 and 15, a higher CE can be obtained in the RECE scheme than the EWCE scheme. Therefore, our proposed scheme can improve the CE of UEs with low residual energy.
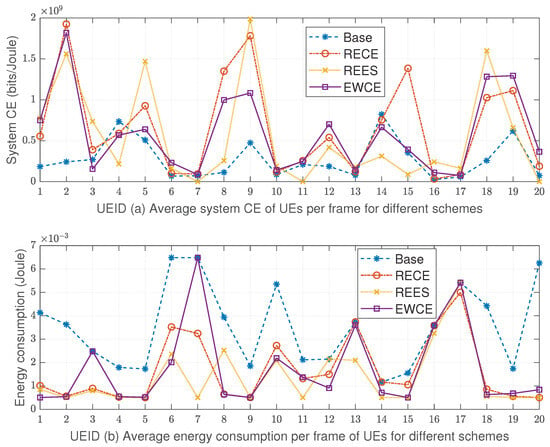
Figure 4.
Average CE of UEs and average energy consumption of UEs per frame for different schemes.
Table 2.
Average CE of UEs (Gbits/Joule) per frame in different schemes.
Table 3.
Average energy consumption of UEs (Joule) per frame in different schemes 1.
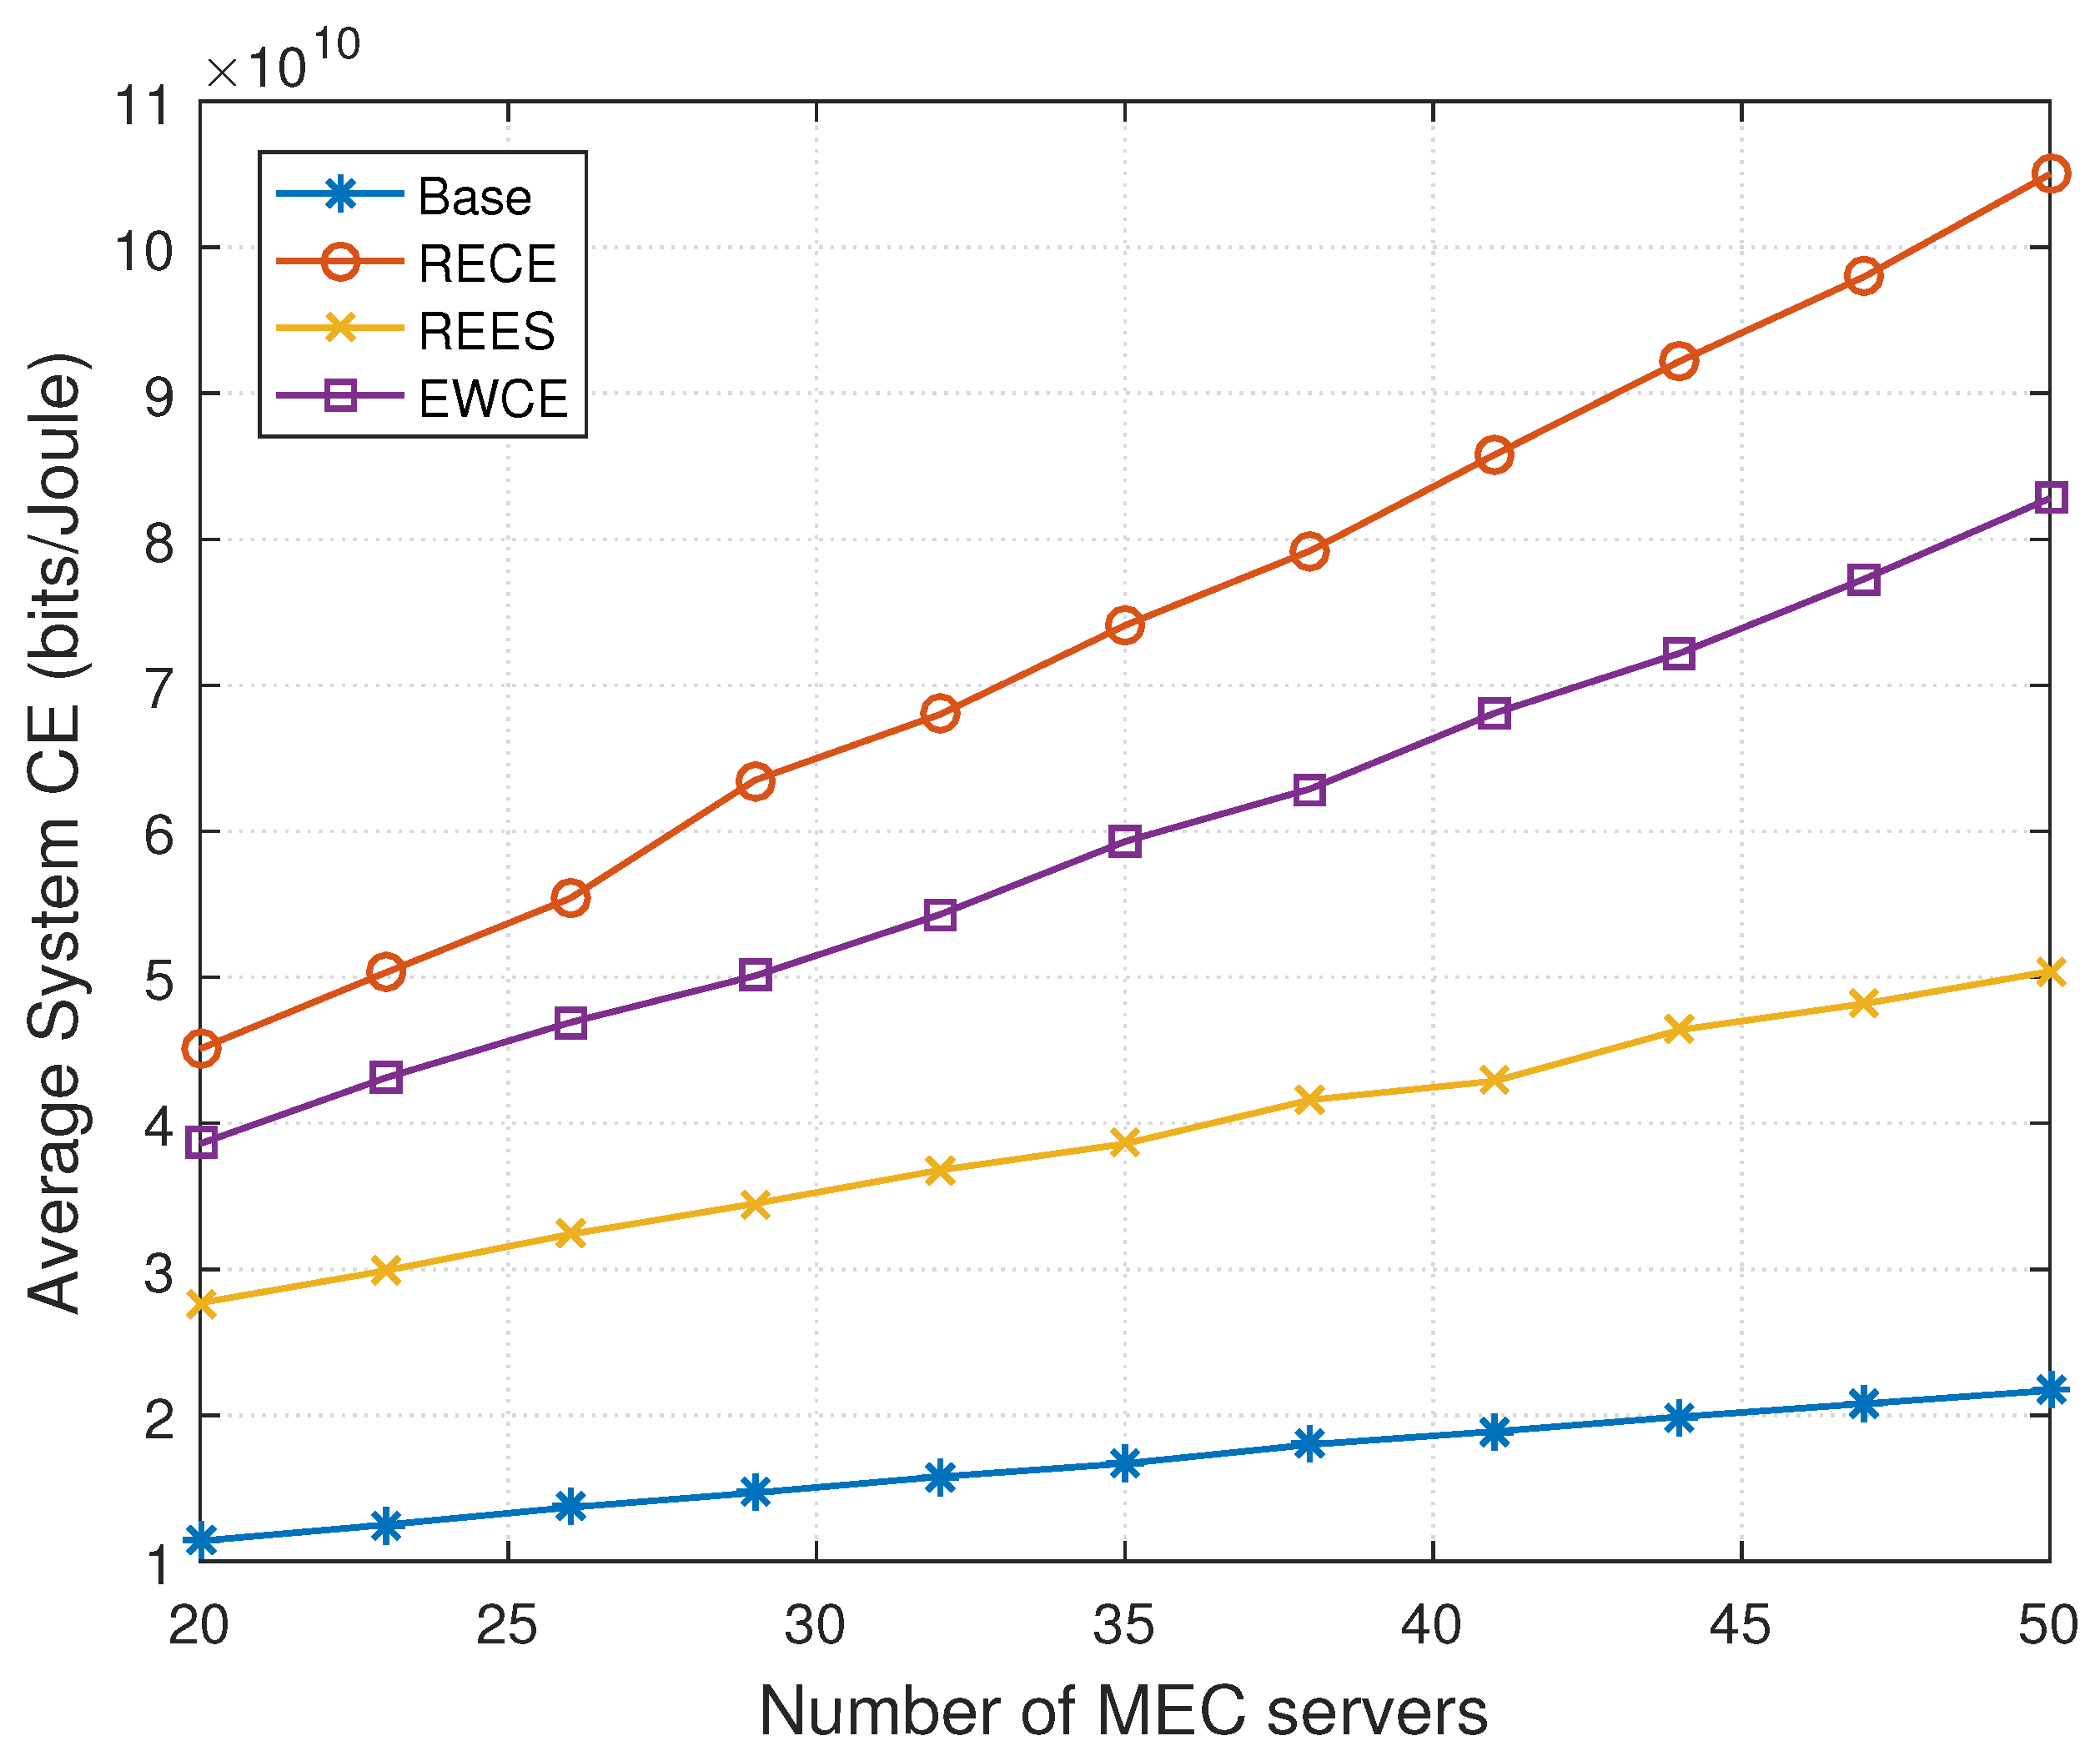
Figure 5 shows the average system CE versus different network densities. The value of CE can be found in Table 4. In order to take full advantage of the subchannels, we assume that four UEs are randomly located within each small cell, and twenty UEs are randomly located in the square area. Obviously, the system CE in all schemes is increased with the number of MEC servers. It can be seen that the performance of the EWCE scheme is more than twice that of the Base scheme. This is due to the fact that subchannel allocation and power allocation are jointly optimized in the EWCE scheme, while the interference between UEs is severe due to the maximum transmit power in the Base scheme. Compared with the REES scheme, the RECE scheme can obtain a larger CE. This is because the power allocation is optimized to reduce energy consumption in the REES scheme, while the power assignment in the RECE scheme is developed to improve the system CE. Moreover, in the match between UEs and MEC servers, the subchannel assignment and power allocation are jointly optimized, and considering the different residual energy of UEs, the RECE scheme can attain better performance than the EWCE scheme.
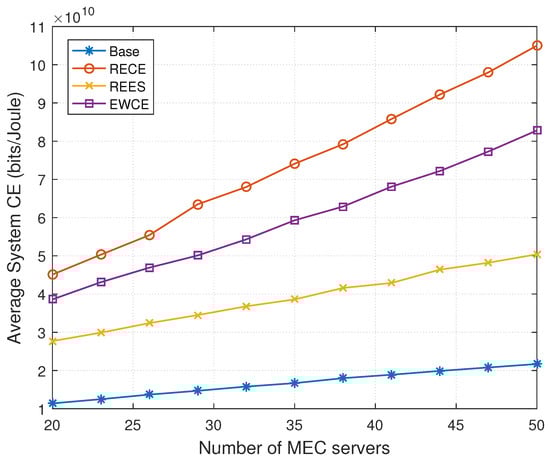
Figure 5.
Average system CE versus network density.
Table 4.
System CE (Gbits/Joule) vs. network density in different schemes.
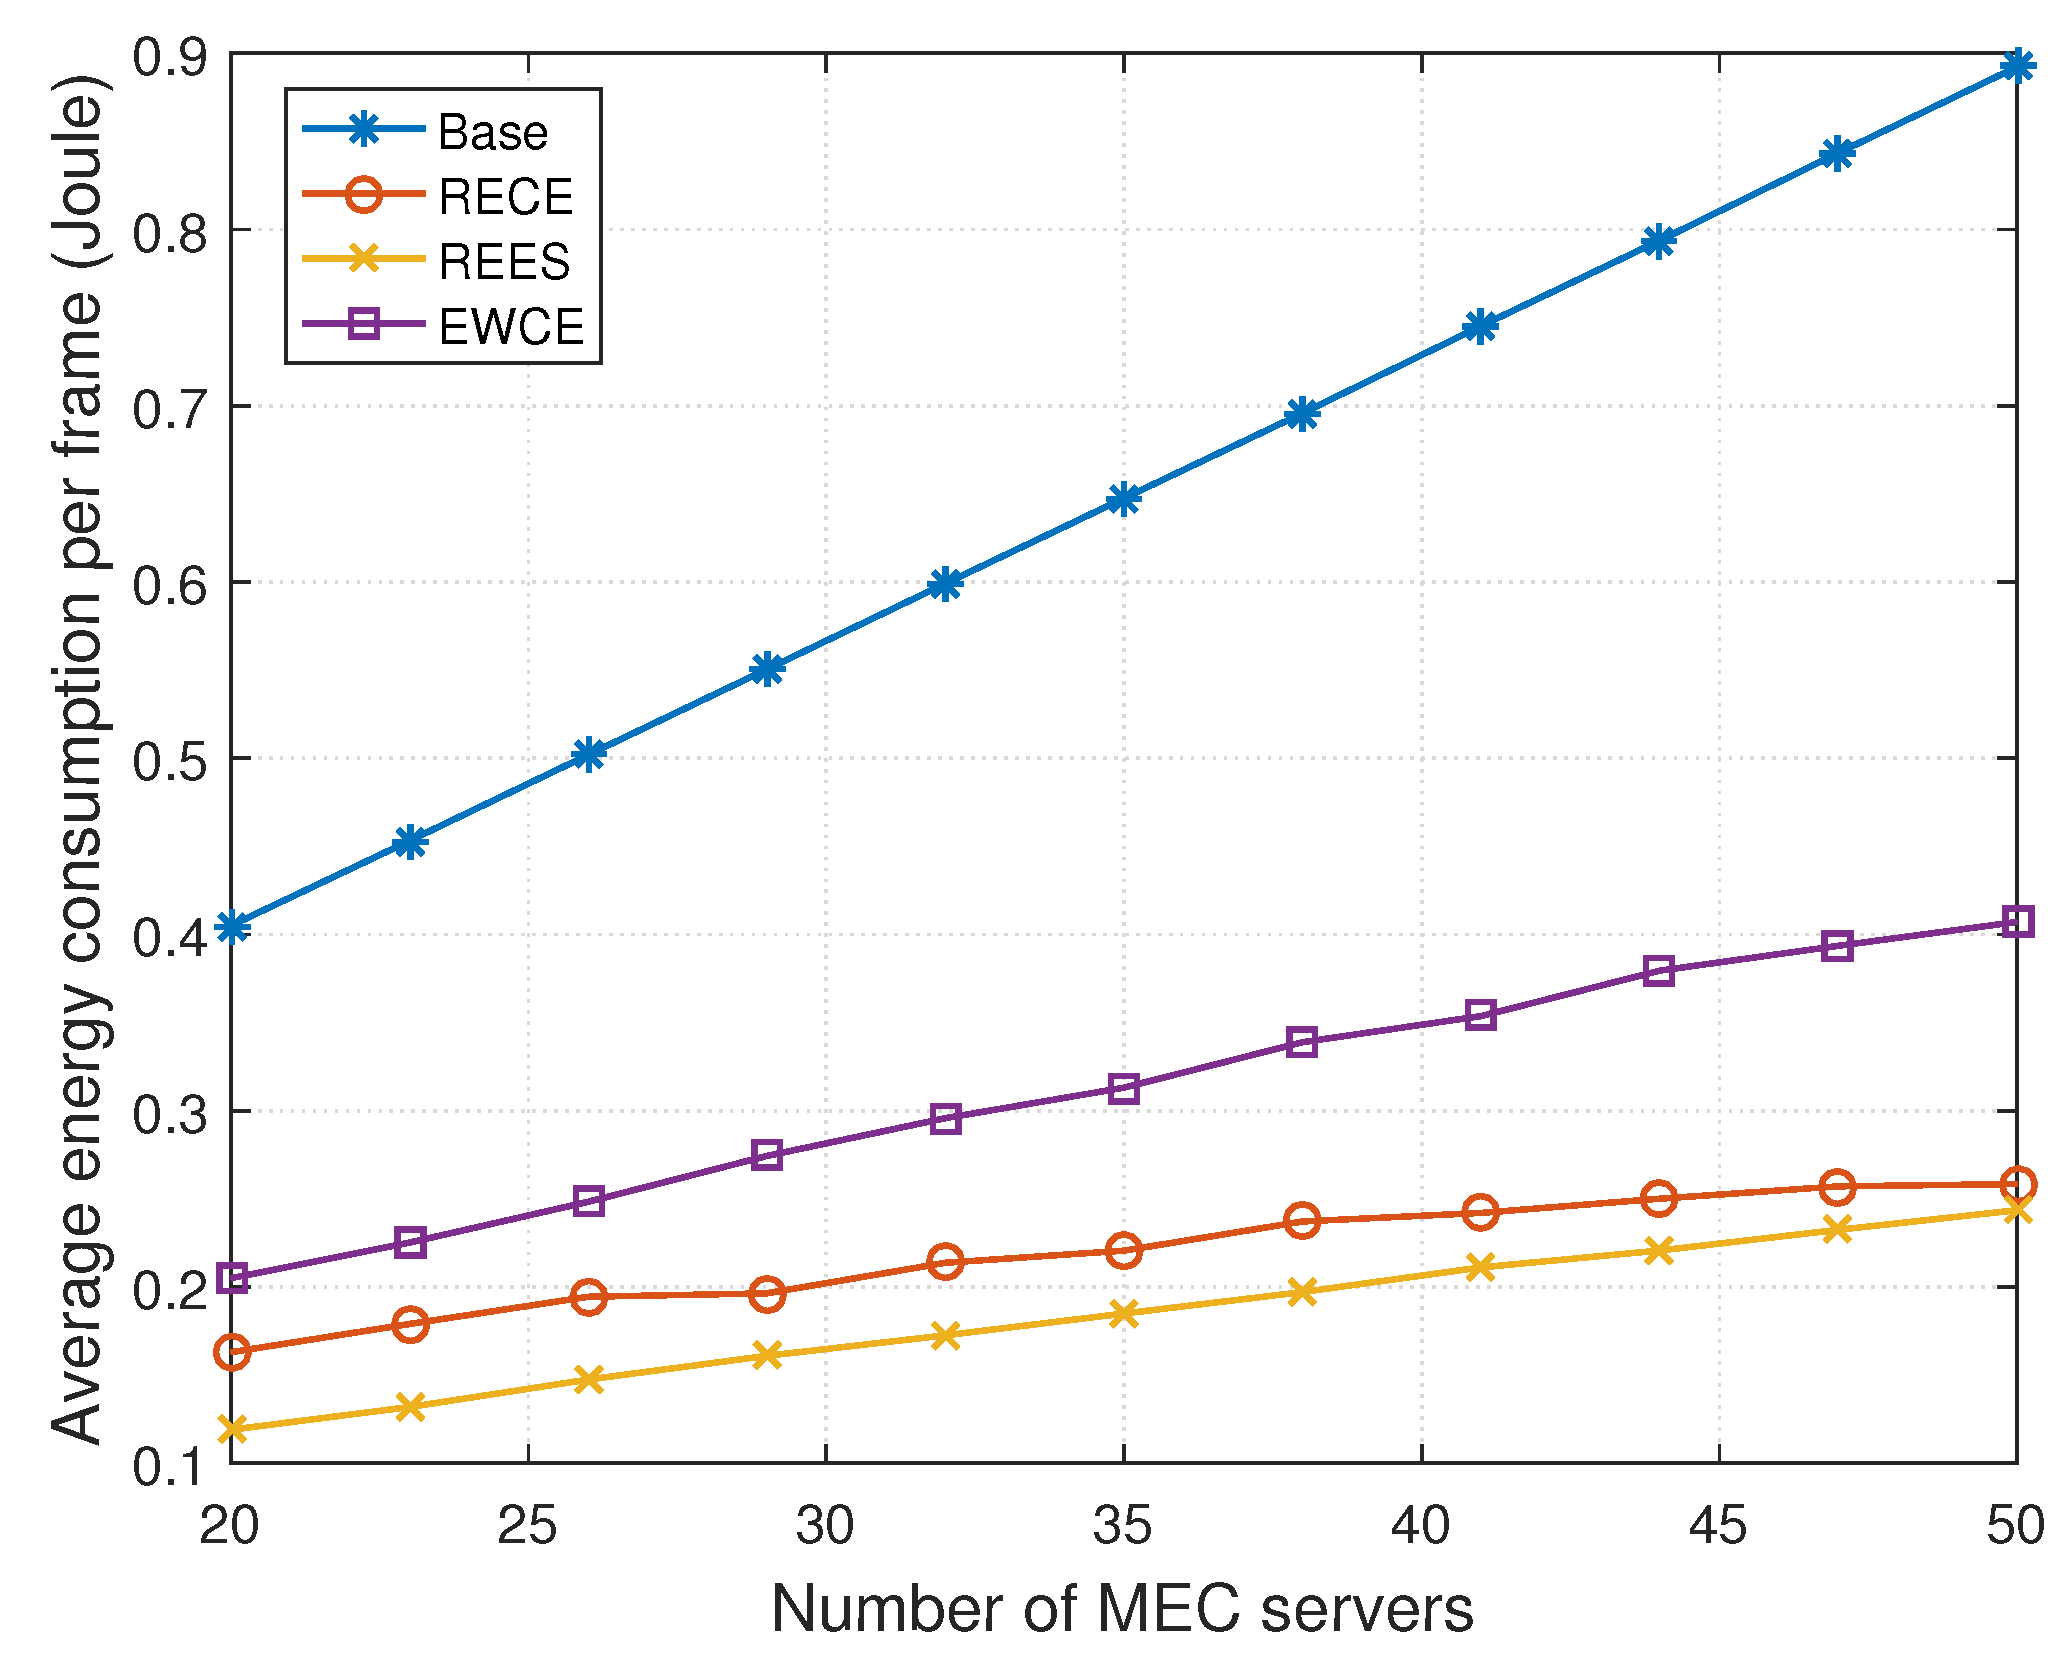
Figure 6 depicts the impact of network density on the performance of the system energy consumption per frame. Table 5 shows the energy consumption per frame. It can be seen that the energy consumption acquired by all the schemes increases with the increase in the network density. Since the number of UEs increases with the growth of the network density and all users are allocated to their maximum transmit power for data transmission, the system energy increases rapidly with the increase in the network density in the Base scheme. In the REES scheme, the system energy consumption is the minimum. This is because the power allocation of all UEs is optimized for the purpose of reducing the system energy consumption. When taking the residual energy of UEs into consideration in the joint optimization of computation offloading, subchannel assignment, and power allocation procedures, the proposed RECE scheme can consume less energy than the EWCE scheme. The reason is that UEs with more residual energy use lower transmit power in the RECE scheme than in the EWCE scheme.

Figure 6.
Average system energy consumption per frame versus network density.
Table 5.
Average system energy consumption (Joule) per frame vs. network density in different schemes.
From Figure 5 and Figure 6, it can be seen that the RECE scheme can achieve a higher system CE than other schemes while consuming a little more system energy than the REES scheme. When the number of MEC servers is 50, the system CE in the RECE scheme is almost twice that in the REES scheme, while the energy consumption in the RECE scheme is 6% higher than in the REES scheme. Moreover, the RECE scheme can obtain better CE performance and less energy consumption than the EWCE scheme for different network densities. When the number of MEC servers is 50, compared with the EWCE scheme, the RECE scheme can improve the system CE by 26.5% while reducing the system energy consumption by 36.5%.
Figure 7 demonstrates the average amount of data processed during one time block with the change in network density in different schemes. It can be seen that when the number of MEC servers is fixed, the Base scheme can handle the largest amount of data while the REES scheme can handle the least amount of data. This is because the UEs in the Base scheme transmit data with the maximum power, while they use the minimum power in the REES scheme in order to save energy. Compared with the EWCE scheme, the proposed RECE scheme can handle more data. The reason is that some UEs with higher residual energy in the RECE scheme use less energy to transmit data, such that the interference caused by them can be mitigated and the interfered UEs can transmit more data. Moreover, since four UEs are assumed to be randomly located within each small cell, it can be observed that the average amount of data increases with the increase in network density. Although the Base scheme can transmit the most data, it also consumes the highest amount of energy. Therefore, its CE is the lowest, which can be seen from Figure 5.
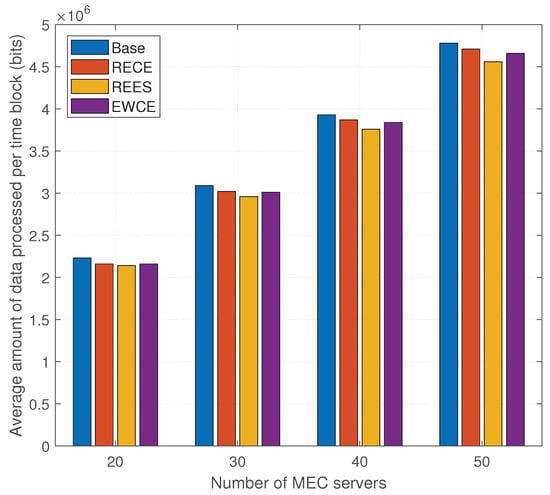
Figure 7.
Average amount of data processed per time block versus network density.
From Figure 6 and Figure 7, it can be observed that compared with the EWCE scheme, the RECE scheme can transmit more data and consume less energy when the number of MEC servers becomes larger. Therefore, a difference in residual energy of UEs for CE optimization is imperative, and our proposed scheme is more efficient for the scenario with higher network density.
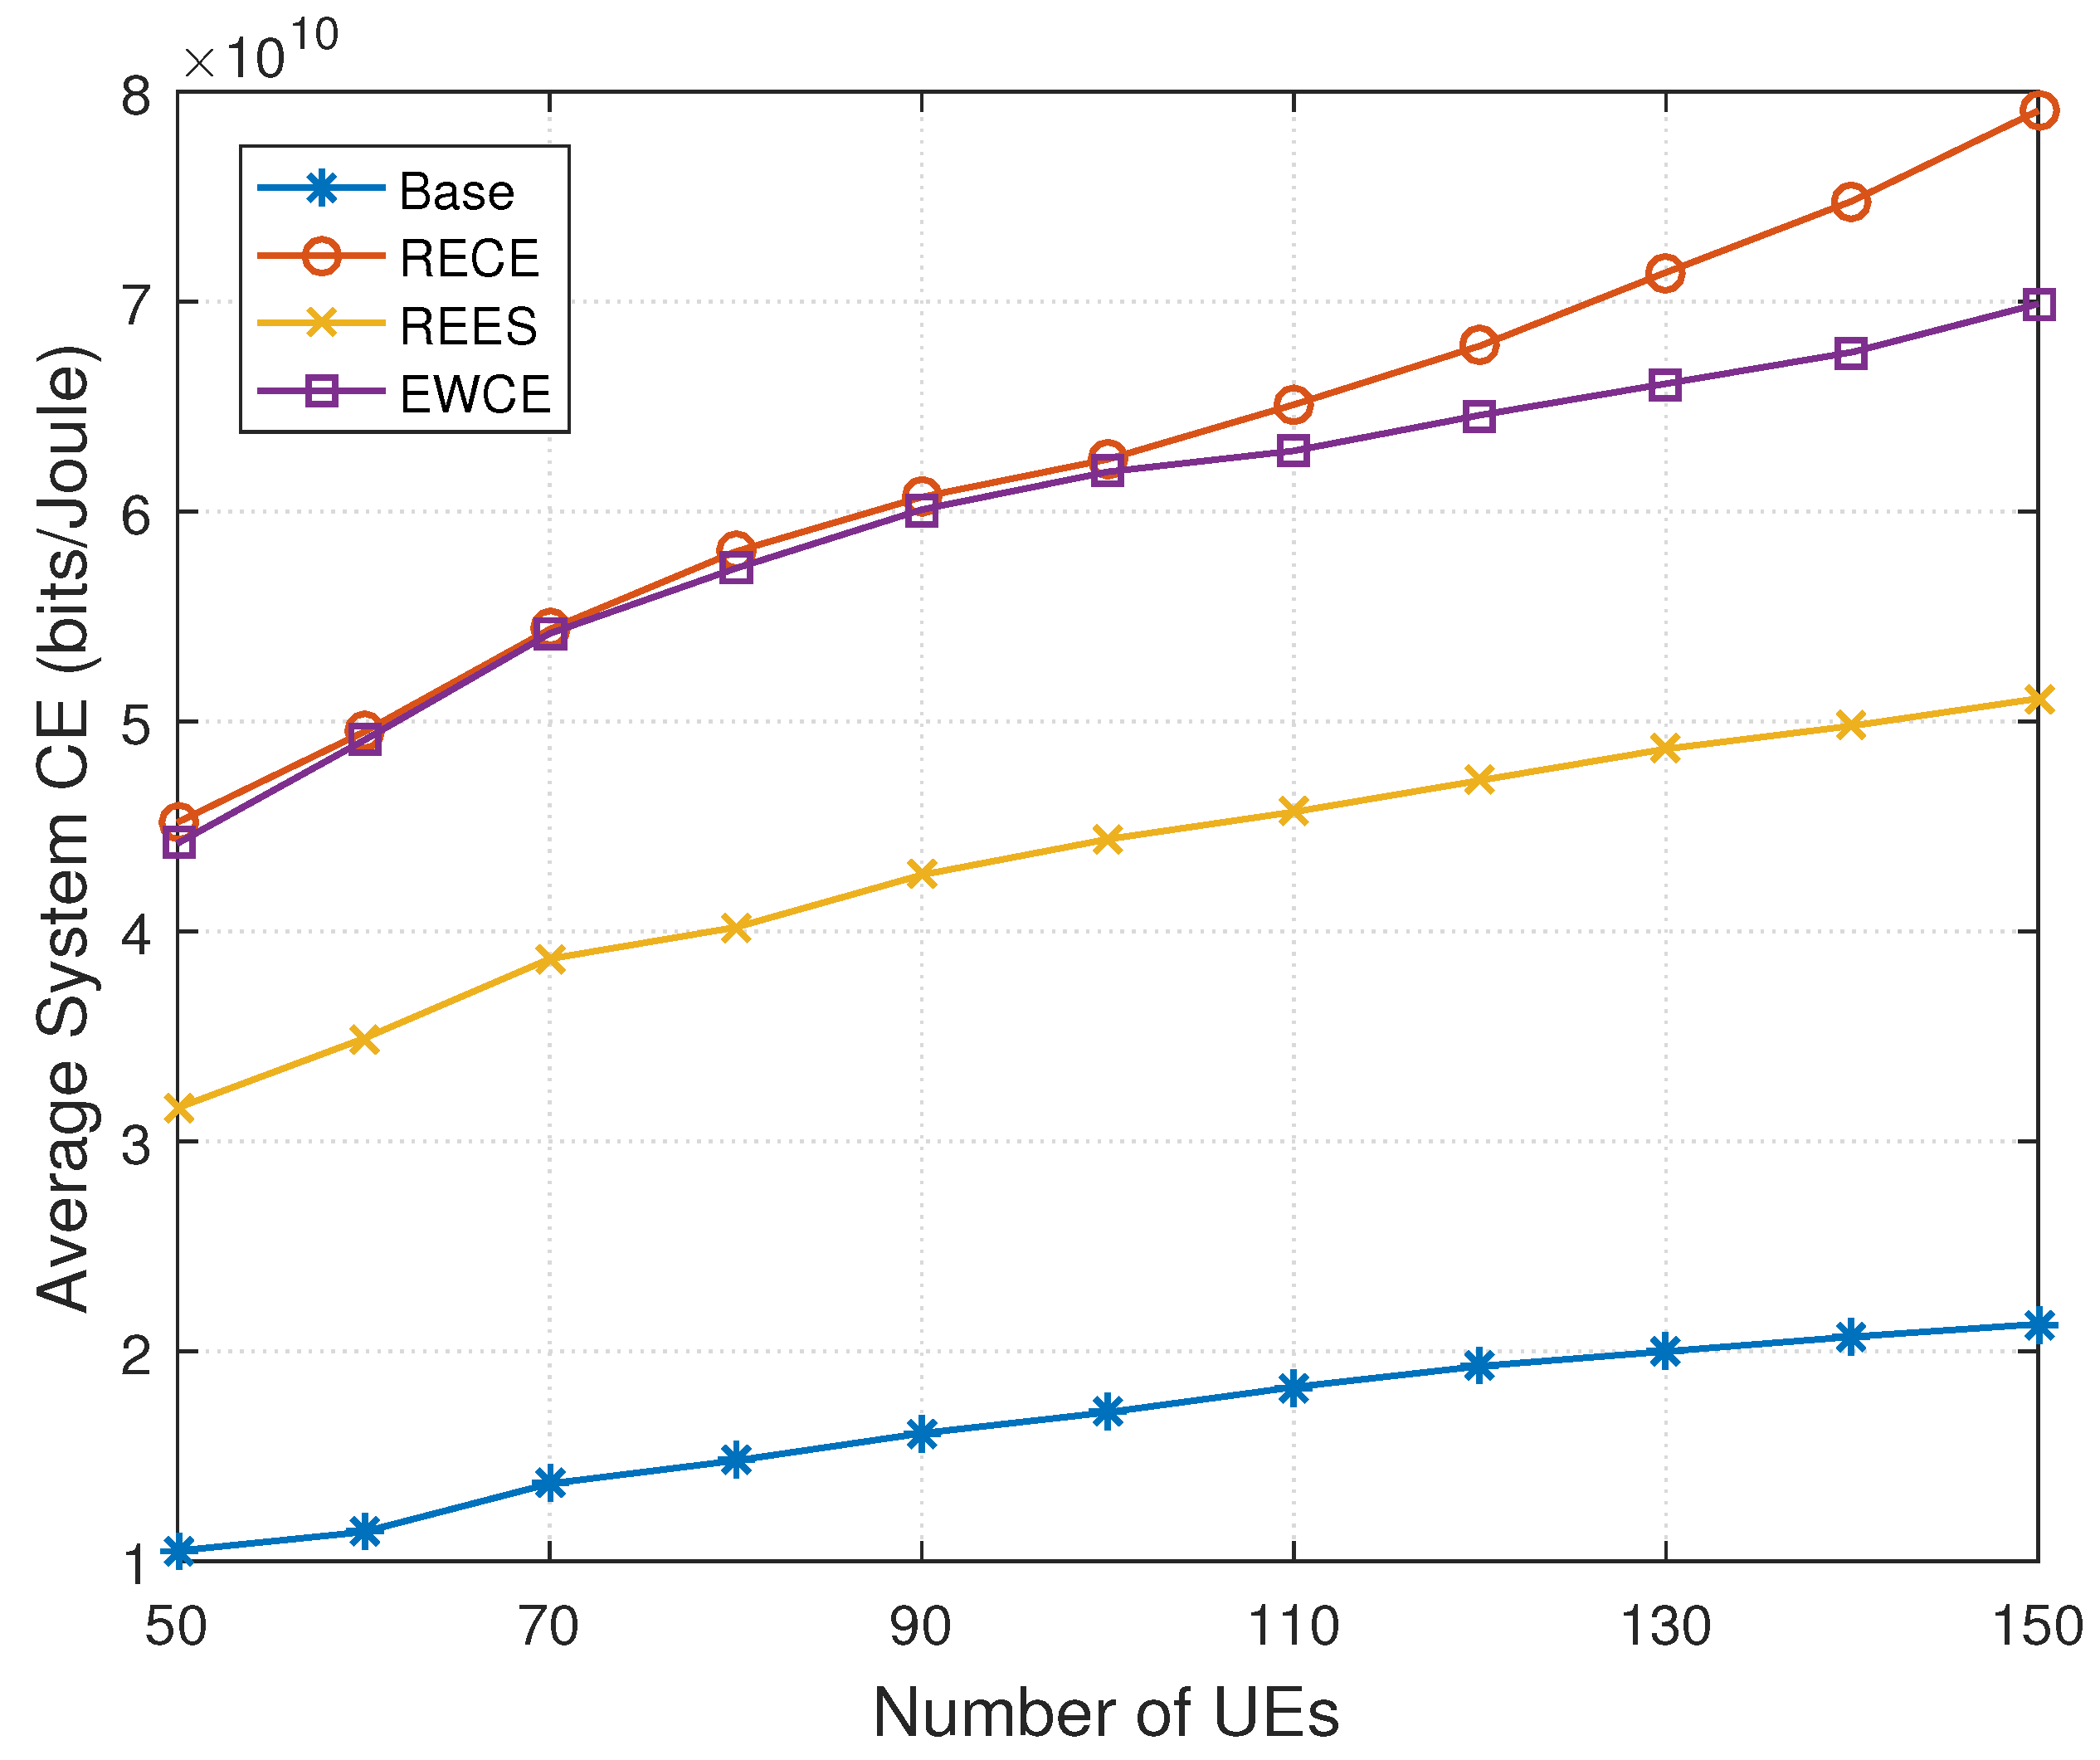
In Figure 8, we present the relationship between the average system CE and the number of UEs in the network when the number of MEC servers is 30. Table 6 presents the system CE. As can be seen from Figure 8, the system CE increases with more UEs for all four schemes, which implies that the growth rate of dataset size is faster than the increase in required energy. In addition, it is obvious that the RECE and EWCE schemes are superior to the Base and REES schemes. This is because the CE is the optimization goal in the RECE and EWCE schemes. Especially the RECE scheme can yield much higher CE than the EWCE scheme when the number of users is larger than 100. The reason is that over 60% of the subchannels in each SBS are occupied when the number of UEs exceeds 100, resulting in more severe co-tier interference, which can be effectively mitigated in the RECE scheme by reasonably allocating subchannels and reducing the transmit power of UEs with more residual energy.
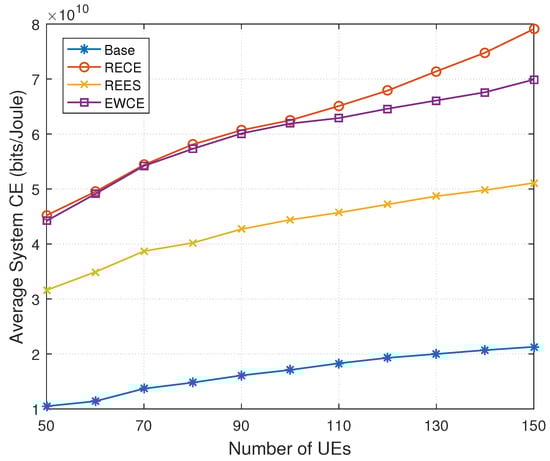
Figure 8.
Average system CE versus the number of UEs.
Table 6.
System CE (Gbits/Joule) vs. UE density in different schemes.
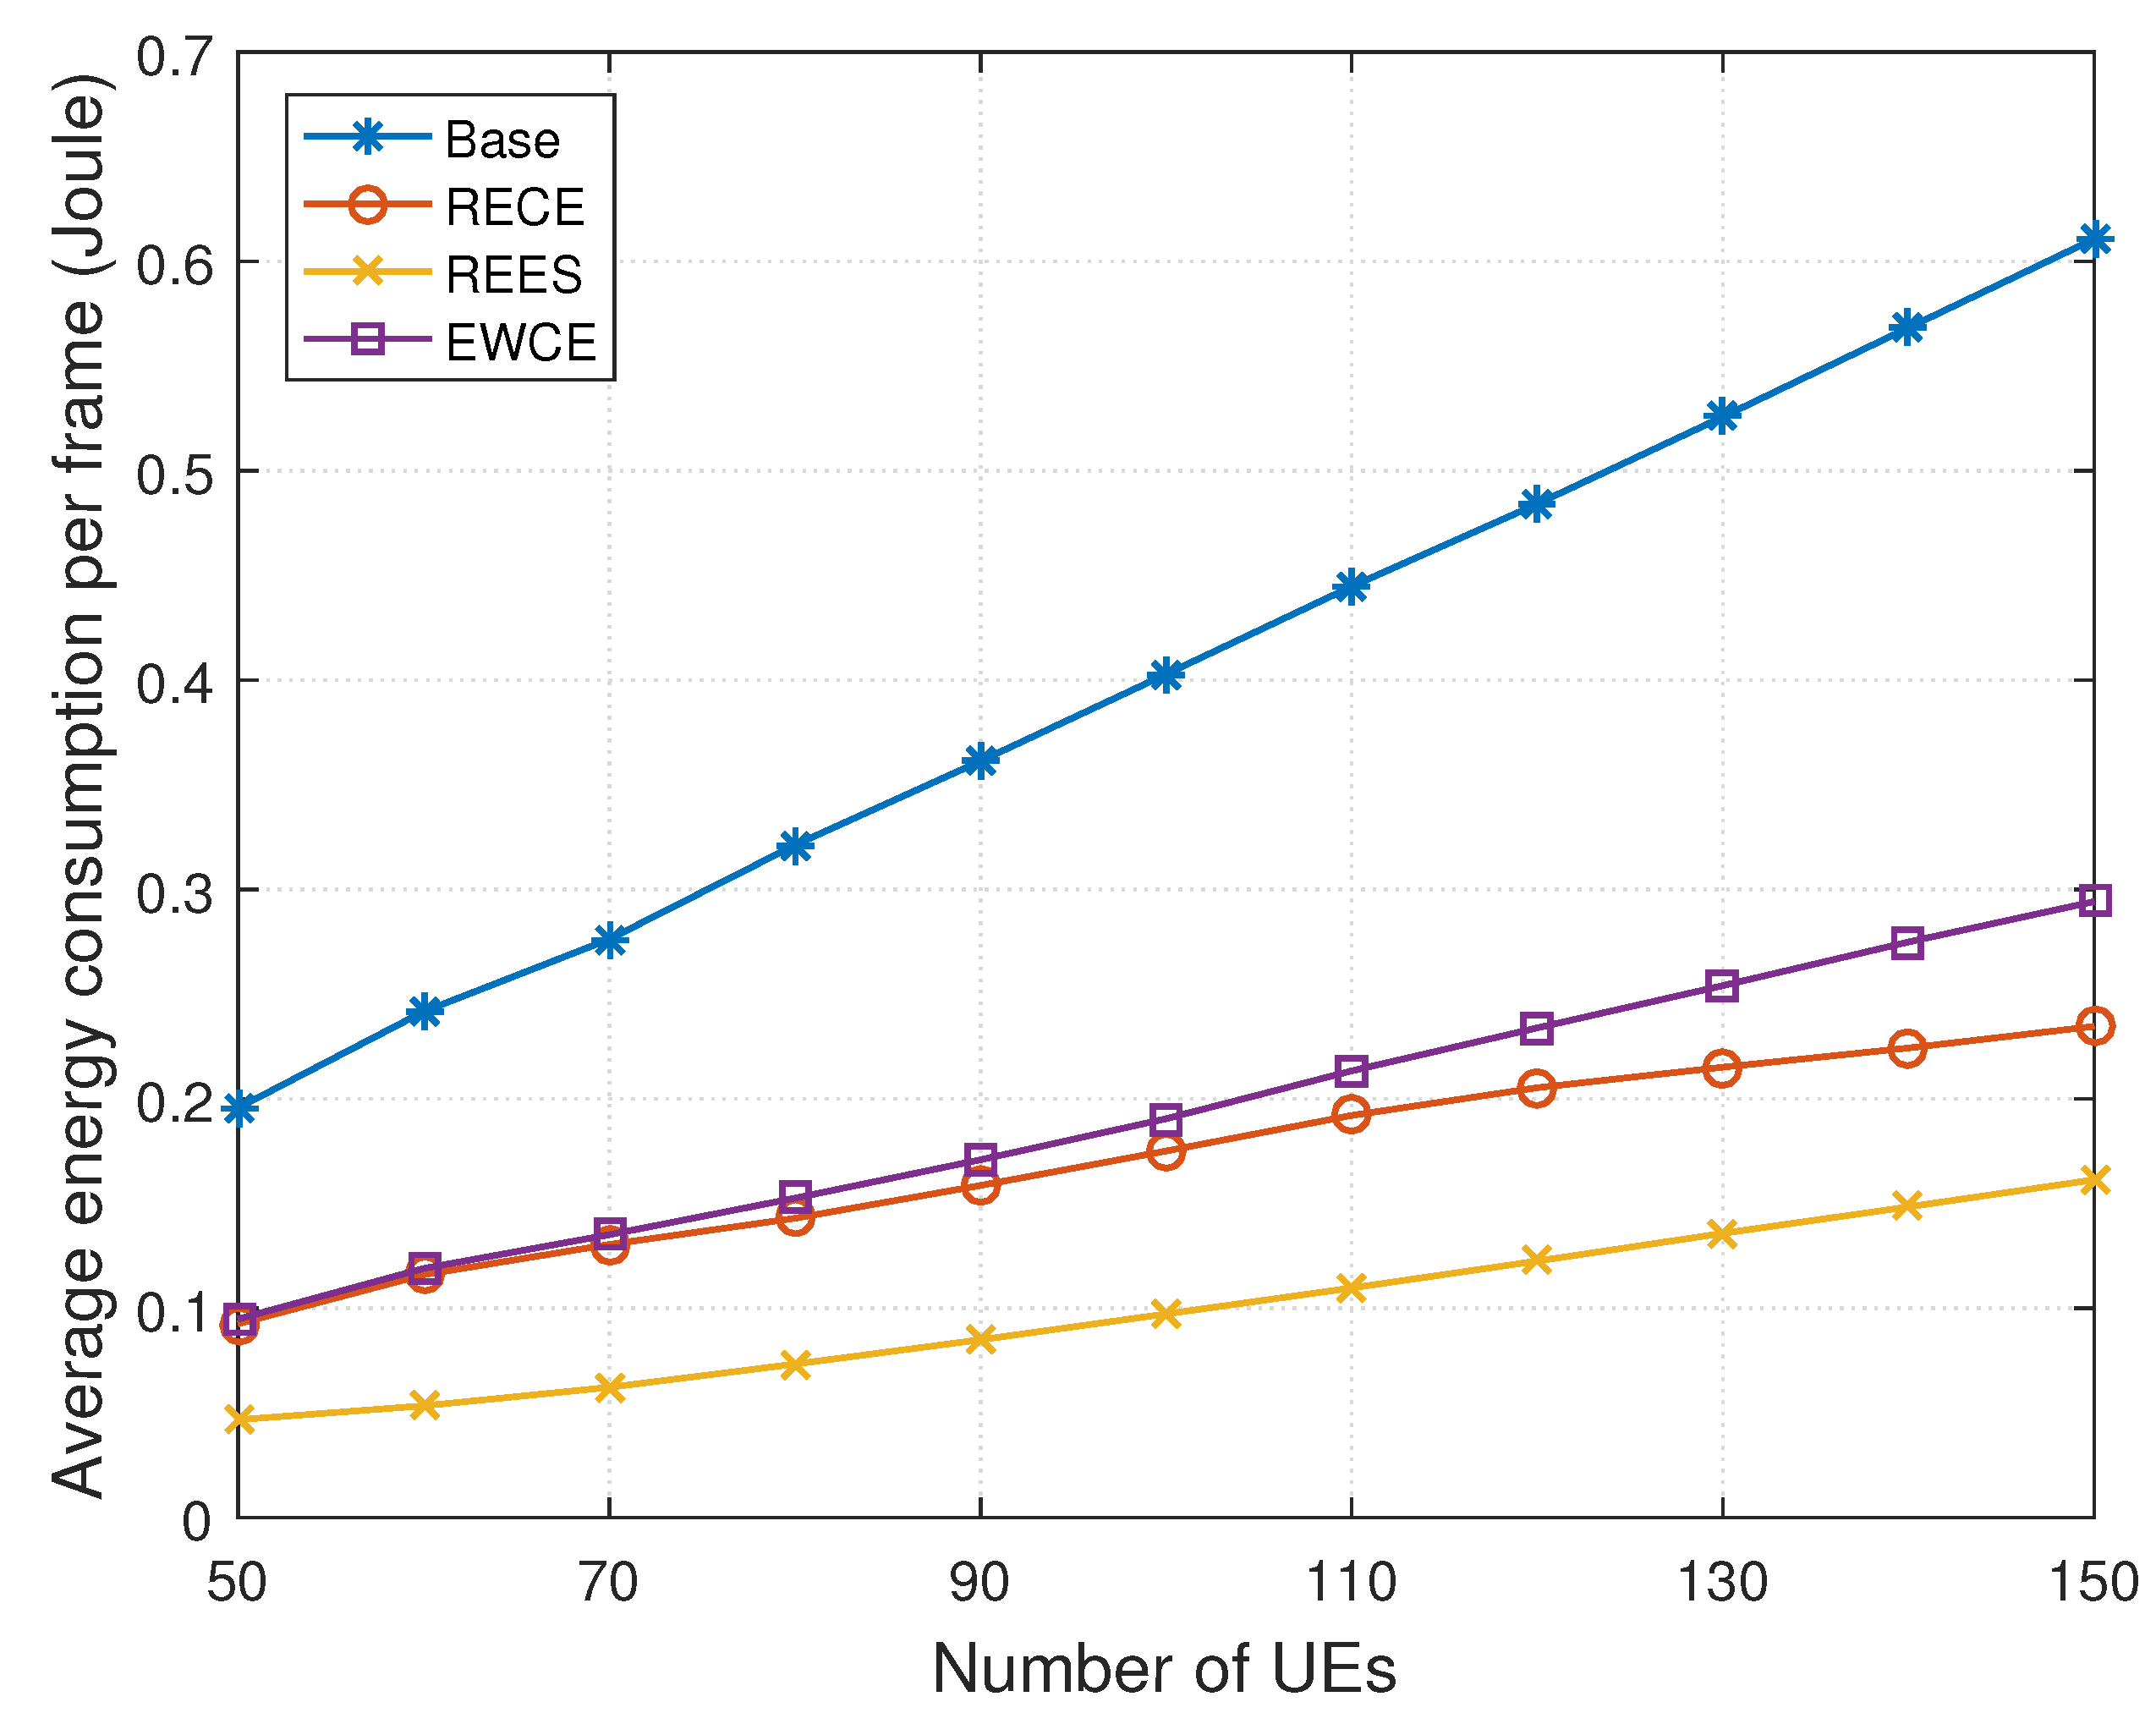
Figure 9 illustrates the average system energy consumption per frame versus the number of UEs when the number of MEC servers is 30. The value of energy consumption can be found in Table 7. It is obviously noted that the system energy increases monotonically with the number of UEs for all schemes. Since the goal of the REES scheme is to reduce the system energy, the UEs in this scheme use the minimum transmit power to offload their tasks. Thus, the system energy consumption in the REES scheme is the lowest. It can be seen that the system energy consumption is the highest in the Base scheme due to the fact that all UEs use their maximum transmit power. When the number of UEs is more than 100, the gap of system energy consumption between the EWCE and RECE schemes become larger. The reason is that the UEs with more residual energy use a lower transmit power to offload their tasks in order to mitigate the co-tier interference to the UEs with less residual energy in the RECE scheme.
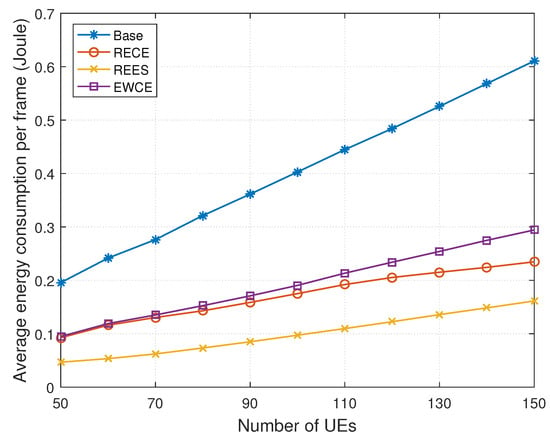
Figure 9.
Average system energy consumption per frame versus number of UEs.
Table 7.
Average system energy consumption (Joule) per frame vs. UE density in different schemes.
From Figure 8 and Figure 9, it can be observed that both the system CE and the system energy consumption speed up as the number of UEs increases. The system CE in the RECE is much higher than that in the REES scheme, while the energy consumption is slightly higher than that in the REES scheme. When the number of UEs increases, compared with the EWCE scheme, the system CE is much higher and the energy consumption is much lower in the RECE scheme.
Figure 10 shows the average amount of data processed per time block in different schemes when the number of MEC servers is 30. It can be seen that when the number of UEs is small, these four schemes attain almost the same performance. This is because each SBS serves a small number of UEs and the interference between UEs is not severe. Thus, the UEs can transmit a large amount of data to the SBSs and MEC servers. When the number of UEs increases, the Base scheme can transmit more data than others, while the REES scheme transmits the smallest amount of data. The reason is that the transmit power of UEs is the maximum in the Base scheme, while the transmit power is reduced to save energy in the REES scheme. In addition, it can be observed that the average amount of data processed per time block is almost the same in the RECE and EWCE schemes. Therefore, the proposed RECE scheme can reduce the system energy consumption without degrading the performance of UEs.
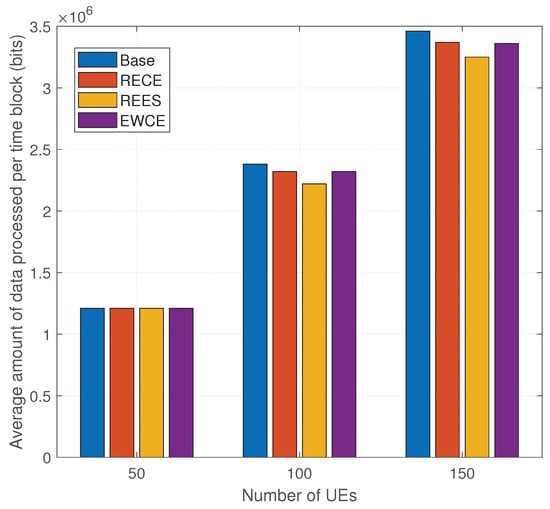
Figure 10.
Average amount of data processed per time block versus number of UEs.
From Figure 9 and Figure 10, it can be seen that compared with the EWCE scheme, the RECE scheme can transmit more data and consume less energy when the number of UEs becomes greater. Therefore, our proposed scheme is more efficient than other schemes in the scenario with more UEs, and the consideration of different residual energy of UEs is necessary.
5. Conclusions
In this paper, we optimize the system CE in the DECS, considering the residual energy of UEs. The computation offloading, subchannel assignment, and transmit power allocation of UEs are jointly optimized. Therefore, we propose the RECE scheme, including the matching-based computation offloading strategy, the coloring-based subchannel assignment scheme, and the CCCP-based power allocation algorithm. The simulation results demonstrate that the proposed RECE scheme can optimize the CE of UEs according to their residual energy. In addition, compared with the REES scheme, the RECE scheme can improve the system CE with a slight sacrifice of system energy consumption. Compared with the EWCE scheme, the system CE can be much enhanced and the energy consumption can be reduced in the RECE scheme.
In future work, the cooperation between heterogeneous UEs and the computation offloading strategy for decomposable tasks will be investigated to improve the system CE in heterogeneous DECS. Additionally, MEC has many advantages, such as proximity awareness, low latency, and high bandwidth, encouraging its use in the three classical 5G application scenarios, i.e., enhanced Mobile Broadband (eMBB), Ultra Reliable Low-Latency Communications (URLLC), and massive Machine Type of Communication (mMTC), and many usage cases where the three scenarios are mixed. Furthermore, IoT applications represent opportunities for MEC technology. Therefore, the integration of MEC, 5G, and IoT is an important and promising research direction. The authors summarize five scenarios of 5G and MEC, and develop a win–win mode for their combination in [38]. The key enabling technologies which facilitate the integration of MEC into 5G and IoT are elaborated in [39]. Therefore, in the future, we will extend our work to practical application scenarios integrating MEC, 5G, and IoT, and focus on the joint optimization of CE, communication efficiency, and energy efficiency while taking into account the heterogeneity of services, devices, and networks.
Author Contributions
Conceptualization, S.W. and X.L. (Xiaolin Li); methodology, S.W. and N.D.; software, S.W. and X.L. (Xiaolin Li); validation, N.D.; formal analysis, X.L. (Xia Liu); investigation, S.W. and X.L. (Xiaolin Li); resources, N.D.; data curation, X.L. (Xia Liu); writing—original draft preparation, S.W.; writing—review and editing, X.L. (Xiaolin Li); visualization, N.D.; supervision, X.L. (Xia Liu) All authors have read and agreed to the published version of the manuscript.
Funding
This research was funded by Chinese National Nature Science Foundation (Grant 62201491), the Natural Science Foundation of Shandong Province (Grant ZR2021QF097) and the Yantai Science and Technology Innovation Program (Grant 2022JMRH003).
Data Availability Statement
Not applicable.
Acknowledgments
All authors would like to thank the anonymous referees for their valuable comments and suggestions.
Conflicts of Interest
The authors declare no conflict of interest.
References
- Chen, L.; Shen, C.; Zhou, P.; Xu, J. Collaborative service placement for edge computing in dense small cell networks. IEEE Trans. Mob. Comput. 2019, 20, 377–390. [Google Scholar] [CrossRef]
- Taleb, T.; Samdanis, K.; Mada, B.; Flinck, H.; Dutta, S.; Sabella, D. On multi-access edge computing: A survey of the emerging 5G network edge cloud architecture and orchestration. IEEE Commun. Surv. Tutorials 2017, 19, 1657–1681. [Google Scholar] [CrossRef]
- Teng, Y.; Liu, M.; Yu, F.R.; Leung, V.C.; Song, M.; Zhang, Y. Resource allocation for ultra-dense networks: A survey, some research issues and challenges. IEEE Commun. Surv. Tutorials 2018, 21, 2134–2168. [Google Scholar] [CrossRef]
- Hu, Y.C.; Patel, M.; Sabella, D.; Sprecher, N.; Young, V. Mobile edge computing—A key technology towards 5G. ETSI White Pap. 2015, 11, 1–16. [Google Scholar]
- Zhou, S.; Jadoon, W.; Khan, I.A. Computing Offloading Strategy in Mobile Edge Computing Environment: A Comparison between Adopted Frameworks, Challenges, and Future Directions. Electronics 2023, 12, 2452. [Google Scholar] [CrossRef]
- Guo, H.; Liu, J.; Zhang, J. Computation offloading for multi-access mobile edge computing in ultra-dense networks. IEEE Commun. Mag. 2018, 56, 14–19. [Google Scholar] [CrossRef]
- Sun, P.; Zhang, H.; Ji, H.; Xi, L. Small cells clustering and resource allocation in dense network with mobile edge computing. In Proceedings of the IEEE Wireless Communications and Networking Conference (WCNC), Marrakesh, Morocco, 15–18 April 2019; pp. 1–6. [Google Scholar]
- Chen, L.; Zhou, S.; Xu, J. Energy efficient mobile edge computing in dense cellular networks. In Proceedings of the International Conference on Communications (ICC), Paris, France, 21–25 May 2017; pp. 1–6. [Google Scholar]
- Elbayoumi, M.; Hamouda, W.; Youssef, A. Edge Computing and Multiple-Association in Ultra-Dense Networks: Performance Analysis. IEEE Trans. Commun. 2022, 70, 5098–5112. [Google Scholar] [CrossRef]
- Liu, S.; Cheng, P.; Chen, Z.; Xiang, W.; Vucetic, B.; Li, Y. User-oriented task offloading for mobile edge computing in ultra-dense networks. In Proceedings of the Global Communications Conference (GLOBECOM), Madrid, Spain, 7–11 December 2021; pp. 1–6. [Google Scholar]
- Sun, Y.; He, Q. Joint task offloading and resource allocation for multi-user and multi-server MEC networks: A deep reinforcement learning approach with multi-branch architecture. Eng. Appl. Artif. Intell. 2023, 126, 106790. [Google Scholar] [CrossRef]
- He, Z.; Xu, Y.; Liu, D.; Zhou, W.; Li, K. Energy-efficient computation offloading strategy with task priority in cloud assisted multi-access edge computing. Future Gener. Comput. Syst. 2023, 148, 298–313. [Google Scholar] [CrossRef]
- El Haber, E.; Nguyen, T.M.; Assi, C.; Ajib, W. An energy-efficient task offloading solution for MEC-based IoT in Ultra-dense networks. In Proceedings of the IEEE Wireless Communications and Networking Conference (WCNC), Marrakesh, Morocco, 15–18 April 2019; pp. 1–7. [Google Scholar]
- Guo, H.; Zhang, J.; Liu, J.; Zhang, H.; Sun, W. Energy-efficient task offloading and transmit power allocation for ultra-dense edge computing. In Proceedings of the IEEE Global Communications Conference (GLOBECOM), Abu Dhabi, United Arab Emirates, 12–13 December 2018; pp. 1–6. [Google Scholar]
- Zhou, T.; Qin, D.; Nie, X.; Li, X.; Li, C. Energy-efficient computation offloading and resource management in ultradense heterogeneous networks. IEEE Trans. Veh. Technol. 2021, 70, 13101–13114. [Google Scholar] [CrossRef]
- Zhang, W.; Tuo, K. Research on Offloading Strategy for Mobile Edge Computing Based on Improved Grey Wolf Optimization Algorithm. Electronics 2023, 12, 2533. [Google Scholar] [CrossRef]
- Gao, Y.; Zhang, H.; Yu, F.; Xia, Y.; Shi, Y. Joint Computation Offloading and Resource Allocation for Mobile-Edge Computing Assisted Ultra-Dense Networks. J. Commun. Inf. Netw. 2022, 7, 96–106. [Google Scholar] [CrossRef]
- Pang, S.; Wang, S. Joint wireless source management and task offloading in ultra-dense network. IEEE Access 2020, 8, 52917–52926. [Google Scholar] [CrossRef]
- Nouri, N.; Abouei, J.; Jaseemuddin, M.; Anpalagan, A. Joint access and resource allocation in ultradense mmWave NOMA networks with mobile edge computing. IEEE Internet Things J. 2019, 7, 1531–1547. [Google Scholar] [CrossRef]
- Lu, Y.; Chen, X.; Zhang, Y.; Chen, Y. Cost-Efficient Resources Scheduling for Mobile Edge Computing in Ultra-Dense Networks. IEEE Trans. Netw. Service Manag. 2022, 19, 3163–3173. [Google Scholar] [CrossRef]
- Li, J.; Shang, Y.; Qin, M.; Yang, Q.; Cheng, N.; Gao, W.; Kwak, K.S. Multiobjective oriented task scheduling in heterogeneous mobile edge computing networks. IEEE Trans. Veh. Technol. 2022, 71, 8955–8966. [Google Scholar] [CrossRef]
- Sun, H.; Zhou, F.; Hu, R.Q. Joint offloading and computation energy efficiency maximization in a mobile edge computing system. IEEE Trans. Veh. Technol. 2019, 68, 3052–3056. [Google Scholar] [CrossRef]
- Wu, Y.; Wang, Y.; Zhou, F.; Hu, R.Q. Computation efficiency maximization in OFDMA-based mobile edge computing networks. IEEE Commun. Lett. 2019, 24, 159–163. [Google Scholar] [CrossRef]
- Zhou, F.; Hu, R.Q. Computation efficiency maximization in wireless-powered mobile edge computing networks. IEEE Trans. Wirel. Commun. 2020, 19, 3170–3184. [Google Scholar] [CrossRef]
- Cang, Y.; Chen, M.; Zhao, J.; Gong, T.; Zhao, J.; Yang, Z. Fair Computation Efficiency for OFDMA-based Multi-access Edge Computing Systems. IEEE Commun. Lett. 2022, 27, 916–920. [Google Scholar] [CrossRef]
- Yu, X.; Xu, F.; Cai, J.; Dang, X.y.; Wang, K. Computation Efficiency Optimization for Millimeter-Wave Mobile Edge Computing Networks with NOMA. IEEE Trans. Mob. Comput. 2022, 22, 4578–4593. [Google Scholar] [CrossRef]
- Yu, X.; Yu, K.; Huang, X.; Dang, X.; Wang, K.; Cai, J. Computation efficiency optimization for RIS-assisted millimeter-wave mobile edge computing systems. IEEE Trans. Commun. 2022, 70, 5528–5542. [Google Scholar] [CrossRef]
- Mohajer, A.; Daliri, M.S.; Mirzaei, A.; Ziaeddini, A.; Nabipour, M.; Bavaghar, M. Heterogeneous computational resource allocation for NOMA: Toward green mobile edge-computing systems. IEEE Trans. Serv. Comput. 2022, 16, 1225–1238. [Google Scholar] [CrossRef]
- Su, B.; Ni, Q.; Yu, W.; Pervaiz, H. Optimizing computation efficiency for NOMA-assisted mobile edge computing with user cooperation. IEEE Trans. Green Commun. Netw. 2021, 5, 858–867. [Google Scholar] [CrossRef]
- Lin, H.; Cao, Y.; Zhong, Y.; Liu, P. Secure computation efficiency maximization in NOMA-enabled mobile edge computing networks. IEEE Access 2019, 7, 87504–87512. [Google Scholar] [CrossRef]
- Zhang, X.; Zhong, Y.; Liu, P.; Zhou, F.; Wang, Y. Resource allocation for a UAV-enabled mobile-edge computing system: Computation efficiency maximization. IEEE Access 2019, 7, 113345–113354. [Google Scholar] [CrossRef]
- Hu, Z.; Zeng, F.; Xiao, Z.; Fu, B.; Jiang, H.; Chen, H. Computation efficiency maximization and QoE-provisioning in UAV-enabled MEC communication systems. IEEE Trans. Netw. Sci. Eng. 2021, 8, 1630–1645. [Google Scholar] [CrossRef]
- Pham, Q.V.; Leanh, T.; Tran, N.H.; Park, B.J.; Hong, C.S. Decentralized computation offloading and resource allocation for mobile-edge computing: A matching game approach. IEEE Access 2018, 6, 75868–75885. [Google Scholar] [CrossRef]
- Du, Y.; Li, J.; Shi, L.; Liu, T.; Shu, F.; Han, Z. Two-tier matching game in small cell networks for mobile edge computing. IEEE Trans. Serv. Comput. 2019, 15, 254–265. [Google Scholar] [CrossRef]
- Jong, Y. An Efficient Global Optimization Algorithm for Nonlinear Sum-of-Ratios Problem. 2012. Available online: https://optimization-online.org/wp-content/uploads/2012/08/3586.pdf (accessed on 18 October 2023).
- 3GPP. Further Advancements for E-UTRA Physical Layer Aspects; Technical Report, 3GPP TR 36.814; 3GPP: Paris, France, 2010. [Google Scholar]
- Zhou, H.; Jiang, K.; Liu, X.; Li, X.; Leung, V.C. Deep reinforcement learning for energy-efficient computation offloading in mobile-edge computing. IEEE Internet Things J. 2021, 9, 1517–1530. [Google Scholar] [CrossRef]
- Fang, F.; Wu, X. A win–win mode: The complementary and coexistence of 5G networks and edge computing. IEEE Internet Things J. 2020, 8, 3983–4003. [Google Scholar] [CrossRef]
- Liu, Y.; Peng, M.; Shou, G.; Chen, Y.; Chen, S. Toward edge intelligence: Multiaccess edge computing for 5G and Internet of Things. IEEE Internet Things J. 2020, 7, 6722–6747. [Google Scholar] [CrossRef]


Disclaimer/Publisher’s Note: The statements, opinions and data contained in all publications are solely those of the individual author(s) and contributor(s) and not of MDPI and/or the editor(s). MDPI and/or the editor(s) disclaim responsibility for any injury to people or property resulting from any ideas, methods, instructions or products referred to in the content. |
© 2023 by the authors. Licensee MDPI, Basel, Switzerland. This article is an open access article distributed under the terms and conditions of the Creative Commons Attribution (CC BY) license (https://creativecommons.org/licenses/by/4.0/).