Article

Advanced Examination of User Behavior Recognition via Log Dataset Analysis of Web Applications Using Data Mining Techniques

Department of Computer and Control Engineering, Rzeszow University of Technology, Powstancow Warszawy 12, 35-959 Rzeszow, Poland
*
Author to whom correspondence should be addressed.
Electronics 2023, 12(21), 4408; https://doi.org/10.3390/electronics12214408
Submission received: 7 October 2023 / Revised: 20 October 2023 / Accepted: 23 October 2023 / Published: 25 October 2023
(This article belongs to the Special Issue Advanced Web Applications)

Abstract

:
As web systems based on containerization increasingly attract research interest, the need for effective analytical methods has heightened, with an emphasis on efficiency and cost reduction. Web client simulation tools have been utilized to further this aim. While applying machine learning (ML) methods for anomaly detection in requests is prevalent, predicting patterns in web datasets is still a complex task. Prior approaches incorporating elements such as URLs, content from web pages, and auxiliary features have not provided any satisfying results. Moreover, such methods have not significantly improved the understanding of client behavior and the variety of request types. To overcome these shortcomings, this study introduces an incremental approach to request categorization. This research involves an in-depth examination of various established classification techniques, assessing their performance on a selected dataset to determine the most effective model for classification tasks. The utilized dataset comprises 8 million distinct records, each defined by performance metrics. Upon conducting meticulous training and testing of multiple algorithms from the CART family, Extreme Gradient Boosting was deemed to be the best-performing model for classification tasks. This model outperforms prediction accuracy, even for unrecognized requests, reaching a remarkable accuracy of 97% across diverse datasets. These results underline the exceptional performance of Extreme Gradient Boosting against other ML techniques, providing substantial insights for efficient request categorization in web-based systems.

1. Introduction

The deployment of a log collection mechanism is an indispensable tool for software developers and IT system administrators. This tool is primarily used for error detection or system failure analysis during the operation of an application or system. Also, logs can serve as a performance analysis resource. The process of implementing a log event mechanism begins by identifying the events to be recorded and the purpose for doing so. The appropriate logging tool or library is then selected, or a custom solution is developed based on the initial specifications. During the creation of the logging mechanism, performance-related considerations such as the log detail level, time interval, log location, and log rotation need to be taken into account [1]. After implementing the event logging mechanism, it is essential to test its operation and, if necessary, introduce modifications to ensure optimal effectiveness and efficiency in system monitoring.
The objective of this article is to analyze the operation of a web application—a stock market system—based on its logs. These logs are generated during the operation of a benchmark that tests the hardware architecture on which the application has been deployed. The exploratory data analysis (EDA), which allows understanding the characteristics of the data through their visualization and statistical analysis, has been presented in [2]. In this article, machine learning (ML) techniques are utilized for information extraction. Data analysis and machine learning are crucial in log examinations, as they enable the efficient processing of massive amounts of data recorded by the event logging mechanism. Classifiers for ML were created to predict user behavior (the URL being viewed) based on the collected logs. The article analyzes the operation of the system on two different hardware configurations and proposes a set of methods designed for log analysis and user classification. Jupyter Notebook scripts in Python were used, employing libraries, such as NumPy, Pandas, Scikit-learn, Matplotlib, Seaborn, and Mlxtend. This research examines if the quality of produced logs is influenced by the way the logging system is implemented and the underlying system architecture that produces the logs. The areas covered in this paper are:
  • Developing operational scenarios for the stock market software client.
  • Collecting logs from the reference benchmark.
  • Evaluating the accuracy of the stock market simulations.
  • Diving into data analysis [2].
  • Contrasting the employed classification techniques and studying their efficacy.
The core aim of this paper is to delve into the workings of a web-based stock market platform and forecast the actions performed by participants (represented by the variable e n d p o i n t U r l ) through the examination of the performance metrics recorded in the logs from every system module. Such logs are procured during the operation of a benchmark designed to evaluate the hardware framework on which the application runs. Moreover, the study endeavored to assess how effective the classification techniques are when data from the mentioned categories are amalgamated into a collective cluster, labeled as a l l G r o u p . The results of this investigation will pinpoint the most suitable classification approach for the data generated by the stock market platform throughout its simulation using the designated benchmark. Key metrics such as the training duration for the classifier, the Root Mean Square Error (RMSE), and the determined precision were considered. An additional aspect explored was the effect of increasing the size of the training dataset on predicting stock market action procedures. In the course of this research, the authors aspired to address existing knowledge voids pertaining to the efficacy of machine learning classifiers across diverse user interaction patterns and server demands.
This article is divided into five sections. Section 2 provides a literature review. Section 3 contains a brief description of the experimental environment and the conducted real-system simulations. Section 4 gives the description of the proposed log analysis methods. Section 5 discusses the practical application of the methods analysis of the prepared logs and the results of the conducted research. Section 6 provides a summary of the work.

2. Related Work

The field of user behavior recognition and web log dataset analysis is abundant with previous research and methodologies, forming a solid foundation on which this study is built. The utilization of log files for understanding system behavior and detecting anomalies in user behavior has been a recurring theme in research and has been extensively studied over the years. This robust tradition of log dataset analysis, machine learning techniques, and user behavior recognition methodologies have guided several pivotal works [3,4,5], setting the stage for the investigation conducted in this paper. The paper by [6] presents a comprehensive study on the role and analysis of system logs in modern software systems. It outlines how these logs, though unstructured, are crucial for tasks, like anomaly analysis, intrusion detection, and situational awareness. Due to the complexities of today’s software systems and the immense volume of data, automated log analysis, achieved through log parsing and feature extraction, is now favored over manual processes, enabling higher efficiency and accuracy. Software system logs, which record software operation information, are vital for system reliability assurance tasks. They are used in various services, including intrusion detection, digital forensics, and situational awareness. Compared to network data packets, system logs capture more critical information, like memory and CPU data. Researchers use this log information to enhance intrusion detection based on network data packets. The review work [6] presents today’s network services that are deeply interconnected, and any downtime could have cascading effects.
The extensive body of research in the realm of user behavior recognition and web log dataset analysis incorporates various methods and techniques. A significant portion of the article [7] has focused on leveraging log files to understand system behavior, as well as recognizing user behavior and identifying anomalies through log data. The authors extract navigational patterns using data mining techniques. However, the application of machine learning methodologies for user request categorization remains unexplored in their research. Hochenbaum et al. [8] use machine learning methodologies in their notable study on log data analysis, with a particular focus on log anomaly detection. This approach of using machine learning for anomaly detection is expanded on by Chandola et al., who offer a comprehensive survey of various machine learning-based anomaly detection techniques [9]. Several works have discussed the process of log parsing and feature extraction, essential steps in transforming semi-structured log data into structured statements. The subsequent application of machine learning and deep learning methods allows for anomaly detection [6]. We have found approaches [10] to detecting anomalies in stream data, outperforming other state-of-the-art unsupervised and semi-supervised detectors, making it particularly applicable in settings with stringent memory limitations. Some authors integrate the Apriori association rule algorithm with web application development technology to enhance the college sports data information management system. It introduces a novel log mining technology that excels in system performance enhancement and understanding user behavior.
Regarding classification techniques in log data analysis, Kotsiantis et al. [11] offer significant insights, evaluating the performance of established classification models on large datasets. This area of research presents a formidable challenge, as illustrated by Akoglu et al., whose pioneering work in anomaly detection in graphs is [12]. Chen and Guestrin further explore classification techniques [13], particularly for ML tasks. Their findings underscore the importance of this ML technique due to its exceptional performance. Srivastava et al. [14] address the challenge of predicting patterns and classifying requests based on web data. Using data mining techniques, they identify user behavior and patterns from weblogs, albeit without employing ML techniques. Meanwhile, Piszko et al. [2] perform an in-depth exploratory data analysis of a benchmark application log dataset, focusing on a stock market web application using statistical methods and data visualization techniques. In the same way, Meng et al. [15] evaluate the efficiency of different ML classifiers in predicting user behavior based on weblogs, utilizing datasets similar to our study.
Further studies extend beyond log analysis and user behavior. They delve into broader data mining, knowledge discovery in databases, and the application of advanced data mining techniques, such as the pincer-search-based approach, for an in-depth understanding of consumer behavior [3,5]. Some studies explore different aspects of data management and processing, such as the development of a new data portal architecture to facilitate the processing and interaction with large datasets [16]. Others employ data mining techniques to expedite the selection process for scholarship recipients using clustering and classification algorithms [17]. Moreover, containerization in web systems [18], an emerging area of interest, has seen studies like that of Bernstein, which emphasizes the need for effective analytical methods for efficiency and cost reduction. However, such works often overlook the importance of log data analysis and user behavior recognition [19]. The rapid adoption of container systems in modern computing environments has necessitated the development of robust performance models tailored to these architectures. In container-based web systems, the challenge of accurately predicting system performance has been a focal point of research. The study [20] introduces a novel method that employs queueing Petri nets to model the performance of containerized web systems, a significant advancement in performance engineering for containerized environments.
Web mining is categorized into three types [21,22]: web content mining (extracting information from web page content), web structure mining (analyzing links between web pages), and web usage mining (analyzing user behavior). This article emphasizes the benefits of data and web mining. This paper also touches upon customer preferences, the importance of data preprocessing, the role of pattern recognition, and the intricacies of web mining. In conclusion, while previous works have significantly contributed to understanding system behavior and user recognition through log files, the particular combination of methodologies this current study proposes to fill other gaps in the literature. This includes the application of ML techniques for log analysis and an in-depth examination of various classification techniques for effective user behavior recognition. Our approach aims for high accuracy in unrecognized requests, an aspect often overlooked in prior studies. Therefore, this research seeks to augment the existing knowledge and pave the way for further advances in the field.

3. Experimental Environment

The experimental environment of the OSTS stock exchange system, discussed in [2], was used to obtain the system logs. It consists of two applications: a scalable stock exchange application ( A P P 1 ) and an application generating traffic on the stock exchange—an automatic client ( A P P 2 ). Communication between them is conducted through the RabbitMQ message broker—each request of the automatic client (traffic generator ( A P P 2 )) goes to a separate queue, waiting to be processed by the stock exchange’s transaction algorithm ( A P P 1 ).

3.1. OSTS

Legacy applications, built on a unified architecture, assume a single application and database structure with low latency. Various technologies aim to transform monolithic legacy applications into cloud-based solutions. There have been proposals to automate the transition from a monolith to microservices; these often focus on code-level or database-level refactoring [23].
The stock exchange application ( A P P 1 —a container-based web system in the cloud) is based on the operating principles of IBM’s open-source DayTrader application. It is a benchmark that operates on the basis of the Online Stock Trading System. It allows users to log in, review their portfolios, search for stock quotes, and buy and sell shares. Using A P P 2 based on the web network, an actual load could be used to measure and compare the performance of application servers. The traffic-generating application ( A P P 2 ) simulates user behavior and makes requests to the web API ( A P P 1 ). During the experiments, we obtained measurements of the response times of individual queries and resource usage. All these events were recorded in databases (of both applications) and, at the end of the simulation, saved in the form of logs (converted to CSV format). The types of queries generated by A P P 2 are discussed in detail in [2]:
  • d o - r e g i s t e r —user registration in the system;
  • a d d - s e l l - o f f e r —adding a share sale offer by the user;
  • a d d - b u y - o f f e r —adding an offer to buy a specific share by the user;
  • g e t - s t o c k - d a t a —displaying the detail page of the desired share;
  • g e t - s t o c k - u s e r s - a n d - c o m p a n i e s —displaying a page with shares of given companies.
The types of queries a player uses in the stock exchange depend on the strategy they adopt for playing in the stock exchange (Table 1). Strategies A 1 and A 2 use all available queries for the player (except for the reserved add-company), while A 3 only checks their portfolio.
All of the above-described elements of the stock exchange system are containerized using Docker (version 20.10.6, build 370c289), a system-level virtualization software. The Docker Swarm tool ensures the scalability of the stock exchange application. This enables multiple stock exchange nodes, for example, to balance the load in the system.

3.2. Conducted System Simulations

In order to obtain data to analyze the functioning of the operating stock exchange application, a series of simulations (scenarios) were conducted on the benchmark platform. The scenarios were grouped into four characteristic groups studying different features:
  • A group studying the impact of the number of R replicas of the exchange ( r e p l G r o u p ).
  • A group studying the impact of the time between the execution of the transactions ( t r a n s G r o u p ).
  • A group studying the impact of the time between the player requests ( r e q G r o u p ).
  • A group studying the impact of the tactics applied by the players ( a l g G r o u p ).
In the r e p l G r o u p , the operation of the system in the case of increasing and decreasing the number of containers (R) of the stock exchange application (Docker Swarm) was considered. In reality, there are situations where this parameter changes (container failure or scaling of the architecture). In the t r a n s G r o u p , the transaction algorithm was examined, specifically its t T parameter, which determines the delay in between the execution of the transaction offers (pairing buy-and-sell share offers). Changing the time window for transaction execution can be useful during increased traffic on the stock exchange. The next group studied was r e q G r o u p . The analysis in this group focused on the performance capabilities of the architecture by changing the t R delays of user-generated queries. The stock exchange system, of course, does not have the same traffic all the time, so different t R times were taken into account. The last group studied was the a l g G r o u p , in which the different types of game algorithms ( A 1 , A 2 , and A 3 ) used by the players were tested on the same hardware configuration. This group, therefore, describes different actions taken by users during the simulation, making it practical and its log set usable in a real system (as a training set for classifiers). The set of all the groups was named a l l G r o u p and was also considered in the analysis. The impact of the physical factor, i.e., the performance of the server on which the application under test will be run, was also taken into account. The simulations were performed on two different servers with different architectures. The first server had 8 processors and 20 GB ( S 1 ) of RAM, while the second had 12 processors and 30 GB of memory ( S 2 ). Each of the eighteen simulation scenarios presented in Table 2 were also performed for different time ranges: t = {3600, 10800, 21320, 32400, 43200} (s).

4. Examination of Web Application Logs

This section presents the kinds of logs and also the prepared ML tools. The dataset will be based on performance logs (generated by A P P 1 and A P P 2 ).

4.1. Types of Logs

There are various types of logs based on their different scopes of operation, but the principle of operation is common—they are used to report and record events along with timestamps. Server logs record events related to server operation, such as client requests or server errors. In the context of an HTTP server, they contain information about who visited our site (IP address) and what resources (URL addresses) were visited at a given moment. The user-agent is recorded as well—a header identifying the client’s browser and system. Application logs have all the application’s actions recorded in them, such as errors, exceptions, or events related to user handling or processes called by the application. Their main application is to point out the source of the problem in the case of encountering potential errors with the operation of the application. System logs record all events related to the operation of the operating system, such as starting and closing the system, installing and removing packages, changes in configuration files, etc. They contain valuable information for system administrators in case the system is not working properly, e.g., unexpected device shutdown. Network logs are generated by network devices, such as routers, switches, or hardware firewalls. They record events related to network activity, such as network connections, data transfer, or successful network configuration. Security logs are usually a subset of system logs. They record events that could potentially be dangerous to network infrastructure, such as attempts to log into the system without appropriate permissions, network attacks, or attempts to access protected resources. The performance log can log request activities and their min/max/average response time and the number of requests for different time frames or resource loads (the CPU or memory utilization). In summary, monitoring based on log collection is implemented in many solutions that are important for IT designers. It allows for tracking and the analysis of the operation of IT systems, thanks to which we can identify and solve technical problems, monitor the performance of applications, and react to potential security threats through the logs collected. The most characteristic group among the above is application logs. The nature, format, and detail of the generated logs are entirely dependent on the programmers, who can appropriately adjust these features depending on the needs, requirements of the application, and environment in which it is deployed. The prevailing log formats are a text recording in the standard applicable to them: Common Log Format, W3C Extended Log, Syslog, JSON, XML, or CSV.
The stock market system ( A P P 1 ) during the simulation, initiated by the benchmark platform ( A P P 2 ), generates four performance logs in the CSV format (table data). These are the following, in order:
  • m e t h o d s . c s v —logs of the queries performed by the user, e.g., submitting an offer;
  • s t o c k . c s v —logs of the parameters of consumption of the stock exchange replica—the processor and RAM;
  • t r a d i n g . c s v —logs concerning the number of bids/asks submitted;
  • t r a f f i c . c s v —logs of the processor and RAM consumption on the traffic generator ( A P P 2 ).
Performance user query logs carry entries about the queries executed by users and the associated resource parameters (Table 3). The queries are generated by a load generator (APP2) based on previously set simulation parameters.
The exchange system is scalable, meaning the number of exchange application containers could be adjusted according to the performance capabilities of the architecture upon which the system operates. Performance replica logs contain information about hardware resource consumption from each predefined exchange application node at regular time intervals (Table 4).
During the operation of the exchange system, purchase and sale offers of shares are paired and processed by a transaction algorithm. This algorithm determines the feasibility of the transaction finalization in between players trading on the exchange. Also, the transaction algorithm generates performance logs during its operation (Table 5).
The final type of logs are traffic generator logs of performance, which contain information about the consumption of hardware resources registered on the traffic generator ( A P P 2 ). In contrast to the previous logs, the r e p l i c a I d parameter does not appear here as the traffic generator application operates on a single replica (Table 6).
The aforementioned logs, generated by the individual components ( A P P 1 and A P P 2 ), have been merged. The purpose of this operation is to facilitate further data analysis and to enable consideration of all features/attributes within the entire system. The only difference between them is that m e r g e d . c s v primarily uses the query log file ( m e t h o d s . c s v ), while m e r g e d 2 . c s v is based on the exchange replica logs ( s t o c k . c s v ). This aims to create two datasets of significantly different sizes (Table 7).
Logs contain a plethora of information, which aids in managing individual systems. Proper implementation of the logging mechanism and its analysis are not only beneficial for software developers but also for IT system administrators and regular users. According to a paper [24], there are four categories in which the implementation of a logging mechanism in a system will bring tangible benefits: performance, security, prediction, reporting, and profiling. For performance, log analysis might aid in system optimization or debugging when problems arise. Security is another advantage of implementing a logging mechanism. Logs store system security-related information, such as security breach event logs, network flows, user login sessions, etc. The analysis of such logs is based on previously prepared security templates or anomaly detection mechanisms. Predictive models based on generated logs forecast future trends. For example, predictive models developed based on available data can assist in automating or enhancing knowledge about load management, server resource delivery, or system configuration optimization. The final group considered is reporting and profiling. Data collected in system logs are grouped by certain characteristics. For example, websites visited by users in a local network could be divided into categories, thus allowing the profiling of user groups interested in a particular topic. Other applications of log analysis may include system resource profiling in terms of load.
Insights derived from the analysis of active IT system logs could significantly contribute to improving the system’s performance, security, and efficiency in event monitoring. Performance logs are used for the implementation of data feature/attribute classifiers (prediction).

4.2. Log Dataset Analysis

In this section, we present the proposed methods, including the operational methods and types of algorithms, as well as the approach to log analysis of the stock exchange system, which could also be applied in the analysis of logs from other web applications. The described issues include studies of ML techniques (supervised learning algorithms—classification). Before applying the above methods, it is recommended to use EDA to understand the characteristics of the logs, as presented in the article [2]. This study focuses on classification.
Data classification theory is a field that develops methods and algorithms for assigning objects to specific classes based on their attributes or features. A classification algorithm is a supervised learning technique used to identify the categories of new observations based on training data. The operation of classification involves using a model that has previously been trained (on a training set) to recognize patterns and relationships in data, in order to predict appropriate classes for new, unlabeled data. The output variable of classification is a category (class), which is a designation of a group to which a given observation belongs. In the case of prediction, where the output variable is a numerical value, not a category, we use supervised regression methods. A classifier that predicts only two possibilities is called binary, while one that considers a larger number of possible outcomes is called a multiclass classifier. The general process of data classification can be divided into several steps: data collection, data preparation, model selection, model training, model evaluation, and prediction.
There are many different types of classifiers used in data classification. Classifiers (classification algorithms) could be divided into two categories due to the nature of the model built: linear or nonlinear. Below are examples of algorithms from both of these categories: linear models (linear regression, logistic regression, and support vector machines (SVM)), and nonlinear models (naive Bayes classifier, k-nearest neighbors (KNN) algorithm, decision trees, and neural networks).
Algorithms based on decision trees are popular in the field of machine learning and data analysis. Decision trees generated as a result of the Classification and Regression Trees (CART) algorithms are graphical representations of a hierarchical decision structure. The structure of such a tree consists of nodes (vertices), branches, and leaves. Nodes conduct tests on the values of features/attributes; branches are the outcomes of a given node, e.g., yes/no (binary tree); and leaves represent the results of the classification. Decisions or tests in the decision tree are made based on attributes of a given dataset and feature values. The operation of the CART algorithm is as follows: feature selection, data division, tree construction by recursive data divisions, and ending the tree construction. The built decision tree, as a result of the described steps of the CART algorithm, can be used for the prediction of new data. If the problem we are solving is more complex, it is possible to increase the depth of the generated tree or to use other measures to examine the quality of divisions in the tree. Also, it is possible to modify the existing tree model by pruning branches that negatively affect the final model.
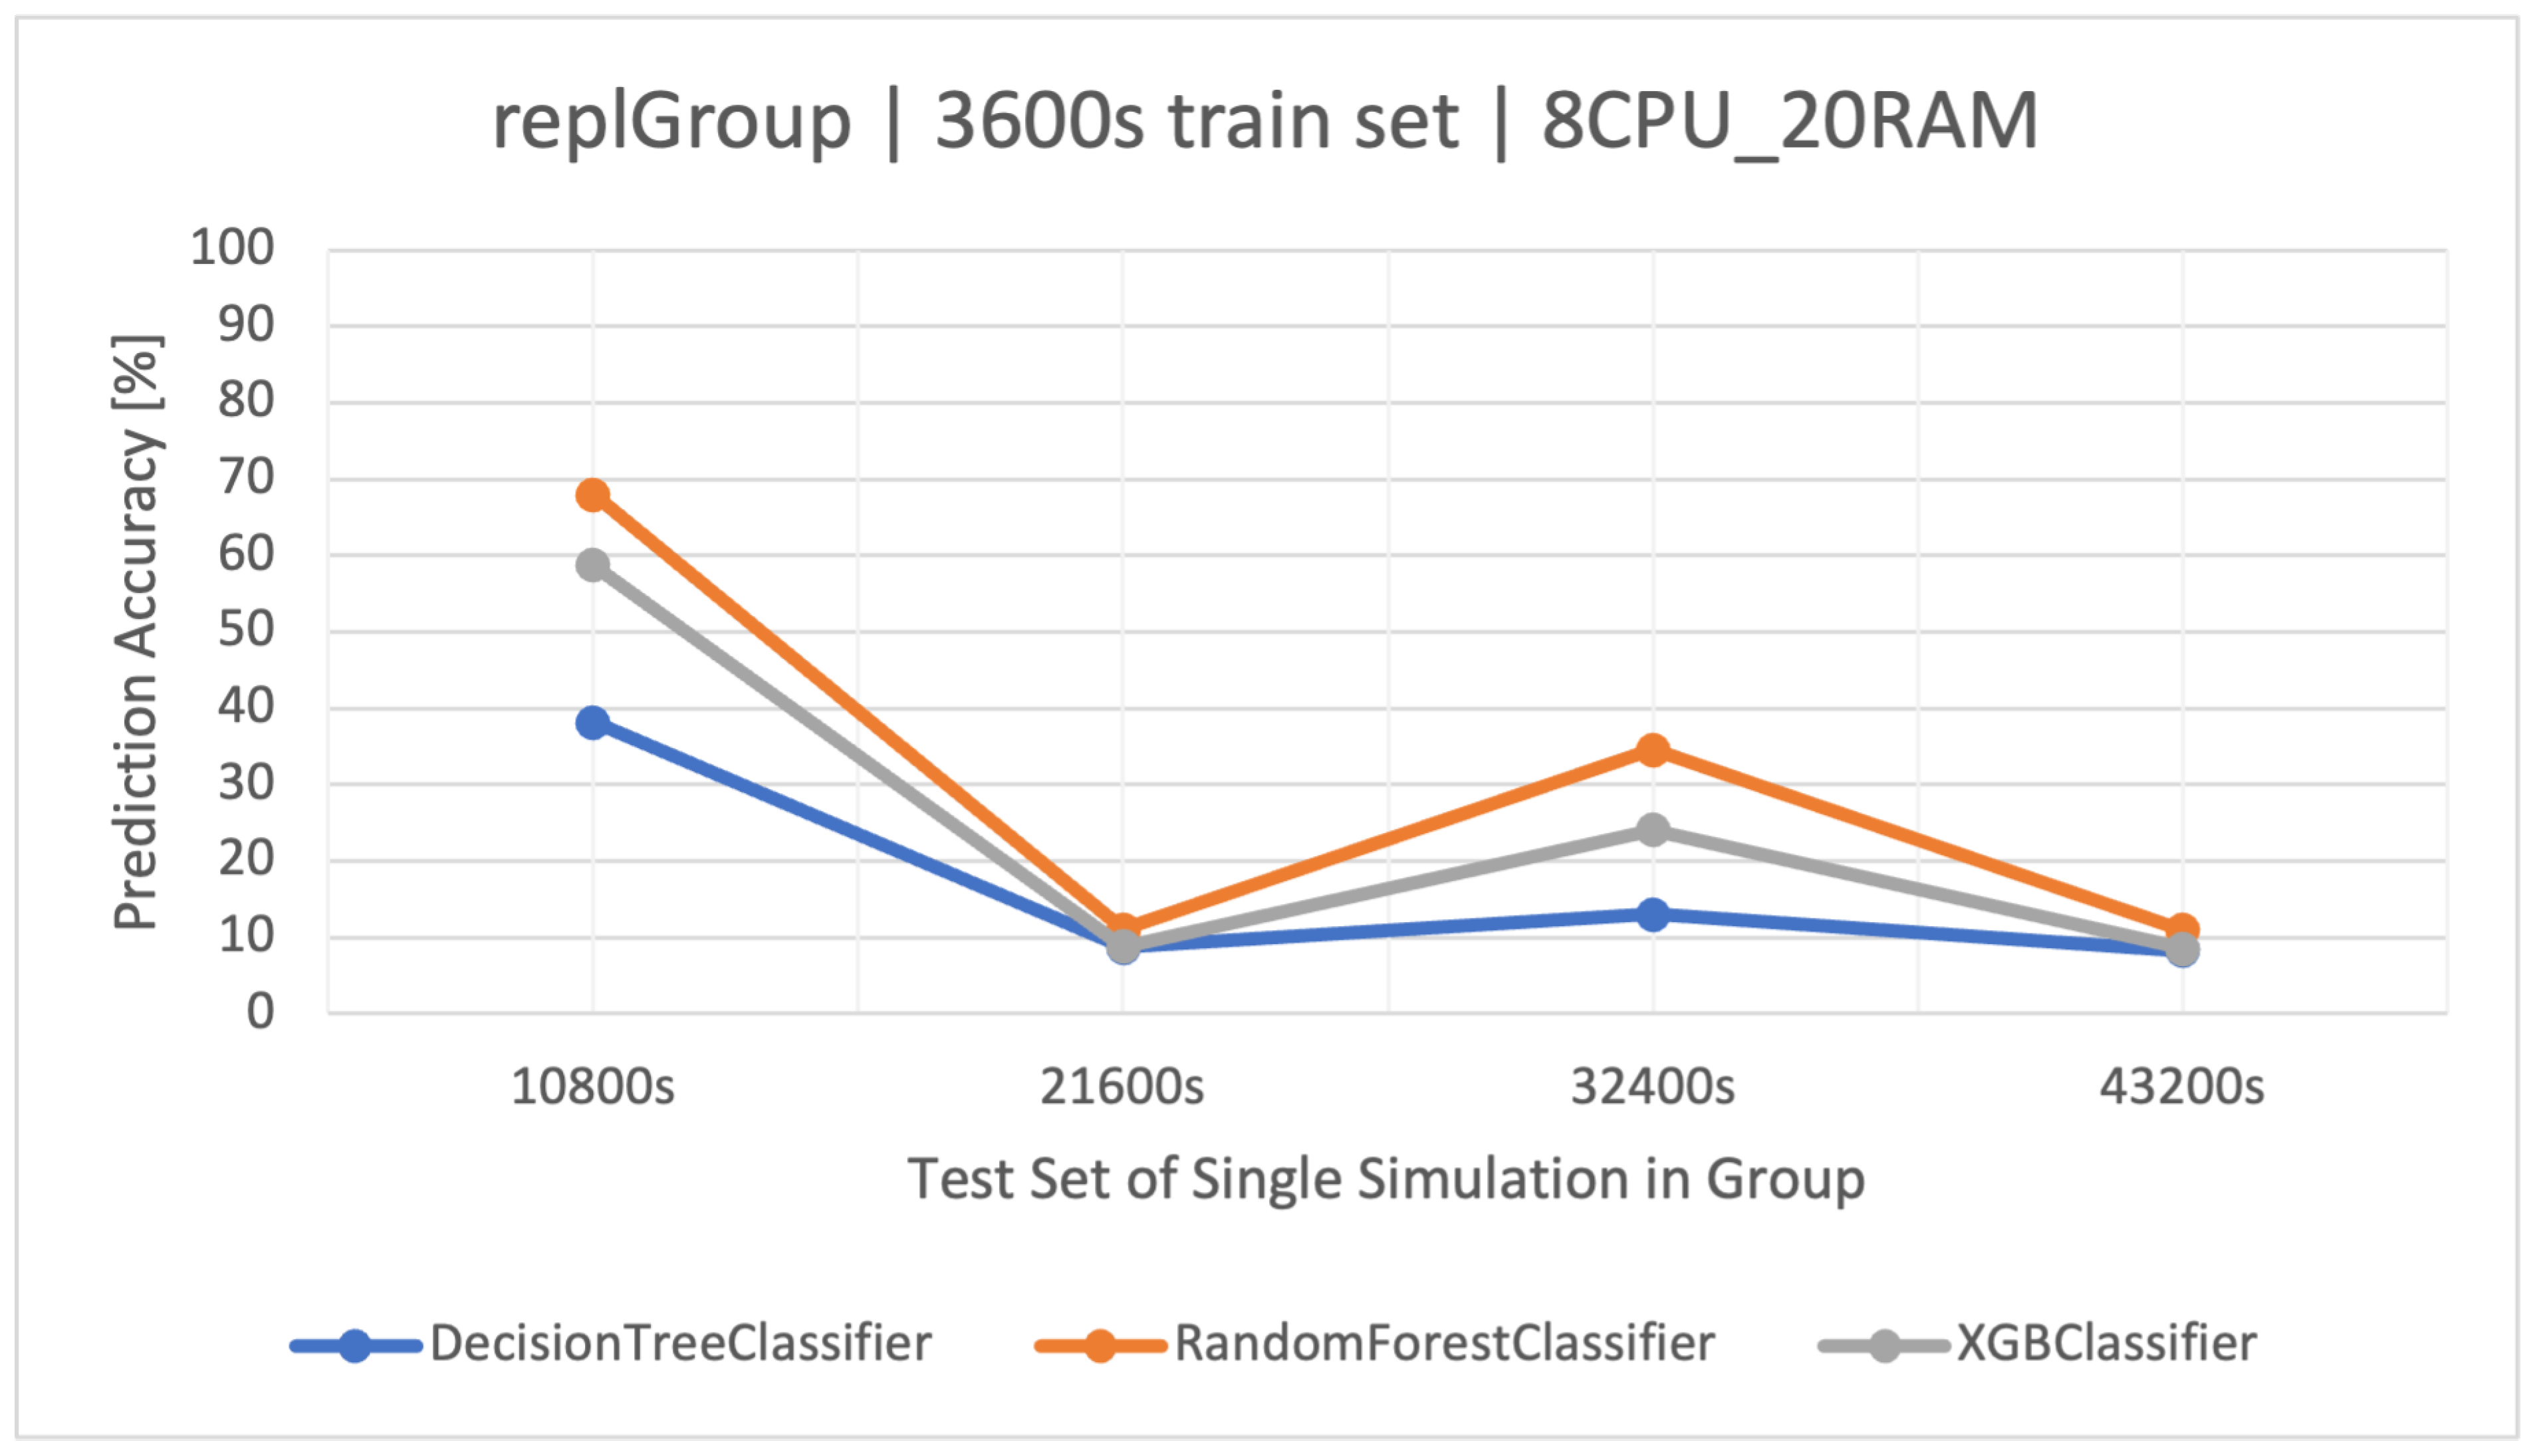
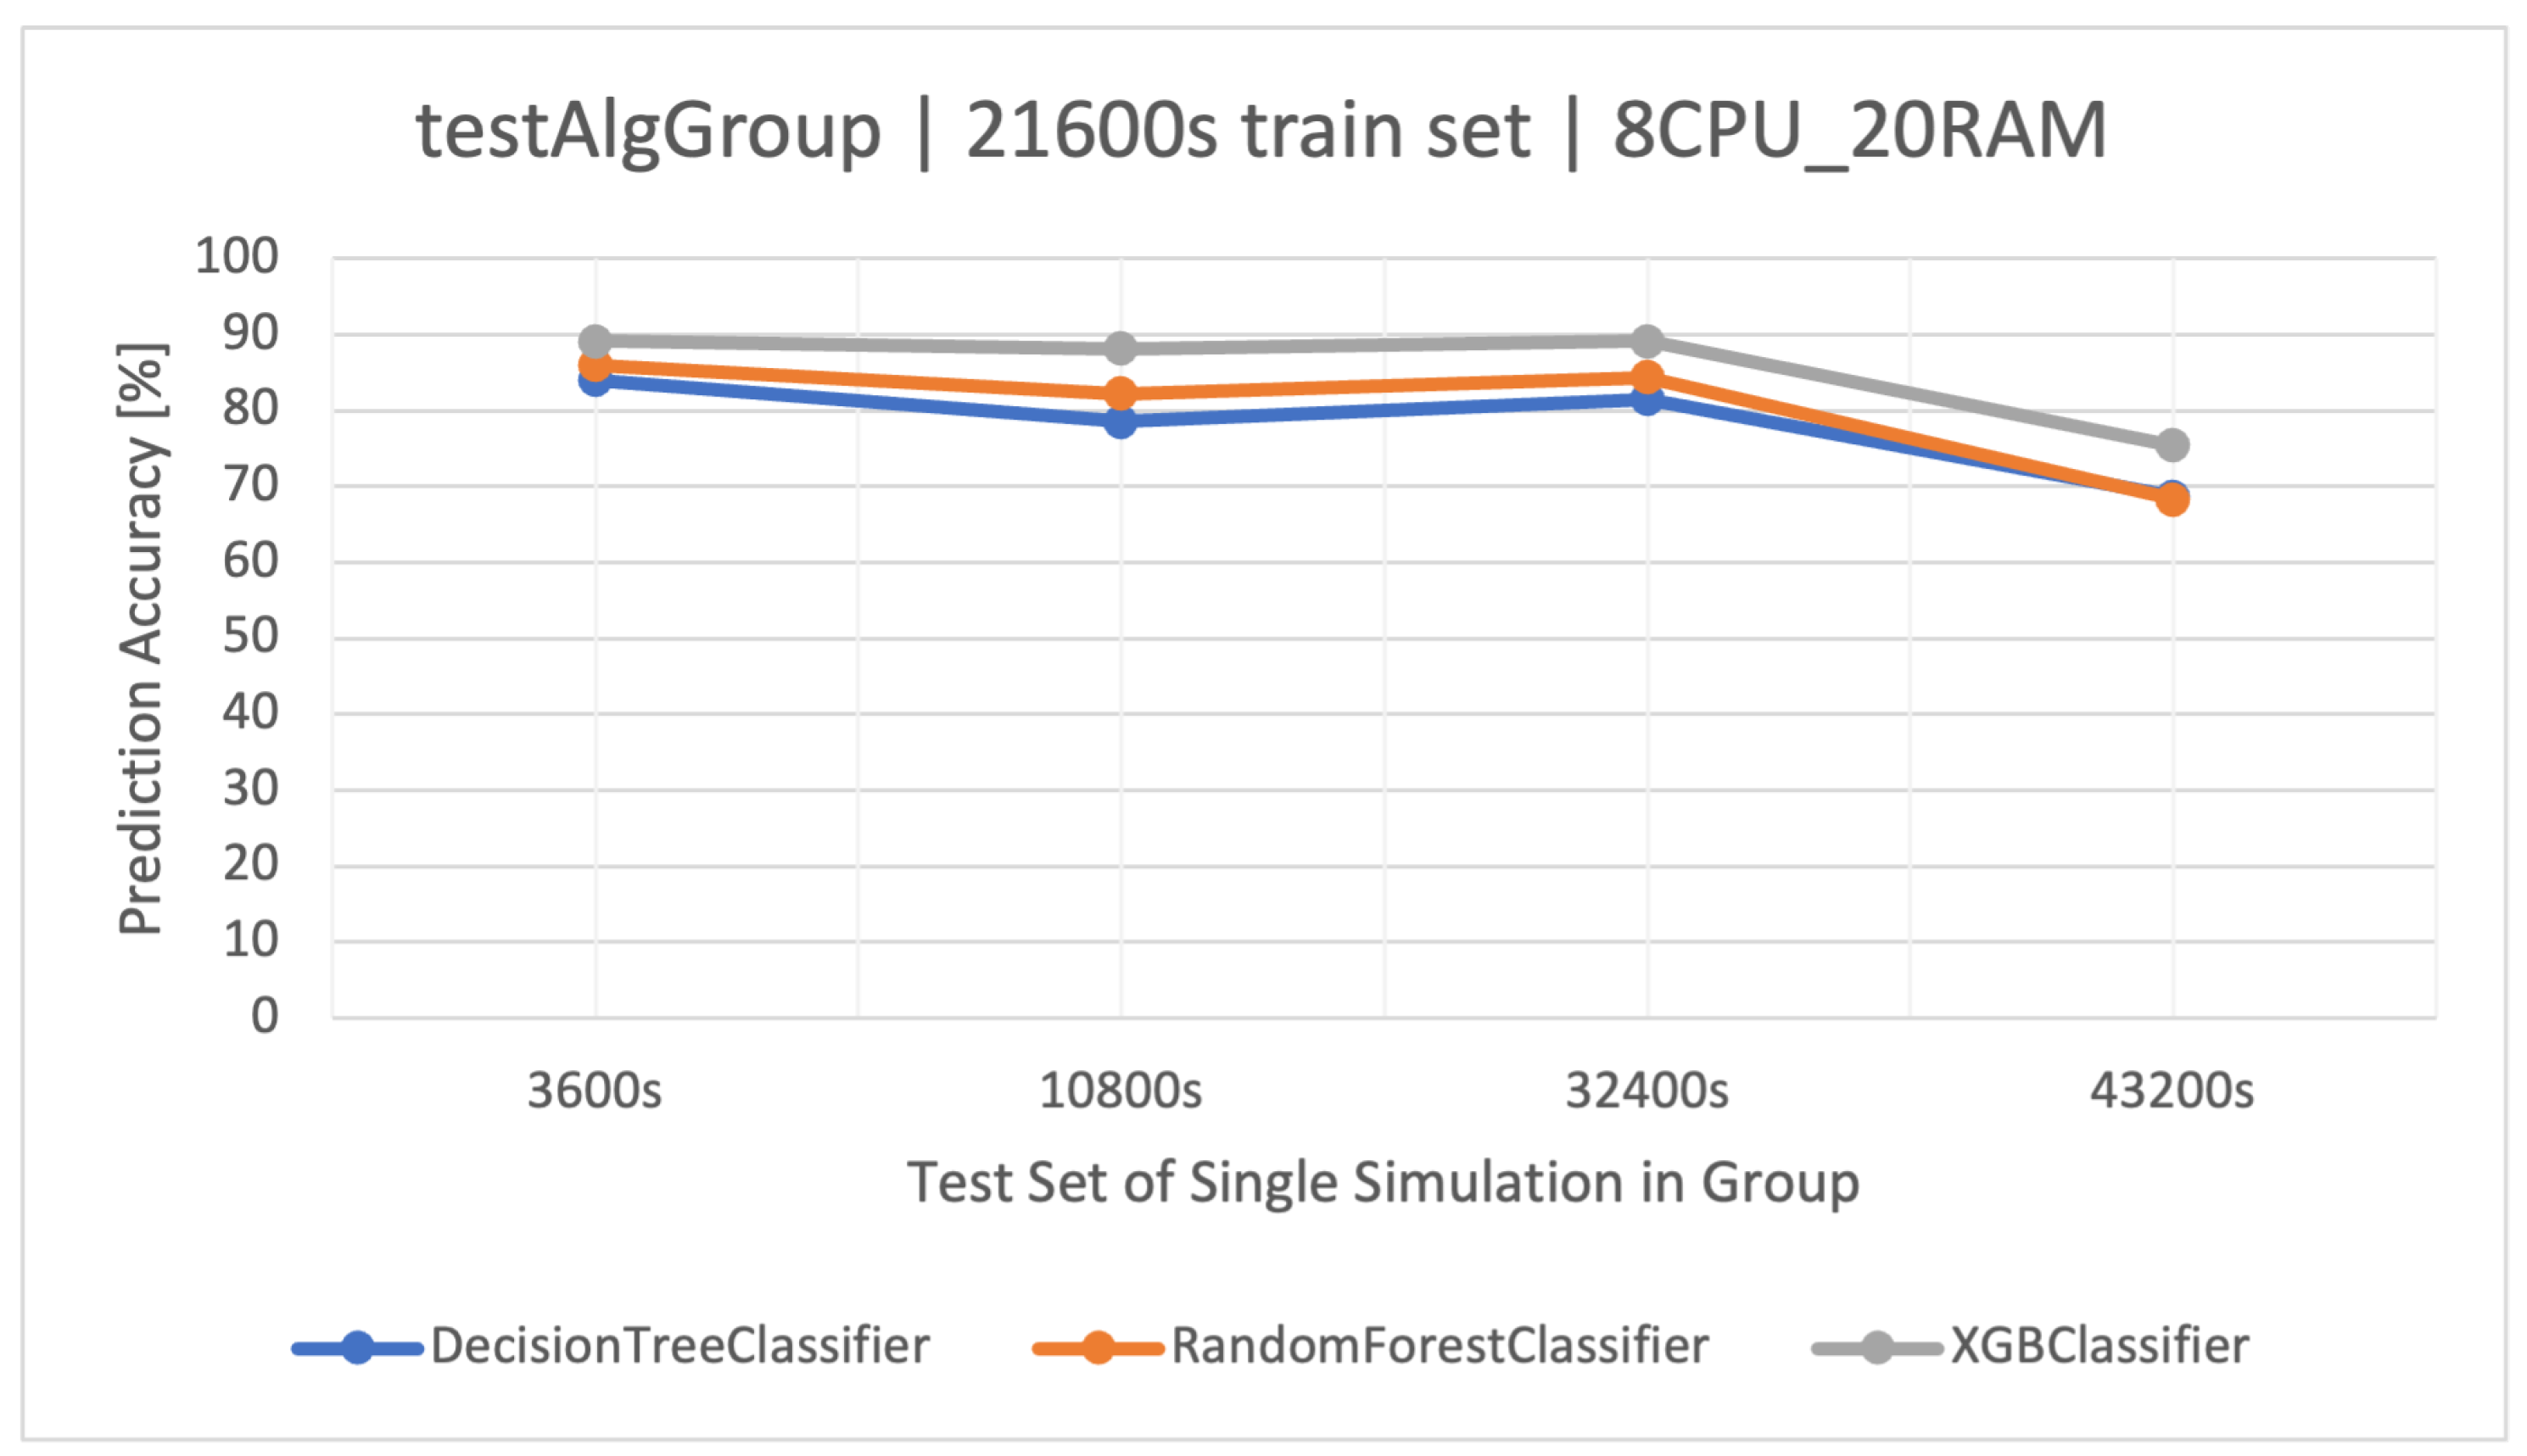
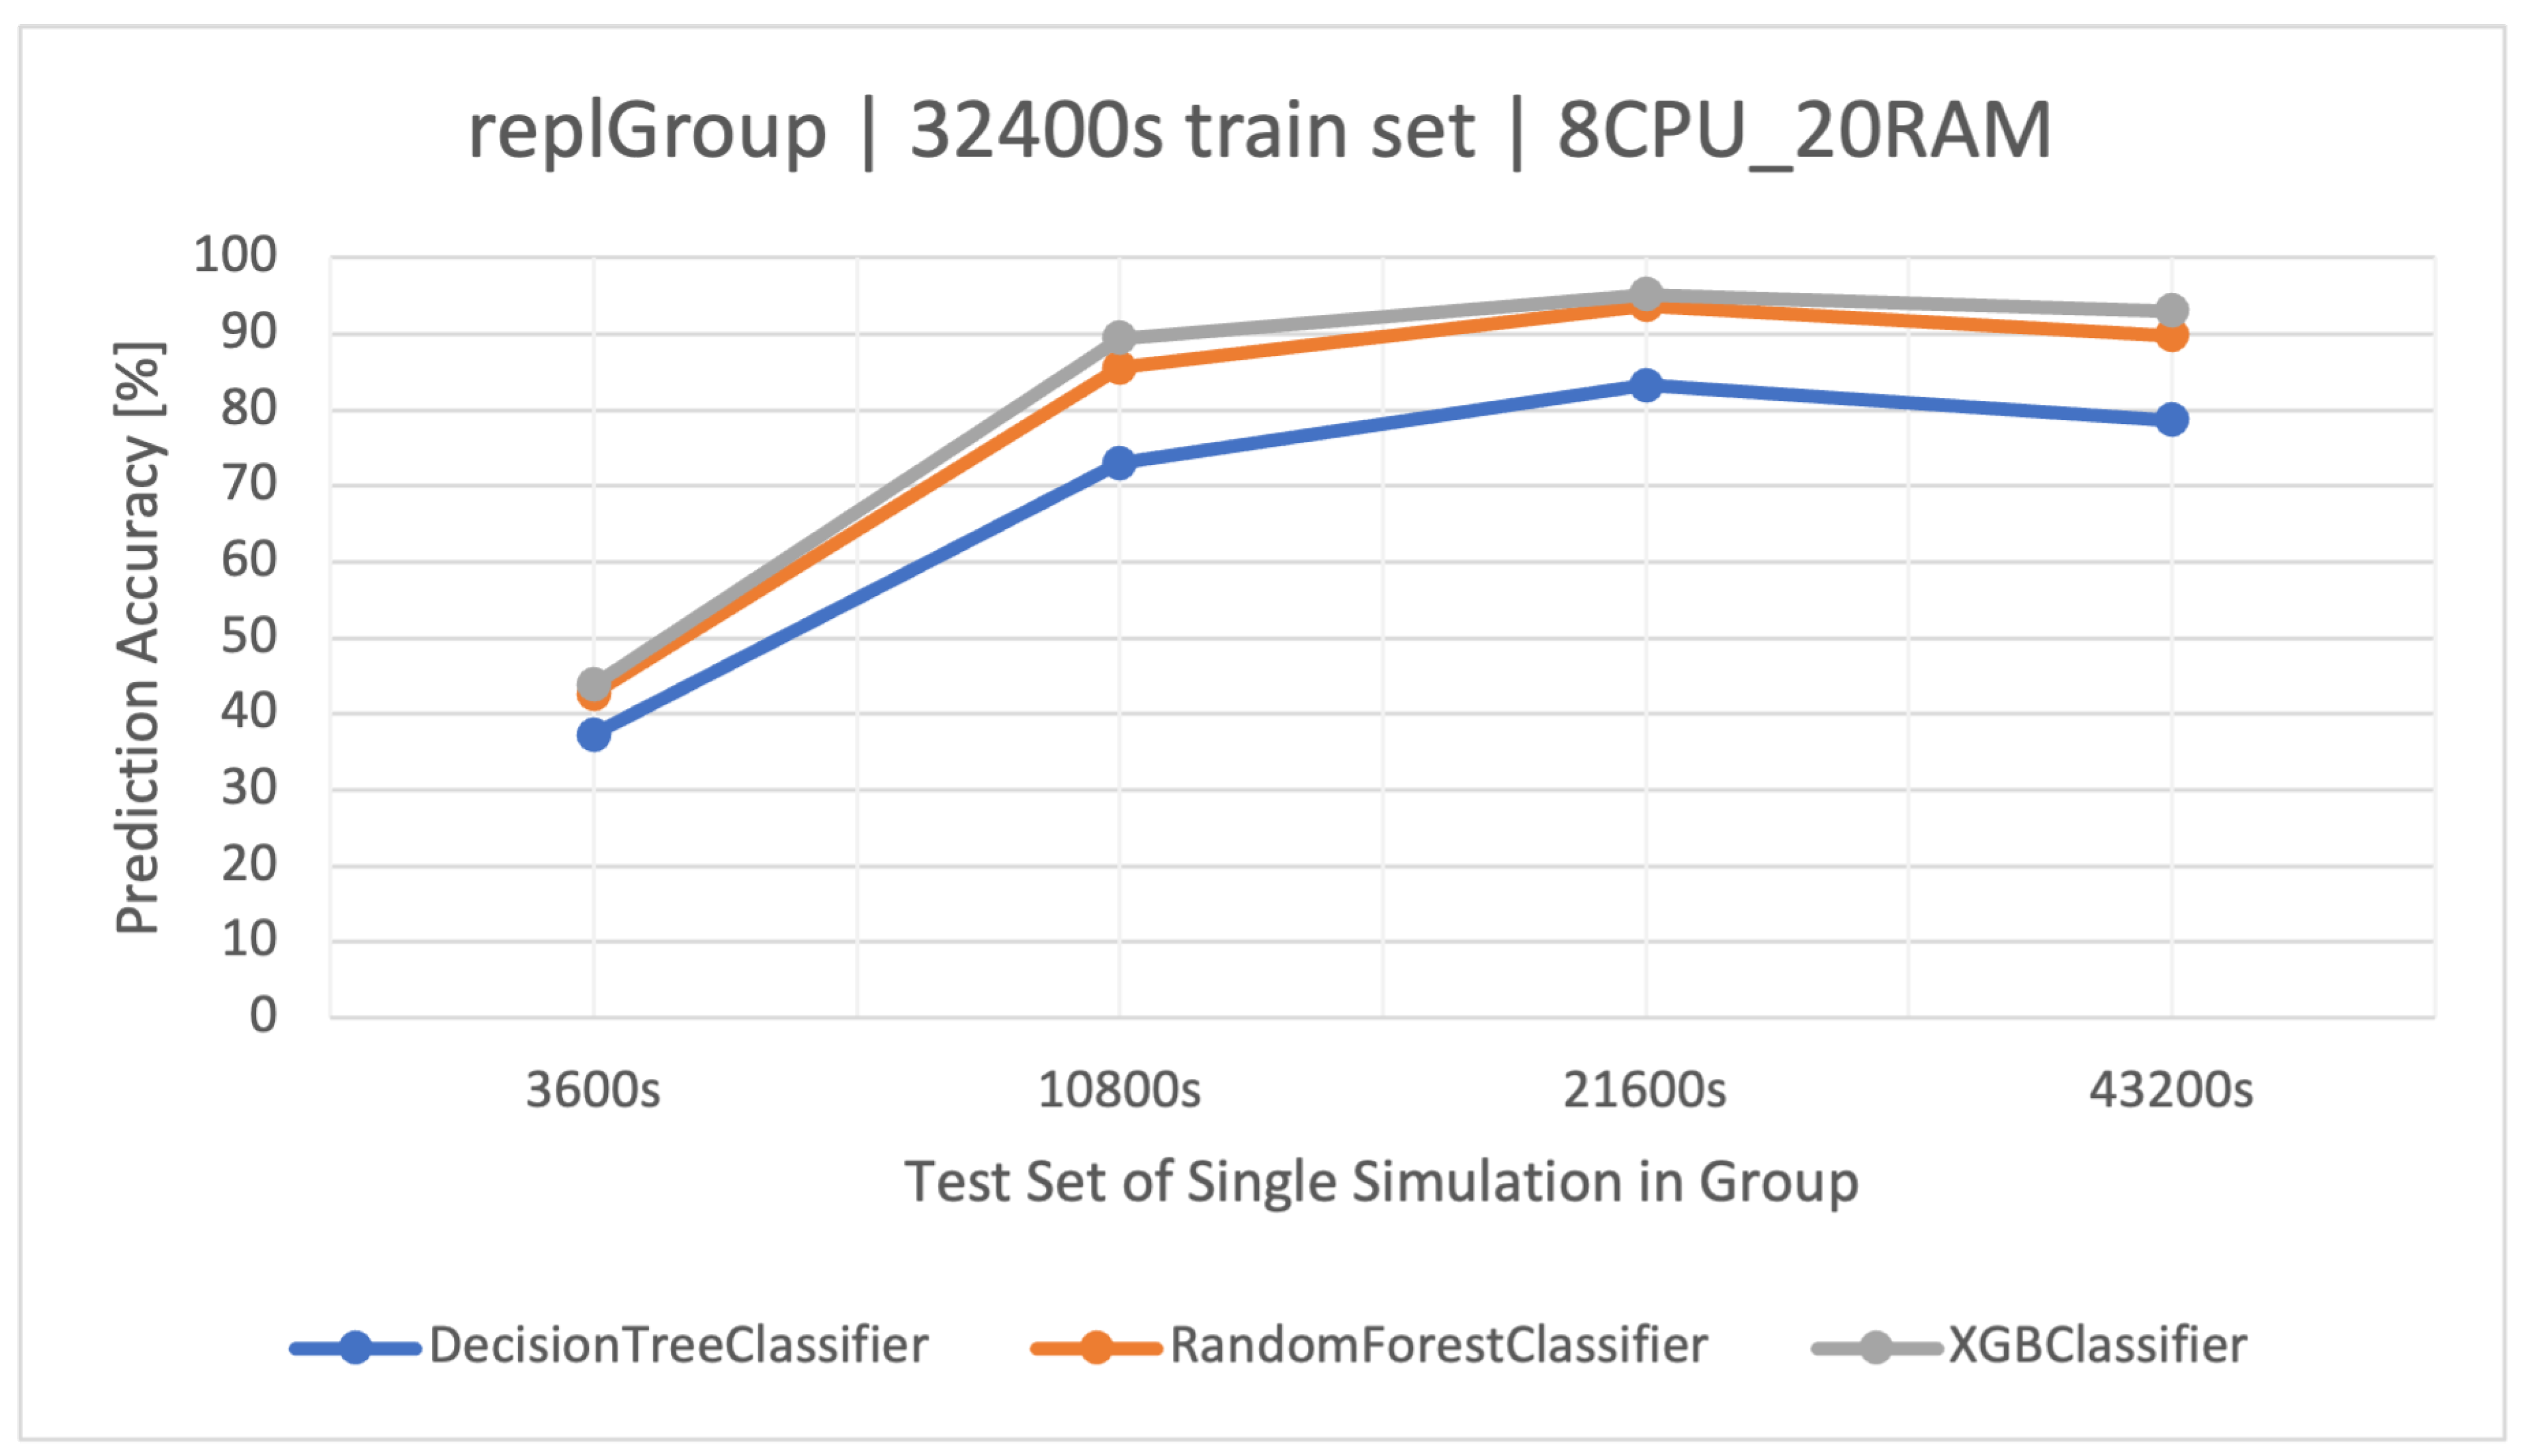
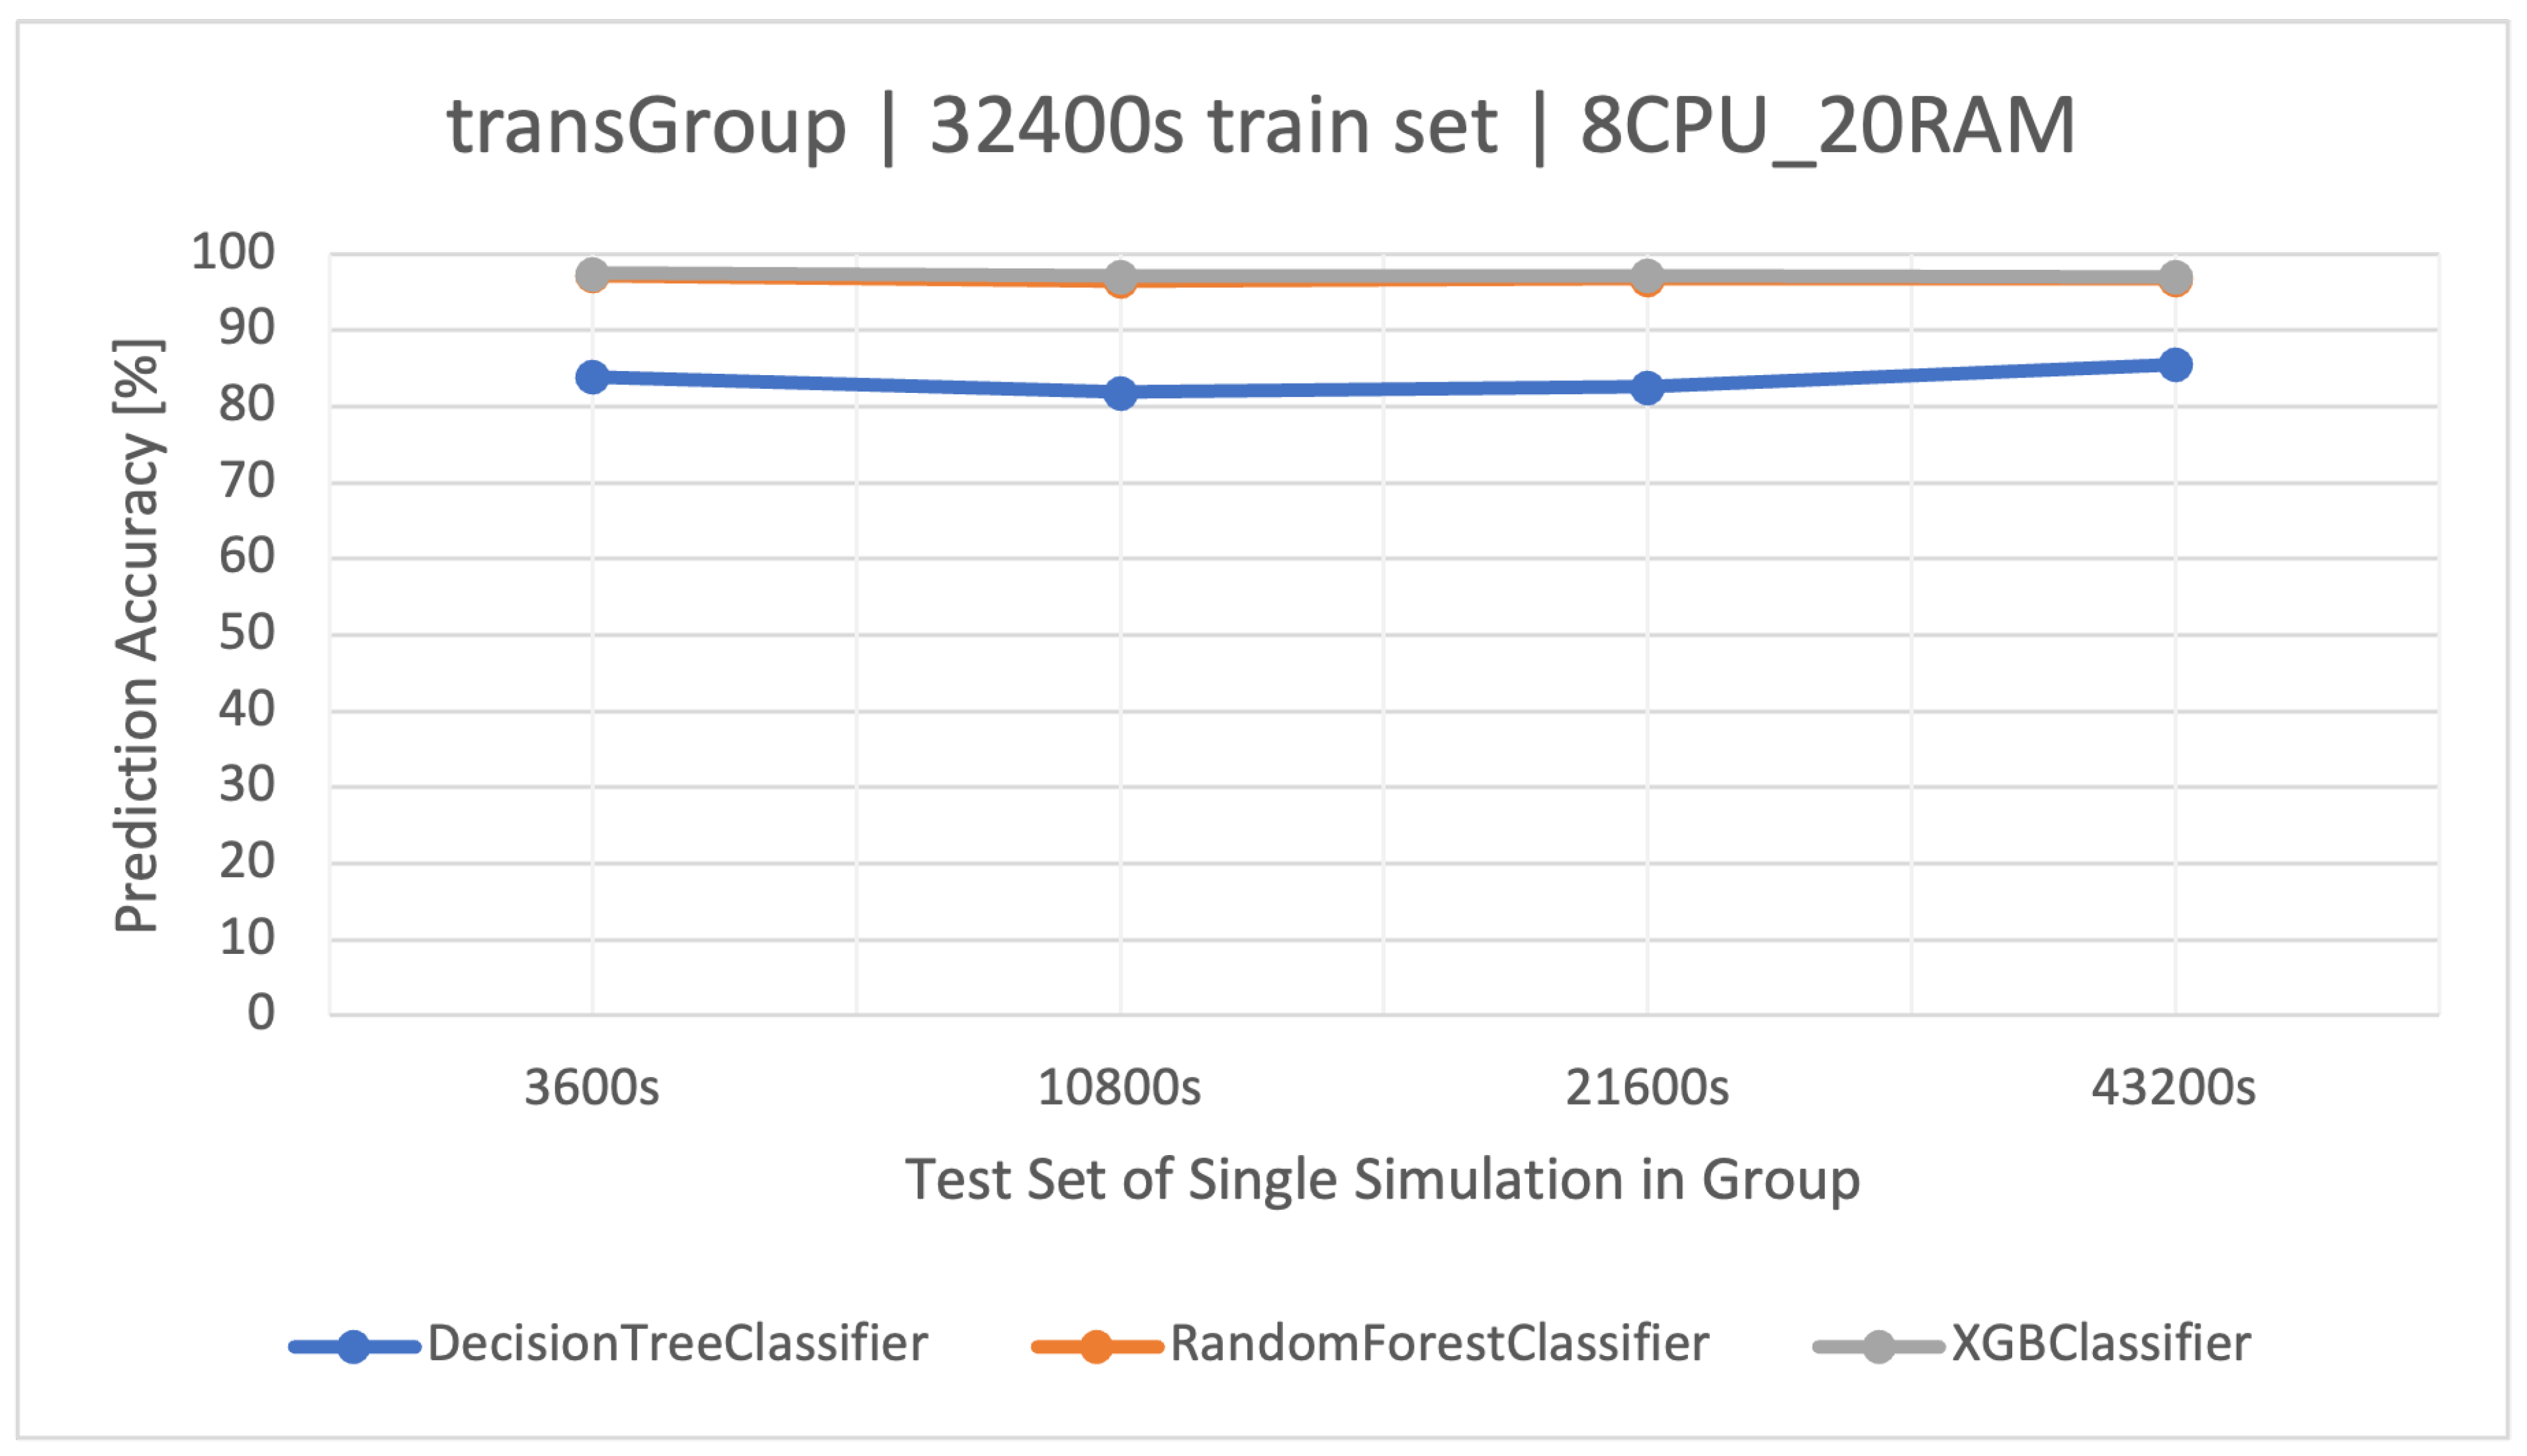
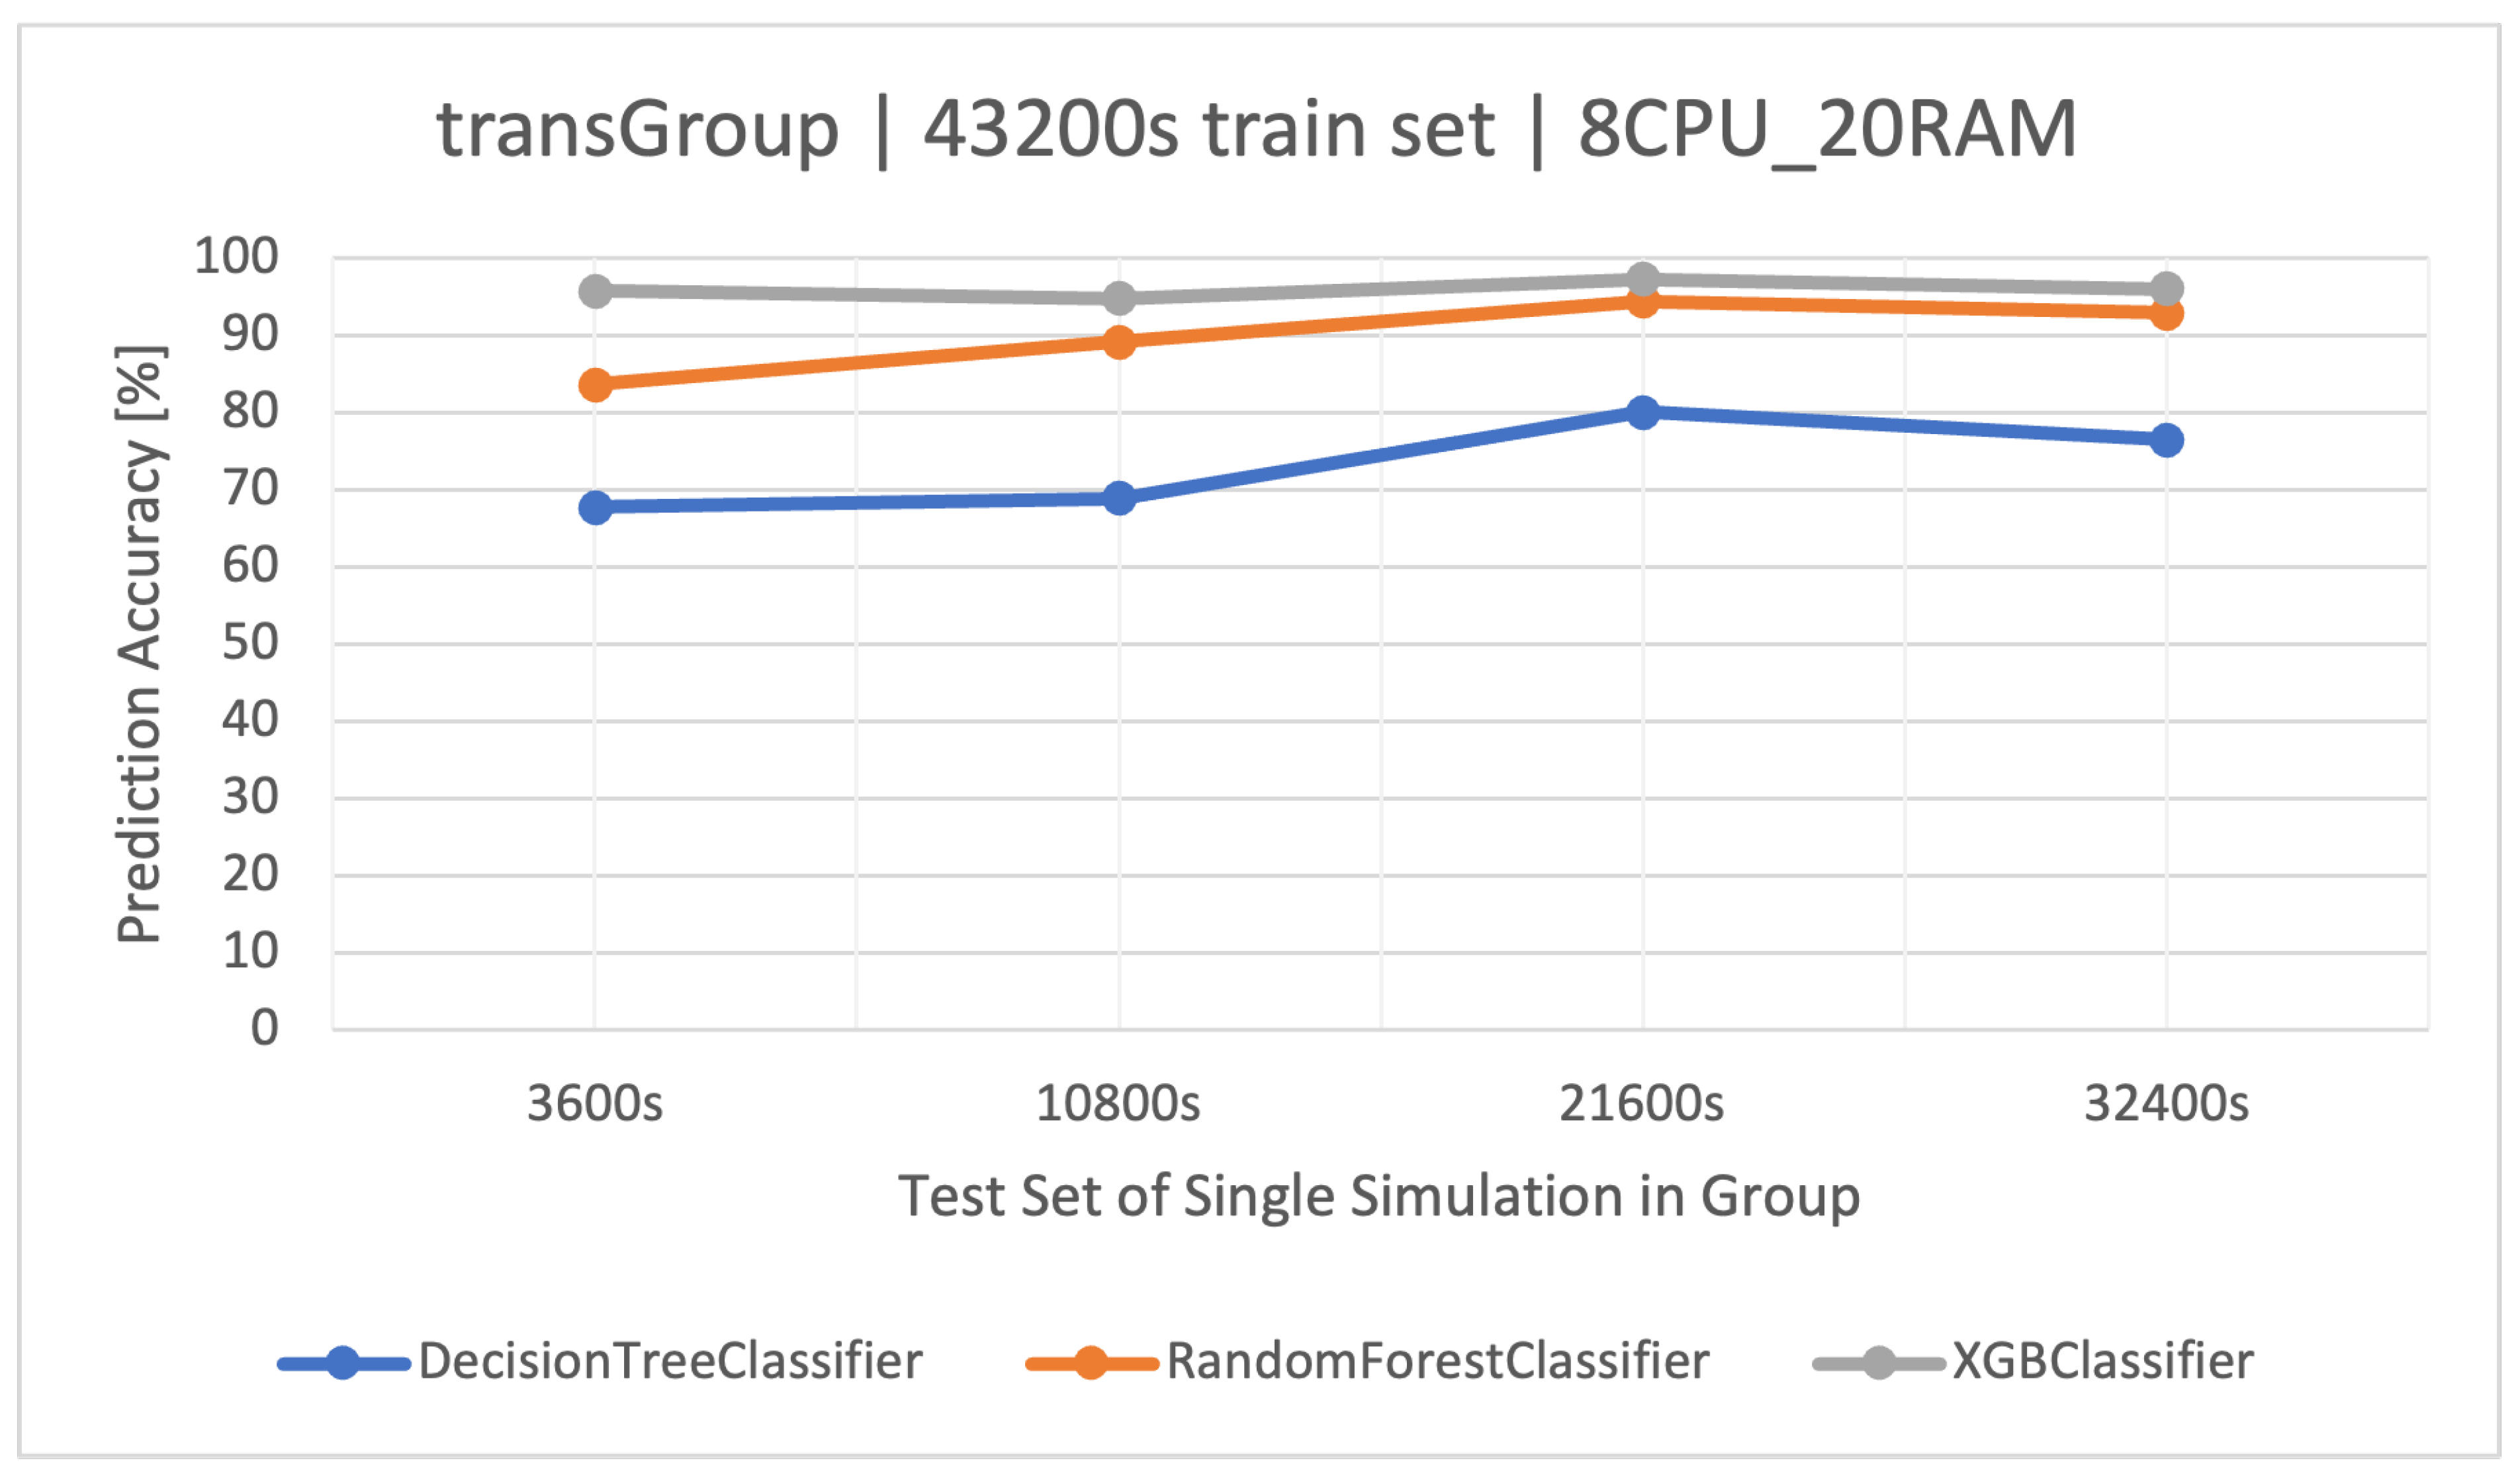
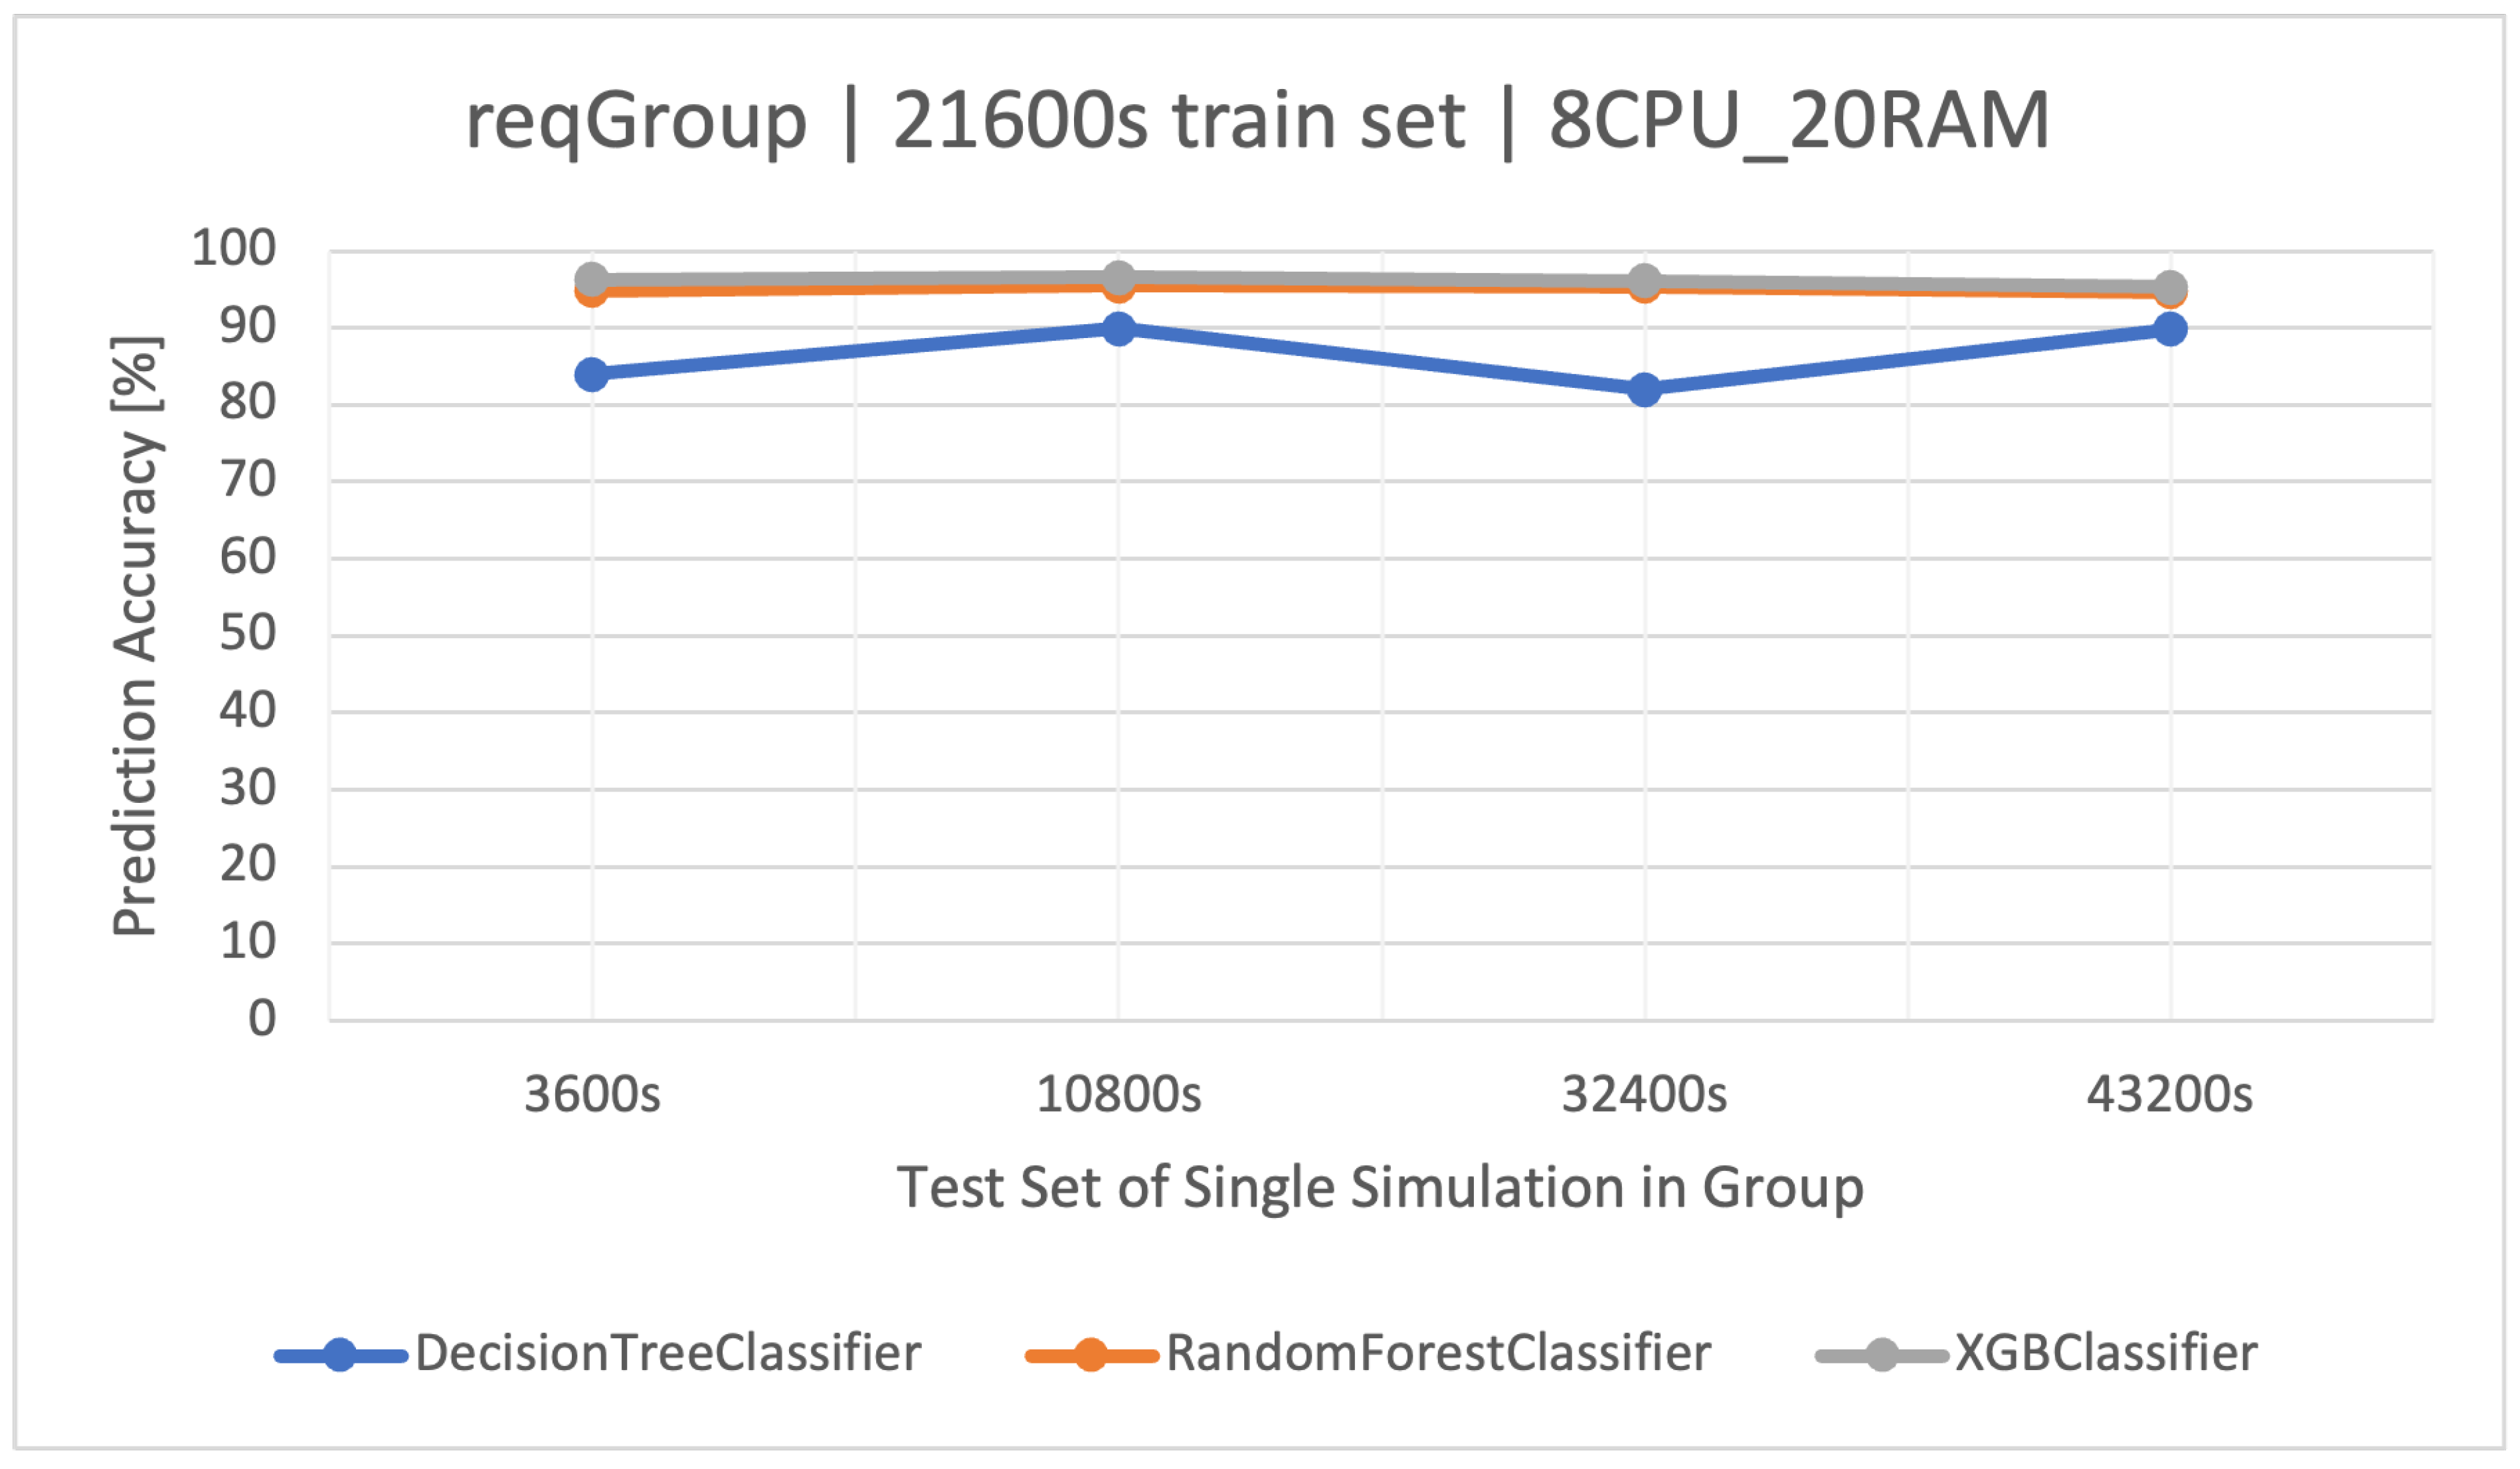
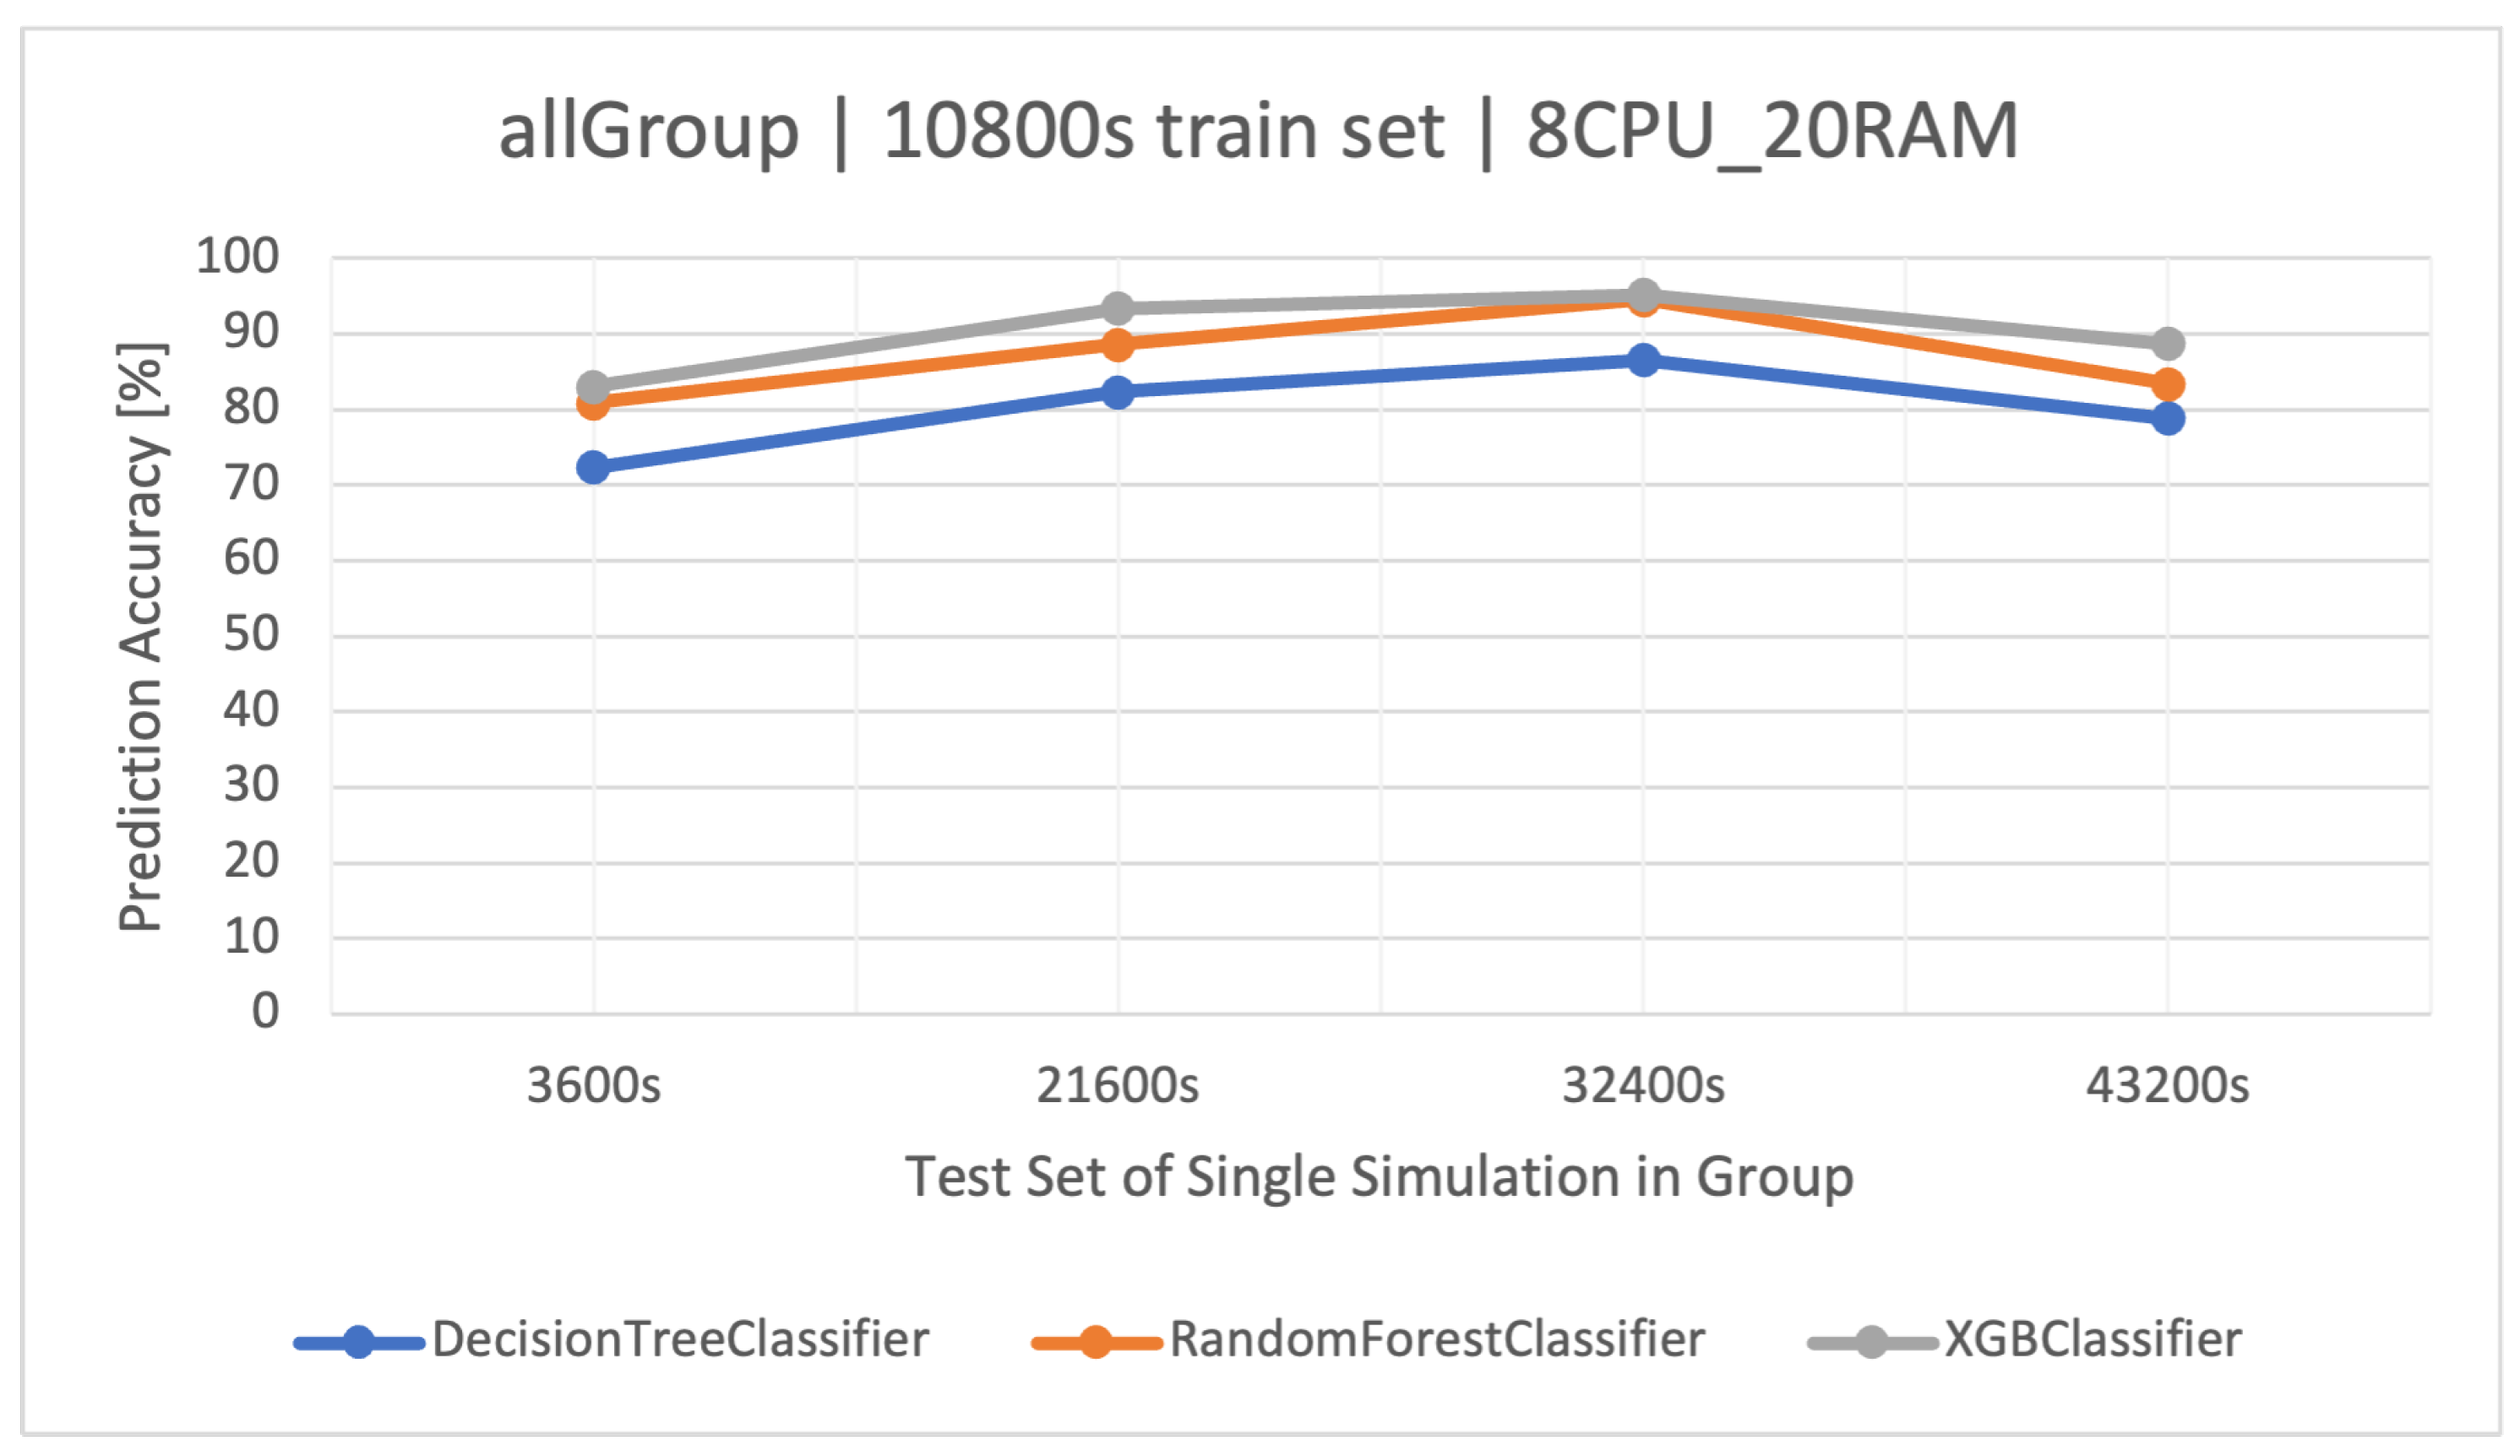
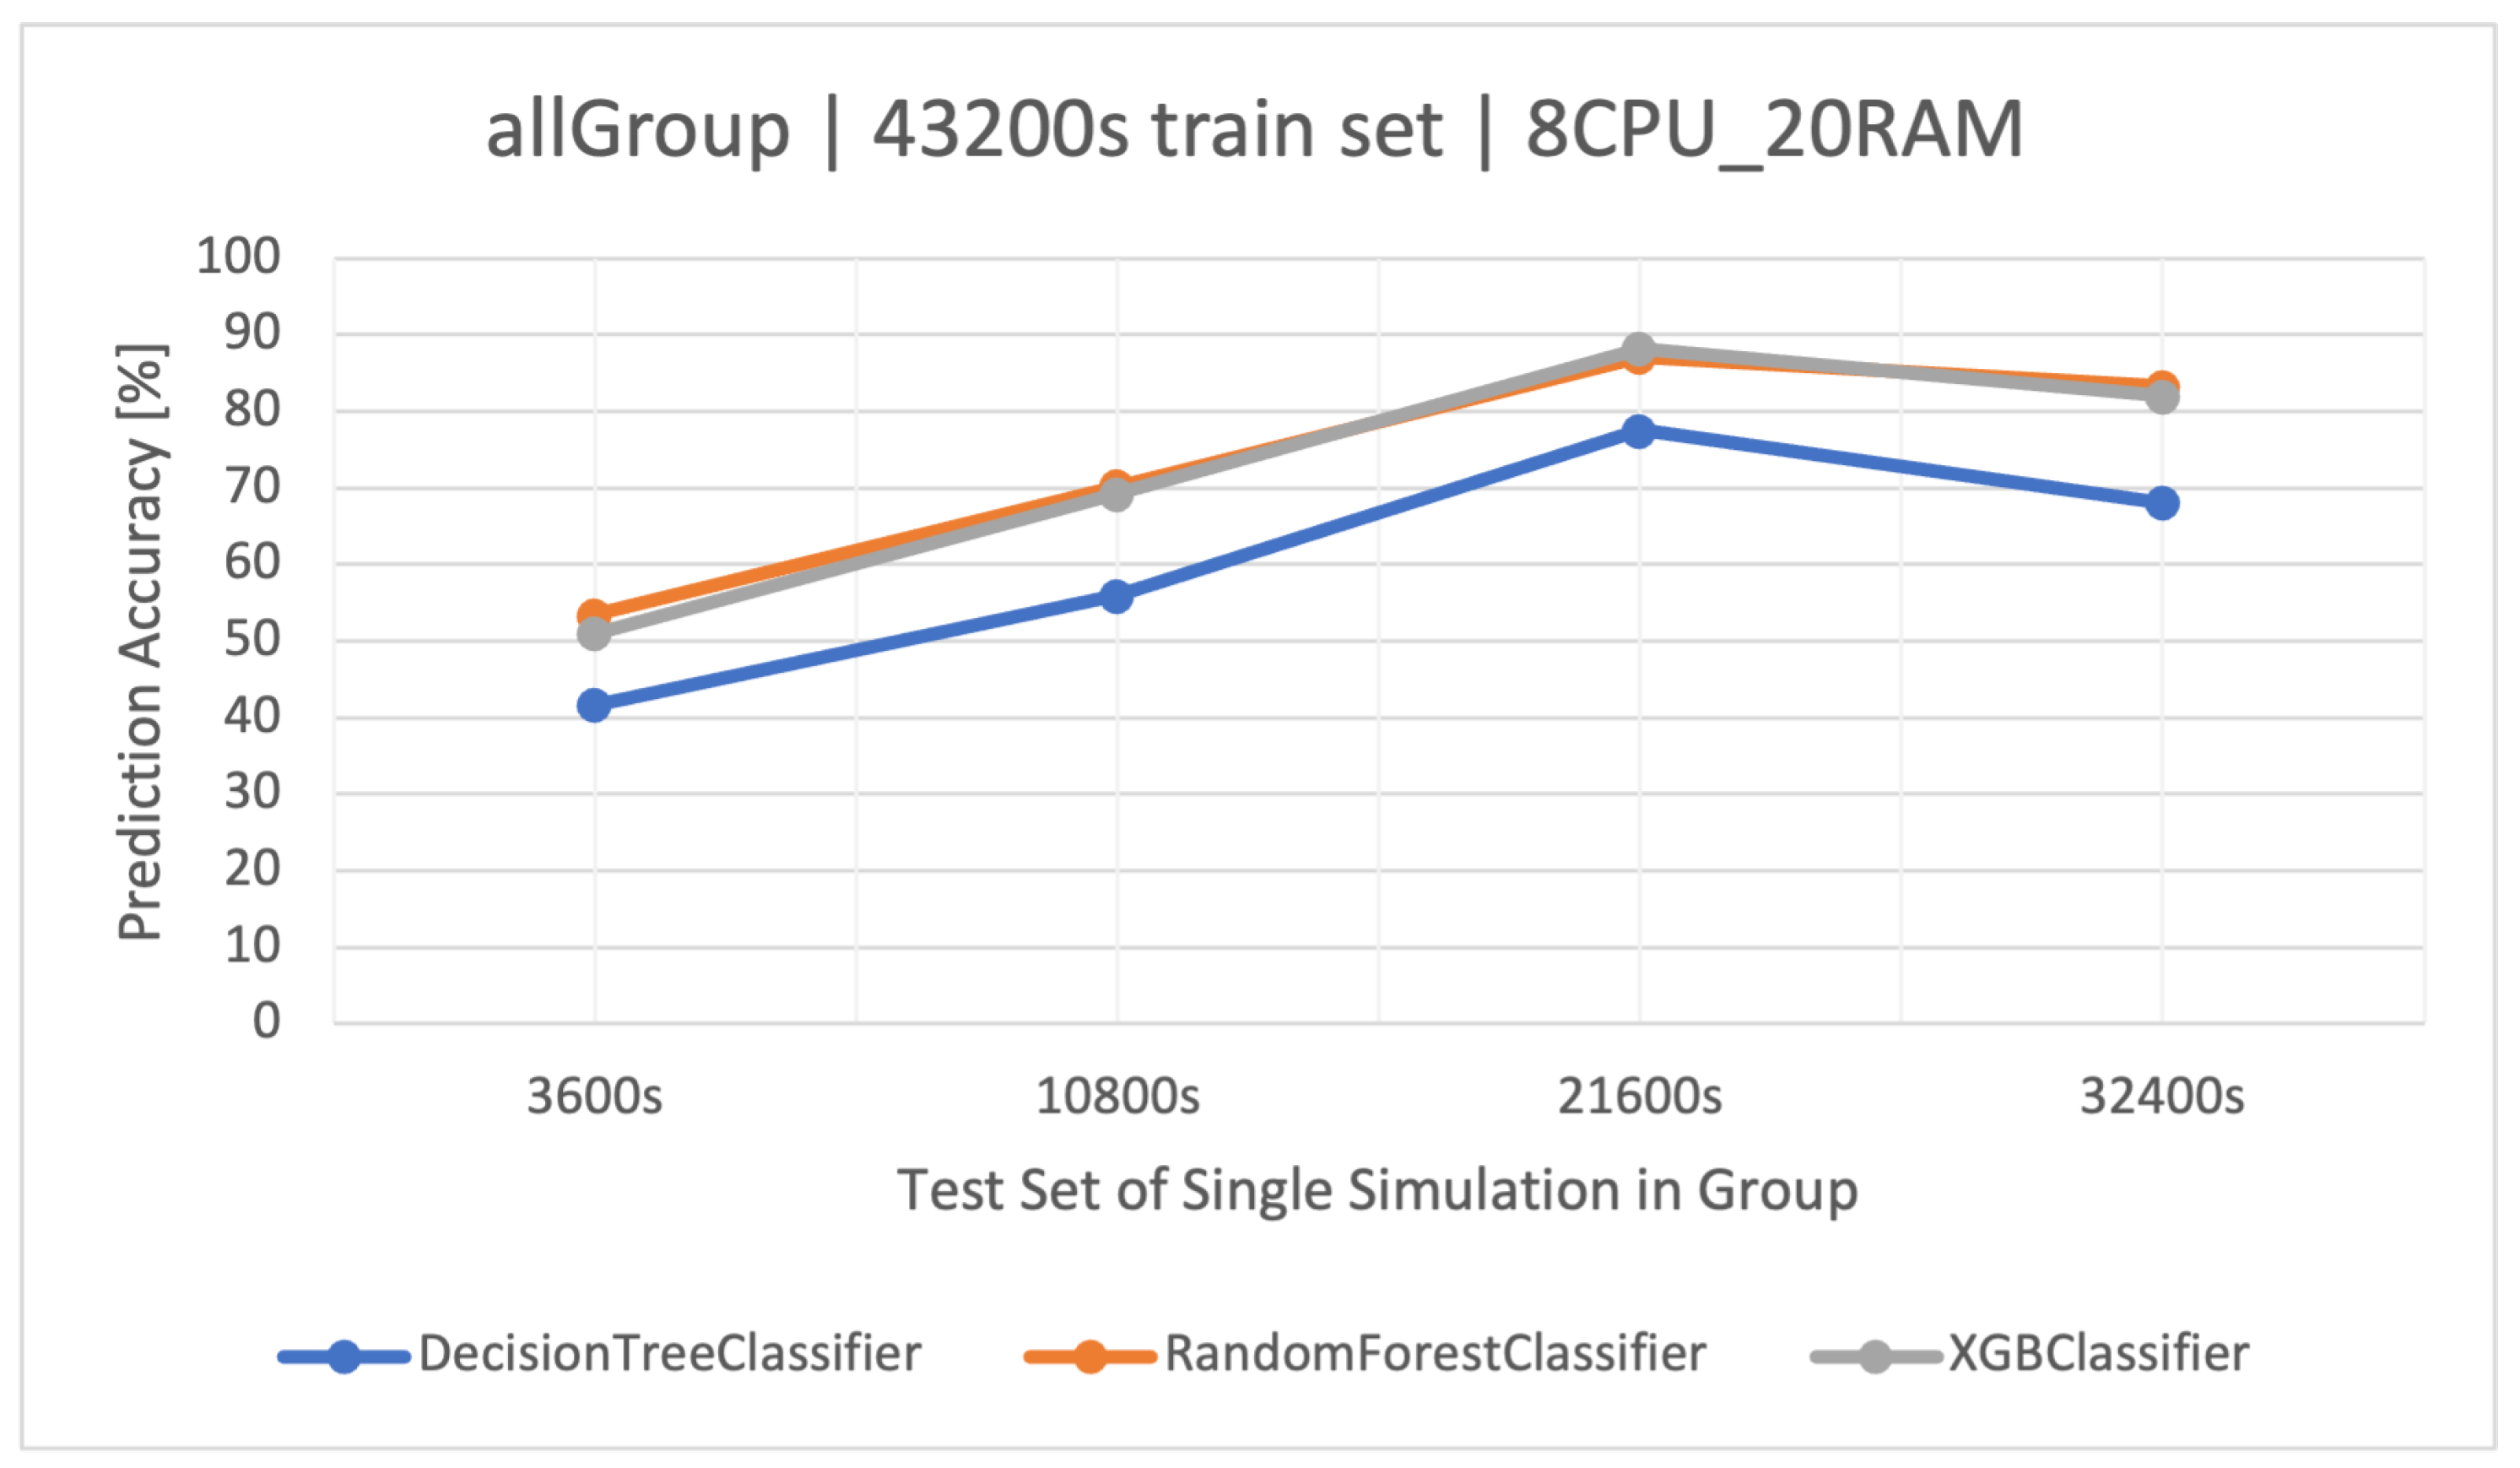
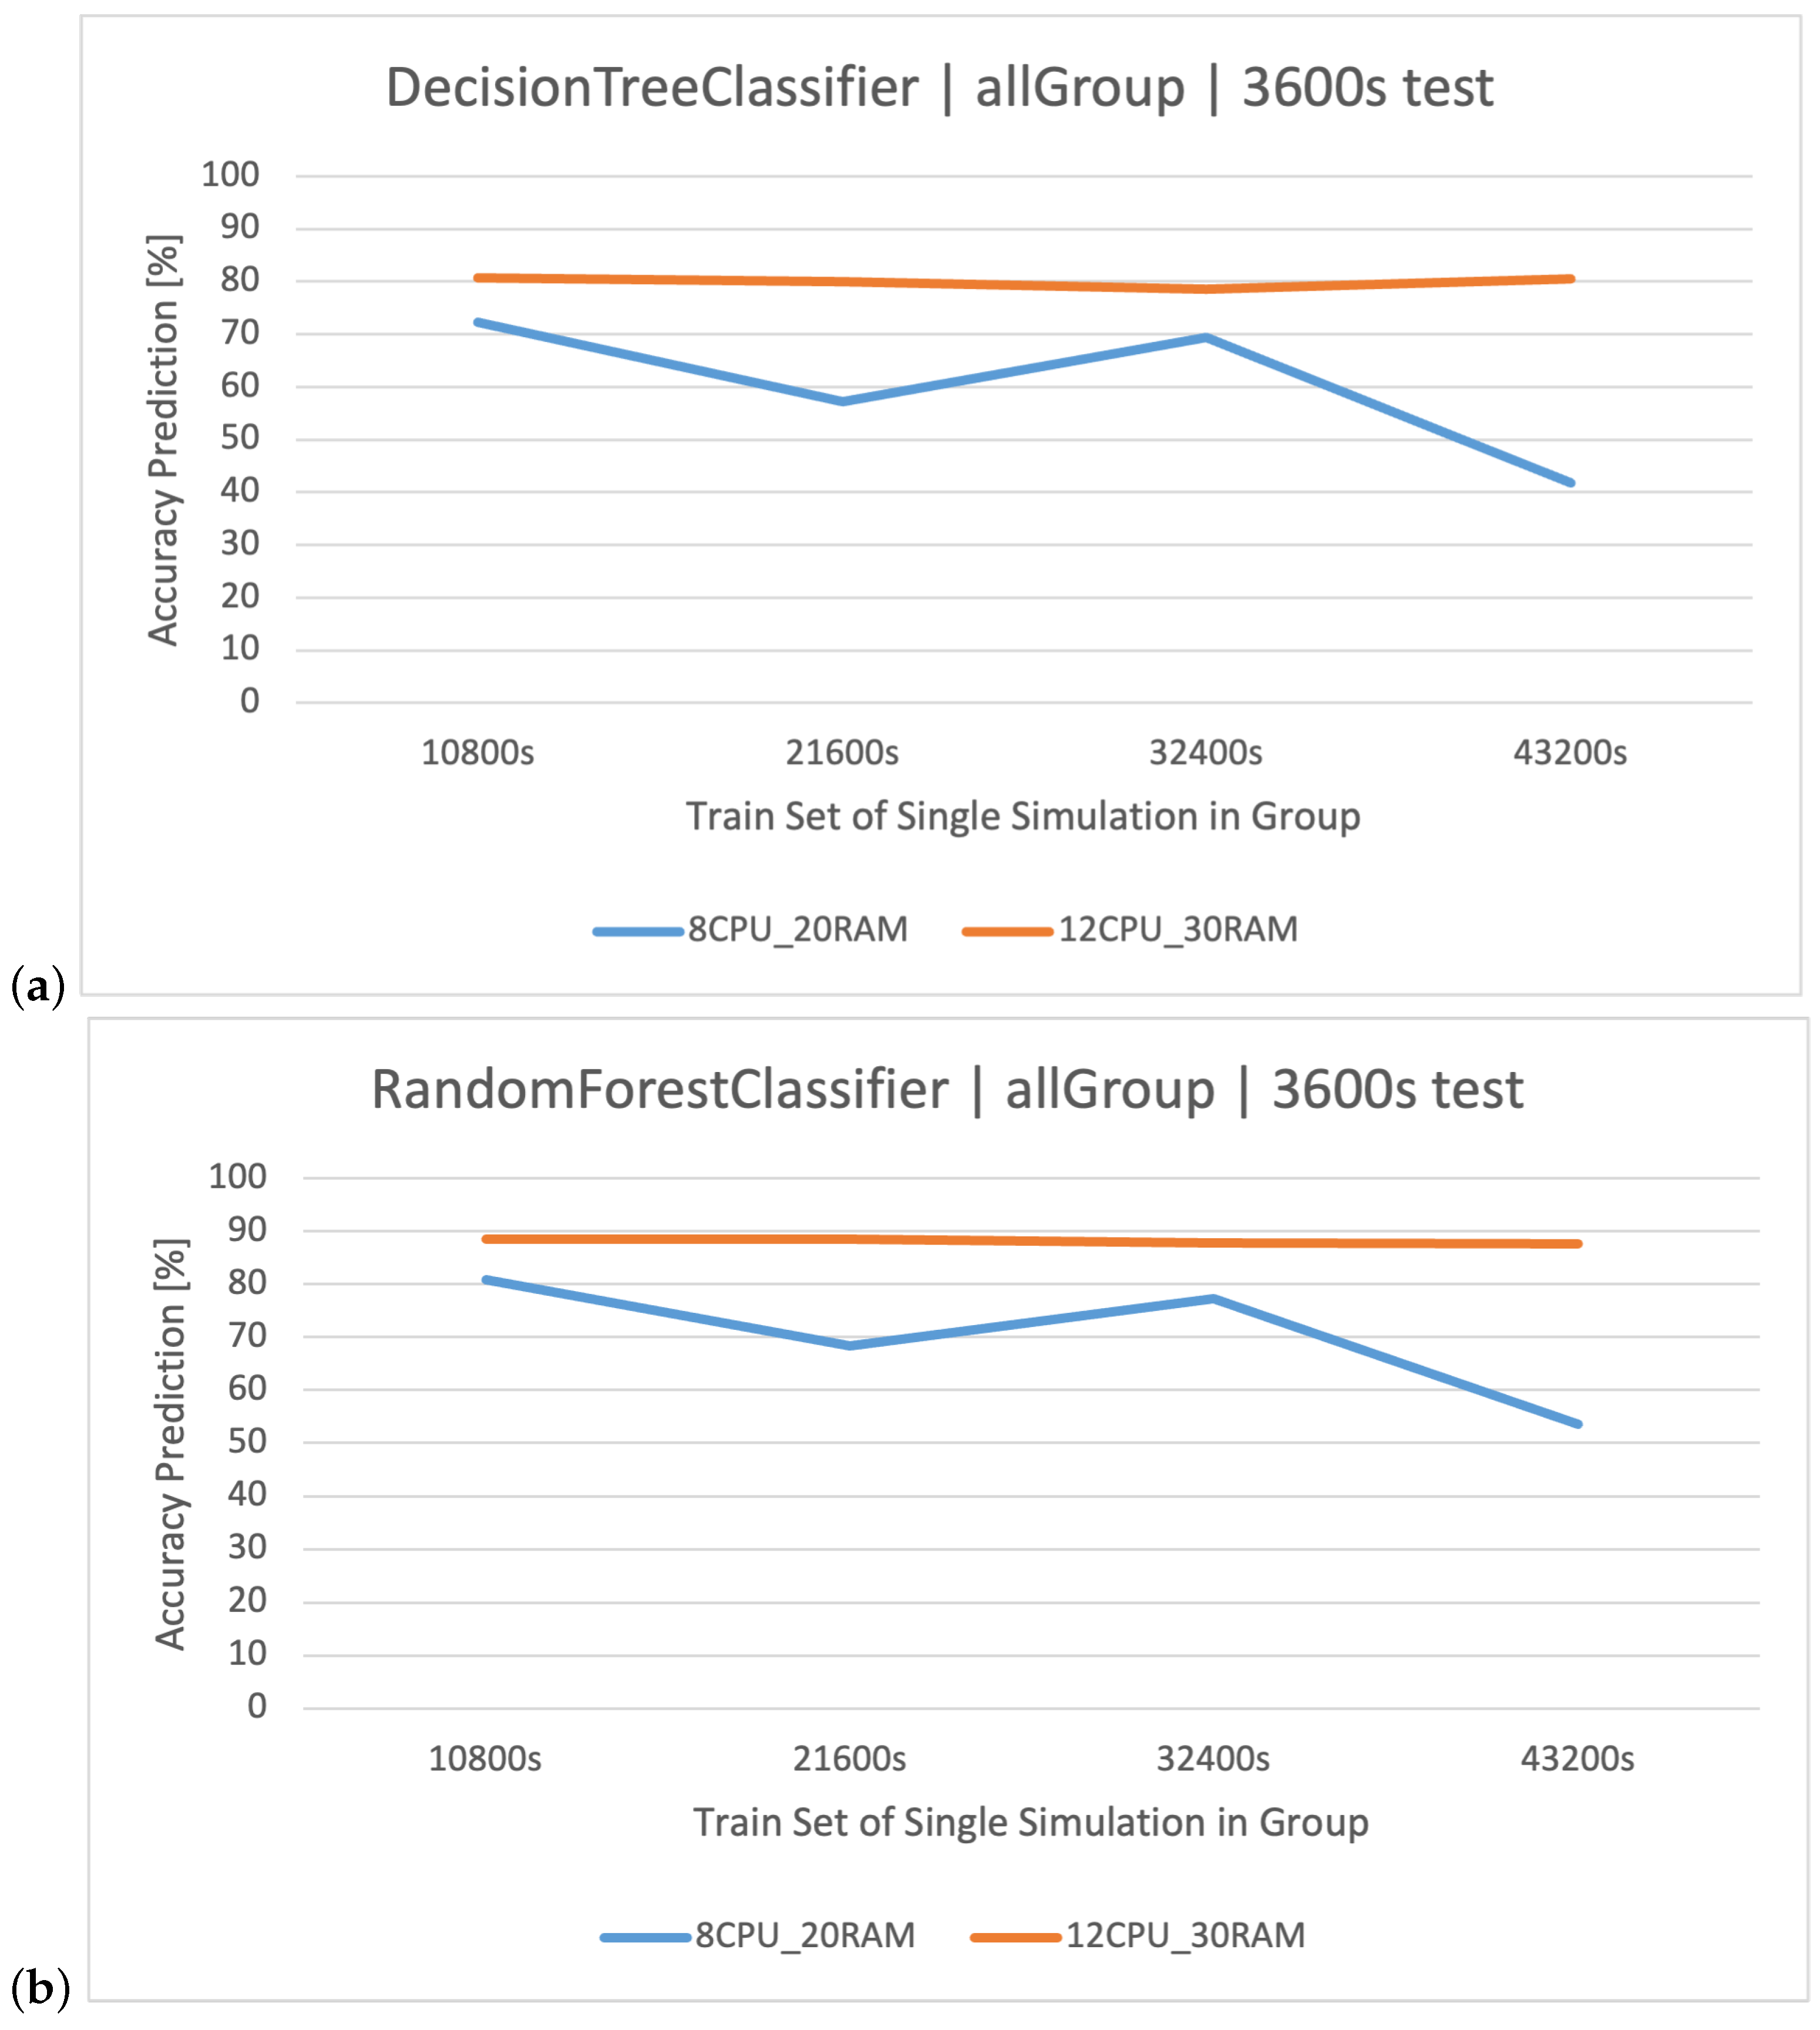
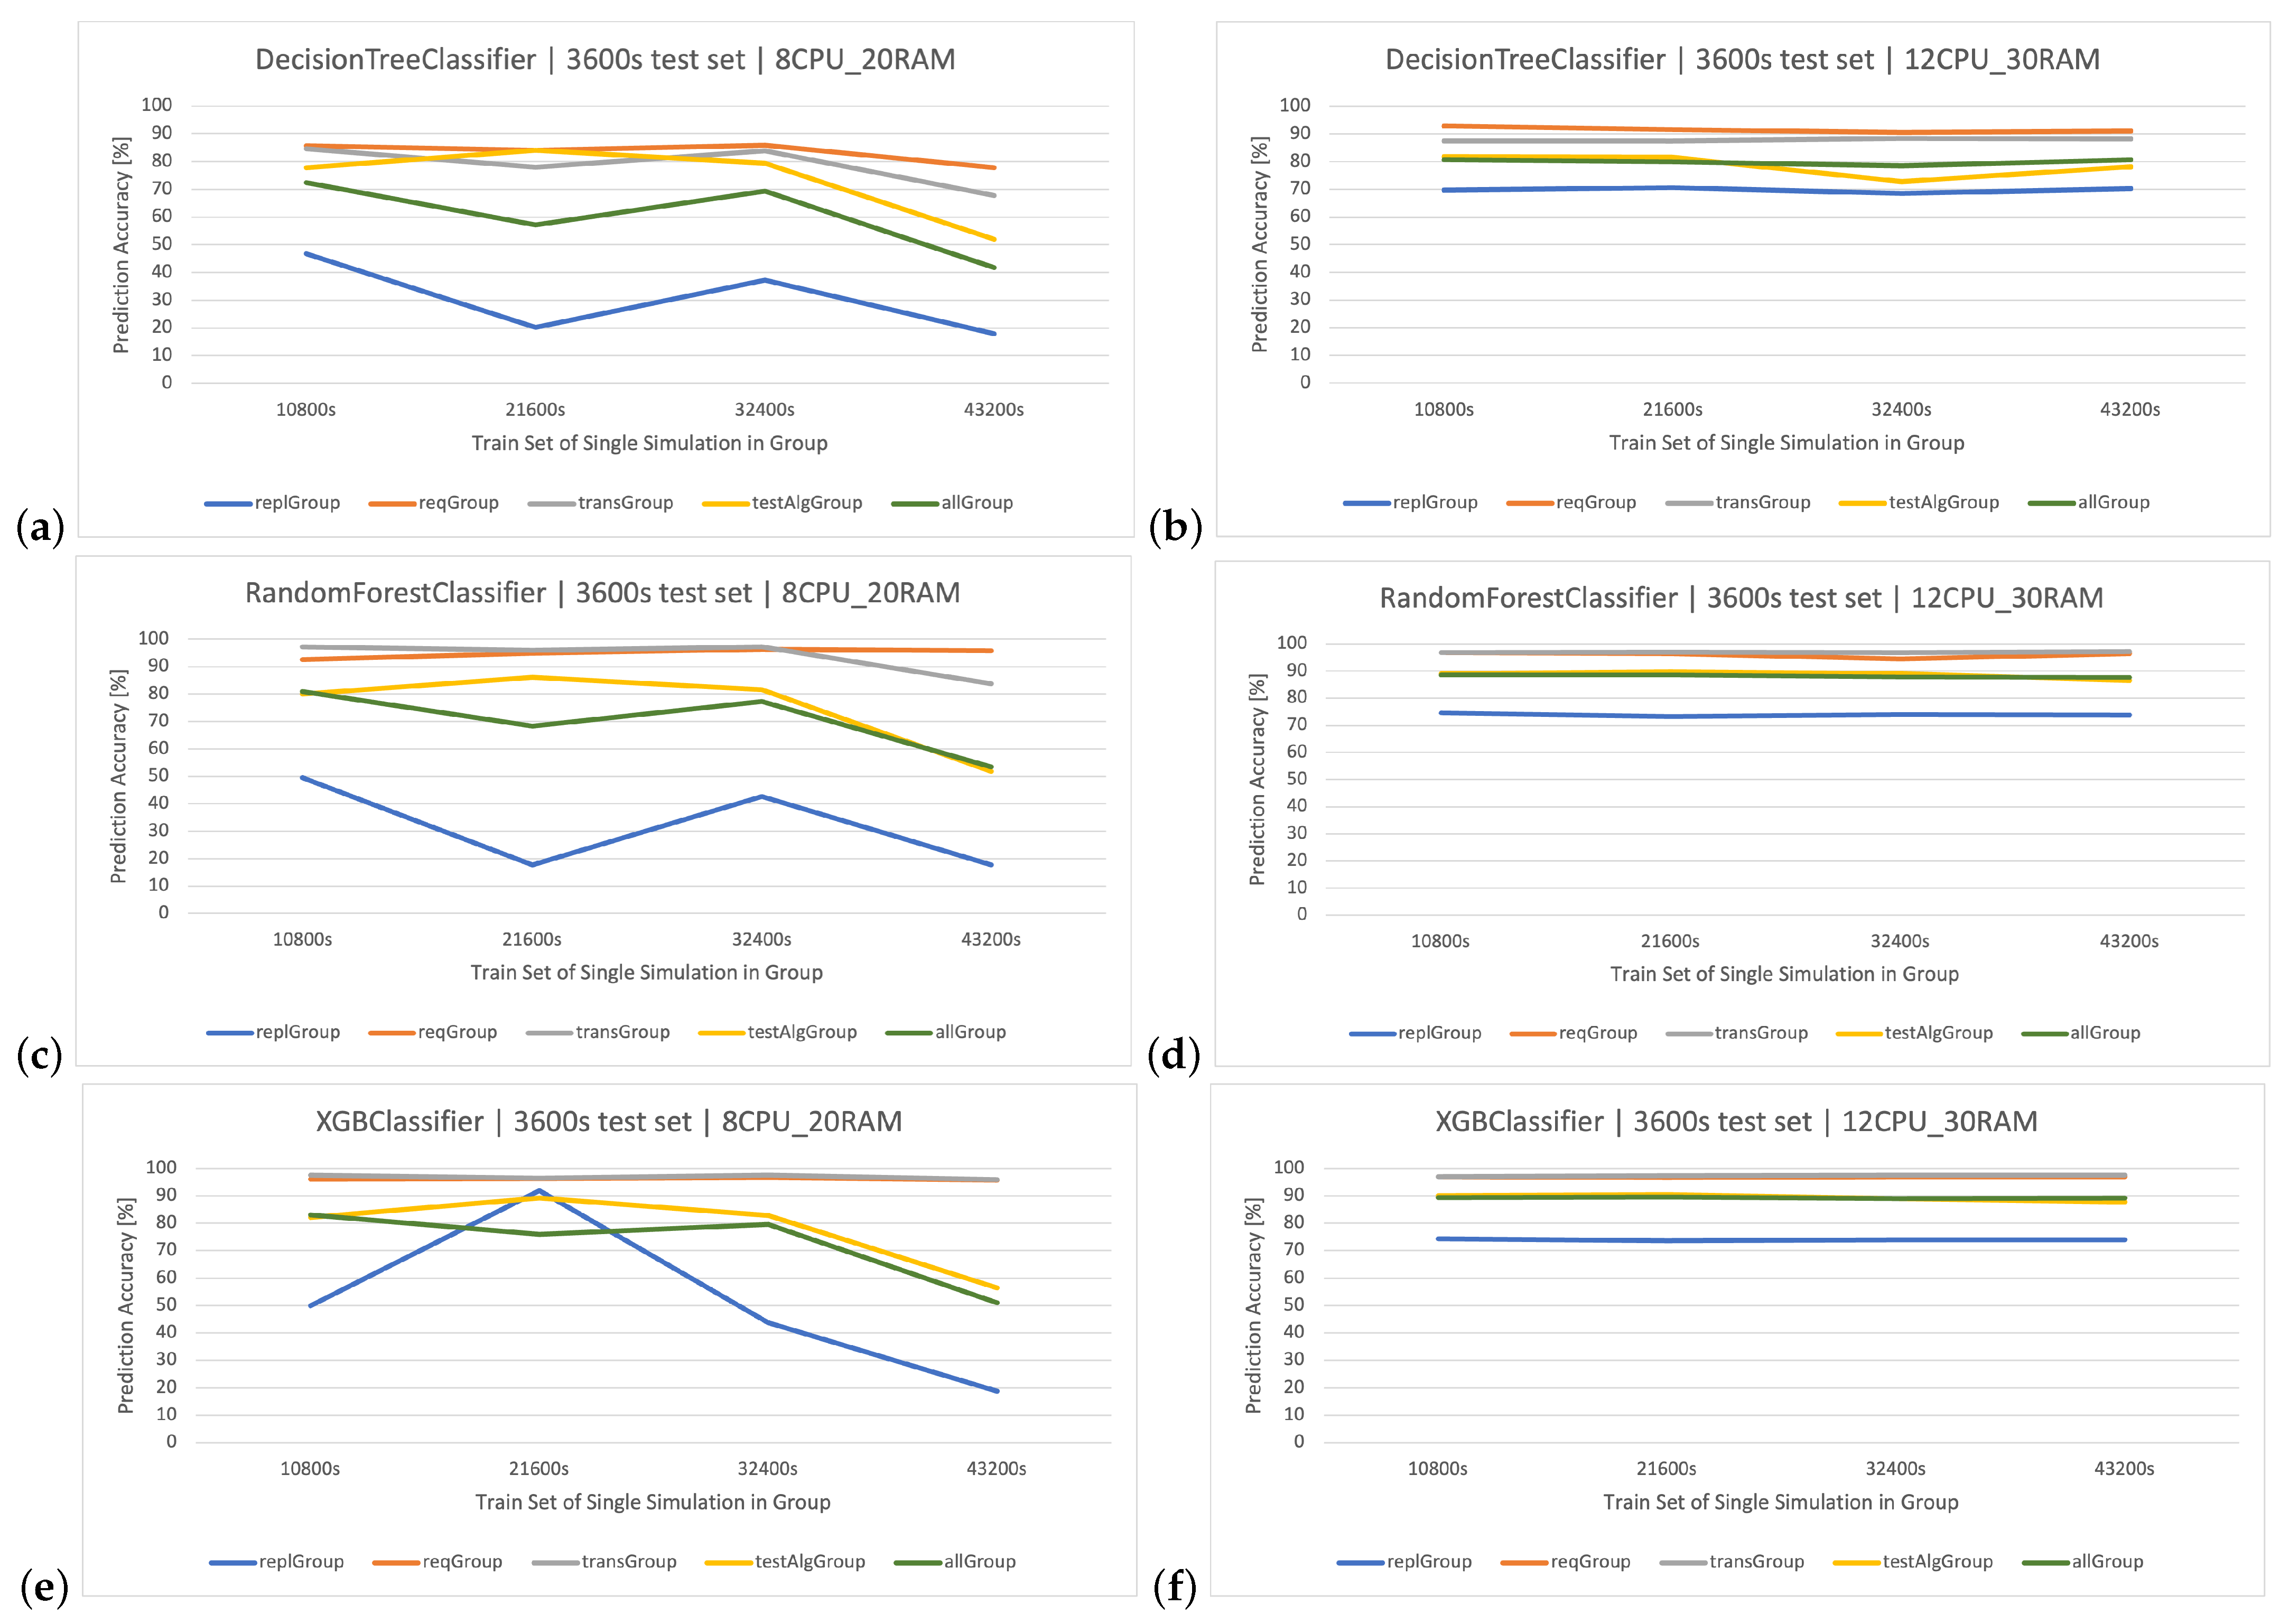
The main goal of this article is to classify user request types in the stock exchange system based on the logs it generates. During the analysis of the stock exchange application logs, three classification methods based on CART were used: Decision Tree (DT), Random Forest (RF), and Extreme Gradient Boosting (XGBoost).
DT is a supervised learning algorithm that utilizes a tree structure to determine outcomes. For each branching point in the tree, the algorithm evaluates an attribute’s value, guiding its path downward until reaching a concluding node or decision. Its main attraction lies in its clear structure and visual interpretability. Within this paper, the D e c i s i o n T r e e C l a s s i f i e r was quick to learn owing to its uncomplicated nature. Yet, when contrasted with other classifiers in the simulation environment, it fell short in terms of efficacy.
RF operates as an ensemble technique, amassing multiple decision trees during its training phase. During prediction, it weighs the decisions of all the trees within its “forest" ensemble, finalizing the class label through a majority consensus. Such an approach aids in enhancing precision and mitigating overfitting. As per the discussion in this article, the R a n d o m F o r e s t C l a s s i f i e r showcased commendable performance, notably within the r e p l G r o u p , outshining the standalone DT in efficiency.
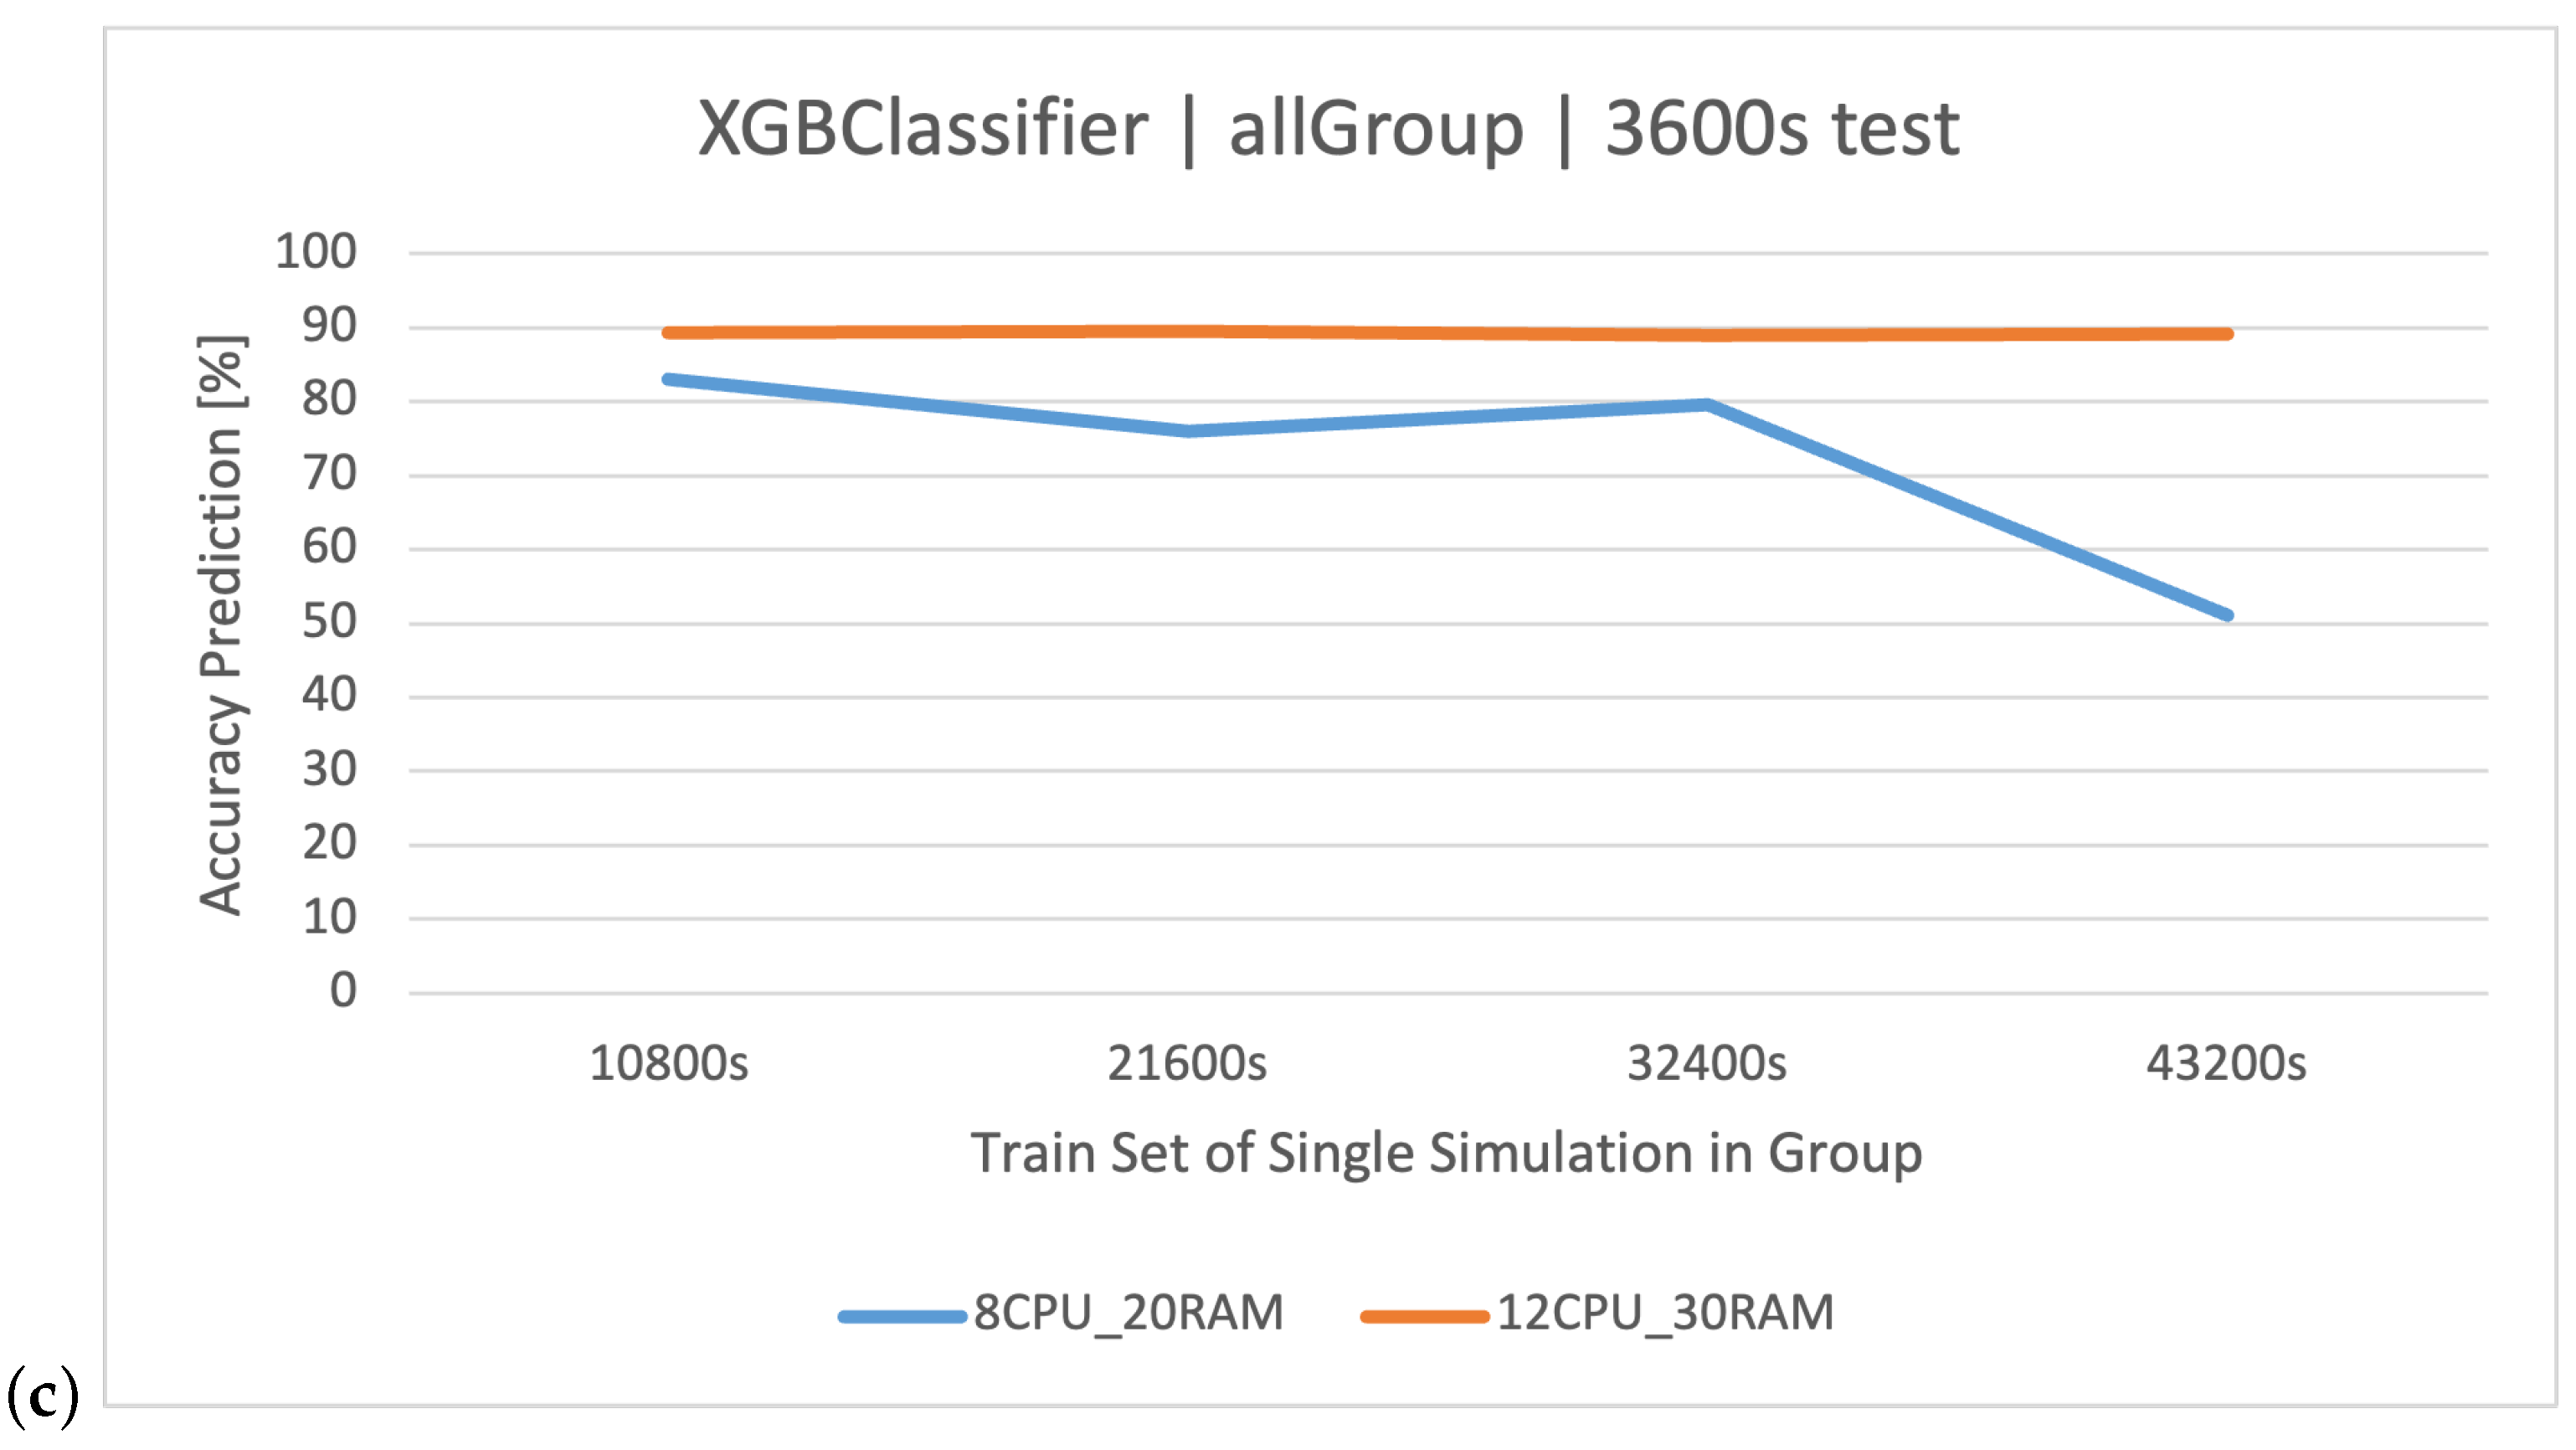
XGBoost refines the gradient-boosting machine learning paradigm. Boosting revolves around the concept of sequentially developing models to rectify the preceding models’ errors. Recognized for its briskness and operational efficiency, XGBoost was perceived to deliver superior results in this study, specifically for the simulation duration of 32400 s, surpassing RF in accuracy metrics and training speed.
The DT algorithm (CART) is a relatively simple (but fast) algorithm, and in the case of a larger dataset, its accuracy may be unsatisfactory. On the other hand, CART can be used in other ensemble learning methods (algorithms) as a solid foundation for advanced algorithms that use the concept of building DTs. One such method is the RF algorithm, which is an extension of CART and is used to improve prediction quality. The RF algorithm involves creating not one, but many DTs based on random subsets of a given set, called the training set. A set of such DTs is called a forest, where each tree is trained on a separate, random subset of training data, and predictions are made based on the voting of all the trees (result confrontation). The operation of the RF algorithm is as follows: creating random subsets, building DTs, and predicting. Another popular algorithm based on the DT concept is XGBoost. This is an advanced ML algorithm based on the Gradient Boosting framework. XGBoost builds predictive models by sequentially adding DTs, each successive tree focusing on correcting the errors of its predecessor. Models are trained in the boosting technique, which means that each subsequent model focuses more on the samples that were incorrectly classified by the previous models. During combination, the cost function is minimized using the method of the straightforward gradient. Classifier models can be added until all elements in the training set are correctly predicted or the maximum number of classifier models is added (a hyperparameter set by the user).
Classification methods can be used to analyze the logs of web applications for various applications: a recommendation/personalization system, identification of attacks and threats, anomaly and error detection, and classification of types of requests and operations. Because web application logs often contain information about different types of requests and operations performed by users, classification methods are used to classify these requests, based on their features such as technical parameters of the request, making it possible to identify and analyze them. This might be useful in system optimization, performance monitoring, and user behavior analysis. In the context of the analyzed stock exchange system and the log dataset related to its operation, specific results are expected through the application of data analysis and machine learning methods. Data classification—the use of data classification methods—will allow for the automatic labeling of stock exchange system log events based on training data. It is expected that the classification will be able to recognize different categories of user queries ( e n d p o i n t U R L ) generated in the system, based on features, such as the processing time of the query ( a p p l i c a t i o n T i m e ), the size of the queues ( q u e u e S i z e B a c k and q u e u e S i z e F o r w a r d ), or the resource consumption of individual components of S 1 i n c r e m e n t a l c o n t r i b u t i o n and S 2 ( c p u U s a g e and m e m o r y U s a g e ). The created classifiers will be compared to each other in order to select the best method based on the CART algorithms. The impact of the server architecture used ( S 1 and S 2 ) on the quality of predictions will also be examined.

5. User Action Prediction

The logs of the executed stock exchange operation simulations were subjected to the classification methods. These logs contain the results of four simulation groups, referring to various technical parameters of the functioning application: the number of containers ( r e p l G r o u p ), t T intervals between transactions ( t r a n s G r o u p ), and t R intervals between queries ( r e q G r o u p ), as well as the traffic generator actions (scenarios { A 1 , A 2 , A 3 } of the stock exchange play— a l g G r o u p ). The aim of this research was to predict the actions performed by the players (attribute e n d p o i n t U r l ), based on the performance parameters recorded in the logs of all the system components (the m e r g e d . c s v set of individual groups). Additionally, the effectiveness of the classification taking into account all the data, i.e., combining the above groups into one ( a l l G r o u p ), was checked.
The following classification methods were used in the analysis: DT, RF, and XGBoost.
As a result of the conducted analyses, the best classification method was selected for the dataset generated by the stock exchange application during the stock exchange simulation using the prepared benchmark. The duration of the classifier learning, the Root Mean Square Error (RMSE), and the calculated effectiveness (accuracy) were measured. The influence of increasing the size of the training set on the prediction of the stock exchange action methods was checked (t = {3600, 10800, 21320, 32400, 43200} (s)).
The predicted actions performed by the user ( e n d p o i n t U r l ) in the application will be mapped as follows (with numerical representation in brackets):
  • d o - r e g i s t e r (0);
  • a d d - s e l l - o f f e r (1);
  • a d d - b u y - o f f e r (2);
  • g e t - s t o c k - d a t a (3);
  • a d d - c o m p a n y (4);
  • g e t - s t o c k - u s e r s - a n d - c o m p a n i e s (5).

5.1. Classification of Actions in the r e p l G r o u p Log Group

The r e p l G r o u p contains the results of four simulations (Table 2), in which the number of replicas (Docker Swarm containers) of the stock exchange application is changed.
At the beginning, classifiers based on the training dataset 3600 s for the t r e p l G r o u p = 3600 s simulation time were tested (Figure 1) on the remaining sets of the same group ( T r e p l G r o u p = { 10800 s , 21600 s , 32400 s , 43200 s } —testing sets). All the used methods did not have high effectiveness and repeatability in classification precision. The best method turned out to be the classifier based on FRs ( R F C l a s s i f i e r ), followed by XGBoost ( X G B o o s t C l a s s i f i e r ). The classifier based on a single DT ( D e c i s i o n T r e e C l a s s i f i e r ) learned the fastest due to its simplicity, but in all cases (Table 2), it was the least effective. The results of the classifier based on the simulations of 3600 s (Figure 1) were not very optimistic, so it was necessary to increase the training dataset. The most effective set for building classifiers turned out to be the set from the simulation of 32400 s (Figure 2). In this case, the best algorithm turned out to be XGBoost, winning over RF by a few percent, and also with a shorter training time—420 (s) vs. 1200 (s) (Table 8).

5.2. Classification of Actions in the t r a n s G r o u p Log Group

Another characteristic dataset consisted of data collected during the manipulation of the transaction time ( t T ) parameter while maintaining the same simulation parameters for user actions—the t r a n s G r o u p (Table 2). Also, this parameter has an influence on the character of the generated logs and is responsible for balancing the load of the stock exchange application.
The tested classifiers were stable with respect to the different simulation sets and had a high percentage accuracy of classification, which cannot be said for the r e p l G r o u p .
The best training set turned out to be once again the training set with a size of 32400 s (Figure 3), as it showed the highest efficiency in the tests. However, using a longer set of 43200 s resulted in a classic case of overfitting the model (Figure 4); hence, it is important to test different training sets and choose the optimal one to use.
The effectiveness of the RF and XGBoost methods was the best and very similar to each other, in the t r a n s G r o u p . Due to the approximately 3 times shorter training time of the XGBoost algorithm, it is recommended for this group. The detailed results of the discussed classifiers are available in Table 9 (the best average accuracy of 97.22% for the 32400 s training set).

5.3. Action Classification in the Log Group r e q G r o u p

By manipulating the t R parameter, which represents the interval in between user requests, it was possible to examine the durability of a given server architecture against traffic generated by the benchmarking platform. The smaller the t R interval, the greater the generated traffic; hence, the server worked with greater intensity. This is how the next r e q G r o u p was formed, which includes four simulations (Table 2).
The accuracy of all the classifiers was high; however, the best was the classifier derived from the 21600 s training set (Figure 5) of this group. Increasing the dataset ( 32400 s and 43200 s ) did not improve the results for each of the discussed methods. As in the previously discussed group, the RF and XGBoost methods almost overlapped in the efficiency results, but the speed of training the X G B o o s t C l a s s i f i e r still remains unmatched. The detailed results of the discussed classifier are shown in Table 10.

5.4. Action Classification in the Log Group a l g G r o u p

The last group considered for classifier construction was the a l g G r o u p , which tests various user behaviors during the operation of a stock exchange application. Five simulations (Table 2) represent various actions according to three differently connected stock market trading strategies (algorithms). Server parameters such as the number of replicas R, transaction time t T , and delay in between requests t R remained the same. The dataset, after merging the simulations, takes into account all possible actions (requests) made by users, and it also describes them in different load situations.
Again, the best method turned out to be XGBoost (Figure 6). An interesting fact is the relatively small difference in classification accuracy between the simplest method—DT—and the more advanced FR in the tested set (Table 11). The training times are as follows: DT—36 (s), RF—666 (s), and XGBoost—407 (s).
The a l g G r o u p is a rather interesting set, which quite realistically presents possible server load situations with set technical parameters.

5.5. Classification of All Logs ( a l l G r o u p )

By combining all the conducted simulations, namely, the previously described groups, r e p l G r o u p , t r a n s G r o u p , r e q G r o u p , and a l g G r o u p (Table 2), we obtain a single consolidated dataset ( a l l G r o u p ) covering various load scenarios and technical parameters. Hence, the classifiers trained to recognize user activities on this set are universal in nature, unlike those described earlier for smaller groups.
The highest classification results were achieved on the 10800 s training set. XGBoost proved to be the best method again (Figure 7). In the case of increasing the volume of the training set to 43200 s , RF was slightly better, but as a result of overfitting the models, their accuracy disappeared (Figure 8), which was also observed in the other groups. The detailed results of the discussed classifier are available in Table 12.

5.6. Influence of Architecture and Datasets on Classification Accuracy

A crucial aspect to consider is the physical factor, which is the hardware architecture on which the application, in this case, a stock exchange system, operates. Generated logs may be distorted if the server is not sufficiently efficient. In the creation of classifiers recognizing user actions/behaviors, certain actions may be incorrectly identified due to the similar nature of the technical parameters (e.g., constant high load) during their execution. In the analyzed stock exchange system, two architectures were taken into account: S 1 ( 8 C P U _ 20 R A M ) and S 2 ( 12 C P U _ 30 R A M ). In the case of architecture S 1 , there were situations in which the effectiveness of classifying the user actions was larger or smaller than the previous one as the training set increased. Architecture S 2 , which has more computational resources, had noticeably smaller deviations in the results. It should be added that the S 1 and S 2 architectures were not overloaded, up to 70–80% of the resource utilization.
This situation is most clearly illustrated by the a l l G r o u p group, which takes into account all scenarios (Figure 9). For S 2 , increasing the time of individual simulations gave similar results, so we are able to say that the system and the data it generates are both stable, or in other words: user actions are easily distinguishable based on the available parameters. For S 1 , increasing the training set brought negative effects, and the classifiers lose their prediction effectiveness.
In addition to the considered group, these dependencies were also examined in the others. In all the tested methods (Figure 10a–f), a similar dependence occurs—the classification results in the S 2 architecture are almost linear if we consider larger training sets, while S 1 generates data that are difficult to classify. Firstly, the average accuracy of dataset classification depends on the nature of the scenarios in the tested group. The more coherent the data in the group, the higher the percentage of correctness. Secondly, we can read from this indicator (accuracy) what parameters manipulated within the group have a high impact on the system operation (lower classification correctness), and hence the different nature of reported logs in individual scenarios in the group. The hierarchy of sets (groups), in terms of the highest classification effectiveness in all methods (descending order), is as follows:
  • r e q G r o u p ;
  • t r a n s G r o u p ;
  • a l g G r o u p ;
  • a l l G r o u p ;
  • r e p l G r o u p .
The above ranking is maintained in every used method, i.e., DT (Figure 10a,b), RF (Figure 10c,d), and XGBoost (Figure 10e,f), and in two different architectures: 8 C P U _ 20 R A M ( S 1 ) and 12 C P U _ 30 R A M ( S 2 ).
In the formal analysis, a high influence of the number of replicas parameter (R) on the system’s operation character was noticed, which is also confirmed by the low effectiveness of the e n d p o i n t U r l classification within this group ( r e p l G r o u p ), making this set possess the smallest percentage classification accuracy of all the groups. The r e q G r o u p and t r a n s G r o u p sets have the best results and are quite similar to each other in terms of effectiveness due to the similar character of operation of both these parameters. The a l g G r o u p ranks 3rd in terms of the effectiveness of predicting user actions; however, this group considers various player strategies, which means it has more types of actions ( e n d p o i n t U r l methods) for analysis than other sets. This set assumes that the server architecture is unchanged in all simulations. In the case when we analyze the results of the complete set ( a l l G r o u p ) of weblogs generated by the system, their effectiveness is comparable to the a l g G r o u p set but only in the case of the S 2 architecture (it is usually lower). Creating a “universal” classifier could be useful in case of frequent server parameter changes during its operation.
The main focus of this paper is on the categorization of logs stemming from simulations of stock exchange operations. The study delves into numerous parameters, encompassing the count of containers (replGroup), gaps between transactions (transGroup), pause between requests (reqGroup), and actions of the traffic generator (algGroup), examining them in light of their technical details. The variable t R , which denotes the pause between user interactions, has a profound effect on server architecture performance, particularly its resilience to traffic emanating from benchmarking tools. A shorter value of t R typically results in heightened server engagement. The classifiers demonstrated commendable accuracy across diverse scenarios. In the context of the r e q G r o u p on the S 1 setup, augmenting the data volume did not yield a noticeable uptick in outcomes. It is noteworthy that while both RF and XGBoost delivered similarly regarding efficiency, XGBoost boasted unparalleled training rapidity. On a closer inspection of the classifiers’ outcomes for the r e q G r o u p on the S 1 blueprint, XGBoost consistently outshone in the accuracy metrics, overshadowing both the D e c i s i o n T r e e C l a s s i f i e r and R a n d o m F o r e s t C l a s s i f i e r . This indicates the superior capability of the X G B o o s t C l a s s i f i e r in managing the designated server layout and data compilation. Within the a l g G r o u p , which probed diverse user interactions during a stock exchange application’s run, the variance in classification precision between the rudimentary DT and the advanced RF was marginal. Therefore the variations in architecture, especially in terms of the application replica counts, are pivotal in shaping the precision and trustworthiness of classifications.
The D e c i s i o n T r e e C l a s s i f i e r displays varied effectiveness depending on the simulation group, especially in the 8 C P U _ 20 R A M architecture. However, its performance becomes more consistent in the 12 C P U _ 30 R A M setup. The R a n d o m F o r e s t C l a s s i f i e r shows some fluctuations in the 8 C P U _ 20 R A M architecture but remains relatively stable in the 12 C P U _ 30 R A M setup. The X G B o o s t C l a s s i f i e r has a consistent performance across both architectures, with minor variations based on the simulation group. In conclusion, the effectiveness of classifying user actions does vary based on the considered sets and architectures. However, the variations are more pronounced in the 8 C P U _ 20 R A M architecture. The 12 C P U _ 30 R A M setup generally offers more consistent and high classification effectiveness across all classifiers and simulation groups.

6. Conclusions

This research article presents a study of the operation of a stock exchange system, utilizing log data generated by its individual components during set parameter simulations. This analysis was conducted using ML techniques on two architectures, S 1 and S 2 . This study’s primary focus was the prediction of user actions on the stock exchange, examined through classification methods, such as DT, RF, and XGBoost.
The stock exchange logs were divided into four simulation groups, each referring to different technical parameters of the functioning application: number of containers ( r e p l G r o u p ), time intervals in between transactions ( t r a n s G r o u p ), intervals in between queries ( r e q G r o u p ), and traffic generator operations ( a l g G r o u p ). Also, this study considered the classification effectiveness when all the data were combined ( a l l G r o u p ).
For the r e p l G r o u p , the X G B o o s t C l a s s i f i e r was the most effective, enabling better prediction accuracy. In the case of t r a n s G r o u p , the classification effectiveness was significantly higher, with XGBoost recommended due to the shorter training time. For the r e q G r o u p , the best results were achieved with a classifier based on a training set of length 21600 s , with XGBoost and RF proving to be the most effective. For a l g G r o u p , the XGBoost method was the most effective in classifying player actions, crucial for behavior predictions. For the a l l G r o u p , XGBoost was found to be the best classification method, with an optimal training set of 10800 s .
Certain groups like the t r a n s G r o u p consistently showed higher accuracy in predicting user actions compared to the r e p l G r o u p . The size of the training dataset plays a significant role in the effectiveness of the classifiers. The optimal size found was 32400 s in both groups studied. The XGBoost algorithm showed promise in both groups, outperforming or matching the R a n d o m F o r e s t C l a s s i f i e r in terms of accuracy while also requiring less training time. Factors contributing to these patterns include the nature of the data in each group, the parameters of the application being manipulated, and the size of the training datasets used.
Our research discovered that performance significantly impacts the quality of logs, as confirmed by the effective classification between S 1 and S 2 in the examined groups. This suggests that the logging mechanism functions correctly; however, architectural limitations may become a bottleneck, potentially leading to user misinterpretation of the logs.
For quick checks, the CART model, particularly a DT, is utilized, but more precise verification requires either RF or XGBoost. It is crucial to test which model will perform better on a given dataset. In the conducted analyses, the gradient model was found to be more effective and faster.
Examining various test cases enabled us to determine whether the increase in log data influences the models’ effectiveness. Accuracy was not always associated with larger data sizes. Data verification is critical because weaker architecture ( S 1 ) may cause the logging mechanism to deadlock, stop working, or generate incorrect logs due to system desynchronization.
The zenith of accuracy recorded is 86.59% using a training duration of 32400 s and a testing span of 43200 s . Conversely, the nadir stands at 41.71% with training for 43200 s and testing over 3600 s . Notably, there is a significant oscillation in accuracy, swinging from a minimum of 41.71% to a peak of 86.59%. The pinnacle of accuracy reached is 94.57% when trained for 3 2400 s and tested over 43200 s . The lowest mark is 53.48% with 43200 s training and 3600 s testing phases. Although there are variations in performance, the classifier touches top-notch values exceeding 94%, signaling its commendable efficacy under certain settings. The optimal accuracy stands at 95.10% with training and testing durations of 32400 s and 43200 s , respectively. The floor is marked at 51.04% under the 43200 s training and 3600 s test scenarios. Echoing the R a n d o m F o r e s t C l a s s i f i e r , the X G B o o s t C l a s s i f i e r also registers remarkable efficacy, crossing the 95% threshold in its superior configurations.
Both the R a n d o m F o r e s t C l a s s i f i e r and X G B o o s t C l a s s i f i e r manifest peak accuracies surpassing the 94% mark in some setups, underscoring their potent prowess in discerning user actions within the stock exchange milieu. In contrast, the D e c i s i o n T r e e C l a s s i f i e r trails with a subdued apex accuracy. A conspicuous observation is a dip in precision for all the classifiers when trained on a vast dataset ( 43200 s ) and assessed on a diminutive one ( 3600 s ), spotlighting the intricacies of extrapolating from extensive, varied data to confined datasets. There exists a palpable disparity in accuracy metrics across the classifiers, particularly when juxtaposing the scores of the R a n d o m F o r e s t C l a s s i f i e r and X G B o o s t C l a s s i f i e r against the D e c i s i o n T r e e C l a s s i f i e r . To wrap up, all the classifiers exhibit adeptness in forecasting user actions. However, in the stock exchange framework presented, the R a n d o m F o r e s t C l a s s i f i e r and X G B o o s t C l a s s i f i e r consistently outclass the D e c i s i o n T r e e C l a s s i f i e r , registering loftier peak accuracies.
Open issues include the application of other log analysis methods beyond those proposed. Deep learning was omitted from the stock exchange system ML analysis due to the vast volume of datasets and the number of simulation sets. Future models could be more refined and consider only those features that genuinely impact prediction quality. Additionally, prepared scripts and implementations of data analysis and machine learning methods may require hyperparameter optimization and a larger number of comparative effectiveness measures. Investigating alternative log evaluation techniques might offer a broader perspective on the simulations of stock exchange operations, with an emphasis on deep learning. Techniques like neural networks, support vector machines, or ensemble approaches stand as promising candidates. For a more thorough assessment, subsequent research endeavors should contemplate the inclusion of an expanded set of classifiers.

Author Contributions

Conceptualization, T.R.; Methodology, M.B. and T.R.; Software, M.B.; Formal analysis, M.B. and T.R.; Data curation, M.B.; Writing—original draft, M.B. and T.R.; Writing—review & editing, M.B.; Supervision, T.R. All authors have read and agreed to the published version of the manuscript.

Funding

This research received no external funding.

Conflicts of Interest

The authors declare no conflict of interest.

Appendix A. Simulation Results

Table A1. Detailed data on the results of the D e c i s i o n T r e e C l a s s i f i e r for all sets and architectures testing set 3600 s .
ClassifierArchitectureTraining SetTraining TimeRMSEAccuracy (%)
D e c i s i o n T r e e C l a s s i f i e r
( r e p l G r o u p )
8 C P U _ 20 R A M 10800 s 0:00:34.9869370.772346.83
21600 s 0:00:54.4397520.931220.17
32400 s 0:01:16.8158060.831137.22
43200 s 0:01:16.4693820.936917.88
12 C P U _ 30 R A M 10800 s 0:00:39.8257190.575969.62
21600 s 0:01:01.3685900.574970.58
32400 s 0:01:13.7636070.594068.41
43200 s 0:01:34.4413190.575970.32
D e c i s i o n T r e e C l a s s i f i e r ( r e q G r o u p ) 8 C P U _ 20 R A M 10800 s 0:00:20.1234960.398685.65
21600 s 0:00:29.9459580.416283.99
32400 s 0:00:43.7337560.393185.84
43200 s 0:00:48.1757650.487477.87
12 C P U _ 30 R A M 10800 s 0:00:22.7440810.298992.80
21600 s 0:00:34.7885000.307191.60
32400 s 0:00:46.6233400.324390.60
43200 s 0:00:53.4263060.316191.11
D e c i s i o n T r e e C l a s s i f i e r ( t r a n s G r o u p ) 8 C P U _ 20 R A M 10800 s 0:00:48.1049690.403684.53
21600 s 0:01:18.7176830.479277.96
32400 s 0:01:49.5019140.410383.88
43200 s 0:02:07.5288900.577567.73
12 C P U _ 30 R A M 10800 s 0:00:58.7941410.364687.46
21600 s 0:01:20.3877590.366087.52
32400 s 0:01:46.5954740.356588.42
43200 s 0:02:07.1894660.354588.21
D e c i s i o n T r e e C l a s s i f i e r ( a l g G r o u p ) 8 C P U _ 20 R A M 10800 s 0:00:29.9720320.618977.82
21600 s 0:00:36.7429870.482184.04
32400 s 0:01:22.7605510.569479.41
43200 s 0:01:36.9184020.879252.03
12 C P U _ 30 R A M 10800 s 0:00:33.7134020.507381.78
21600 s 0:01:02.3547900.498581.48
32400 s 0:01:36.6793650.681972.77
43200 s 0:01:54.1929530.556478.20
D e c i s i o n T r e e C l a s s i f i e r ( a l l G r o u p ) 8 C P U _ 20 R A M 10800 s 0:03:14.4067780.576372.36
21600 s 0:04:29.2521310.684657.16
32400 s 0:06:38.2389730.596669.40
43200 s 0:07:52.6607490.814741.71
12 C P U _ 30 R A M 10800 s 0:03:22.3445050.511580.75
21600 s 0:05:29.6371080.481179.98
32400 s 0:07:15.1703950.524478.53
43200 s 0:08:14.1769080.488780.60
Table A2. Detailed data on the results of the R a n d o m F o r e s t C l a s s i f i e r for all sets and architectures, testing set 3600 s .
ClassifierArchitectureTraining SetTraining TimeRMSEAccuracy (%)
R a n d o m F o r e s t C l a s s i f i e r  ( r e p l G r o u p ) 8 C P U _ 20 R A M 10800 s 0:09:29.5435250.728049.42
21600 s 0:14:06.9037500.922917.81
32400 s 0:20:04.9241340.772142.62
43200 s 0:20:31.7810630.924817.71
12 C P U _ 30 R A M 10800 s 0:10:50.1545130.519474.53
21600 s 0:15:31.5514990.530773.25
32400 s 0:20:26.3227070.524573.93
43200 s 0:25:00.8223690.525473.88
R a n d o m F o r e s t C l a s s i f i e r  ( r e q G r o u p ) 8 C P U _ 20 R A M 10800 s 0:05:42.0557150.284192.50
21600 s 0:08:32.0006240.239294.83
32400 s 0:11:59.5533930.208396.34
43200 s 0:13:30.1672690.222295.69
12 C P U _ 30 R A M 10800 s 0:06:00.9395720.198396.77
21600 s 0:09:26.9822510.203296.44
32400 s 0:13:05.1790140.246094.51
43200 s 0:15:51.1603940.202996.39
R a n d o m F o r e s t C l a s s i f i e r  ( t r a n s G r o u p ) 8 C P U _ 20 R A M 10800 s 0:12:45.8179220.182297.21
21600 s 0:20:22.8454580.216395.91
32400 s 0:27:37.1053590.181497.25
43200 s 0:31:42.4136600.409483.69
12 C P U _ 30 R A M 10800 s 0:13:38.4083490.189196.78
21600 s 0:20:52.8397250.188596.86
32400 s 0:28:11.9354000.190996.83
43200 s 0:33:36.8645030.185497.12
R a n d o m F o r e s t C l a s s i f i e r  ( a l g G r o u p ) 8 C P U _ 20 R A M 10800 s 0:08:19.2855840.543479.97
21600 s 0:11:06.4784850.421886.03
32400 s 0:22:01.2949370.501281.60
43200 s 0:25:06.4264550.863851.86
12 C P U _ 30 R A M 10800 s 0:09:28.4121990.387589.12
21600 s 0:17:19.8328580.361789.76
32400 s 0:26:15.0058790.389289.05
43200 s 0:31:30.6481980.432486.61
R a n d o m F o r e s t C l a s s i f i e r  ( a l l G r o u p ) 8 C P U _ 20 R A M 10800 s 0:48:06.5794170.463180.88
21600 s 1:12:38.6904080.578368.40
32400 s 1:47:00.1322870.499577.25
43200 s 2:02:20.1846340.728253.48
12 C P U _ 30 R A M 10800 s 0:51:46.7765130.359988.59
21600 s 1:25:10.6970750.358988.46
32400 s 1:57:58.7363690.373687.86
43200 s 2:18:42.1945230.375987.55
Table A3. Detailed data on the results of the X G B o o s t C l a s s i f i e r for all sets and architectures, testing set 3600 s .
ClassifierArchitectureTraining SetTraining TimeRMSEAccuracy (%)
X G B o o s t C l a s s i f i e r  ( r e p l G r o u p ) 8 C P U _ 20 R A M 10800 s 0:03:58.4216920.721849.86
21600 s 0:05:33.2946470.174591.94
32400 s 0:07:03.0888630.760943.76
43200 s 0:08:03.0880180.914118.73
12 C P U _ 30 R A M 10800 s 0:03:58.9751680.518974.31
21600 s 0:05:47.0785070.526873.58
32400 s 0:07:12.9733950.523374.01
43200 s 0:08:59.0507270.523274.00
X G B o o s t C l a s s i f i e r  ( r e q G r o u p ) 8 C P U _ 20 R A M 10800 s 0:03:49.2457060.211696.02
21600 s 0:04:35.1728330.205496.29
32400 s 0:06:22.7554280.202096.61
43200 s 0:06:22.1098290.21799573
12 C P U _ 30 R A M 10800 s 0:03:56.7801520.190796.98
21600 s 0:05:13.3527670.203596.64
32400 s 0:06:43.2561270.195396.95
43200 s 0:08:16.8941380.193996.96
X G B o o s t C l a s s i f i e r  ( t r a n s G r o u p ) 8 C P U _ 20 R A M 10800 s 0:04:33.4088650.174797.40
21600 s 0:06:55.3264640.200596.46
32400 s 0:09:29.0156300.169297.48
43200 s 0:10:12.4536110.212895.85
12 C P U _ 30 R A M 10800 s 0:04:55.9550080.183597.00
21600 s 0:07:19.4086960.173397.31
32400 s 0:09:35.8248100.166697.53
43200 s 0:11:31.5943310.167997.54
X G B o o s t C l a s s i f i e r  ( a l g G r o u p ) 8 C P U _ 20 R A M 10800 s 0:04:27.9686990.499382.16
21600 s 0:06:47.0014670.385489.17
32400 s 0:11:37.4818380.487282.86
43200 s 0:16:00.8392390.768056.37
12 C P U _ 30 R A M 10800 s 0:05:03.1135260.365289.98
21600 s 0:09:09.6507050.351890.38
32400 s 0:13:22.4615360.380088.88
43200 s 0:16:54.2335450.413887.66
X G B o o s t C l a s s i f i e r  ( a l l G r o u p ) 8 C P U _ 20 R A M 10800 s 0:17:32.6604200.432583.08
21600 s 0:28:10.7359690.505675.91
32400 s 0:45:46.7272840.470979.62
43200 s 1:06:06.6650740.729951.04
12 C P U _ 30 R A M 10800 s 0:19:40.8684660.353389.27
21600 s 0:33:45.9902030.347889.52
32400 s 0:49:51.0131510.361588.97
43200 s 3:10:31.8829210.358289.12

References

  1. Räth, T.; Bedini, F.; Sattler, K.U.; Zimmermann, A. Demo: Interactive Performance Exploration of Stream Processing Applications Using Colored Petri Nets. In Proceedings of the 17th ACM International Conference on Distributed and Event-Based Systems, DEBS’23, Neuchatel Switzerland, 27–30 June 2023; Association for Computing Machinery: New York, NY, USA, 2023; pp. 191–194. [Google Scholar] [CrossRef]
  2. Borowiec, M.; Piszko, R.; Rak, T. Knowledge Extraction and Discovery about Web System Based on the Benchmark Application of Online Stock Trading System. Sensors 2023, 23, 2274. [Google Scholar] [CrossRef] [PubMed]
  3. Bhargavi, M.; Sinha, A.; Desai, J.; Garg, N.; Bhatnagar, Y.; Mishra, P. Comparative Study of Consumer Purchasing and Decision Pattern Analysis using Pincer Search Based Data Mining Method. In Proceedings of the 2022 13th International Conference on Computing Communication and Networking Technologies (ICCCNT), Kharagpur, India, 3–5 October 2022; pp. 1–7. [Google Scholar] [CrossRef]
  4. Giebas, D.; Wojszczyk, R. Detection of Concurrency Errors in Multithreaded Applications Based on Static Source Code Analysis. IEEE Access 2021, 9, 61298–61323. [Google Scholar] [CrossRef]
  5. Wang, S.; Ren, J.; Fang, H.; Pan, J.; Hu, X.; Zhao, T. An advanced algorithm for discrimination prevention in data mining. In Proceedings of the 2022 IEEE Conference on Telecommunications, Optics and Computer Science (TOCS), Dalian, China, 11–12 December 2022; pp. 1443–1447. [Google Scholar] [CrossRef]
  6. Ma, J.; Liu, Y.; Wan, H.; Sun, G. Automatic Parsing and Utilization of System Log Features in Log Analysis: A Survey. Appl. Sci. 2023, 13, 4930. [Google Scholar] [CrossRef]
  7. Eirinaki, M.; Vazirgiannis, M.; Varlamis, I. SEWeP: Using site semantics and a taxonomy to enhance the Web personalization process. In Proceedings of the Ninth ACM SIGKDD International Conference on Knowledge Discovery and Data Mining, KDD ’03, Washington, DC, USA, 24–27 August 2003; p. 99. [Google Scholar] [CrossRef]
  8. Hochenbaum, J.; Vallis, O.S.; Kejariwal, A. Automatic Anomaly Detection in the Cloud Via Statistical Learning. arXiv 2017, arXiv:1704.07706. [Google Scholar] [CrossRef]
  9. Chandola, V.; Banerjee, A.; Kumar, V. Anomaly Detection: A Survey. ACM Comput. Surv. 2009, 41, 1–58. [Google Scholar] [CrossRef]
  10. Maciąg, P.; Kryszkiewicz, M.; Robert, B.; López Lobo, J.; Del Ser, J. Unsupervised Anomaly Detection in Stream Data with Online Evolving Spiking Neural Networks. Neural Netw. 2021, 139, 118–139. [Google Scholar] [CrossRef] [PubMed]
  11. Kotsiantis, S. Supervised Machine Learning: A Review of Classification Techniques. Inform. (Slovenia) 2007, 31, 249–268. [Google Scholar]
  12. Akoglu, L.; Tong, H.; Koutra, D. Graph based anomaly detection and description: A survey. Data Min. Knowl. Discov. 2015, 29, 626–688. [Google Scholar] [CrossRef]
  13. Chen, T.; Guestrin, C. XGBoost: A Scalable Tree Boosting System. In Proceedings of the 22nd ACM SIGKDD International Conference on Knowledge Discovery and Data Mining, KDD ’16, San Francisco, CA, USA, 13–17 August 2016; Association for Computing Machinery: New York, NY, USA, 2016; pp. 785–794. [Google Scholar] [CrossRef]
  14. Srivastava, J.; Cooley, R.; Deshpande, M.; Tan, P.N. Web Usage Mining: Discovery and Applications of Usage Patterns from Web Data. SIGKDD Explor. Newsl. 2000, 1, 12–23. [Google Scholar] [CrossRef]
  15. Meng, X.; Bradley, J.; Yavuz, B.; Sparks, E.; Venkataraman, S.; Liu, D.; Freeman, J.; Tsai, D.; Amde, M.; Owen, S.; et al. MLlib: Machine Learning in Apache Spark. J. Mach. Learn. Res. 2016, 17, 1–7. [Google Scholar]
  16. Quille, R.; Almeida, F.; Ohara, M.; Corrêa, P.; Gomes de Freitas, L.; Alves-Souza, S.; Almeida, J.; Davis, M.; Prakash, G. Architecture of a Data Portal for Publishing and Delivering Open Data for Atmospheric Measurement. Int. J. Environ. Res. Public Health 2023, 20, 5374. [Google Scholar] [CrossRef] [PubMed]
  17. Wandri, R. Prediction of Student Scholarship Recipients Using the K-Means Algorithm and C4.5. Indones. J. Comput. Sci. 2023, 12, 74–88. [Google Scholar] [CrossRef]
  18. Zatwarnicki, K. Providing Predictable Quality of Service in a Cloud-Based Web System. Appl. Sci. 2021, 11, 2896. [Google Scholar] [CrossRef]
  19. Bernstein, D. Containers and Cloud: From LXC to Docker to Kubernetes. IEEE Cloud Comput. 2014, 1, 81–84. [Google Scholar] [CrossRef]
  20. Rak, T. Performance Evaluation of an API Stock Exchange Web System on Cloud Docker Containers. Appl. Sci. 2023, 13, 9896. [Google Scholar] [CrossRef]
  21. Karthikeyan, R. DATA and WEB MINING. Int. Sci. J. Eng. Manag. 2023, 2, 1–6. [Google Scholar] [CrossRef]
  22. Gheisari, M.; Hamidpour, H.; Liu, Y.; Saedi, P.; Raza, A.; Jalili, A.; Rokhsati, H.; Amin, R. Data Mining Techniques for Web Mining: A Survey. Artif. Intell. Appl. 2023, 1, 3–10. [Google Scholar] [CrossRef]
  23. Ishida, A.; Katsuno, Y.; Tozawa, A.; Saito, S. Automatically Refactoring Application Transactions for Microservice-Oriented Architecture. In Proceedings of the 2023 IEEE International Conference on Software Services Engineering (SSE), Chicago, IL, USA, 2–8 July 2023; pp. 210–219. [Google Scholar] [CrossRef]
  24. Oliner, A.; Ganapathi, A.; Xu, W. Advances and Challenges in Log Analysis. Commun. ACM 2012, 55, 55–61. [Google Scholar] [CrossRef]
Figure 1. Accuracy of user action prediction ( e n d p o i n t U r l ) in the group with a variable number of replicas of the stock exchange application ( r e p l G r o u p ). Training data 3600 s and S 1 architecture.
Electronics 12 04408 g001
Figure 2. Accuracy of user activity prediction ( e n d p o i n t U r l ) in the group with a varying number of exchange application replicas ( r e p l G r o u p ). Training data 32400 s and S 1 architecture.
Electronics 12 04408 g002
Figure 3. Accuracy of prediction of user activities ( e n d p o i n t U r l ) in the group manipulating the t T time of the transaction algorithm ( t r a n s G r o u p ). Training data 32400 s and S 1 architecture.
Electronics 12 04408 g003
Figure 4. Accuracy of prediction of user activities ( e n d p o i n t U r l ) in the group manipulating the t T time of the transaction algorithm ( t r a n s G r o u p ). Training data 43200 s and S 1 architecture.
Electronics 12 04408 g004
Figure 5. Prediction accuracy of user actions ( e n d p o i n t U r l ) in the group manipulating the t R of the traffic generator ( r e q G r o u p ). Training data 21600 s and S 1 architecture.
Electronics 12 04408 g005
Figure 6. Prediction accuracy of user actions ( e n d p o i n t U r l ) in the group testing stock market trading strategies ( a l g G r o u p ). Training data 21600 s and S 1 architecture.
Electronics 12 04408 g006
Figure 7. Accuracy of user action predictions ( e n d p o i n t U r l ) in a dataset composed of all groups. Training data 10800 s and S 1 architecture.
Electronics 12 04408 g007
Figure 8. Accuracy of user action predictions ( e n d p o i n t U r l ) in a dataset composed of all groups. Training data 43200 s and S 1 architecture.
Electronics 12 04408 g008
Figure 9. Classification methods of user actions in the a l l G r o u p dataset. Comparison of classifiers based on datasets of two architectures: (a) D e c i s i o n T r e e C l a s s i f i e r , (b) R a n d o m F o r e s t C l a s s i f i e r , (c) X G B o o s t C l a s s i f i e r .
Electronics 12 04408 g009aElectronics 12 04408 g009b
Figure 10. (a,b) DT method, effectiveness of classifying user actions depending on the considered sets and architectures. Detailed data (Table A1). (c,d) RF method, user action classification efficiency depending on the considered datasets and architectures. Detailed data (Table A2). (e,f) XGBoost method, user action classification efficiency depending on the considered datasets and architectures. Detailed data (Table A3).
Electronics 12 04408 g010
Table 1. Types of queries ( e n d p o i n t U r l ) generated by players a .
StrategyA1A2A3
1 d o - r e g i s t e r
2 a d d - s e l l - o f f e r
3 a d d - b u y - o f f e r
4 g e t - s t o c k - d a t a
5 a d d - c o m p a n y
6 g e t - s t o c k - u s e r s - a n d - c o m p a n i e s
a Explanations: A 1 —player with strategy 1—buying and selling shares until all funds are used up; A 2 —player with strategy 2—buying and selling individual shares alternately; A 3 —player with strategy 3—browsing offers.
Table 2. Simulation scenarios for 8 C P U _ 20 R A M ( S 1 ) and 12 C P U _ 30 R A M ( S 2 ) architectures a .
Simulationt (s)RA1A2A3 t R (ms) t T (s)
5 r e p l 3600520000500180
2 r e p l 10,800220000500180
4 r e p l 21,600420000500180
6 r e p l 32,400620000500180
43,200
t r a n s _ 60 s360052000050060
t r a n s _ 120 s10,800520000500120
t r a n s _ 180 s21,600520000500180
t r a n s _ 240 s32,400520000500240
t r a n s _ 300 s43,200520000500300
r e q _ 250 ms3600520000250180
r e q _ 500 ms10,800520000500180
r e q _ 1000 ms21,6005200001000180
r e q _ 2000 ms32,4005200002000180
43,200
A 1 _ 200 - A 3 _ 100 360052000100500180
A 2 _ 200 10,800502000500180
A 2 _ 200 - A 3 _ 100 21,60050200100500180
A 1 _ 100 - A 2 _ 100 - A 3 _ 100 32,4005100100100500180
A 3 _ 200 43,200500200500180
a Explanations: R—number of stock exchange replicas; S 1 —architecture 1, also called 8 C P U _ 20 R A M ; S 2 —architecture 2, also called 12 C P U _ 30 R A M ; A 1 —number of players with strategy 1; A 2 —number of players with strategy 2; A 3 —number of players with strategy 3; T [s]—simulation duration; t R [ms]—time between player queries; t T [s]—time between transaction execution.
Table 3. Attributes of m e t h o d s . c s v file.
ColumnDescription
t i m e s t a m p Timestamp of query execution
a p i T i m e Query duration from the moment it is sent to the exchange until receiving a response (ms)
a p p l i c a t i o n T i m e Query processing time at the exchange (ms)
d a t a b a s e T i m e Query processing time in the database (ms)
e n d p o i n t U r l Name of the API method executed by the user, e.g., registration, retrieval of share offers, etc.
q u e u e S i z e F o r w a r d Number of queries yet to be processed or in progress
q u e u e S i z e B a c k Number of queries waiting in the queue
r e p l i c a I d ID of the exchange application container that processed the query
Table 4. Attributes of s t o c k . c s v file.
ColumnDescription
t i m e s t a m p Timestamp of measurement
c p u U s a g e CPU usage (0.00–1.00) at the container (%)
m e m o r y U s a g e RAM usage (0.00–1.00) at the container (%)
r e p l i c a I d ID of the exchange application container that processed the query
Table 5. Attributes of t r a d i n g . c s v file.
ColumnDescription
t i m e s t a m p Timestamp of the transaction algorithm’s measurement
a p p l i c a t i o n T i m e Transaction duration (ms)
d a t a b a s e T i m e Transaction processing time in the database (ms)
n u m b e r O f S e l l O f f e r s Number of processed share sale offers
n u m b e r O f B u y O f f e r s Number of processed share purchase offers
r e p l i c a I d ID of the exchange application container that executed the transaction
Table 6. Attributes of t r a f f i c . c s v file.
ColumnDescription
t i m e s t a m p Timestamp of measurement on the traffic generator
c p u U s a g e CPU usage (0.00–1.00) in the traffic generator (%)
m e m o r y U s a g e RAM usage (0.00–1.00) in the traffic generator (%)
Table 7. Attributes of m e r g e d . c s v and m e r g e d 2 . c s v files.
ColumnDescription
a p i T i m e Duration of the request from the moment it was sent to the exchange until the response
was received (ms)
a p p l i c a t i o n T i m e Duration of request processing on the exchange (ms)
d a t a b a s e T i m e Duration of request processing in the database (ms)
e n d p o i n t U r l Name of the API method executed by the user, e.g., registration, stock offer retrieval, etc.
q u e u e S i z e F o r w a r d Number of requests not yet processed or currently being processed on the exchange
q u e u e S i z e B a c k Number of requests waiting in line on the exchange
s t _ c p u U s a g e CPU usage (0.00–1.00) on the exchange container (%)
s t _ m e m o r y U s a g e RAM memory usage (0.00–1.00) on the exchange container (%)
t r a d _ a p p l i c a t i o n T i m e Duration of the transaction (ms)
t r a d _ d a t a b a s e T i m e Duration of transaction processing in the database (ms)
t r a d _ n u m b e r O f S e l l O f f e r s Number of processed stock selling offers (transaction algorithm)
t r a d _ n u m b e r O f B u y O f f e r s Number of processed stock buying offers (transaction algorithm)
t r a f _ c p u U s a g e CPU usage (0.00–1.00) on the traffic generator (%)
t r a f _ m e m o r y U s a g e RAM memory usage (0.00–1.00) on the traffic generator (%)
Table 8. Results of discussed classifiers for r e p l G r o u p ( S 1 architecture).
ClassifierTraining SetTest SetTraining TimeRMSEAccuracy (%)
21600 s 1.09368.77
32400 s 1.110813.07
43200 s 1.04468.24
32400 s 3600 s 0:01:16.8158060.831137.22
10800 s 0.533773.04
21600 s 0.422483.23
43200 s 0.476878.65
R a n d o m F o r e s t C l a s s i f i e r 3600 s 10800 s 0:03:20.4660970.616468.00
21600 s 0.966711.06
32400 s 0.835034.62
43200 s 0.968310.95
32400 s 3600 s 0:20:04.9241340.772142.62
10800 s 0.390185.58
21600 s 0.259693.74
43200 s 0.329089.78
X G B o o s t C l a s s i f i e r 3600 s 10800 s 0:02:42.9278810.690958.81
21600 s 0.98208.80
32400 s 0.906824.10
43200 s 0.98748.55
32400 s 3600 s 0:07:03.0888630.760943.76
10800 s 0.334489.43
21600 s 0.226695.22
43200 s 0.273693.00
Table 9. Results of the discussed classifiers for the t r a n s G r o u p ( S 1 architecture).
ClassifierTraining SetTesting SetTraining TimeRMSEAccuracy (%)
D e c i s i o n T r e e C l a s s i f i e r 32400 s 3600 s 0:01:49.5019140.410383.88
10800 s 0.433581.89
21600 s 0.427582.54
43200 s 0.392985.56
43200s 3600 s 0:02:07.5288900.577567.73
10800 s 0.565768.94
21600 s 0.453280.11
32400 s 0.493976.48
R a n d o m F o r e s t C l a s s i f i e r 32400 s 3600 s 0:27:37.1053590.181497.25
10800 s 0.197896.47
21600 s 0.189396.73
43200 s 0.190596.78
43200 s 3600 s 0:31:42.4136600.409483.69
10800 s 0.334489.20
21600 s 0.240094.50
32400 s 0.272292.95
X G B o o s t C l a s s i f i e r 32400 s 3600 s 0:09:29.0156300.169297.48
10800 s 0.177697.13
21600 s 0.174397.20
43200 s 0.179597.06
43200 s 3600 s 0:10:12.4536110.212895.85
10800 s 0.235394.84
21600 s 0.168597.37
32400 s 0.206996.05
Table 10. Classifier results ( 21600 s ) for the r e q G r o u p ( S 1 architecture).
ClassifierTraining SetTesting SetTraining TimeRMSEAccuracy (%)
D e c i s i o n T r e e C l a s s i f i e r 21600 s 3600 s 0:00:29.9459580.416283.99
10800 s 0.336389.91
32400 s 0.440781.97
43200 s 0.340689.84
R a n d o m F o r e s t C l a s s i f i e r 21600 s 3600 s 0:08:32.0006240.239294.83
10800 s 0.227595.46
32400 s 0.230395.36
43200 s 0.248894.69
X G B o o s t C l a s s i f i e r 21600 s 3600 s 0:04:35.1728330.205496.29
10800 s 0.196796.57
32400 s 0.210496.11
43200 s 0.228195.33
Table 11. Classifier results ( 21600 s ) for the a l g G r o u p ( S 1 architecture).
ClassifierTraining SetTesting SetTraining TimeRMSEAccuracy (%)
D e c i s i o n T r e e C l a s s i f i e r 21600 s 3600 s 0:00:36.7429870.482184.04
10800 s 0.642578.59
32400 s 0.609781.53
43200 s 0.638968.67
R a n d o m F o r e s t C l a s s i f i e r 3600 s 0:11:06.4784850.421886.03
10800 s 0.516182.26
32400 s 0.487784.44
43200 s 0.602468.35
X G B o o s t C l a s s i f i e r 3600 s 0:06:47.0014670.385489.17
10800 s 0.460388.14
32400 s 0.436489.13
43200 s 0.538175.46
Table 12. Results of the discussed classifiers for the a l l G r o u p ( S 1 architecture).
ClassifierTraining SetTesting SetTraining TimeRMSEAccuracy (%)
D e c i s i o n T r e e C l a s s i f i e r 10800 s 3600 s 0:03:14.4067780.576372.36
21600 s 0.470582.37
32400 s 0.411786.59
43200 s 0.505178.79
43200 s 3600 s 0:07:52.6607490.814741.71
10800 s 0.724655.95
21600 s 0.533377.54
32400 s 0.605968.14
R a n d o m F o r e s t C l a s s i f i e r 10800 s 3600 s 0:48:06.5794170.463180.88
21600 s 0.360188.66
32400 s 0.256494.57
43200 s 0.423783.41
43200 s 3600 s 2:02:20.1846340.728253.48
10800 s 0.561170.30
21600 s 0.413187.15
32400 s 0.425683.30
X G B o o s t C l a s s i f i e r 10800 s 3600 s 0:17:32.6604200.432583.08
21600 s 0.280293.40
32400 s 0.244395.16
43200 s 0.360788.68
43200 s 3600 s 1:06:06.6650740.729951.04
10800 s 0.565069.26
21600 s 0.375288.29
32400 s 0.436182.07
Disclaimer/Publisher’s Note: The statements, opinions and data contained in all publications are solely those of the individual author(s) and contributor(s) and not of MDPI and/or the editor(s). MDPI and/or the editor(s) disclaim responsibility for any injury to people or property resulting from any ideas, methods, instructions or products referred to in the content.

