Abstract
Several mobility vehicle rental companies have emerged owing to the increased preference for shared mobility as a short-distance transit option. These shared-mobility vehicles must be strategically placed at different locations to enable easy access to customers. However, without prior knowledge of the occurrence of rental demand, it becomes challenging for companies to respond quickly. In this study, we analyzed the factors affecting rental demand for shared electric mobility vehicles by utilizing actual data from the company EV PASS and predicted rental demand to ensure that the vehicles were distributed effectively, allowing customers to receive timely service. We compared the performance of machine learning models such as the Extra Trees regressor, CatBoost regressor, and LightGBM (Light Gradient Boosting Machine) models in predicting the demand for shared mobility vehicles. Additionally, we explored the use of an ensemble technique called voting regressor to reduce errors with an R2 score of 0.7629, it outperformed all the individual models. The analysis revealed that factors including humidity, precipitation, and solar radiation have a significant influence on rental demand. Based on the findings of this study, companies can effectively manage equipment and personnel, providing better shared electric mobility rental services, leading to increased customer satisfaction.
1. Introduction
With the increasing preference for online shopping owing to COVID-19, the retail industry is attempting to establish rapid and reliable delivery systems [1]. For instance, Coupang is investing significant resource and effort in establishing self-operated logistics hubs beyond its “Rocket Delivery” service to provide a faster and more efficient delivery service. Coupang is South Korea’s top unicorn and the country’s leading e-commerce company, having listed on the New York Stock Exchange in early 2021. Founded in 2010, Coupang has grown rapidly since launching a service called Rocket Delivery in 2014. Coupang has built its own logistics centers and courier systems, enabling next-day delivery. The Rocket Delivery service achieved high consumer satisfaction and, consequently, Coupang began to experience rapid growth [2]. Within two months of its launch, Rocket Wow, a service provided by Coupang, surpassed one million members. Fast delivery has increased consumer satisfaction; hence, platforms are likely to compete more fiercely in terms of speed [3]. Coupang utilizes artificial intelligence algorithms to quickly anticipate consumer demand by predicting product inventories, location, and optimal delivery routes. Based on customer order data, it considers factors such as local weather, age, and gender to forecast consumer demand for specific products and strategically places inventories in logistics hubs closer to end consumers, enabling customers even in remote areas to receive fast deliveries, leading to higher customer satisfaction. Satisfied customers are more likely to continue using the services, ensuring the company’s growth.
Due to advancements in information and communication technology, various types of mobility services have evolved. New mobility services such as car sharing, bike sharing, and electric kick scooters have emerged [4]. Recently, micro-mobility services have expanded exponentially, with higher adoption rates than other shared modes such as bike and car sharing. The study by Abduljabbar et al. [5] presented new information and insights about the uptake and early perceptions of shared electric scooters. Micro-mobility refers to small, personal transportation devices designed for short distances, typically accommodating one to two passengers. This category includes electric kick scooters, shared bicycles, electric bicycles, electric skateboards, and Segways. The term “micro” here signifies lightweight, compact size, and generally encompasses short distances. Among micro-mobility options, electric scooters are electrically powered vehicles with handlebars, decks, and wheels [6]. Because of growing concerns about carbon emissions in the transportation sector, there is increasing interest in the environmentally friendly electric mobility industry across many countries. Electric mobility is eco-friendly as it operates on electricity, producing no exhaust emissions. Micro-mobility offers a convenient way to cover distances that might take a long time to walk, making it popular among young users. Additionally, it stands out in terms of parking compared to cars and is gaining attention as a future mode of transportation. The demand for personal mobility devices is increasing worldwide, with an annual growth rate of over 20%, mainly showing strong growth in Republic of Korea. The Korea Transport Institute predicts that the personal mobility market in Korea will be worth around 600 billion KRW in 2022. Among these, electric kick scooters have seen a significant increase due to the prolonged effects of the COVID-19 pandemic [7].
Considering these factors, the micro-mobility-related market is also rapidly growing, leading to the emergence of various companies. To survive in this market, these companies must ensure continuous consumer usage. There may be situations in which rental stations have high return volumes, resulting in a shortage of available parking space. Alternatively, the scarcity of micro-mobility devices in desired locations makes it impossible to rent them. To address these inconveniences, it is essential to predict the appropriate demand, secure an adequate supply of micro-mobility devices in advance, and strategically place them in the required locations.
This study analyzed actual micro-mobility data by visualizing the data through various graphs to explore the correlations between attributes and their relative impact on rental demand. It utilized weather information, such as temperature, humidity, sunlight, and precipitation, as well as weekday and weekend data to train machine learning models and predict the demand for micro-mobility. Performance metrics such as mean absolute error (MAE), mean squared error (MSE), root mean squared error (RMSE), and R2 score were used to compare the performances of the different models. The top three models were selected, and an ensemble model was implemented to improve the prediction accuracy. The goal was to predict the number of micro-mobility devices that can be deployed at rental stations and apply it to real-world services.
The contributions of this study are as follows:
- This study analyzes the factors influencing micro-mobility rental, predicts rental demand using machine learning models, and aims to improve the quality of the rental services provided by companies.
- It compares the performance of various models and presents the model with superior performance. It also proposes an ensemble model to enhance prediction accuracy.
- By implementing the proposed system, micro-mobility service companies can effectively distribute micro-mobility devices in response to user demand, reducing inconvenience. On days with low predicted demand, unrented micro-mobility devices and management resources can be efficiently allocated.
2. Related Work
Predictive studies using machine learning have been conducted in various fields [8], and a few are listed in Table 1. Globally, services that promote vehicle or bicycle sharing are being founded to address the environmental issues caused by carbon emissions and traffic congestion [9]. In this regard, there are numerous demand prediction studies for carbon-free transportation means such as shared bicycles [10]. For example, there is a study related to the battery lifespan of electric mobility devices. In this study, a battery structure based on a digital twin for electric mobility device batteries is proposed [11]. There are also studies analyzing the impact on the demand for bicycles or micro-mobility devices [6,12,13,14]. Brandenburg et al. [15] analyzed the effect of weather conditions on bicycling activity. They analyzed the weather dependence of commuting and recreational cycling. A study used bicycle rental data from New York and Washington D.C. to predict the probability of excess demand using a dynamic cluster-based framework [16]. Several studies have also analyzed the correlation between bike sharing and weather, utilizing statistical forecasting methods and linear regression for prediction [17]. Yang et al. [18] formulated a spatiotemporal bicycle mobility model for efficient relocation strategies for bicycle sharing systems, which, like motorized mobility, suffer from an uneven distribution of bicycles. A previous study aimed at predicting bicycle demand 15 min ahead using a hybrid CNN-LSTM model [19]. Chatterjee et al. [20,21] proposed a method using generative adversarial networks (GANs) to reduce the error in demand prediction for electric scooters. This improved the synthetic time series data generation, resulting in better accuracy. Similar relocation problems have been studied in shared autonomous electric vehicles [22], proposing a passenger demand prediction model using big data from taxis. There is a study on predicting electric vehicle demand to optimize charging at electric vehicle charging stations or to locate charging infrastructure [23]. A study was conducted to identify the characteristics of trip origins in two German cities using random forests [24]. Some studies employ ensemble methods, such as the voting method, to enhance the accuracy of machine learning [25,26]. Studies predicting medical waste in Turkey [27] and short-term energy prediction [28] utilized the ensemble voting models. In Korea, there have been numerous studies analyzing the factors influencing bicycle demand and conducting bicycle demand prediction in regions including Seoul, Sejong City, and Daejeon [29,30,31,32,33,34].

Table 1.
Previous studies in the prediction field.
3. Methodology
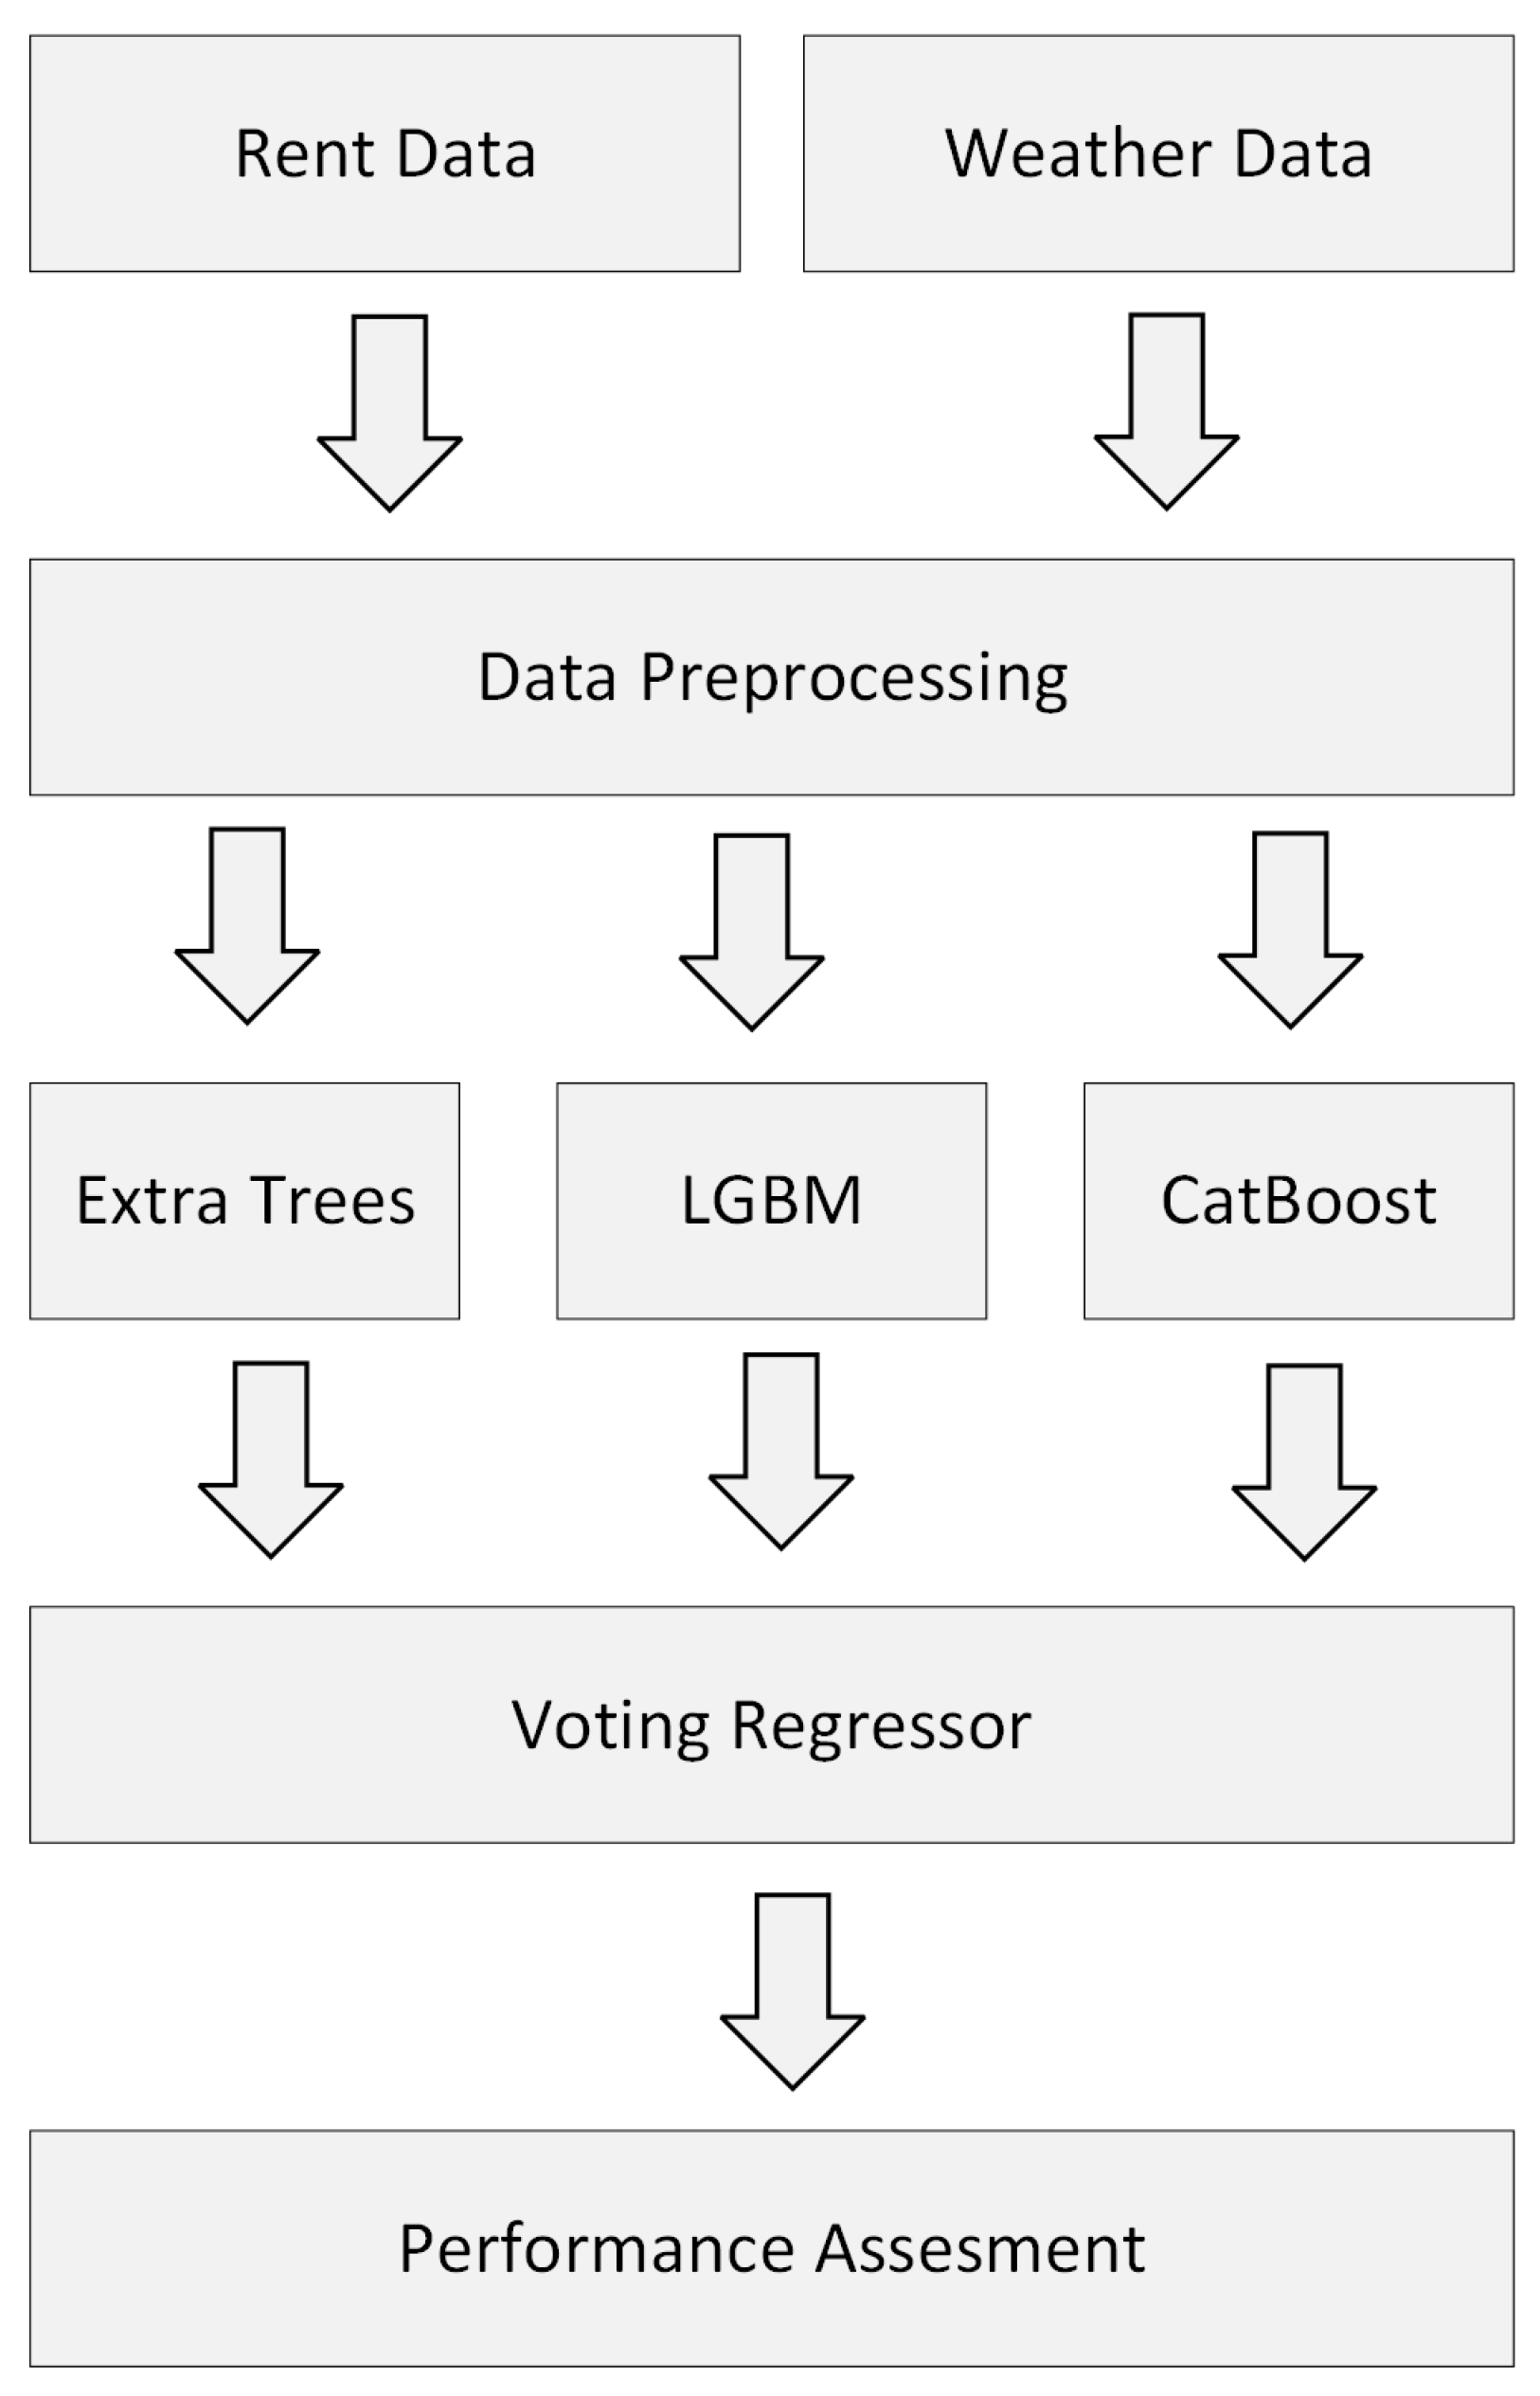
In this section, we describe our proposed methodology. The research flowchart for the proposed method is shown in Figure 1. Micro-mobility rental data and weather data are collected and preprocessed. Through the preprocessed data, we analyze the data by visualizing it in various graphs. After that, the data are separated into a training set and a test set to predict the number of rentals using different machine learning algorithms. After comparing the models through the results, the model with the best performance indicators is selected to create an ensemble model. We have made it work on a server so that an actual mobility rental company can use it.
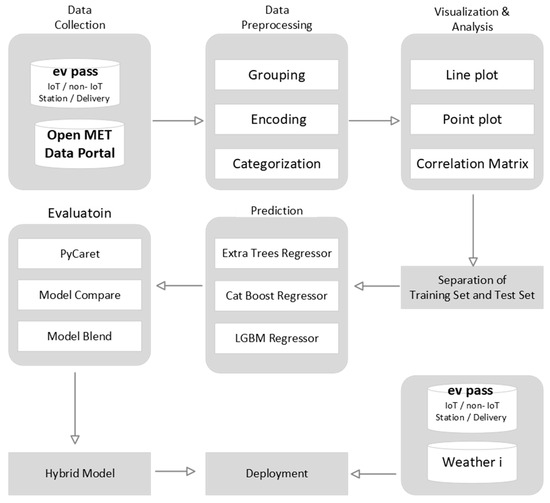
Figure 1.
Overall flowchart for the proposed method.
3.1. Data Description
This section describes the data used in this study. The data comprise the actual rental counts of electric scooters collected from the company EV PASS, a micro-mobility service company in Jeju, with a total of 16,042 data points. Electric scooters are a type of micro-mobility device with a propulsion device added to a traditional manual electric scooter powered by electricity [6]. An electric-scooter-sharing service refers to a service that allows short-term rental of electric scooters [34]. In this study, four types of micro-mobility data were used, as shown in Table 2. Table 3 lists the attributes of the micro-mobility data used in this study. These include the rental station, rental count, rental date, and rental location (x and y coordinates). In Table 3, year, month, and day are the elements of the rental date, respectively, and x pos and y pos are the latitude and longitude of the location where the rental occurred.
Table 2.
Types of mobility service.
Table 3.
Attributes of micro-mobility data.
Table 4 presents the weather data obtained from the Korea Meteorological Administration’s Open Weather Data Portal, using surface observation data. The data include average temperature (°C), daily precipitation (mm), average relative humidity shown as a percentage (%), and total insolation (MJ/m) observed at four stations on Jeju Gosan, Seongsan, and Seogwipo.
Table 4.
Details of the weather data.
3.2. Data Preprocessing
The micro-mobility data described in Table 3 and the weather data in Table 4 are preprocessed and combined to form the total data. Figure 2 shows the data preprocessing process. First, the mobility data and weather data are grouped by date. During the encoding process, weekdays and weekends were encoded as 0 and 1, respectively. In Figure 2, old data refers to data up to the previous day. The data used in this study was updated daily. We preprocessed only the new data that came in that day and added it to the old data to update the entire dataset. The precipitation data has a minimum value of 0 and a maximum value of 174, and we categorized it into seven levels from 0 to 6. The precipitation was categorized as follows: no precipitation was level 0; 1 mm of precipitation was level 1; 1 to 5 mm of precipitation was level 2; 5 to 10 mm of precipitation was level 3; 10 to 15 mm of precipitation was level 4; 15 to 20 mm of precipitation was level 5; and more than 20 mm of precipitation was level 6. The two datasets were then combined to form one complete dataset. Through preprocessing, we processed the data from 16 April 2019 to 11 August 2022, which includes a total of 1141 data instances with ten columns. The result is the experimental dataset shown in Table 5.
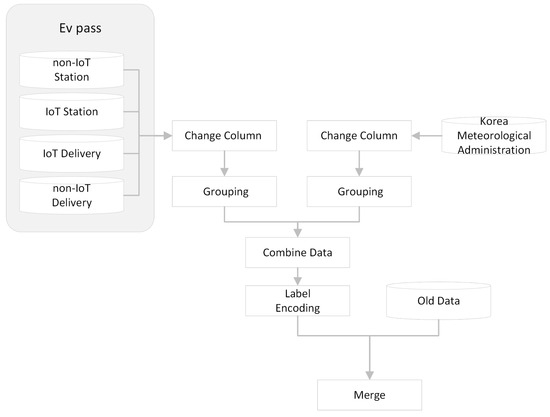
Figure 2.
Data preprocessing process.
Table 5.
Complete dataset.
3.3. Machine Learning Model Description
In this study, we compared the performance of various models using the PyCaret library and selected the top three models, Extra Trees [35], LightGBM [36], and CatBoost [37], based on the performance evaluation scores of MAE, MSE, RMSE, RMSLE, and mean absolute percentage error (MAPE). These three models were used to construct the voting regressor [38] model.
3.3.1. Extra Trees Regressor
The Extra Trees regressor is an ensemble algorithm consisting of multiple decision trees. Although it operates similarly to random forest [39], it builds each decision tree using the entire training set without using duplicate training samples. Additionally, it randomly selects features to prevent overfitting and has increased randomness compared to random forest, which reduces the risk of overfitting and is computationally efficient, resulting in a faster processing speed.
3.3.2. LightGBM Regressor
LightGBM is an ensemble algorithm constituting multiple decision trees. It is a type of gradient-boosting algorithm, where trees are sequentially generated and weighted based on the errors made by the previous trees. Boosting is an algorithm that iteratively improves the model by addressing the errors. LightGBM is based on the GBM algorithm, which uses gradient descent for the weight updates. The LightGBM algorithm employs a leaf-wise growth strategy, in which trees expand vertically, allowing it to further reduce the loss compared to traditional boosting algorithms. Additionally, LightGBM is known for its high processing speed.
3.3.3. CatBoost Regressor
The CatBoost algorithm is an improvement over the traditional boosting algorithm called ordered boosting. Gradient-boosting algorithms are prone to overfitting, which is a critical drawback. CatBoost addresses this issue while improving the training speed compared with other GBM-based algorithms such as XGBoost and LightGBM. Additionally, using the ordered boosting technique, CatBoost addresses target leakage, a common problem in gradient-boosting algorithms. This prevents the reuse of previously used data when creating the next tree, which mitigates the risk of overfitting.
3.3.4. Voting Regressor
This ensemble method involves creating multiple models and combining their predictions to derive more accurate predictions [38]. The ensemble models complement the weaknesses of individual models by combining them. Voting is a method where results produced by different algorithms are determined through voting. Voting regression is an ensemble method that combines different types of regression models to yield the average predicted value. Unlike bagging, each base model in the voting regression is trained on the entire dataset, and the final prediction is determined based on a combination of these predictions [25]. The process flow of the voting regressor method is depicted in Figure 3. There are two types of voting: hard voting and soft voting. The hard voting method selects the most voted result from each algorithm’s output. In contrast, the soft voting method finds the probability of each algorithm’s output and adds them together to produce an average. This method selects the highest result among the averages. In this work, we adopted the soft voting method.
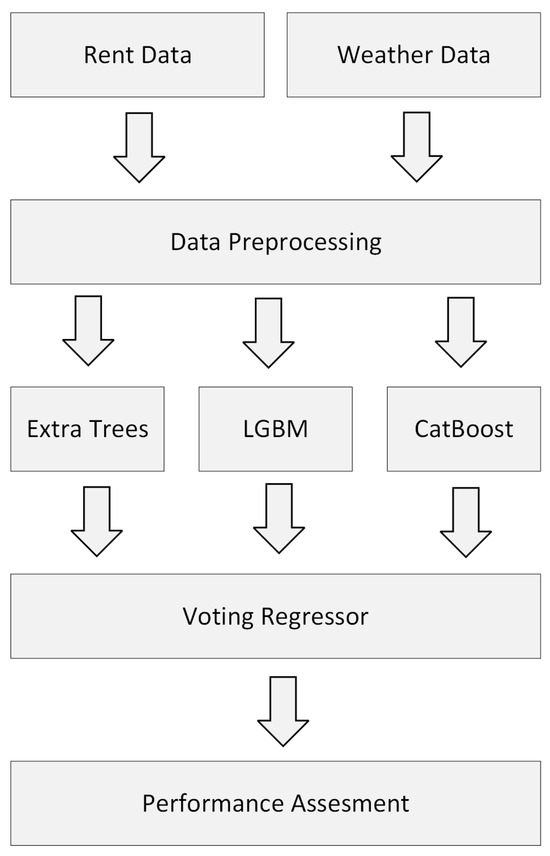
Figure 3.
Voting regressor process.
4. Results
4.1. System Environment
This study was conducted in a system environment where we used Intel i7-8700 3.20 GHz CPU and RAM with 16 GB. The operating system ran on the Windows 10 Pro environment. The versions of Python and PyCaret used in this study were 3.8.13 and 3.0.4, respectively.
4.2. Performance Evaluation Indicators
For demand prediction, the MSE, obtained by squaring the difference between the actual and predicted values, MAE, obtained by converting the difference between the actual and predicted values into absolute values, RMSE rooted in MSE, and R2 score were used as evaluation indicators. The coefficient of determination represents the accuracy of the regression equation and is computed using the ratio of the sum of the squares regression (SSR) to the sum of squares error (SSE). The closer the coefficient of determination is to 1, the better the model.
Equation (1) represents the MSE, Equation (2) represents the MAE, and Equation (3) represents the RMSE used to calculate different metrics to evaluate the performance of a model. Equations (4)–(7) provide detailed formulas for calculating the R2 score. SSE represents the sum of the squared errors obtained by squaring the differences between the predicted and actual values. SSR represents the sum of the squared deviations between the predicted values and the mean of the dependent variable Y. The sum of squares total (SST) is the sum of the SSE and SSR. This quantifies the total variability in the dependent variables. Finally, Equation (7) represents the R2 score, calculated as the ratio of SSE to SST, and indicates the proportion of the total variability in the dependent variable that the regression model explains.
4.3. Data Analysis and Visualization
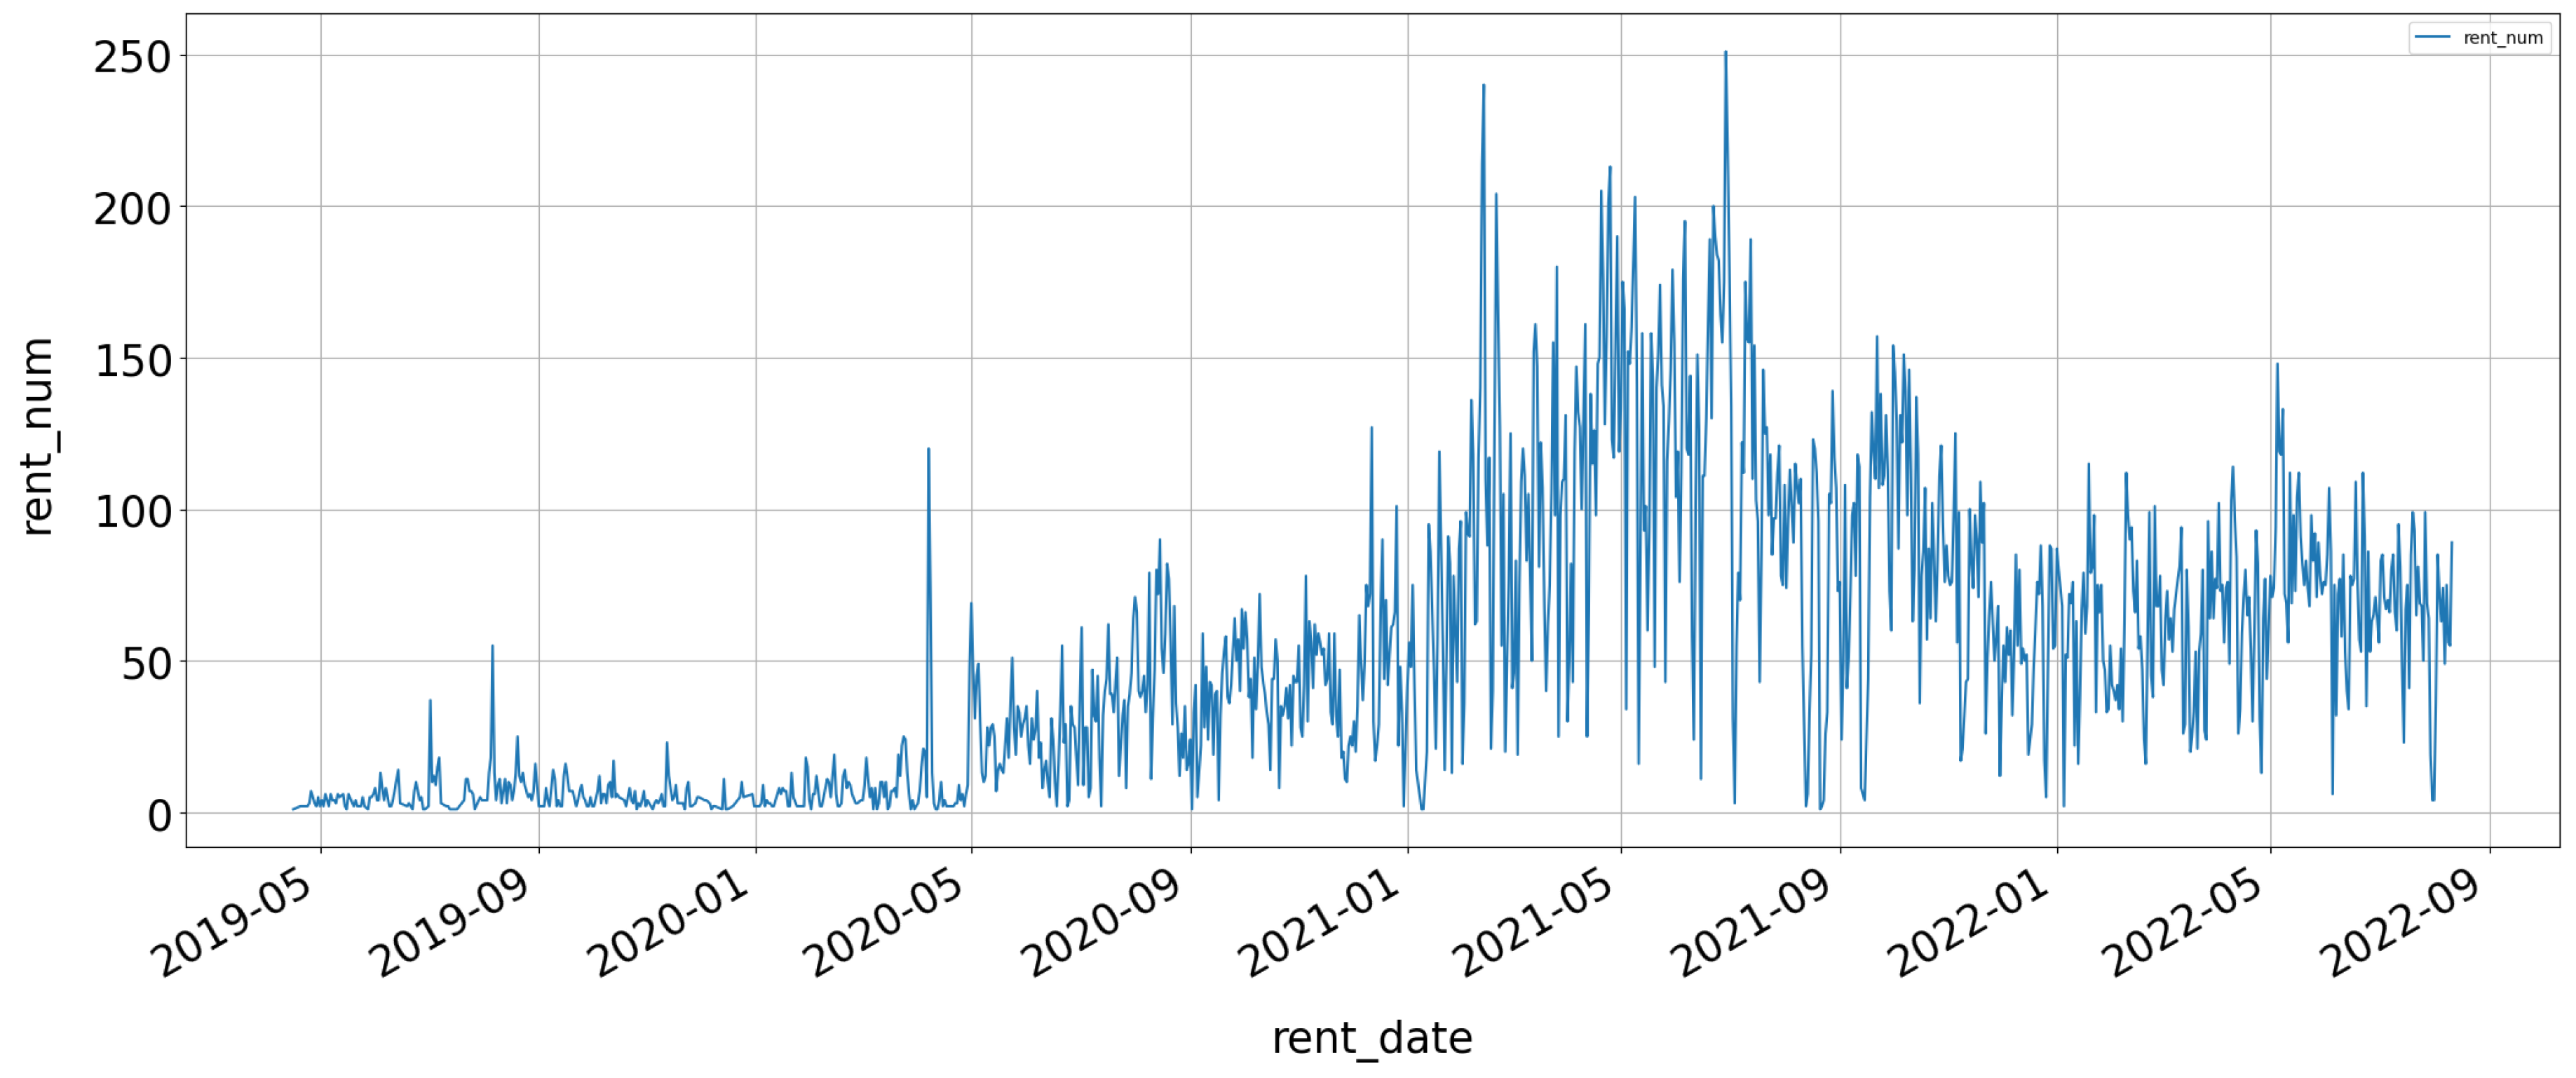
The data were composed of 1141 instances and 10 columns (full date, year, month, days, number of rentals, temperature, precipitation, humidity, insolation, and weekends). Figure 4 shows the number of rentals from April 2019 to August 2022 for the entire data period. The number of rows was 1141, the average was 52 to 53, the minimum value was 1, and the maximum value was 251. The x-axis represents the date and the y-axis represents the number of rentals.
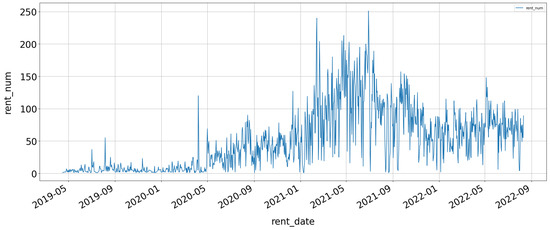
Figure 4.
Rental counts over the entire period.
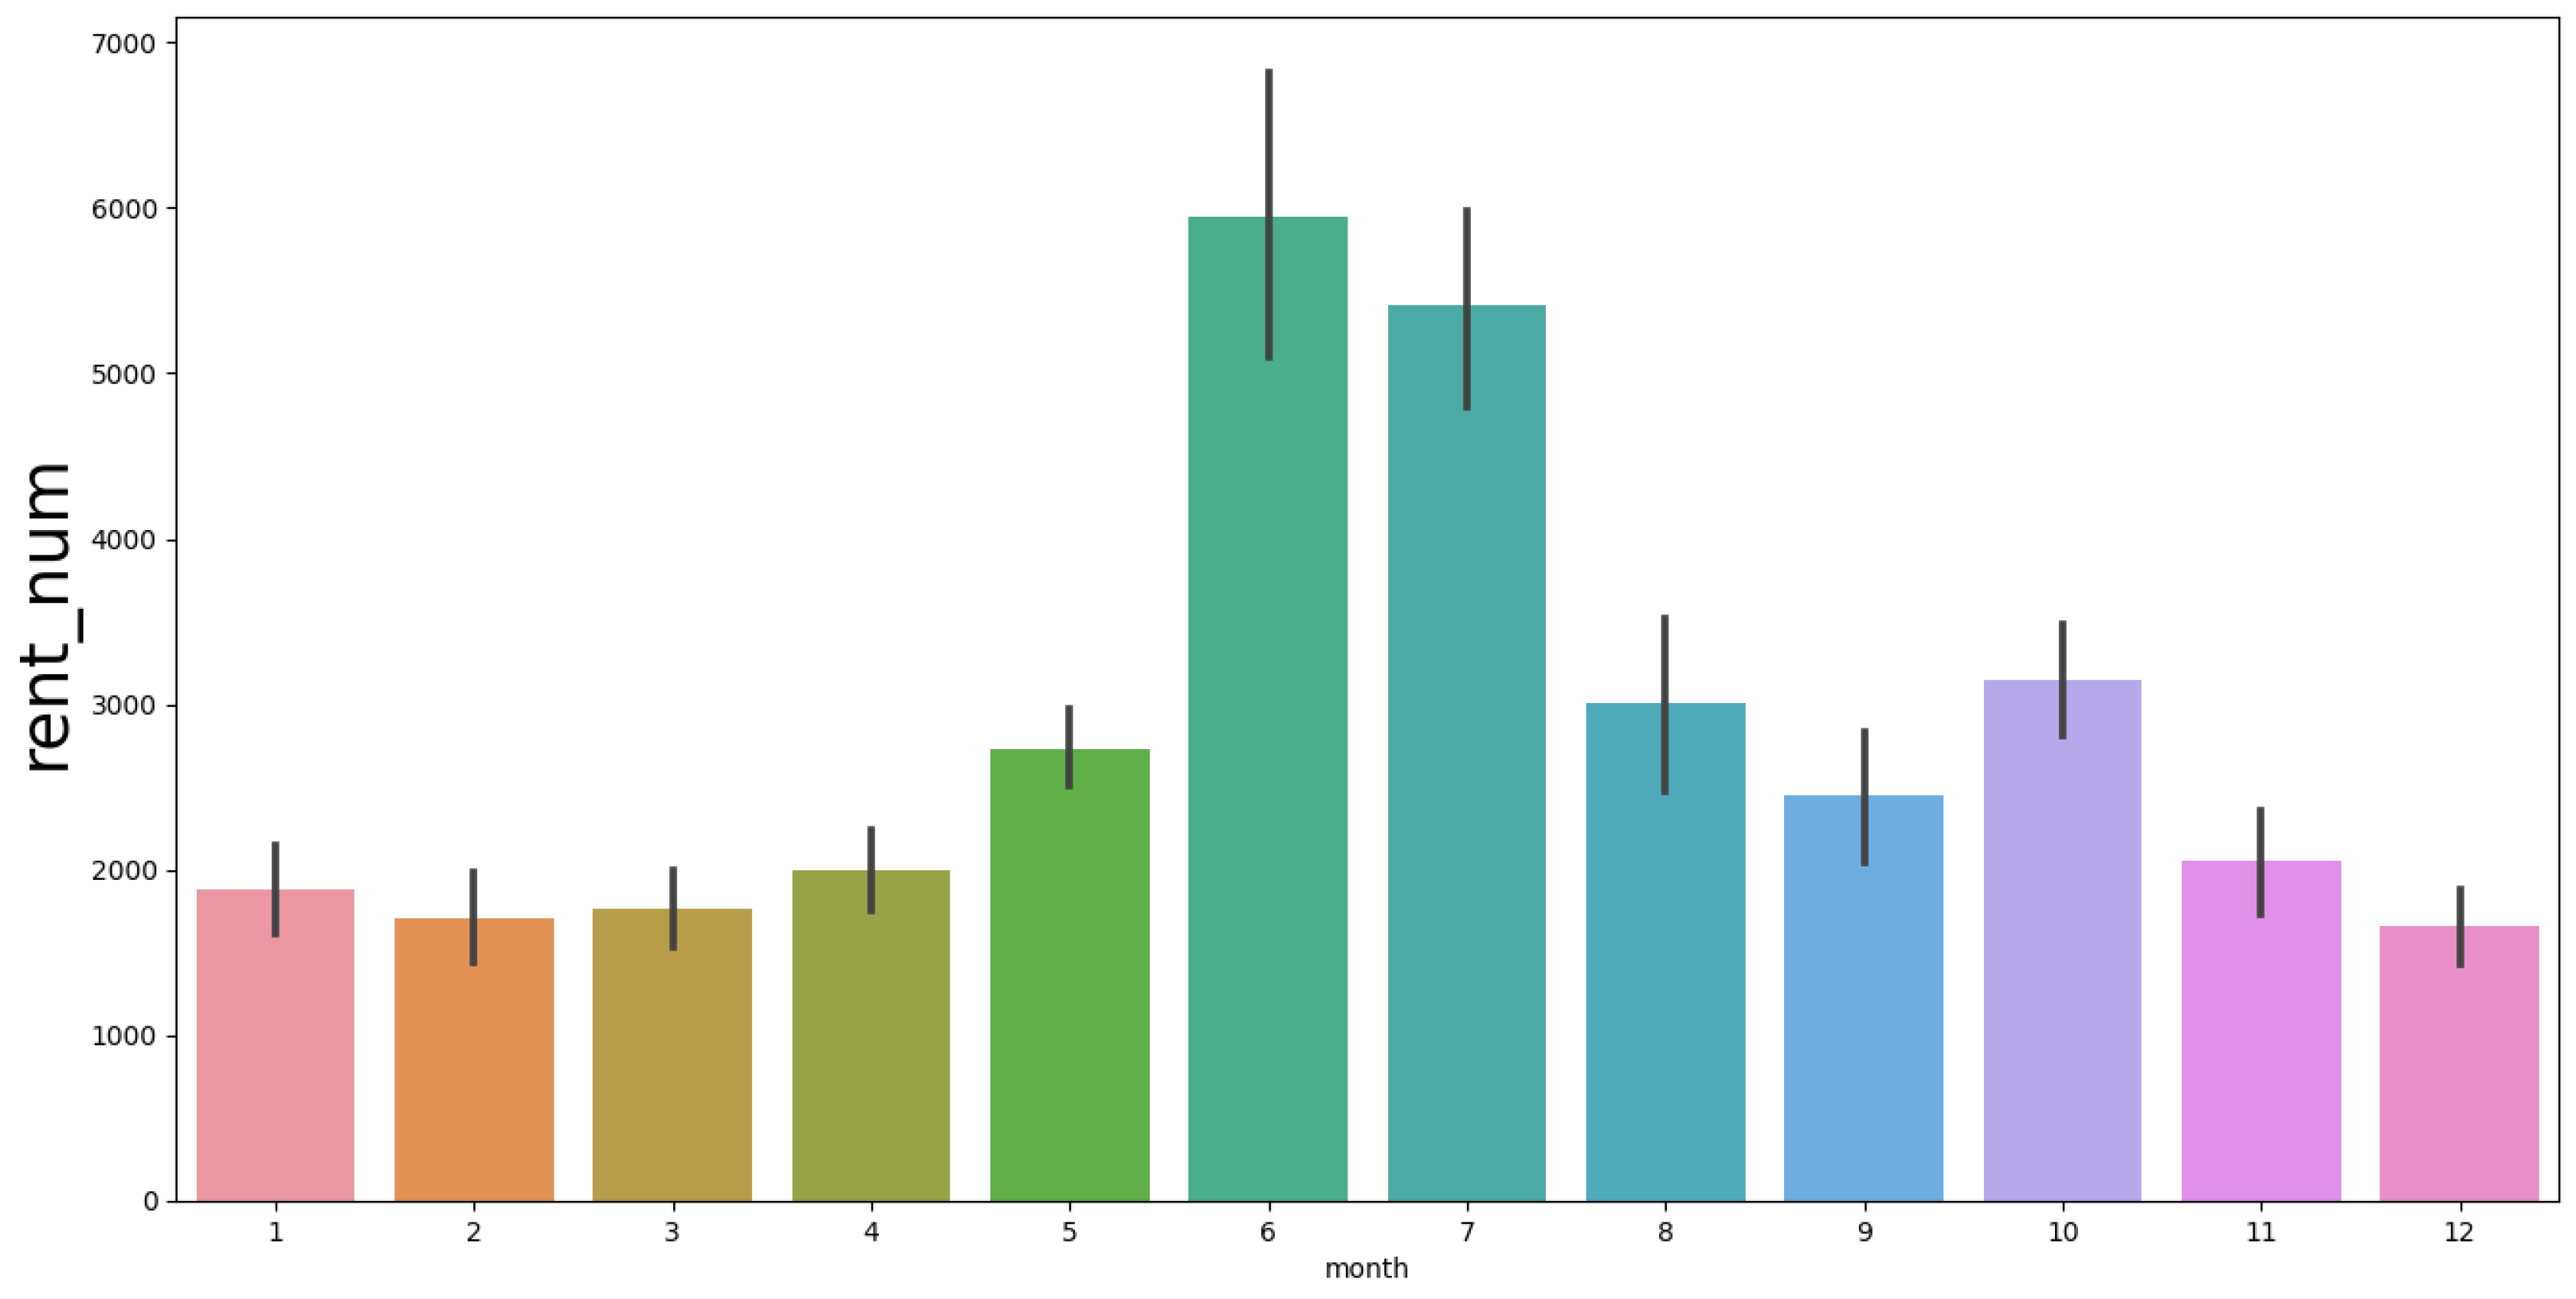
Figure 5 presents the total monthly rental counts, and it can be observed that June and July had the highest rental counts.
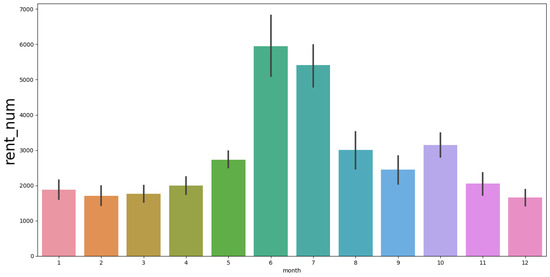
Figure 5.
Total sum of rental counts per month.
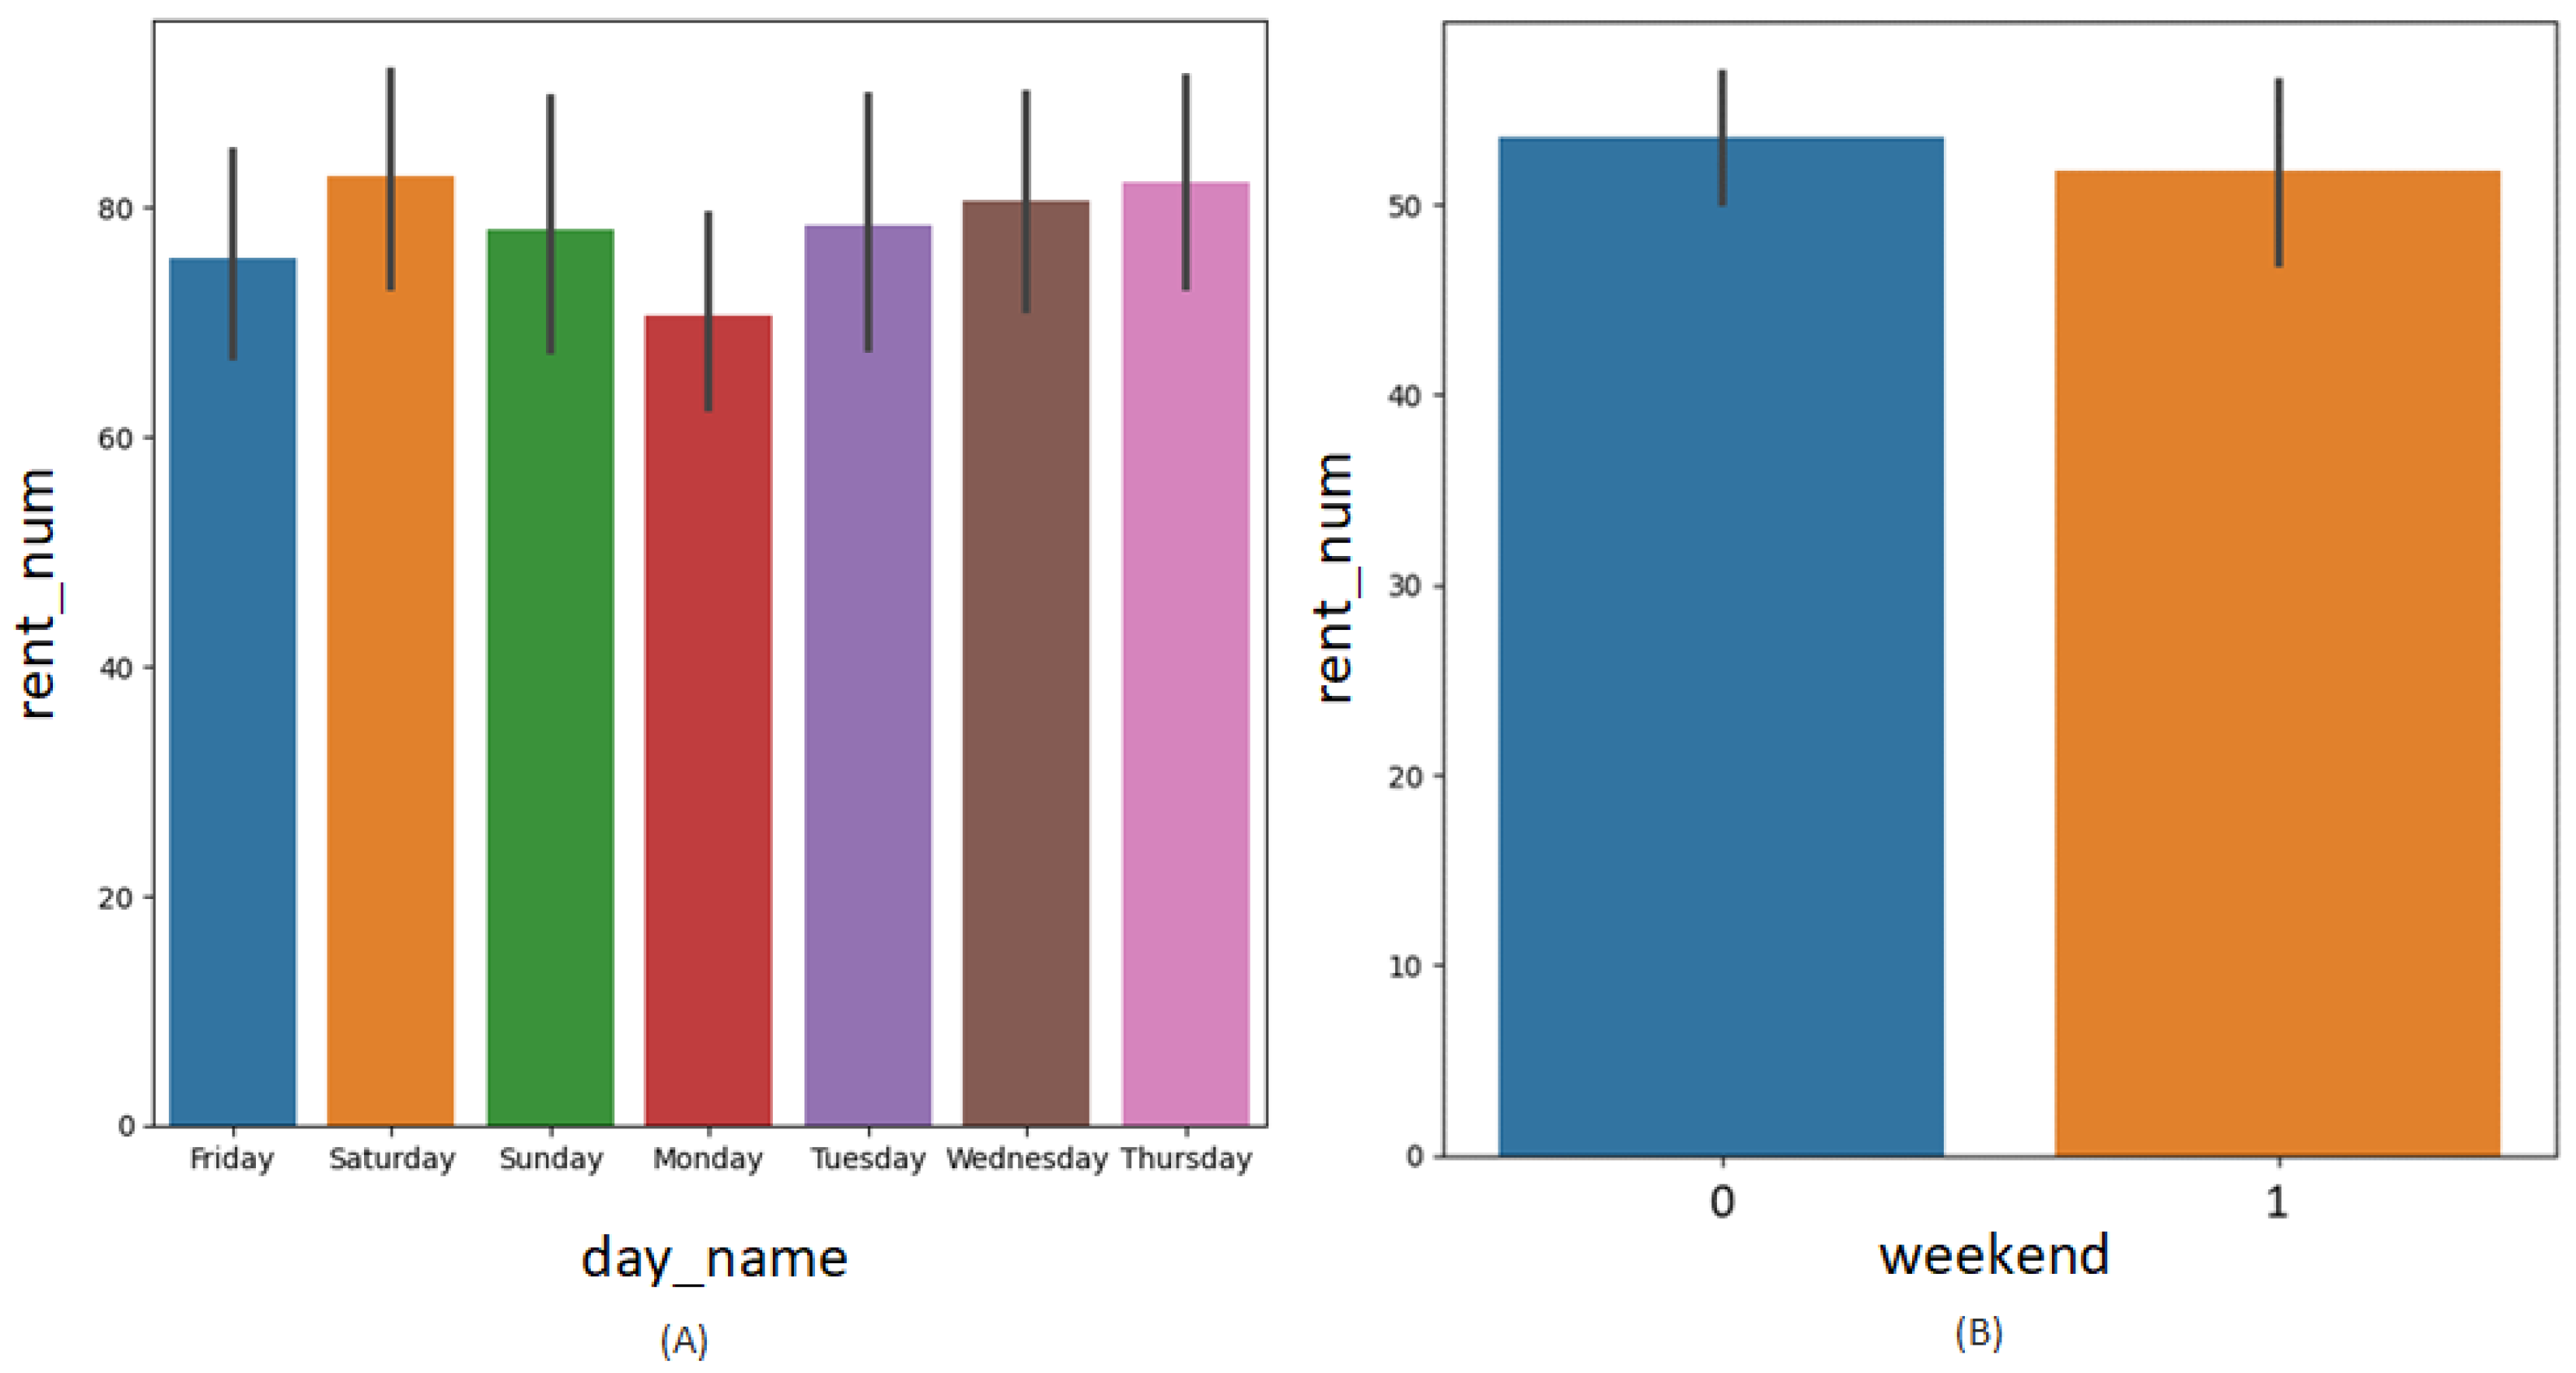
Figure 6 shows the average number of rentals per day of the week. According to Figure 6A, the number of rentals was highest on Thursdays out of the weekdays and Saturdays in the weekend. Figure 6B shows the average number of rentals depending on weekends, represented by 1, and weekdays, represented by 0. It can be seen that the average number of rentals is slightly higher on weekdays.
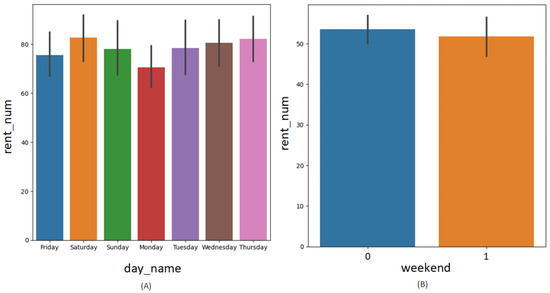
Figure 6.
Average number of rentals by day of the week: (A) daily basis and (B) comparison of weekdays over weekend.
Figure 7 is a heatmap of the correlation between all variables over the entire period. Here, we can see the correlation between the number of micro-mobility rentals and the nabber variable. It can be observed that solar insolation, precipitation, and temperature have a great influence on the number of micro-mobility rentals. Table 6 lists the top four features with the highest correlation separately for summer and winter. Analyzing the characteristics affecting the number of rentals by season shows that the important factors affecting the number of rentals are different in summer and winter.
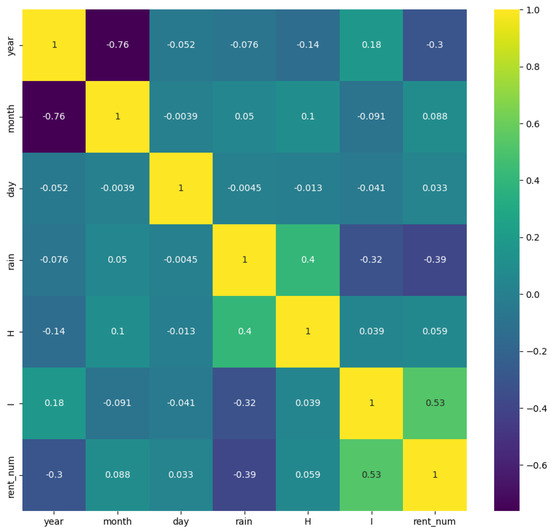
Figure 7.
Heatmap over the entire period.
Table 6.
Correlation table by summer/winter.
4.4. Separation of Training Sets and Test Sets
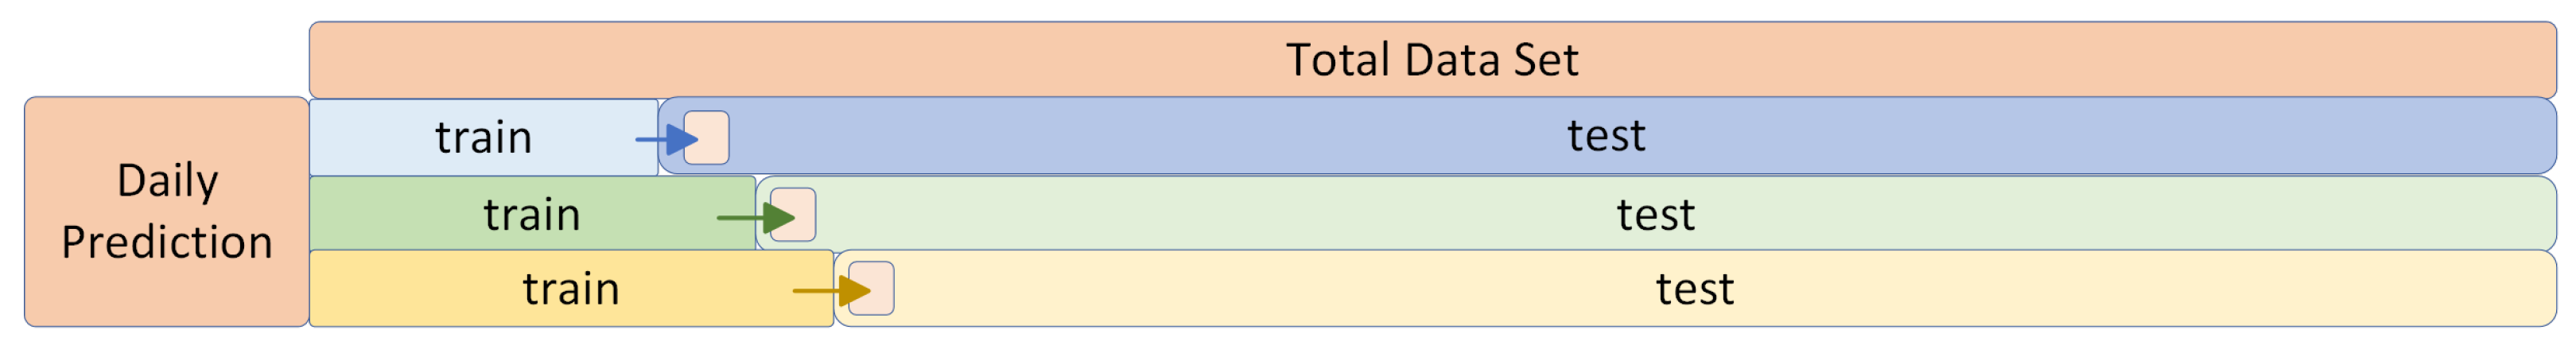
In this study, 1141 days of data were available, and testing was conducted starting from the 200th day. The daily training approach was used, where all the data up to the previous day were utilized as testing data to predict the rental counts for the next day or for two days later, up to 10 days ahead.
Figure 8 illustrates the daily training method. For example, data from 16 April 2019 to 10 August 2022 were used as the testing set to forecast the rental counts for 11 August 2022. The input data for the prediction include the rental date (year, month, day), weekend indicator, temperature, rainfall, insolation, and humidity.
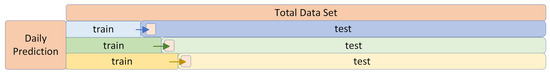
Figure 8.
Training/test splitting method.
4.5. Machine Learning and Testing Results
Table 7 presents the results of the micro-mobility rental prediction using the machine learning algorithms. The performance indicators of the R2 score, MAE, MSE, and RMSE show that the score of the ensemble voting regressor outperforms the scores of other regression models. A voting regressor model employing the voting ensemble technique was used to combine the results obtained from the different algorithms and select the final outcome. The proposedmodel showed improved performance, with an MAE of 16.3187, MSE of 501.4068, RMSE of 22.3921, and R2 score of 0.7629. This shows performance improvements of 1.14%, 1.76%, 3.26%, and 1.64% over the best-performing single model.
Table 7.
Comparison of different machine learning algorithms’ results.
5. Discussion and Conclusions
This study utilized the actual rental data of micro-mobility on Jeju Island across all regions. It was observed that the rental volume was higher during summer than during winter. The rental volume was most influenced by factors such as insolation, precipitation, and humidity during the summer and temperature during the winter. It was observed that the highest rental counts were seen on clear days at temperatures ranging from 15 °C to 25 °C, without rainfall. Furthermore, no significant difference was observed in the average rental counts on weekends and weekdays, with the values being 54 and 52, respectively
Based on the results, various factors influencing rental counts were identified for rental count prediction. The study employed several models, including the Extra Trees regressor, LGBM regressor, and CatBoost regressor models, to predict the micro-mobility rentals. Additionally, a voting regressor model, which combines these individual models, was proposed for rental count prediction. Based on the R2 score in this study, we found that the voting regressor, CatBoost, Extra Trees, and LightGBM all performed well, in this order. Furthermore, the voting regressor model exhibited a 1.13% improvement in performance over the CatBoost regressor model, which was the best-performing single model. This suggests that the voting regressor model outperformed the single models. Currently, micro-mobility demand is predicted for Jeju Island region. It is necessary to divide the region and compare and analyze areas that have a higher demand. In the future, accurate rental predictions can be achieved by collecting more environmental information.
Additionally, incorporating event information, such as election days or an alternative holiday into the prediction process would yield better results. The current dataset covers approximately three years, including the initial period of the business. Furthermore, the overall distribution of micro-mobility vehicles was not consistent in the midterm of the business, which appears to have affected rental demand. Reliable predictions can be made once the business environment has stabilized. Conducting model research to determine the optimal combination of different models can also enhance prediction accuracy. While the current focus is on predicting the demand for the entire Jeju Island, future studies can focus on demand prediction at a more granular level. By appropriately distributing and allocating the micro-mobility vehicles based on these regional predictions, it is possible to enhance user satisfaction and increase the sales volume.
Author Contributions
Conceptualization, J.K.; formal analysis, J.K.; funding acquisition, Y.-C.B.; methodology, J.K.; writing—review and editing, J.K.; investigation, Y.-C.B.; resources, Y.-C.B.; project administration, Y.-C.B.; supervision, Y.-C.B. All authors have read and agreed to the published version of the manuscript.
Funding
This result was supported by “Regional Innovation Strategy (RIS)” through the National Research Foundation of Korea (NRF) funded by the Ministry of Education (MOE). This work was also financially supported by the Ministry of Trade, Industry & ENERGY (MOTIE) through the fosteringproject of The Establishment Project of Industry-University Fusion District.
Conflicts of Interest
The authors declare no conflict of interest.
Abbreviations
The following abbreviations are used in this manuscript:
| RF | Random forest |
| CNN-LSTM | Convolutional neural network–long short-term memory |
| GBM | Gradient-boosting machine |
| SVM | Support vector machine |
| ETR | Extra tree regressor |
| XGBoost | Extreme gradient boosting |
| GPS | Global Positioning System |
| KRW | Korean Won |
References
- Kang, S.; Hyun, B. A study on Key Factors of Delivery Service Quality Affecting Online Shopping Mall Loyalty: Focusing on Coupang’s Rocket Delivery. Korean Mark. Rev. 2021, 36, 49–77. [Google Scholar]
- Park, J.; Lee, T. Obstacles that the Development of the Courier Service in Relation to Delivery War of Social Commerce with a Case Study on Rocket Delivery of Coupang. Korean Manag. Consult. Rev. 2016, 16, 173–184. [Google Scholar]
- [Delivery War of Money] Coupang Shakes the Plate…Dreaming of a Korean Version of Amazon. 2020. Available online: https://www.inews24.com/view/1313451 (accessed on 4 November 2020).
- Shibayama, T.; Emberger, G. New mobility services: Taxonomy, innovation and the role of ICTs. Transp. Policy 2020, 98, 79–90. [Google Scholar] [CrossRef]
- Abduljabbar, R.L.; Liyanage, S.; Dia, H. The role of micro-mobility in shaping sustainable cities: A systematic literature review. Transp. Res. Part Transp. Environ. 2021, 92, 102734. [Google Scholar] [CrossRef]
- Bozzi, A.D.; Aguilera, A. Shared E-scooters: A review of uses, health and environmental impacts, and policy implications of a new micro-mobility service. Sustainability 2021, 13, 8676. [Google Scholar] [CrossRef]
- Personal Mobility…What Is the Homework for ‘Eco-Friendly Transportation’? 2023. Available online: http://www.greenpostkorea.co.kr/news/articleView.html?idxno=129834 (accessed on 3 August 2021).
- Khan, P.W.; Byun, Y.C.; Lee, S.J.; Park, N. Machine learning based hybrid system for imputation and efficient energy demand forecasting. Energies 2020, 13, 2681. [Google Scholar]
- Galatoulas, N.F.; Genikomsakis, K.N.; Ioakimidis, C.S. Analysis of potential demand and costs for the business development of an electric vehicle sharing service. Sustain. Cities Soc. 2018, 42, 148–161. [Google Scholar] [CrossRef]
- Ai, Y.; Li, Z.; Gan, M.; Zhang, Y.; Yu, D.; Chen, W.; Ju, Y. A deep learning approach on short-term spatiotemporal distribution forecasting of dockless bike-sharing system. Neural Comput. Appl. 2019, 31, 1665–1677. [Google Scholar] [CrossRef]
- Jafari, S.; Byun, Y.C. Prediction of the Battery State Using the Digital Twin Framework Based on the Battery Management System. IEEE Access 2022, 10, 124685–124696. [Google Scholar] [CrossRef]
- El-Assi, W.; Salah Mahmoud, M.; Nurul Habib, K. Effects of built environment and weather on bike sharing demand: A station level analysis of commercial bike sharing in Toronto. Transportation 2017, 44, 589–613. [Google Scholar] [CrossRef]
- Mathew, J.K.; Liu, M.; Bullock, D.M. Impact of weather on shared electric scooter utilization. In Proceedings of the 2019 IEEE Intelligent Transportation Systems Conference (ITSC), Auckland, New Zealand, 27–30 October 2019; pp. 4512–4516. [Google Scholar]
- Tin Tin, S.; Woodward, A.; Robinson, E.; Ameratunga, S. Temporal, seasonal and weather effects on cycle volume: An ecological study. Environ. Health 2012, 11, 1–9. [Google Scholar] [CrossRef] [PubMed]
- Brandenburg, C.; Matzarakis, A.; Arnberger, A. Weather and cycling—A first approach to the effects of weather conditions on cycling. Meteorol. Appl. J. Forecast. Pract. Appl. Train. Tech. Model. 2007, 14, 61–67. [Google Scholar] [CrossRef]
- Chen, L.; Zhang, D.; Wang, L.; Yang, D.; Ma, X.; Li, S.; Wu, Z.; Pan, G.; Nguyen, T.M.T.; Jakubowicz, J. Dynamic cluster-based over-demand prediction in bike sharing systems. In Proceedings of the 2016 ACM International Joint Conference on Pervasive and Ubiquitous Computing, Heidelberg, Germany, 12–16 September 2016; pp. 841–852. [Google Scholar]
- Gebhart, K.; Noland, R.B. The impact of weather conditions on bikeshare trips in Washington, DC. Transportation 2014, 41, 1205–1225. [Google Scholar] [CrossRef]
- Yang, Z.; Hu, J.; Shu, Y.; Cheng, P.; Chen, J.; Moscibroda, T. Mobility modeling and prediction in bike-sharing systems. In Proceedings of the 14th Annual International Conference on Mobile Systems, Applications, and Services, Singapore, 26–30 June 2016; pp. 165–178. [Google Scholar]
- Mehdizadeh Dastjerdi, A.; Morency, C. Bike-sharing demand prediction at community level under COVID-19 using deep learning. Sensors 2022, 22, 1060. [Google Scholar] [CrossRef]
- Chatterjee, S.; Byun, Y.C. A Synthetic Data Generation Technique for Enhancement of Prediction Accuracy of Electric Vehicles Demand. Sensors 2023, 23, 594. [Google Scholar] [CrossRef]
- Chatterjee, S.; Byun, Y.C. Generating Time-Series Data Using Generative Adversarial Networks for Mobility Demand Prediction. Comput. Mater. Contin. 2023. [Google Scholar] [CrossRef]
- Kim, S.; Lee, U.; Lee, I.; Kang, N. Idle vehicle relocation strategy through deep learning for shared autonomous electric vehicle system optimization. J. Clean. Prod. 2022, 333, 130055. [Google Scholar] [CrossRef]
- Yi, Z.; Liu, X.C.; Wei, R. Electric vehicle demand estimation and charging station allocation using urban informatics. Transp. Res. Part Transp. Environ. 2022, 106, 103264. [Google Scholar] [CrossRef]
- Zwick, F.; Axhausen, K.W. Ride-pooling demand prediction: A spatiotemporal assessment in Germany. J. Transp. Geogr. 2022, 100, 103307. [Google Scholar] [CrossRef]
- Chen, S.; Luc, N.M. RRMSE Voting Regressor: A weighting function based improvement to ensemble regression. arXiv 2022, arXiv:2207.04837. [Google Scholar]
- Lim, H.; Chung, K. Development of demand forecasting model for seoul shared bicycle. J. Korea Contents Assoc. 2019, 19, 132–140. [Google Scholar]
- Erdebilli, B.; Devrim-İçtenbaş, B. Ensemble Voting Regression Based on Machine Learning for Predicting Medical Waste: A Case from Turkey. Mathematics 2022, 10, 2466. [Google Scholar] [CrossRef]
- Phyo, P.P.; Byun, Y.C.; Park, N. Short-term energy forecasting using machine-learning-based ensemble voting regression. Symmetry 2022, 14, 160. [Google Scholar] [CrossRef]
- Yun, S.; Min, K.; Ko, H. Spatio-Temporal Patterns of a Public Bike Sharing System in Seoul-Focusing on Yeouido District. J. Korean Inst. Landsc. Archit. 2020, 48, 1–14. [Google Scholar] [CrossRef]
- Do, M.; Noh, Y.S. Analysis of the affecting factors on the bike-sharing demand focused on Daejeon City. KSCE J. Civ. Environ. Eng. Res. 2014, 34, 1517–1524. [Google Scholar]
- Lee, H.; Baek, K.; Chung, J.H.; Kim, J. Factors affecting heterogeneity in willingness to use e-scooter sharing services. Transp. Res. Part D Transp. Environ. 2021, 92, 102751. [Google Scholar] [CrossRef]
- Min, J.; Mun, H.; Lee, Y. Demand forecast for public bicycles (“Tashu”) in Daejeon using random forest, Kor. Infor. Sci. Soc. 2017, 2017, 969–971. [Google Scholar]
- Ham, S.W.; Cho, J.H.; Park, S.; Kim, D.K. Spatiotemporal demand prediction model for e-scooter sharing services with latent feature and deep learning. Transp. Res. Rec. 2021, 2675, 34–43. [Google Scholar] [CrossRef]
- Shaheen, S.; Cohen, A. Shared Micromoblity Policy Toolkit: Docked and Dockless Bike and Scooter Sharing. 2019. [Google Scholar] [CrossRef]
- Geurts, P.; Ernst, D.; Wehenkel, L. Extremely randomized trees. Mach. Learn. 2006, 63, 3–42. [Google Scholar] [CrossRef]
- Ke, G.; Meng, Q.; Finley, T.; Wang, T.; Chen, W.; Ma, W.; Ye, Q.; Liu, T.Y. Lightgbm: A highly efficient gradient boosting decision tree. Adv. Neural Inf. Process. Syst. 2017, 30, 3149–3157. [Google Scholar]
- Prokhorenkova, L.; Gusev, G.; Vorobev, A.; Dorogush, A.V.; Gulin, A. CatBoost: Unbiased boosting with categorical features. arXiv 2018, arXiv:1706.09516. [Google Scholar]
- Ren, Y.; Zhang, L.; Suganthan, P.N. Ensemble classification and regression-recent developments, applications and future directions. IEEE Comput. Intell. Mag. 2016, 11, 41–53. [Google Scholar] [CrossRef]
- Breiman, L. Random forests. Mach. Learn. 2001, 45, 5–32. [Google Scholar] [CrossRef]


Disclaimer/Publisher’s Note: The statements, opinions and data contained in all publications are solely those of the individual author(s) and contributor(s) and not of MDPI and/or the editor(s). MDPI and/or the editor(s) disclaim responsibility for any injury to people or property resulting from any ideas, methods, instructions or products referred to in the content. |
© 2023 by the authors. Licensee MDPI, Basel, Switzerland. This article is an open access article distributed under the terms and conditions of the Creative Commons Attribution (CC BY) license (https://creativecommons.org/licenses/by/4.0/).