Article

Fault Detection in Solar Energy Systems: A Deep Learning Approach

by
Zeynep Bala Duranay
Electrical-Electronics Engineering Department, Technology Faculty, Firat University, Elazig 23119, Turkey
Electronics 2023, 12(21), 4397; https://doi.org/10.3390/electronics12214397
Submission received: 2 October 2023 / Revised: 20 October 2023 / Accepted: 23 October 2023 / Published: 24 October 2023
(This article belongs to the Special Issue Advances of Artificial Intelligence and Vision Applications)

Abstract

:
While solar energy holds great significance as a clean and sustainable energy source, photovoltaic panels serve as the linchpin of this energy conversion process. However, defects in these panels can adversely impact energy production, necessitating the rapid and effective detection of such faults. This study explores the potential of using infrared solar module images for the detection of photovoltaic panel defects through deep learning, which represents a crucial step toward enhancing the efficiency and sustainability of solar energy systems. A dataset comprising 20,000 images, derived from infrared solar modules, was utilized in this study, consisting of 12 classes: cell, cell-multi, cracking, diode, diode-multi, hot spot, hot spot-multi, no-anomaly, offline-module, shadowing, soiling, and vegetation. The methodology employed the exemplar Efficientb0 model. From the exemplar model, 17,000 features were selected using the NCA feature selector. Subsequently, classification was performed using an SVM classifier. The proposed method applied to a dataset consisting of 12 classes has yielded successful results in terms of accuracy, F1-score, precision, and sensitivity metrics. These results indicate average values of 93.93% accuracy, 89.82% F1-score, 91.50% precision, and 88.28% sensitivity, respectively. The proposed method in this study accurately classifies photovoltaic panel defects based on images of infrared solar modules.

1. Introduction

Energy consumption is increasing daily, due to factors such as industrialization and population growth. Sustaining equilibrium between supply and demand necessitates an augmentation in energy generation. Consequently, renewable energy is assuming a progressively more significant role on a global scale. The convenient accessibility of renewable energy sources in a local context, coupled with their plentiful supply, diminishes reliance on foreign resources for fulfilling energy requirements, consequently enhancing energy security for nations. An additional rationale for selecting renewable energy sources lies in their eco-friendliness. Due to their lower emissions of greenhouse gases compared to fossil fuels, the heightened adoption of renewable energy leads to a reduction in environmental pollution. Solar energy does not contribute to global warming or harm ecosystems, thereby assisting in the maintenance of ecological balance. In summary, solar energy is a valuable tool in mitigating climate change, which is essential for protecting the well-being of all life forms. In order to address climate change, the use of environmentally friendly renewable energy has become a mandatory requirement, as outlined in the Paris Climate Agreement, which was signed at the end of the 2015 United Nations Climate Change Conference (COP21) [1]. Hence, renewable energy plays a crucial role in attaining sustainable development objectives and securing a stable and sustainable future. Within the realm of renewable energy options, photovoltaic (PV) systems are gaining increasing traction. PV panels, constructed from semiconductor materials, employ a technology that transforms solar radiation into electricity. As sunlight strikes the panel, free electrons within the semiconductor material become mobile, generating an electrical current. As Figure 1 illustrates, PV modules come into existence by integrating solar cells in series and parallel connections. PV panels are formed by merging these modules, and PV arrays are shaped by linking the panels together in both series and parallel arrangements. In essence, solar power plants are created through the combination of these arrays.
The appeal of PV systems lies in their simplicity of energy conversion, resilience, ease of upkeep, and the universal accessibility of sunlight. These factors enhance the utility of PV systems. As a result of the growing fascination with PV systems, this field has witnessed a proliferation of research endeavors. Literature-based investigations have two goals: first, to improve the use of PV systems by finding their strengths, and second, to make sure that PV system designs take into account the evaluation of parameters that affect their performance. This helps to improve PV system efficiency through various research and development initiatives. Numerous research efforts are dedicated to exploring the capacity for harnessing solar energy effectively across diverse geographical regions [2,3]. These investigations delve into the benefits of solar energy, its contributions to energy generation, and the global viability of solar power. Several studies explore the mechanisms of energy generation via PV systems and the conversion of solar energy into various energy forms [4,5,6,7,8]. Solar energy is a favorable energy source due to its straightforward conversion into diverse forms. Solar energy can be harnessed for a range of applications, including heating water, space heating, food drying, soil solarization, and more. However, the most prevalent application of solar energy conversion is in the production of electrical energy. Furthermore, within the literature, there are investigations that identify environmental variables influencing the power production efficiency of PV systems at their outputs, and analyze the impacts of these variables [9,10,11,12]. According to these research findings, factors such as temperature, solar irradiance, shading, cleanliness, and others play significant roles in influencing the performance of PV systems. The elevation in temperature leads to an increase in the temperature of the PV system, resulting in an augmentation of the short-circuit current within the solar cell and a concurrent reduction in the voltage level. Solar photovoltaic (PV) systems generate electricity when sunlight hits solar cells. The amount of sunlight that hits the PV system, called irradiance, has a positive impact on system performance. As irradiance increases, so does the power output of the PV system and, in contrast, PV system performance has a negative correlation with increasing temperature [13]. Other factors that can affect PV system performance include the cleanliness of the PV panels and the presence of shading. Dirty PV panels and shading can reduce the amount of sunlight that reaches the solar cells, which can lead to a decrease in system performance. The variation in energy production by PV systems due to environmental conditions is a significant factor in efficiency analysis. The effects of different defects that occur in solar panels for various reasons, examples of which are shown in Figure 2, have an impact on the system performance, as do environmental conditions. Solar panel defect classification is carried out in order to detect and classify defects in the production, installation, and operation processes of PV panels.
There have been many studies conducted for this purpose [14,15,16,17,18,19,20,21,22,23,24,25,26,27,28,29,30]. In the studies, dust, hot spots, cracking, shadowing, etc. are defined as solar panel defects. This study aims to detect such situations.

Related Studies

Defective solar panels can cause frequent failures. This will reduce the reliability of the PV system and also increase the operating cost. In addition, it will cause errors in energy estimation. Also, from a safety perspective, defective solar panels can lead to electrically hazardous situations or fire. In summary, defects in PV panels negatively affect system efficiency and performance. To prevent these negativities, solar panel defects must be detected early [14]. In a study conducted to detect sensor-based solar panel defects, solar cell crack mechanisms were examined using electroluminescence, thermography, and laser Doppler vibrometry [15]. A study has also been conducted by examining the parameters of the panels with the dynamic current–voltage characteristic using the real-coded Jumping Gene Genetic Algorithm [16].
Sensors are used in studies to detect solar panel defects; however, image-based systems are mostly preferred. Pierdicca et al. conducted a general literature review on the subject of applied image pattern recognition in PV systems [17]. In the study performed by Shihavuddin et al., 3336 thermal images were studied and deep convolutional neural networks and VGG-16 net were used to predict the distortions in PV cells [18]. EfficentDet (D0 to D5), YOLOv3, YOLOv4, and YOLOv5 networks have been used with CNN architecture in damage detection with object detection methods in PV and wind turbines, and an average sensitivity of 0.79 was obtained in the research performed by Yahya et al. [19]. An article by El-Banby et al., presents a review of different classifications of PV faults and fault detection techniques [20]. It covers both qualitative and quantitative approaches, including condition if-then rules, decision trees, statistical methods, and machine learning. In addition, a new method is presented by Amaral et al. [21], for fault diagnosis in the trackers of PV systems based on a machine learning approach. The method utilizes image processing techniques and principal component analysis for fault detection in PV tracking systems. Abubakar et al. also proposes a novel method of fault detection in PV arrays and inverter faults by utilizing an Elman neural network (ENN), boosted tree algorithms (BTA), and statistical learning techniques [22]. In the study performed by Kellil et al. [23], a fault detection system for classifying faults in PV modules is proposed. The method utilizes deep neural net-works and infrared images for fault diagnosis. The research paper written by Eltuhamy et al. presents a fault detection and classification method for CIGS thin-film PV modules using an adaptive neuro-fuzzy inference scheme [24]. A study by Memon et al. [25] presents an intelligent model to detect faults in the PV panels. The proposed model for robust classification of PV panel faults utilizes the convolutional neural network (CNN), which is trained on historic data. Chen et al. introduce a sequential fault detection algorithm for PV systems based on autoregressive models and generalized local likelihood ratio (GLLR) tests. The proposed method aims to achieve high adaptivity and fast detection of various types of faults in PV systems [26]. Additionally, a paper by Ramirez et al. introduces a new efficient and low-cost condition monitoring system based on radiometric sensors [27]. The method utilizes image processing techniques for fault detection and diagnosis in PV panels. Tang et al. [28] proposed a two-layer solution to detect problematic areas from the images obtained using an orthotile-based georeferenced spatial heat map. An average mIoU of 93.44% was achieved with the proposed model.
Novelties: The Efficientb0 exemplar model introduces significant advancements compared to traditional deep learning models through an innovative approach. This model employs innovations such as depth wise separable convolution, particularly aimed at supporting deep feature extraction distinct from conventional CNN architectures. As a result, it offers a more efficient feature extraction process and facilitates faster execution with lower computational resources. Furthermore, the customized Efficientb0 model, trained with the dataset, has been enhanced to be more effective in detecting photovoltaic system faults.
Contributions: The results obtained in this study demonstrate the significant contributions of a novel approach toward the analysis of data captured by UAV (unmanned aerial vehicle) systems with medium or long-wave infrared imaging capabilities, which have a resolution of 24 × 40 pixels. Initially, infrared solar module images with dimensions of 224 × 224 pixels have been converted into smaller patches of 56 × 56 pixels in order to be processed more efficiently and to shorten processing times. This approach paved the way for more effective handling of image data. Subsequently, a unique feature extraction strategy was developed utilizing the Efficientb0 architecture to process the data obtained from these 56 × 56 pixel patches. This approach focused on extracting distinctive features, resulting in the extraction of a total of 17,000 features. The fundamental advantage of this method lies in its ability to reduce data size while preserving important features. In conclusion, this study offers an effective method for feature extraction from infrared solar module images, potentially enhancing their usability in photovoltaic panel image analysis and fault detection applications. Furthermore, it may serve as a guiding framework for future research endeavors. This research contributes to the field of feature extraction from infrared solar module images, advancing developments in this domain.

2. Materials and Methods

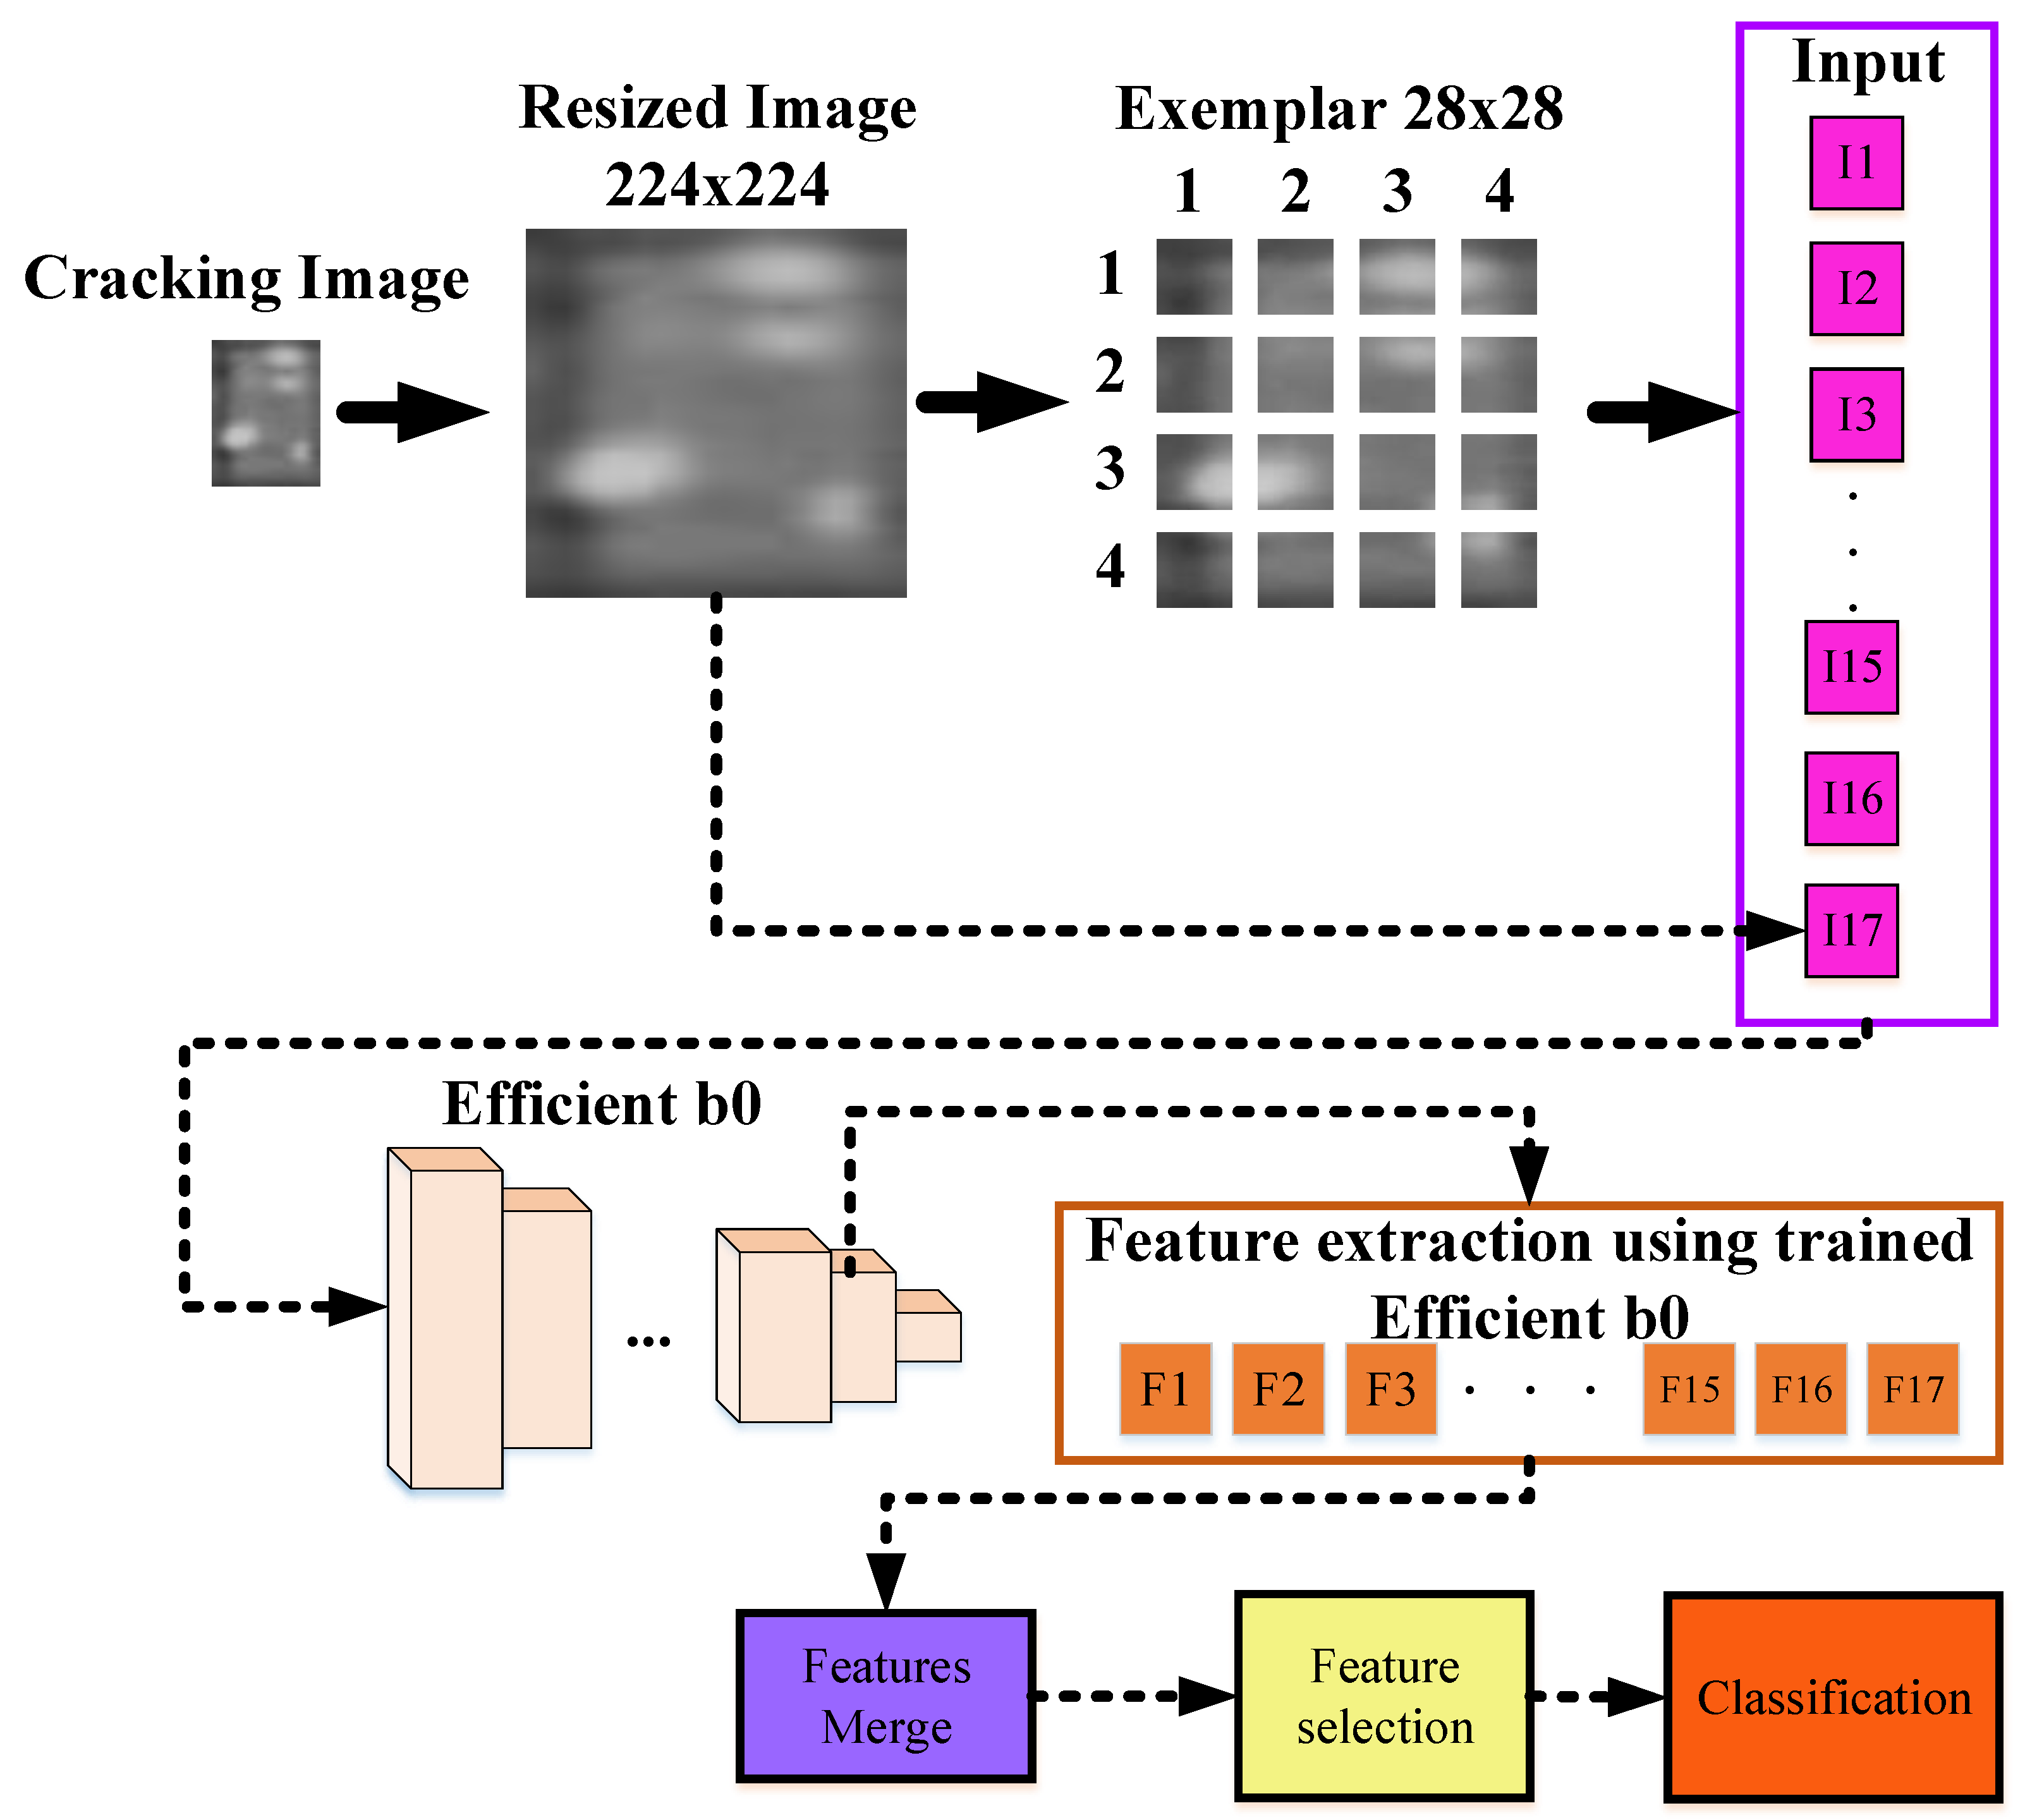
2.1. Proposed Method

In this study, the use of an artificial intelligence model is proposed to detect faults in photovoltaic panels. The study was conducted on a dataset consisting of images obtained from infrared solar modules, and the proposed model relies on deep learning techniques, with the Efficientb0 model as its primary foundation. The proposed model is structured into six distinct steps: Firstly, in the initial stage, the images in the dataset were resized from 24 × 40 dimensions to 224 × 224. Subsequently, end-to-end training on the dataset using the Efficientb0 model was carried out. For further refinement, the images in the dataset were divided into smaller 56 × 56-sized patches and employed fully connected layers to extract features from each of these patches. The features extracted from these 56 × 56 patches, along with those from 16 example images of the same size and the original image, were combined, resulting in a total of 17,000 features. To enhance feature selection, the NCA feature selector was employed. Finally, the selected features were classified using support vector machines (SVM) in conjunction with a 10-fold cross-validation algorithm.
A graphical representation of the proposed Efficientb0 model can be found in Figure 3.

2.2. EfficientNet B0

Tan et al. [29] introduced the EfficientNet family of networks in 2019. These networks employ a specialized scaling strategy to achieve better performance with fewer parameters. Amongst this family, EfficientNet B0 stands as the foundational and lightest model. EfficientNet B0 amalgamates various components intended to increase learning capacity while minimizing computational cost. These components optimize factors such as the depth, width, and resolution of the network. Consequently, even in scenarios with smaller datasets and lower computational resources, EfficientNet B0 can deliver good performance. EfficientNet utilizes a depth scale coefficient to scale the depth of the network’s layers while appropriately scaling other parameters. This facilitates the network in acquiring increased learning capacity. The width scale is employed to scale the width of the network at each layer, augmenting its feature richness without necessitating a proliferation of learning parameters. The resolution of images is also scaled in EfficientNet, enabling the network to perform more effectively with inputs of varying resolutions.

2.3. Classification

Support vector machines (SVMs) [30,31,32,33,34,35] are one of the most frequently used powerful supervised learning methods in classification and regression analyses. Compared to other classification methods, SVMs offer several advantages, making them a preferred choice. The most significant advantage of SVMs in classification problems is their ability to treat the classification task as an optimized problem. Additionally, their ability to handle irregular data sets is noteworthy. This allows SVMs to effectively classify complex data with the use of an appropriate kernel function and handle high-dimensional data. SVMs utilize non-linear mapping to transform data into another dimension. This mapping is performed by using hyperplanes to separate the data effectively. In other words, these hyperplanes, drawn to separate data points, define decision boundaries. SVMs work by maximizing these hyperplanes to best separate classes, ensuring that the margin (distance) between two classes is maximized. SVMs have diverse application areas, including handwriting recognition, object recognition, and speaker identification, among many others. SVMs are effective not only when data can be linearly separated but also when dealing with complex datasets where linear separation is not feasible. However, in cases where data cannot be linearly separated, SVMs employ a kernel function to transform data into a higher-dimensional space. Selecting an appropriate kernel function can be a challenging task, and there is no one-size-fits-all kernel function for every dataset. Additionally, when working with large datasets, SVMs may have extended training times. In conclusion, SVMs are a powerful tool for addressing classification and regression problems, but careful selection of parameters and kernel functions may be required. The SVM hyperparameters are provided below:
  • Kernel function: Quadratic. The quadratic kernel function is a type of kernel function used in SVMs. It allows the transformation of the feature space to a higher dimension, which can help capture complex relationships between data points.
  • Kernel scale: Automatic. The kernel scale determines the spread of the kernel function. When set to “Automatic”, the algorithm automatically determines an appropriate scale based on the input data.
  • Box constraint level: 1. The box constraint, also known as the regularization parameter (C), controls the balance, maximizing the margin between support vectors and minimizing classification errors.
  • Multi-class method: One-Versus-One. In multi-class classification, this method decomposes the problem into a series of binary classification tasks.
  • Standardize data: Standardizing the data ensures that the input features have a mean of zero and a variance of one.

2.4. Feature Selection
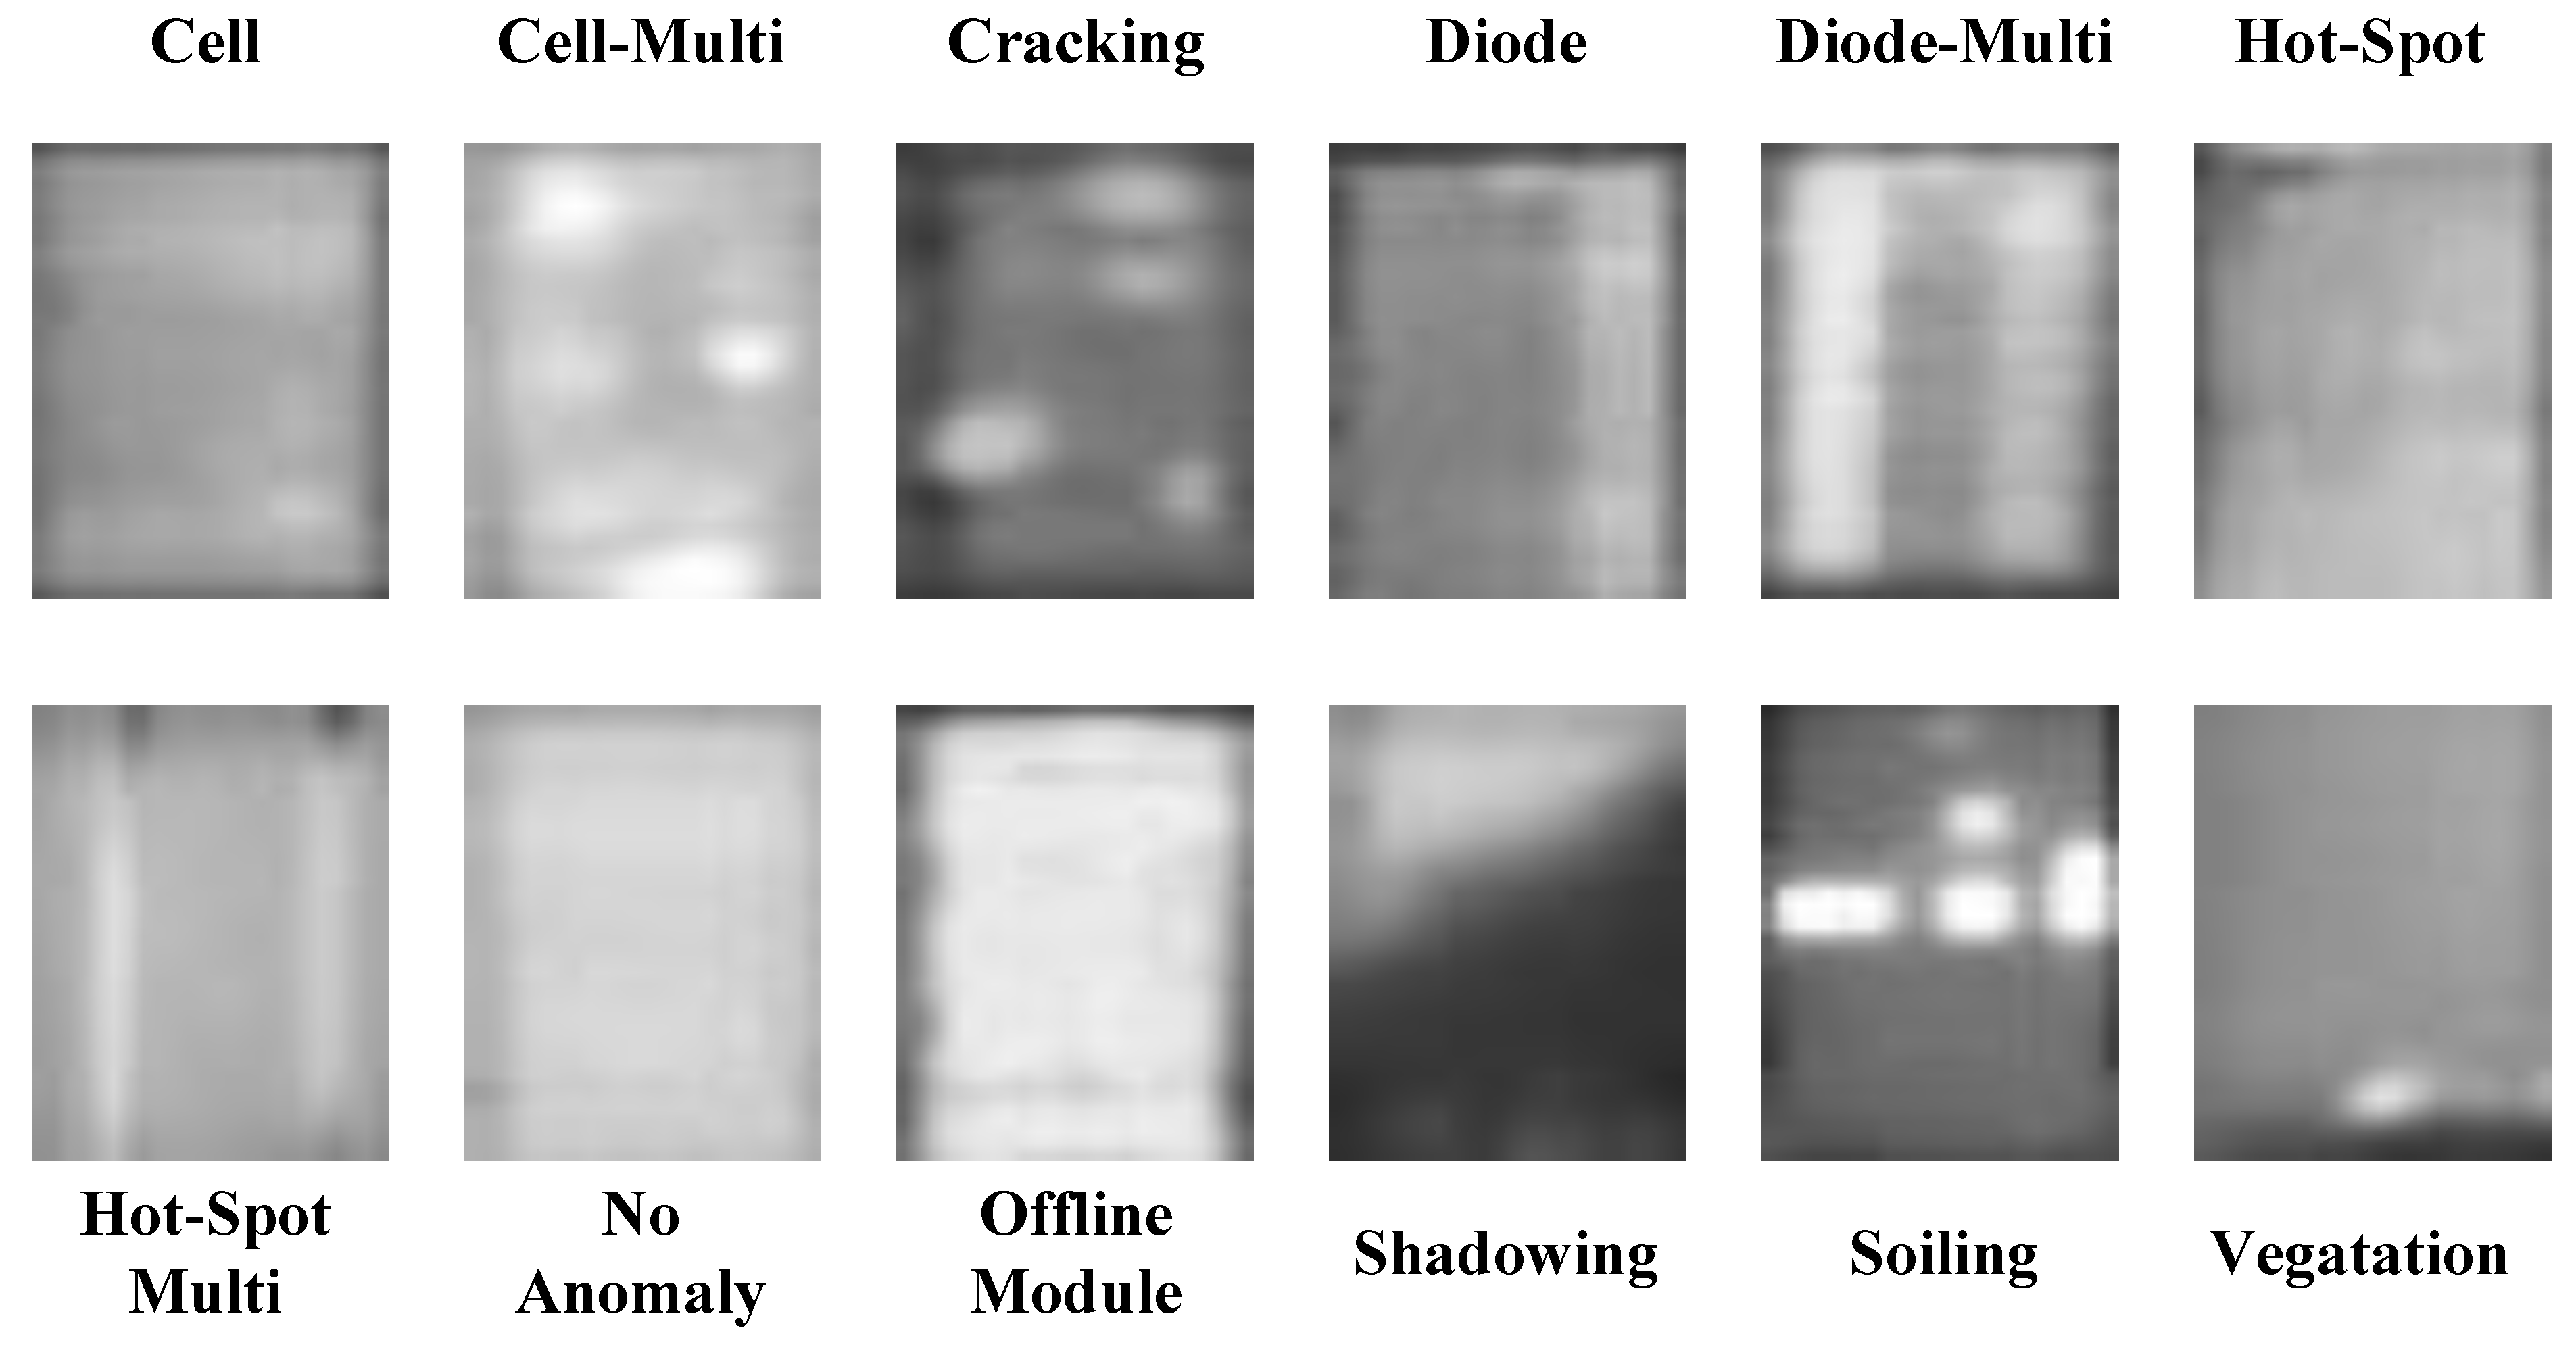
Neighborhood component analysis (NCA) [36,37], a supervised learning approach, is employed for feature selection. Its fundamental objective is to identify and select features within the dataset that best differentiate between classes. NCA operates on the principle of maximizing class separability. In other words, it is used to pinpoint the most valuable features for enhancing the precision and accuracy of the classification process. This procedure ensures that the features accurately reflect the distinctions between classes. NCA primarily focuses on maximizing the separability of classes. It aims to make the classification process more precise and accurate by selecting the most beneficial features. This process enables the features to best represent the differences between classes. NCA operates by evaluating the relationships between each data point in the dataset and all other data points. Each data point is assigned a weighting based on its relationships with neighboring points. These weights measure the contributions of features and reflect their ability to differentiate between classes. NCA utilizes these weights to determine which features are of greater significance. In summary, neighborhood component analysis is a supervised learning method used for feature selection. Its core objective is to enhance class separability by identifying and selecting the most informative features. NCA achieves this by assessing the relationships between data points and assigning weights to each data point based on its neighbors. These weights quantify the contributions of features and their discriminative power in separating classes.

2.5. Dataset

In this study, images from the Infrared Solar Modules dataset, which is publicly shared and free of charge, were used [14]. The dataset contains a total of 20,000 infrared images with a resolution of 24 × 40, obtained by UAV systems with medium wave or long wave infrared imaging capabilities. A total of 10,000 of these images, corresponding to 50%, consist of no-anomaly images. The remaining 10,000 images contain various solar panel defects (see Figure 4). Images with solar panel defects are divided into 11 categories. There are 12 classes in total, including no-anomaly images. These classes are defined as follows [14].
  • Cell: A single cell with a square geometry that has experienced a hot-spot event.
  • Cell-multi: Hot spots have occurred in multiple cells, each with a square geometry.
  • Cracking: There are surface cracks visible on the module.
  • Diode: The bypass diode is active, typically accounting for 1/3 of the module.
  • Diode-multi: Multiple bypass diodes are active, typically accounting for 2/3 of the module.
  • Hot-spot: A thermal hotspot has developed on a thin-film module.
  • Hot-spot-multi: Multiple thermal hotspots have formed on a thin-film module.
  • Offline-module: The entire module is subject to heating.
  • Shadowing: Sunlight is obstructed due to vegetation, man-made structures, or adjacent rows.
  • Soiling: There is dirt, dust, or other debris on the surface of the module.
  • Vegetation: Panels are blocked by surrounding vegetation.
  • No-anomaly: The solar module is operating normally.
As mentioned before, there are 10,000 non-anomaly images. The number of images with classified solar panel defects is shown graphically in Figure 5.
Figure 4. Sample images.
Electronics 12 04397 g004

3. Experimental Results

In this study, the effectiveness of the Efficientb0-based exemplar deep feature extraction approach was investigated using a dataset of Infrared Solar Modules images. The exemplar deep feature extraction model was implemented using MATLAB (R2023a) software. The analysis was conducted on a desktop computer equipped with an Intel (R) Core i7 CPU running at 5.8 GHz, 32 GB of RAM, and the Windows 11 operating system. Deep Network Designer Toolbox was used for end to end training. The recommended exemplar deep feature extraction method was employed for data processing. The obtained features were subsequently processed for classification using the Classification Learner App Toolbox. No model-specific hyperparameter optimization was employed, and default parameters of machine learning methods were used.
A total of 19 pre-trained models were employed to extract features from a dataset. Subsequently, these extracted features were assessed and classified using a support vector machine (SVM) classifier. The classification results are summarized in Table 1. Upon examination of these results, it was observed that the Efficientnetb0 model yielded the highest accuracy scores. Therefore, the Efficientnetb0 model was preferred for this study.
During the training process, the data were divided into training and validation sets in an 80:20 ratio. The training and validation performance curves for these data sets are shown in Figure 6.
The obtained features using the proposed method were classified using various classifiers, including SVM, ANN, KNN, Naive Bayes, and Tree. The accuracy results of the classifiers are presented in Figure 7.
SVM was chosen as it yielded the highest accuracy in the proposed method. The resulting confusion matrix for the classification is displayed in Figure 8.
The accuracy value is obtained by dividing the total correctly predicted true positives and true negatives by the total predicted examples. The accuracy value is a performance metric that explains how well the model performs overall across all classes (see Table 2). Precision is obtained by dividing the true positive count, where the model correctly classifies as positive, by the sum of true positives and false positives. Therefore, precision is a performance metric that shows how accurately the model classifies examples as belonging to a specific class. Recall is obtained by dividing the true positive count, where the model correctly classifies as positive, by the sum of true positives and false negatives. Therefore, recall is a performance metric that shows how accurately the model classifies examples that should belong to a specific class. The F1-score value is obtained by taking the harmonic mean of the precision and recall values obtained by the model. The reason for using harmonic mean is to reduce the impact of extreme cases on the performance metric. Thus, it aims to prevent incorrect evaluations in data sets that are not evenly distributed. Performance measurement metrics were calculated with the following equations (Equations (1)–(5)).
A c c u r a c y = TP + TN TP + TN + FP + FN
S e n s i t i v i t y = TP TP + FN
S p e c i f i c i t y = TN TN + FP
P r e c i s i o n = TP TP + FP
F 1 s c o r e = 2 × P r e c i s i o n × S e n s i t i v i t y P r e c i s i o n + S e n s i t i v i t y
  • Sensitivity: Average sensitivity was 88.28%. The average sensitivity demonstrates that the model performs quite evenly across all classes. This indicates the model’s capability to effectively identify various classes within the dataset.
  • Specificity: Average specificity was 99.33%. The average specificity is notably high, indicating the model’s proficiency in accurately recognizing non-class instances.
  • Precision: Average precision was 91.50%. The average precision suggests that the model is adept at accurately predicting classes. In other words, when the model predicts a class, it is often correct.
  • F1-Score: Average F1-score was 89.82%. The average F1-Score harmoniously combines precision and recall. This signifies that the model’s classification performance is generally well-balanced and notably high.
  • In addition to providing energy efficiency by solar panel defect classification, benefits will also be provided in terms of energy management, because solar panel defect classification is important for the system to ensure maximum energy production.

4. Discussion

This study aims to develop methods for detecting faults in photovoltaic panels using infrared solar module images. To achieve this goal, the “Efficientb0” model, a pre-trained deep learning network, has been preferred. The use of a pre-trained model has facilitated faster and more effective learning of the data. Another significant aspect of this study is that the Efficientb0 model has been trained from scratch using infrared solar module images. The purpose of this approach is to optimize the model’s ability to detect faults in photovoltaic panels. The results obtained indicate that the proposed method has significant potential for detecting faults in photovoltaic panels. Training the model from scratch has allowed for better processing of infrared images and more precise detection of faults in the panels. This study can provide a significant contribution to the maintenance and efficiency of solar energy systems. Due to solar panel defects occurring on the panel, the absorption of solar radiation on the solar cell side will be low or absent. Therefore, defects must be detected easily and accurately. In this context, the determination of solar panel defect classification contributes. To show the success of the model used in the study, a comparison is made in Table 3 with other studies using the dataset used in this study.
Korkmaz and Acikgoz [52] conducted, using the same dataset, a multi-scale convolutional neural network (CNN) with three branches based on the transfer learning strategy that was proposed; average accuracy obtained was 97.32% for fault detection and 93.51% for the 11 anomaly types. Alves et al. [53] examined the effect of data augmentation techniques to increase the success of the convolutional neural network, and 92.5% test accuracy was obtained with the cross-validation method. Nguyen et al. [54] proposed a deep neural network based on residual network structure and ensemble technique to accurately predict and classify anomaly solar modules. It has been observed that an anomaly module is predicted correctly at an average rate of 94%. Le et al. [55] proposed the remote sensing method. Jetson Nano was used to evaluate the CNN algorithm and real-time control. An accuracy of 85.35% was achieved in their studies. Tang et al. [56] proposed the basic MobileNet-V3 network to realize fault classification of photovoltaic modules, Obtaining an accuracy value of the proposed method of 70.82%. Sriraman and Ramaprabha [57] used geometric transformation and generative adversarial networks image augmentation techniques for PV fault classification, Obtaining an accuracy value of 95.72% with the presented paired UdenseNet model. Sriraman and Ramaprabha [58], used decision tree and random forest models and a convolutional neural network model for the case of a partial shading model in PV fault detection, examining 20,000 thermographic images and achieving 90% success with the random forest model. Chen et al. [59] developed a ShuffleNet V2 network for the infrared images of 11 types of PV module faults, and an accuracy of 84.06% was achieved. Lee et al. [60] attempted to detect defects in PV panels; they achieved 89% accuracy with the residual convolutional network they proposed. Açıkgöz et al. [61] studied only hot spot classification among solar panel failures and achieved an accuracy value of 98.65% with AlexNet.

5. Conclusions

This study aimed to evaluate the applicability of deep learning approaches for the analysis of infrared solar module images to detect faults in photovoltaic panels. In pursuit of this objective, the Efficientb0 model, a pre-trained deep learning model, was chosen. Furthermore, this model was fine-tuned from scratch to adapt to the specific characteristics of the dataset. The obtained results demonstrate that the proposed method holds significant potential for the detection of faults in photovoltaic panels. Particularly, the utilization of the Efficientb0 model enabled more effective processing of infrared solar module images and enhanced the precision of fault detection within the panels. The findings of this study are crucial for industry professionals and researchers aiming to improve the maintenance and efficiency of solar energy systems. High accuracy rates in fault detection are critical for the long-term durability and high efficiency of photovoltaic panels. Future research endeavors may encompass model-specific hyperparameter optimization and the exploration of various data augmentation techniques to further optimize the model and improve its generalization capabilities. Additionally, the evaluation of this method in real-world applications and real-time fault detection could be a prospective direction for research. In conclusion, this study demonstrates the successful application of deep learning and computer vision techniques for fault detection in photovoltaic panels, contributing to future research in this field.

Funding

This research received no external funding.

Data Availability Statement

In this paper, the dataset is publicly available.

Conflicts of Interest

The author declares no conflict of interest.

References

  1. COP 21 Paris France Sustainable Innovation Forum 2015 Working with UNEP. Available online: https://www.cop21paris.org/ (accessed on 15 August 2023).
  2. Kabir, E.; Kumar, P.; Kumar, S.; Adelodun, A.A.; Kim, K.-H. Solar energy: Potential and future prospects. Renew. Sustain. Energy Rev. 2018, 82, 894–900. [Google Scholar] [CrossRef]
  3. Shahsavari, A.; Akbari, M. Potential of solar energy in developing countries for reducing energy-related emissions. Renew. Sustain. Energy Rev. 2018, 90, 275–291. [Google Scholar] [CrossRef]
  4. Tiwari, G.N.; Dubey, S. Fundamentals of Photovoltaic Modules and Their Applications; Royal Society of Chemistry: London, UK, 2009. [Google Scholar]
  5. Hernández-Callejo, L.; Gallardo-Saavedra, S.; Alonso-Gómez, V. A review of photovoltaic systems: Design, operation and maintenance. Sol. Energy 2019, 188, 426–440. [Google Scholar] [CrossRef]
  6. Aslan, M.; Duranay, Z.; Tuncer, S. Türkiye’ nin Güneş Enerjisi Potansiyeli ve Uygulama Alanları (Solar Energy Potential of Turkey and Solar Energy Application Areas). In Proceedings of the International EUROASIA Congress on Scientific Researches and Recent Trends 10, Bakü, Azerbaycan, 16–17 February 2023. [Google Scholar]
  7. Kabir, M.; Duranay, Z.; Ekici, S. Trend of Energy Generation Efficiency in Agrivoltaic Systems Research. In Proceedings of the 2nd-International Congress on Modern Sciences, Tashkent, Uzbekistan, 16–17 December 2022. [Google Scholar]
  8. Qiu, G.; Ma, Y.; Song, W.; Cai, W. Comparative study on solar flat-plate collectors coupled with three types of reflectors not requiring solar tracking for space heating. Renew. Energy 2021, 169, 104–116. [Google Scholar] [CrossRef]
  9. Duranay, Z.; Karagözoğlu, L. Fotovoltaik Panel Performansını Etkileyen Faktörlerin İncelenmesi (Investigation of the Factors Affecting the Photovoltaic Panel Performance). In Proceedings of the 2nd International Baku Conference on Scientific Research, Baku, Azerbaijan, 28–30 April 2021. [Google Scholar]
  10. Karakilic, A.N.; Karafil, A.; Genc, N. Effects of temperature and solar irradiation on performance of monocrystalline, polycrystalline and thin-film PV panels. Int. J. Tech. Phys. Probl. Eng. 2022, 51, 254–260. [Google Scholar]
  11. Gupta, V.; Sharma, M.; Pachauri, R.K.; Babu, K.D. Comprehensive review on effect of dust on solar photovoltaic system and mitigation techniques. Sol. Energy 2019, 191, 596–622. [Google Scholar] [CrossRef]
  12. Dişli, F.; Gedikpinar, M.; Şengür, A. Determination of Pollution on Photovoltaic Panels by Image Processing. In Proceedings of the 2018 International Conference on Artificial Intelligence and Data Processing (IDAP), Malatya, Turkey, 28–30 September 2018; pp. 1–5. [Google Scholar]
  13. Karagözoğlu, L.; Duranay, Z.B. Investigation of Maximum Power Point Tracking Methods in Photovoltaic Sytems. Int. J. Innov. Eng. Appl. 2023, 7, 86–95. [Google Scholar] [CrossRef]
  14. Millendorf, M.; Obropta, E.; Vadhavkar, N. Infrared solar module dataset for anomaly detection. In Proceedings of the 2020 International Conference on Learning Representations (ICLR), Addis Ababa, Ethiopia, 30 April 2020. [Google Scholar]
  15. Sander, M.; Henke, B.; Schweizer, S.; Ebert, M.; Bagdahn, J. PV module defect detection by combination of mechanical and electrical analysis methods. In Proceedings of the 2010 35th IEEE Photovoltaic Specialists Conference, Honolulu, HI, USA, 20–25 June 2010; pp. 1765–1769. [Google Scholar]
  16. Garaj, M.; Hong, K.Y.; Chung, H.S.-H.; Zhou, J.; Lo, A.W.-L. Photovoltaic panel health diagnostic system for solar power plants. In Proceedings of the 2019 IEEE Applied Power Electronics Conference and Exposition (APEC), Anaheim, CA, USA, 17–21 March 2019; pp. 1078–1083. [Google Scholar]
  17. Yahya, Z.; Imane, S.; Hicham, H.; Ghassane, A.; Safia, E.B.-I. Applied imagery pattern recognition for photovoltaic modules’ inspection: A review on methods, challenges and future development. Sustain. Energy Technol. Assess. 2022, 52, 102071. [Google Scholar] [CrossRef]
  18. Pierdicca, R.; Malinverni, E.; Piccinini, F.; Paolanti, M.; Felicetti, A.; Zingaretti, P. Deep convolutional neural network for automatic detection of damaged photovoltaic cells. Int. Arch. Photogramm. Remote Sens. Spat. Inf. Sci. 2018, 42, 893–900. [Google Scholar] [CrossRef]
  19. Shihavuddin, A.; Rashid, M.R.A.; Maruf, M.H.; Hasan, M.A.; ul Haq, M.A.; Ashique, R.H.; Al Mansur, A. Image based surface damage detection of renewable energy installations using a unified deep learning approach. Energy Rep. 2021, 7, 4566–4576. [Google Scholar] [CrossRef]
  20. El-Banby, G.M.; Moawad, N.M.; Abouzalm, B.A.; Abouzaid, W.F.; Ramadan, E. Photovoltaic system fault detection techniques: A review. Neural Comput. Appl. 2023, 1–14. [Google Scholar] [CrossRef]
  21. Amaral, T.G.; Pires, V.F.; Pires, A.J. Fault detection in PV tracking systems using an image processing algorithm based on PCA. Energies 2021, 14, 7278. [Google Scholar] [CrossRef]
  22. Abubakar, A.; Jibril, M.M.; Almeida, C.F.; Gemignani, M.; Yahya, M.N.; Abba, S.I. A Novel Hybrid Optimization Approach for Fault Detection in Photovoltaic Arrays and Inverters Using AI and Statistical Learning Techniques: A Focus on Sustainable Environment. Processes 2023, 11, 2549. [Google Scholar] [CrossRef]
  23. Kellil, N.; Aissat, A.; Mellit, A. Fault diagnosis of photovoltaic modules using deep neural networks and infrared images under Algerian climatic conditions. Energy 2023, 263, 125902. [Google Scholar] [CrossRef]
  24. Eltuhamy, R.A.; Rady, M.; Almatrafi, E.; Mahmoud, H.A.; Ibrahim, K.H. Fault Detection and Classification of CIGS Thin-Film PV Modules Using an Adaptive Neuro-Fuzzy Inference Scheme. Sensors 2023, 23, 1280. [Google Scholar] [CrossRef] [PubMed]
  25. Memon, S.A.; Javed, Q.; Kim, W.-G.; Mahmood, Z.; Khan, U.; Shahzad, M. A machine-learning-based robust classification method for PV panel faults. Sensors 2022, 22, 8515. [Google Scholar] [CrossRef] [PubMed]
  26. Chen, L.; Li, S.; Wang, X. Quickest fault detection in photovoltaic systems. IEEE Trans. Smart Grid 2016, 9, 1835–1847. [Google Scholar] [CrossRef]
  27. Segovia Ramirez, I.; Das, B.; Garcia Marquez, F.P. Fault detection and diagnosis in photovoltaic panels by radiometric sensors embedded in unmanned aerial vehicles. Prog. Photovolt. Res. Appl. 2022, 30, 240–256. [Google Scholar] [CrossRef]
  28. Zefri, Y.; Sebari, I.; Hajji, H.; Aniba, G.; Aghaei, M. A layer-2 solution for inspecting large-scale photovoltaic arrays through aerial LWIR multiview photogrammetry and deep learning: A hybrid data-centric and model-centric approach. Expert Syst. Appl. 2023, 223, 119950. [Google Scholar] [CrossRef]
  29. Tan, M.; Le, Q. Efficientnet: Rethinking model scaling for convolutional neural networks. In Proceedings of the International Conference on Machine Learning, Long Beach, CA, USA, 9–15 June 2019; pp. 6105–6114. [Google Scholar]
  30. Hearst, M.A.; Dumais, S.T.; Osuna, E.; Platt, J.; Scholkopf, B. Support vector machines. IEEE Intell. Syst. Their Appl. 1998, 13, 18–28. [Google Scholar] [CrossRef]
  31. Hittawe, M.M.; Sidibé, D.; Beya, O.; Mériaudeau, F. Machine vision for timber grading singularities detection and applications. J. Electron. Imaging 2017, 26, 063015. [Google Scholar] [CrossRef]
  32. Vishwanathan, S.; Murty, M.N. SSVM: A simple SVM algorithm. In Proceedings of the 2002 International Joint Conference on Neural Networks, Honolulu, HI, USA, 12–17 May 2002; IJCNN’02 (Cat. No. 02CH37290). pp. 2393–2398. [Google Scholar]
  33. Hittawe, M.M.; Sidibé, D.; Mériaudeau, F. Bag of words representation and SVM classifier for timber knots detection on color images. In Proceedings of the 2015 14th IAPR International Conference on Machine Vision Applications (MVA), Tokyo, Japan, 18–22 May 2015; pp. 287–290. [Google Scholar]
  34. Schuldt, C.; Laptev, I.; Caputo, B. Recognizing human actions: A local SVM approach. In Proceedings of the 17th International Conference on Pattern Recognition, Cambridge, UK, 26 August 2004; ICPR 2004. pp. 32–36. [Google Scholar]
  35. Tasci, B. Automated ischemic acute infarction detection using pre-trained CNN models’ deep features. Biomed. Signal Process. Control 2023, 82, 104603. [Google Scholar] [CrossRef]
  36. Goldberger, J.; Hinton, G.E.; Roweis, S.; Salakhutdinov, R.R. Neighbourhood components analysis. Adv. Neural Inf. Process. Syst. 2004, 17. [Google Scholar]
  37. Tas, N.P.; Kaya, O.; Macin, G.; Tasci, B.; Dogan, S.; Tuncer, T. ASNET: A Novel AI Framework for Accurate Ankylosing Spondylitis Diagnosis from MRI. Biomedicines 2023, 11, 2441. [Google Scholar] [CrossRef] [PubMed]
  38. He, K.; Zhang, X.; Ren, S.; Sun, J. Deep residual learning for image recognition. In Proceedings of the 2016 IEEE Conference on Computer Vision and Pattern Recognition, Las Vegas, NV, USA, 27–30 June 2016; pp. 770–778. [Google Scholar]
  39. Redmon, J.; Farhadi, A. YOLO9000: Better, faster, stronger. In Proceedings of the 2019 IEEE Conference on Computer Vision and Pattern Recognition, Long Beach, CA, USA, 15–20 June 2019; pp. 7263–7271. [Google Scholar]
  40. Sandler, M.; Howard, A.; Zhu, M.; Zhmoginov, A.; Chen, L.-C. Mobilenetv2: Inverted residuals and linear bottlenecks. In Proceedings of the 2018 IEEE Conference on Computer Vision and Pattern Recognition, Salt Lake City, UT, USA, 18–23 June 2018; pp. 4510–4520. [Google Scholar]
  41. Ekmekyapar, T.; Taşcı, B. Exemplar MobileNetV2-Based Artificial Intelligence for Robust and Accurate Diagnosis of Multiple Sclerosis. Diagnostics 2023, 13, 3030. [Google Scholar] [CrossRef] [PubMed]
  42. Chollet, F. Xception: Deep learning with depthwise separable convolutions. In Proceedings of the 2017 IEEE Conference on Computer Vision and Pattern Recognition, Honolulu, HI, USA, 21–26 July 2017; pp. 1251–1258. [Google Scholar]
  43. Zhang, X.; Zhou, X.; Lin, M.; Sun, J. Shufflenet: An extremely efficient convolutional neural network for mobile devices. In Proceedings of the 2018 IEEE Conference on Computer Vision and Pattern Recognition, Salt Lake City, UT, USA, 18–23 June 2018; pp. 6848–6856. [Google Scholar]
  44. Zoph, B.; Vasudevan, V.; Shlens, J.; Le, Q.V. Learning transferable architectures for scalable image recognition. In Proceedings of the 2018 IEEE Conference on Computer Vision and Pattern Recognition, Salt Lake City, UT, USA, 18–23 June 2018; pp. 8697–8710. [Google Scholar]
  45. Huang, G.; Liu, Z.; Van Der Maaten, L.; Weinberger, K.Q. Densely connected convolutional networks. In Proceedings of the 2017 IEEE Conference on Computer Vision and Pattern Recognition, Honolulu, HI, USA, 21–26 July 2017; pp. 4700–4708. [Google Scholar]
  46. Szegedy, C.; Vanhoucke, V.; Ioffe, S.; Shlens, J.; Wojna, Z. Rethinking the inception architecture for computer vision. In Proceedings of the 2016 IEEE Conference on Computer Vision and Pattern Recognition, Las Vegas, NV, USA, 27–30 June 2016; pp. 2818–2826. [Google Scholar]
  47. Szegedy, C.; Ioffe, S.; Vanhoucke, V.; Alemi, A. Inception-v4, inception-resnet and the impact of residual connections on learning. In Proceedings of the 2016 AAAI Conference on Artificial Intelligence, Phoenix, AZ, USA, 12–17 February 2016. [Google Scholar]
  48. Szegedy, C.; Liu, W.; Jia, Y.; Sermanet, P.; Reed, S.; Anguelov, D.; Erhan, D.; Vanhoucke, V.; Rabinovich, A. Going deeper with convolutions. In Proceedings of the 2014 IEEE Conference on Computer Vision and Pattern Recognition, Columbus, OH, USA, 23–28 June 2014; pp. 1–9. [Google Scholar]
  49. Krizhevsky, A.; Sutskever, I.; Hinton, G.E. Imagenet classification with deep convolutional neural networks. Adv. Neural Inf. Process. Syst. 2012, 25, 1097–1105. [Google Scholar] [CrossRef]
  50. Simonyan, K.; Zisserman, A. Very deep convolutional networks for large-scale image recognition. arXiv 2014, arXiv:1409.1556. [Google Scholar]
  51. Iandola, F.N.; Han, S.; Moskewicz, M.W.; Ashraf, K.; Dally, W.J.; Keutzer, K. SqueezeNet: AlexNet-level accuracy with 50x fewer parameters and <0.5 MB model size. arXiv 2016, arXiv:1602.07360. [Google Scholar]
  52. Korkmaz, D.; Acikgoz, H. An efficient fault classification method in solar photovoltaic modules using transfer learning and multi-scale convolutional neural network. Eng. Appl. Artif. Intell. 2022, 113, 104959. [Google Scholar] [CrossRef]
  53. Alves, R.H.F.; de Deus Junior, G.A.; Marra, E.G.; Lemos, R.P. Automatic fault classification in photovoltaic modules using Convolutional Neural Networks. Renew. Energy 2021, 179, 502–516. [Google Scholar] [CrossRef]
  54. Le, M.; Nguyen, D.K.; Dao, V.-D.; Vu, N.H.; Vu, H.H.T. Remote anomaly detection and classification of solar photovoltaic modules based on deep neural network. Sustain. Energy Technol. Assess. 2021, 48, 101545. [Google Scholar] [CrossRef]
  55. Le, M.; Le, D.; Vu, H.H.T. Thermal inspection of photovoltaic modules with deep convolutional neural networks on edge devices in AUV. Measurement 2023, 218, 113135. [Google Scholar] [CrossRef]
  56. Tang, C.; Ren, H.; Xia, J.; Wang, F.; Lu, J. Automatic defect identification of PV panels with IR images through unmanned aircraft. IET Renew. Power Gener. 2023, 17, 3108–3119. [Google Scholar] [CrossRef]
  57. Pamungkas, R.F.; Utama, I.B.K.Y.; Jang, Y.M. A Novel Approach for Efficient Solar Panel Fault Classification Using Coupled UDenseNet. Sensors 2023, 23, 4918. [Google Scholar] [CrossRef]
  58. Sriraman, D.; Ramaprabha, R. Application of Machine Learning and Convolutional Neural Networks for the Fault Detection and Classification Monitoring System in PV Plants. In Proceedings of the 2023 9th International Conference on Electrical Energy Systems (ICEES), Chennai, India, 23–25 March 2023; pp. 694–699. [Google Scholar]
  59. Chen, H.; Zhang, A.; Gong, C.; Liang, W.; Wang, Z. Fault Diagnosis Method for Photovoltaic Panels Based on Improved ShuffleNet V2 and Infrared Images. In Proceedings of the 2022 7th International Conference on Power and Renewable Energy (ICPRE), Shanghai, China, 23–26 September 2022; pp. 447–451. [Google Scholar]
  60. Lee, S.-H.; Yan, L.-C.; Yang, C.-S. LIRNet: A Lightweight Inception Residual Convolutional Network for Solar Panel Defect Classification. Energies 2023, 16, 2112. [Google Scholar] [CrossRef]
  61. Açikgöz, H.; Korkmaz, D.; Dandil, Ç. Classification of Hotspots in Photovoltaic Modules with Deep Learning Methods. Turk. J. Sci. Technol. 2022, 17, 211–221. [Google Scholar] [CrossRef]
Figure 1. The architecture of solar power plant.
Electronics 12 04397 g001
Figure 2. Various defects that occur in solar panels.
Electronics 12 04397 g002
Figure 3. The proposed model.
Electronics 12 04397 g003
Figure 5. Radar cart of the number of images for 11 anomaly categories.
Electronics 12 04397 g005
Figure 6. The training and validation curves.
Electronics 12 04397 g006
Figure 7. The classifier results.
Electronics 12 04397 g007
Figure 8. Confusion matrix of the dataset. (1—Cell, 2—Cell-multi, 3—Cracking, 4—Diode, 5—Diode-multi, 6—Hot spot, 7—Hot spot-multi, 8—No-anomaly, 9—Offline-module, 10—Shadowing, 11—Soiling, 12—Vegetation).
Electronics 12 04397 g008
Table 1. Pre-trained results.
Pre-Trained CNNAccuracy (%)
Resnet18 [38]74.83
Resnet50 [38]79.15
Resnet101 [38]79.12
Darknet19 [39]76.99
Mobilenetv2 [40,41]77.47
Darknet53 [39]76.20
Xception [42]77.52
Efficientnetb0 [29]81.18
Shufflenet [43]78.10
Nasnetmobile [44]75.70
Nasnetlarge [44]77.09
Densenet201 [45]77.86
Inceptionv3 [46]76.63
Inceptionresnetv2 [47]79.42
Googlenet [48]71.31
Alexnet [49]77.30
Vgg16 [50]73.94
Vgg19 [50]73.91
Squeezenet [51]74.68
Table 2. Performance metric results.
ClassAccuracy (%)Sensitivity (%)Specificity (%)Precision (%)F1-Score (%)
Cell93.9388.7198.6887.4088.05
Cell-multi83.0099.0485.5984.27
Cracking91.0699.6091.7591.40
Diode96.8099.8698.2497.51
Diode-multi93.1499.9797.0295.04
Hot spot80.7299.8788.5584.45
Hot spot-multi82.9399.8789.0885.89
No-anomaly98.8496.8196.8797.85
Offline-module87.3099.8094.8890.93
Shadowing89.5899.5992.4791.01
Soiling77.9499.8886.8982.17
Vegetation89.3899.0489.2289.30
Table 3. Comparison of results with literature studies using the same dataset.
StudyMethodClassAccuracy %
Korkmaz and Acikgoz [52]A multi-scale convolutional neural network with three branches based on the transfer learning strategy1293.51
Alves et al. [53]Data augmentation techniques to increase the success of the convolutional neural network892.5
Nguyen et al. [54]A deep neural network based on a residual network structure and ensemble technique294
Le et al. [55]The remote sensing method1285.35
Tang et al. [56]MobileNet-V3 network1170.82
Pamungkas et al. [57]Geometric transformation and generative adversarial networks image augmentation techniques1196.65
Sriraman and Ramaprabha [58]Random forest model690
Chen et al. [59]ShuffleNet V2 network1184.06
Lee et al. [60]Lightweight inception residual convolutional network889
Açikgöz et al. [61]AlexNet298.65
Proposed methodExemplar Efficientb0,NCA,SVM1293.93
Disclaimer/Publisher’s Note: The statements, opinions and data contained in all publications are solely those of the individual author(s) and contributor(s) and not of MDPI and/or the editor(s). MDPI and/or the editor(s) disclaim responsibility for any injury to people or property resulting from any ideas, methods, instructions or products referred to in the content.

