1. Introduction
Gait is a basic human activity and is a key indicator of exercise effectiveness [
1] and health status. In particular, in the elderly, factors such as lower-body muscle loss and aging can modify the gait [
2] and can lead to falls and limited mobility. In normal adults, a number of orthopedic or neurological conditions can lead to gait disorders [
3]. Gait analysis can be used as an indicator to determine the presence of physical abnormalities or diseases.
Sarcopenia, an increasingly recognized geriatric syndrome, causes various dysfunctions, such as decreased walking ability, increased risk of falls, and increased mortality due to weakened lower extremity muscles and decreased physical function [
4]. Pieruccini-Faria et al. [
5] analyzed gait patterns and brain cognitive abilities in 500 elderly adults and found that gait variability is a strong indicator of problems related to motor control. Middleton [
6] stated that gait is one of the vital signs, equivalent to body temperature, pulse, respiration, and blood pressure, and a parameter directly related to life.
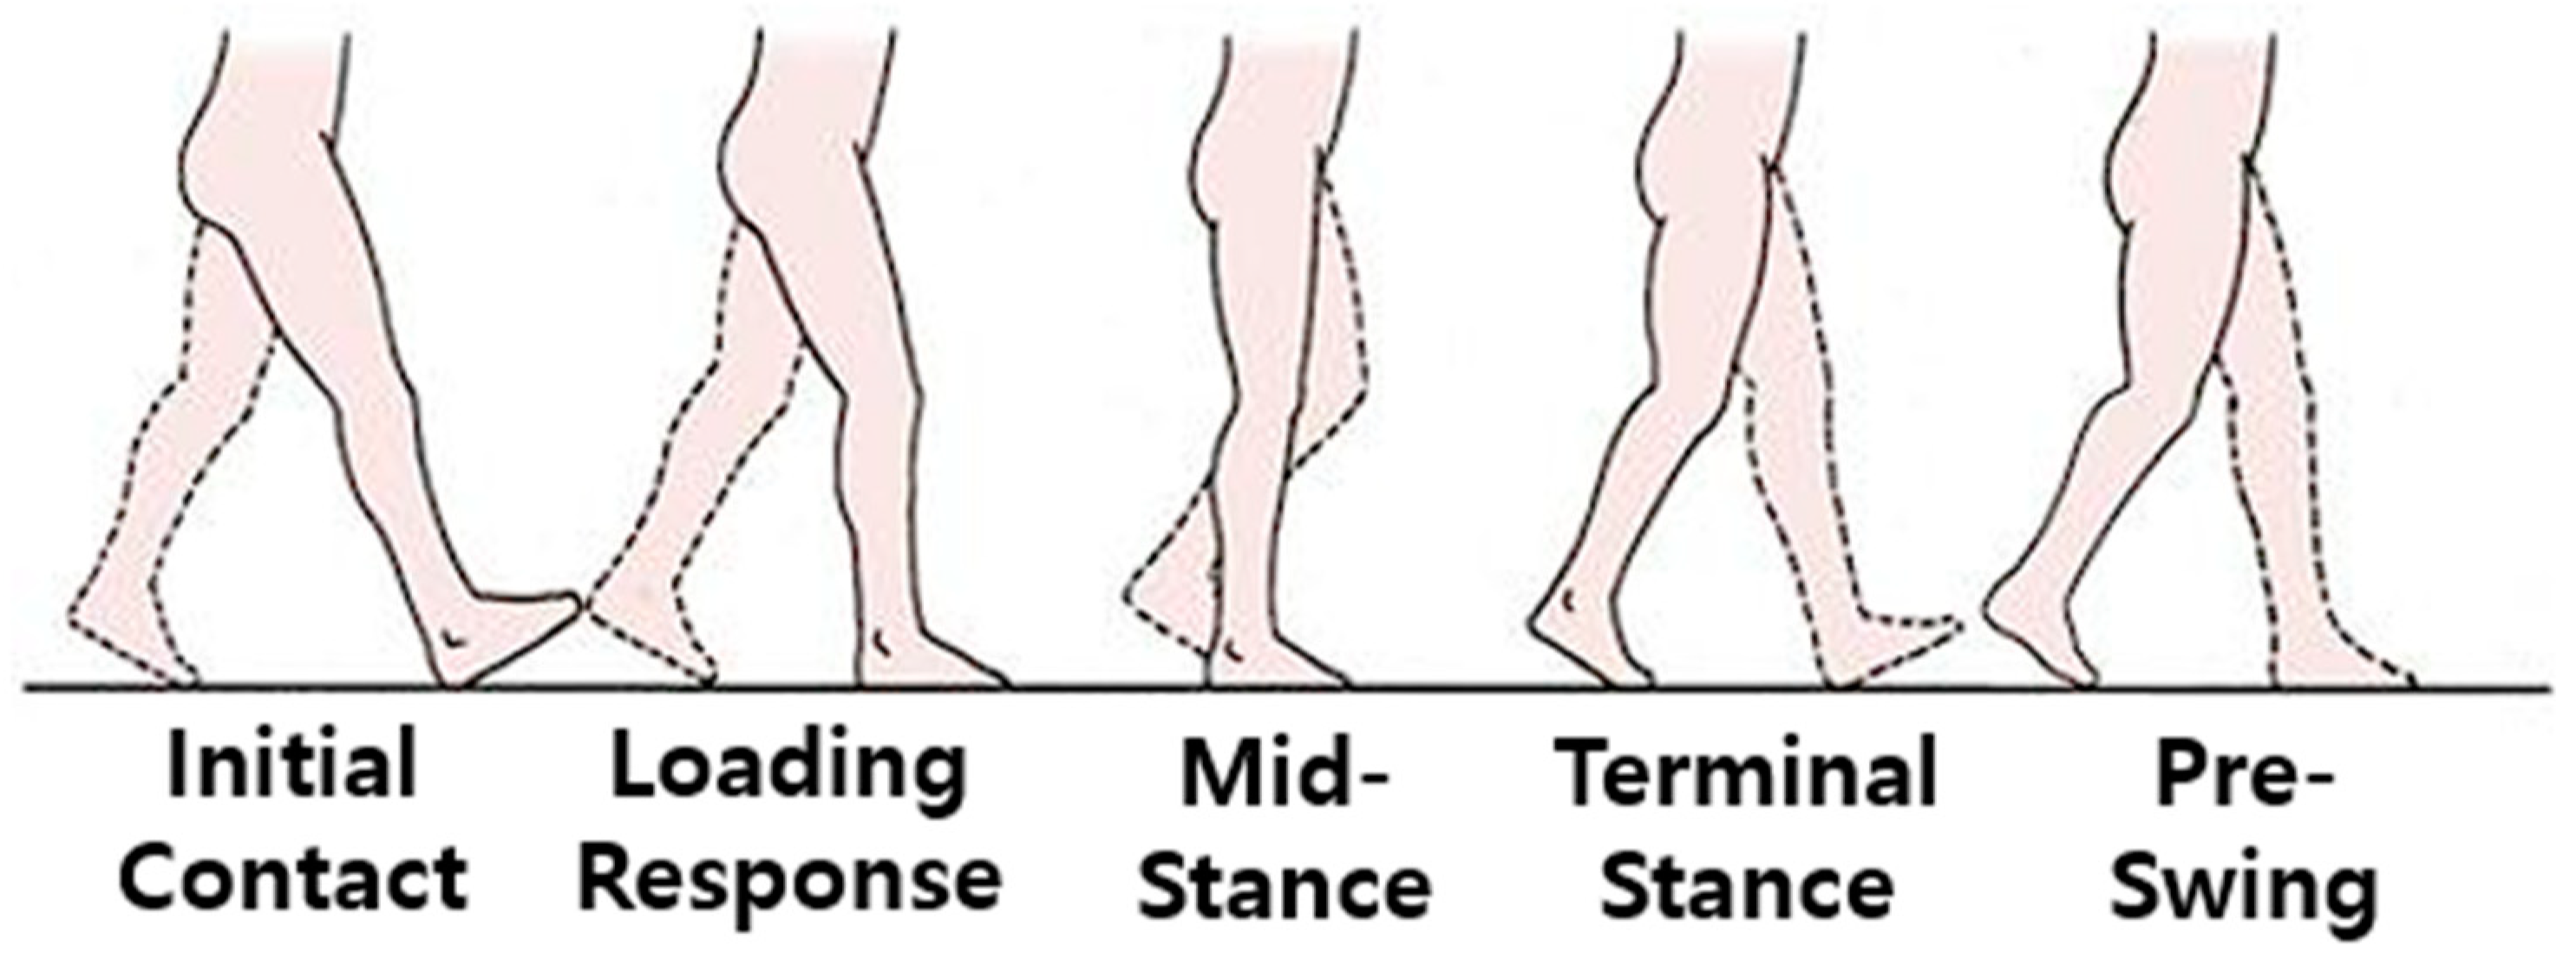
As shown in
Figure 1, gait can be represented by a gait cycle consisting of a stance phase and a swing phase. In a typical gait cycle, the gait events during are in the following order: heel strike (HS), foot flat (FF), heel rise (HR), toe off (TO), heel strike (HS). The gait cycle maintains a constant pattern unless disturbed by physical abnormalities or the external environment.
Representative research on gait analysis involves installing pressure sensors in the insole of a shoe to determine the pressure distribution or analyzing images of a subject’s gait [
7,
8].
Jeong et al. [
9] evaluated the gait by embedding a gyro sensor in the insole of a shoe to determine whether the examined subjects walked medially, normally, or externally, according to the foot angle during walking. Bucinskas et al. [
10] analyzed gait by embedding three pressure sensors in each shoe insole, for a total of six pressure sensors, to assess gait parameters such as stride size and weight distribution on the feet. The installation of pressure sensors in the insoles requires the production of insoles of multiple sizes for different foot sizes. In addition, there are durability issues related to the pressure sensor embedded in an insole.
Kobsar et. al. [
11] used a depth camera to measure vertical oscillation when running on a treadmill and obtained similar results as those achieved with the marker-based standard Vicon system. Potdevin et al. [
12] utilized four infrared cameras and two force plates to measure and analyze the asymmetrical gait of subjects through parameters such as MPL and MBL, conducting a classical marker-based gait analysis.
The camera-based gait analysis requires at least four infrared cameras to be installed [
13]. In orthopedic or rehabilitation hospitals, gait analysis is sometimes performed on a treadmill. This requires installing cameras to assess the gait as well as pressure sensors at the bottom of the treadmill.
Another form of gait analysis involves building a wearable module with an embedded IMU (inertial measurement unit) sensor [
14,
15,
16] that is attached to the shank and analyzing roll, pitch, and yaw while walking. IMU sensor-based research analyzes gait by focusing on the angle of foot movement and the stride length. Although IMU sensors are mainly used to analyze gait on flat surfaces, the analysis process can be challenging if the stride length or the foot angle is not consistent; so, most studies require the examined subjects to move at a constant speed. Hutabat et. al. [
15] used two IMU sensors attached to the shoes and allowed the examined subjects to adjust their speed on a treadmill to analyze gait changes according to the speed.
Riley et al. [
17] performed a gait analysis based on an instrumental treadmill capable of measuring the ground reaction force. The overground walking kinetics were estimated as the subjects walked at their self-selected, comfortable walking speed. During the treadmill gait trials, the subjects walked on two treadmills, so that the heel strike event occurred on the forward treadmill, and the toe off event occurred on the trailing treadmill. The treadmill was set to the average overground walking speed. The authors showed that the treadmill gait is qualitatively and quantitatively similar to the overground gait.
Although not directly comparable to our study, Luessis et al. [
18] analyzed the gait of Parkinson’s disease (PD) patients using a treadmill with an embedded pressure sensor from Zebris [
19]. They found that the insertion of visual elements such as horizontal stripes on the treadmill belt caused changes in key gait parameters such as stride time, stride length, and cadence.
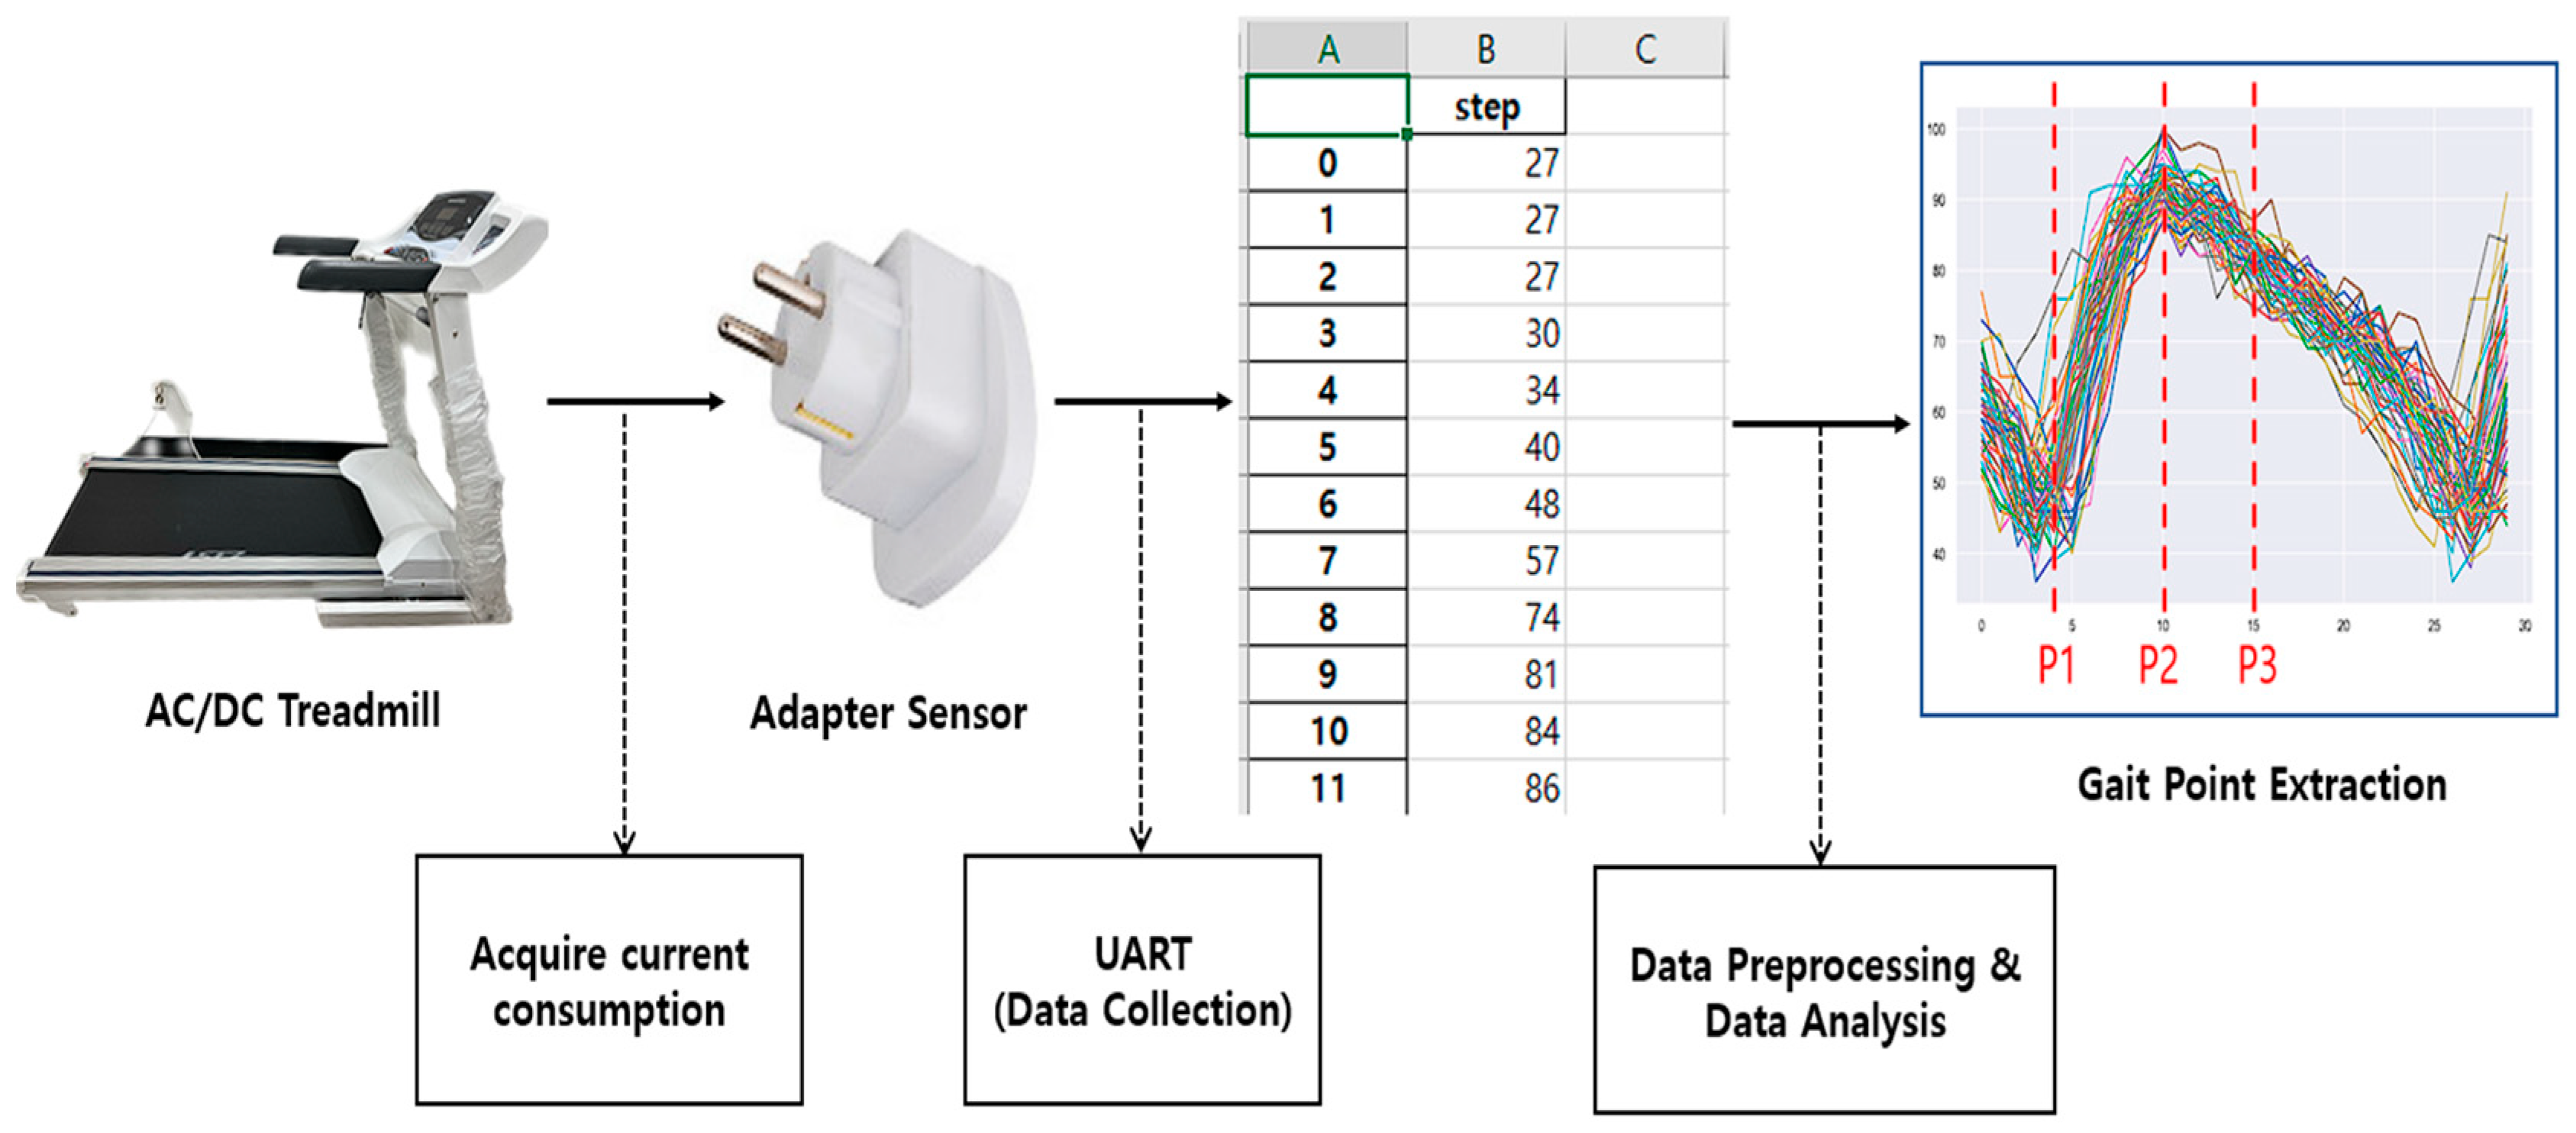
In this paper, we performed gait analysis on a treadmill. First, was we set the walking speed, and the subject walked at the set speed for a certain period of time: then, the pressure distribution on each foot was estimated from the measurement of the pressure applied while walking. We aimed to model the gait patterns of subjects walking at a constant speed on a treadmill based on the differences in current consumption due to pressure differences that occur during different walking states. The changes in current consumption could be converted into pressure distribution curves (envelopes) by preprocessing. From the pressure distribution (average) calculated by superimposing about 50 pressure distribution curves per second, feature points that could model walking patterns were extracted, as shown in
Figure 2. The extracted features were used to model the walking patterns on a treadmill. The features that we determined in this paper are related to the walking events shown in
Figure 1.
In this paper, we implemented an adapter sensor to measure the instantaneous current consumption when walking on a treadmill. Unlike the complex experimental settings used in previous studies, current consumption was simply measured by attaching an adapter to the treadmill.
The paper is organized as follows.
Section 1 describes the background of gait analysis and the research needs and discusses the existing studies conducted on the ground and on a treadmill.
Section 2 describes the system configured to acquire gait analysis data on a treadmill and the data preprocessing process.
Section 3 describes the feature point extraction process from the collected data.
Section 4 presents the experimental results to validate the feasibility of our feature-based gait pattern modeling. Finally,
Section 5 presents the conclusions and outlooks.
3. Feature Point-Based Gait Pattern Modeling
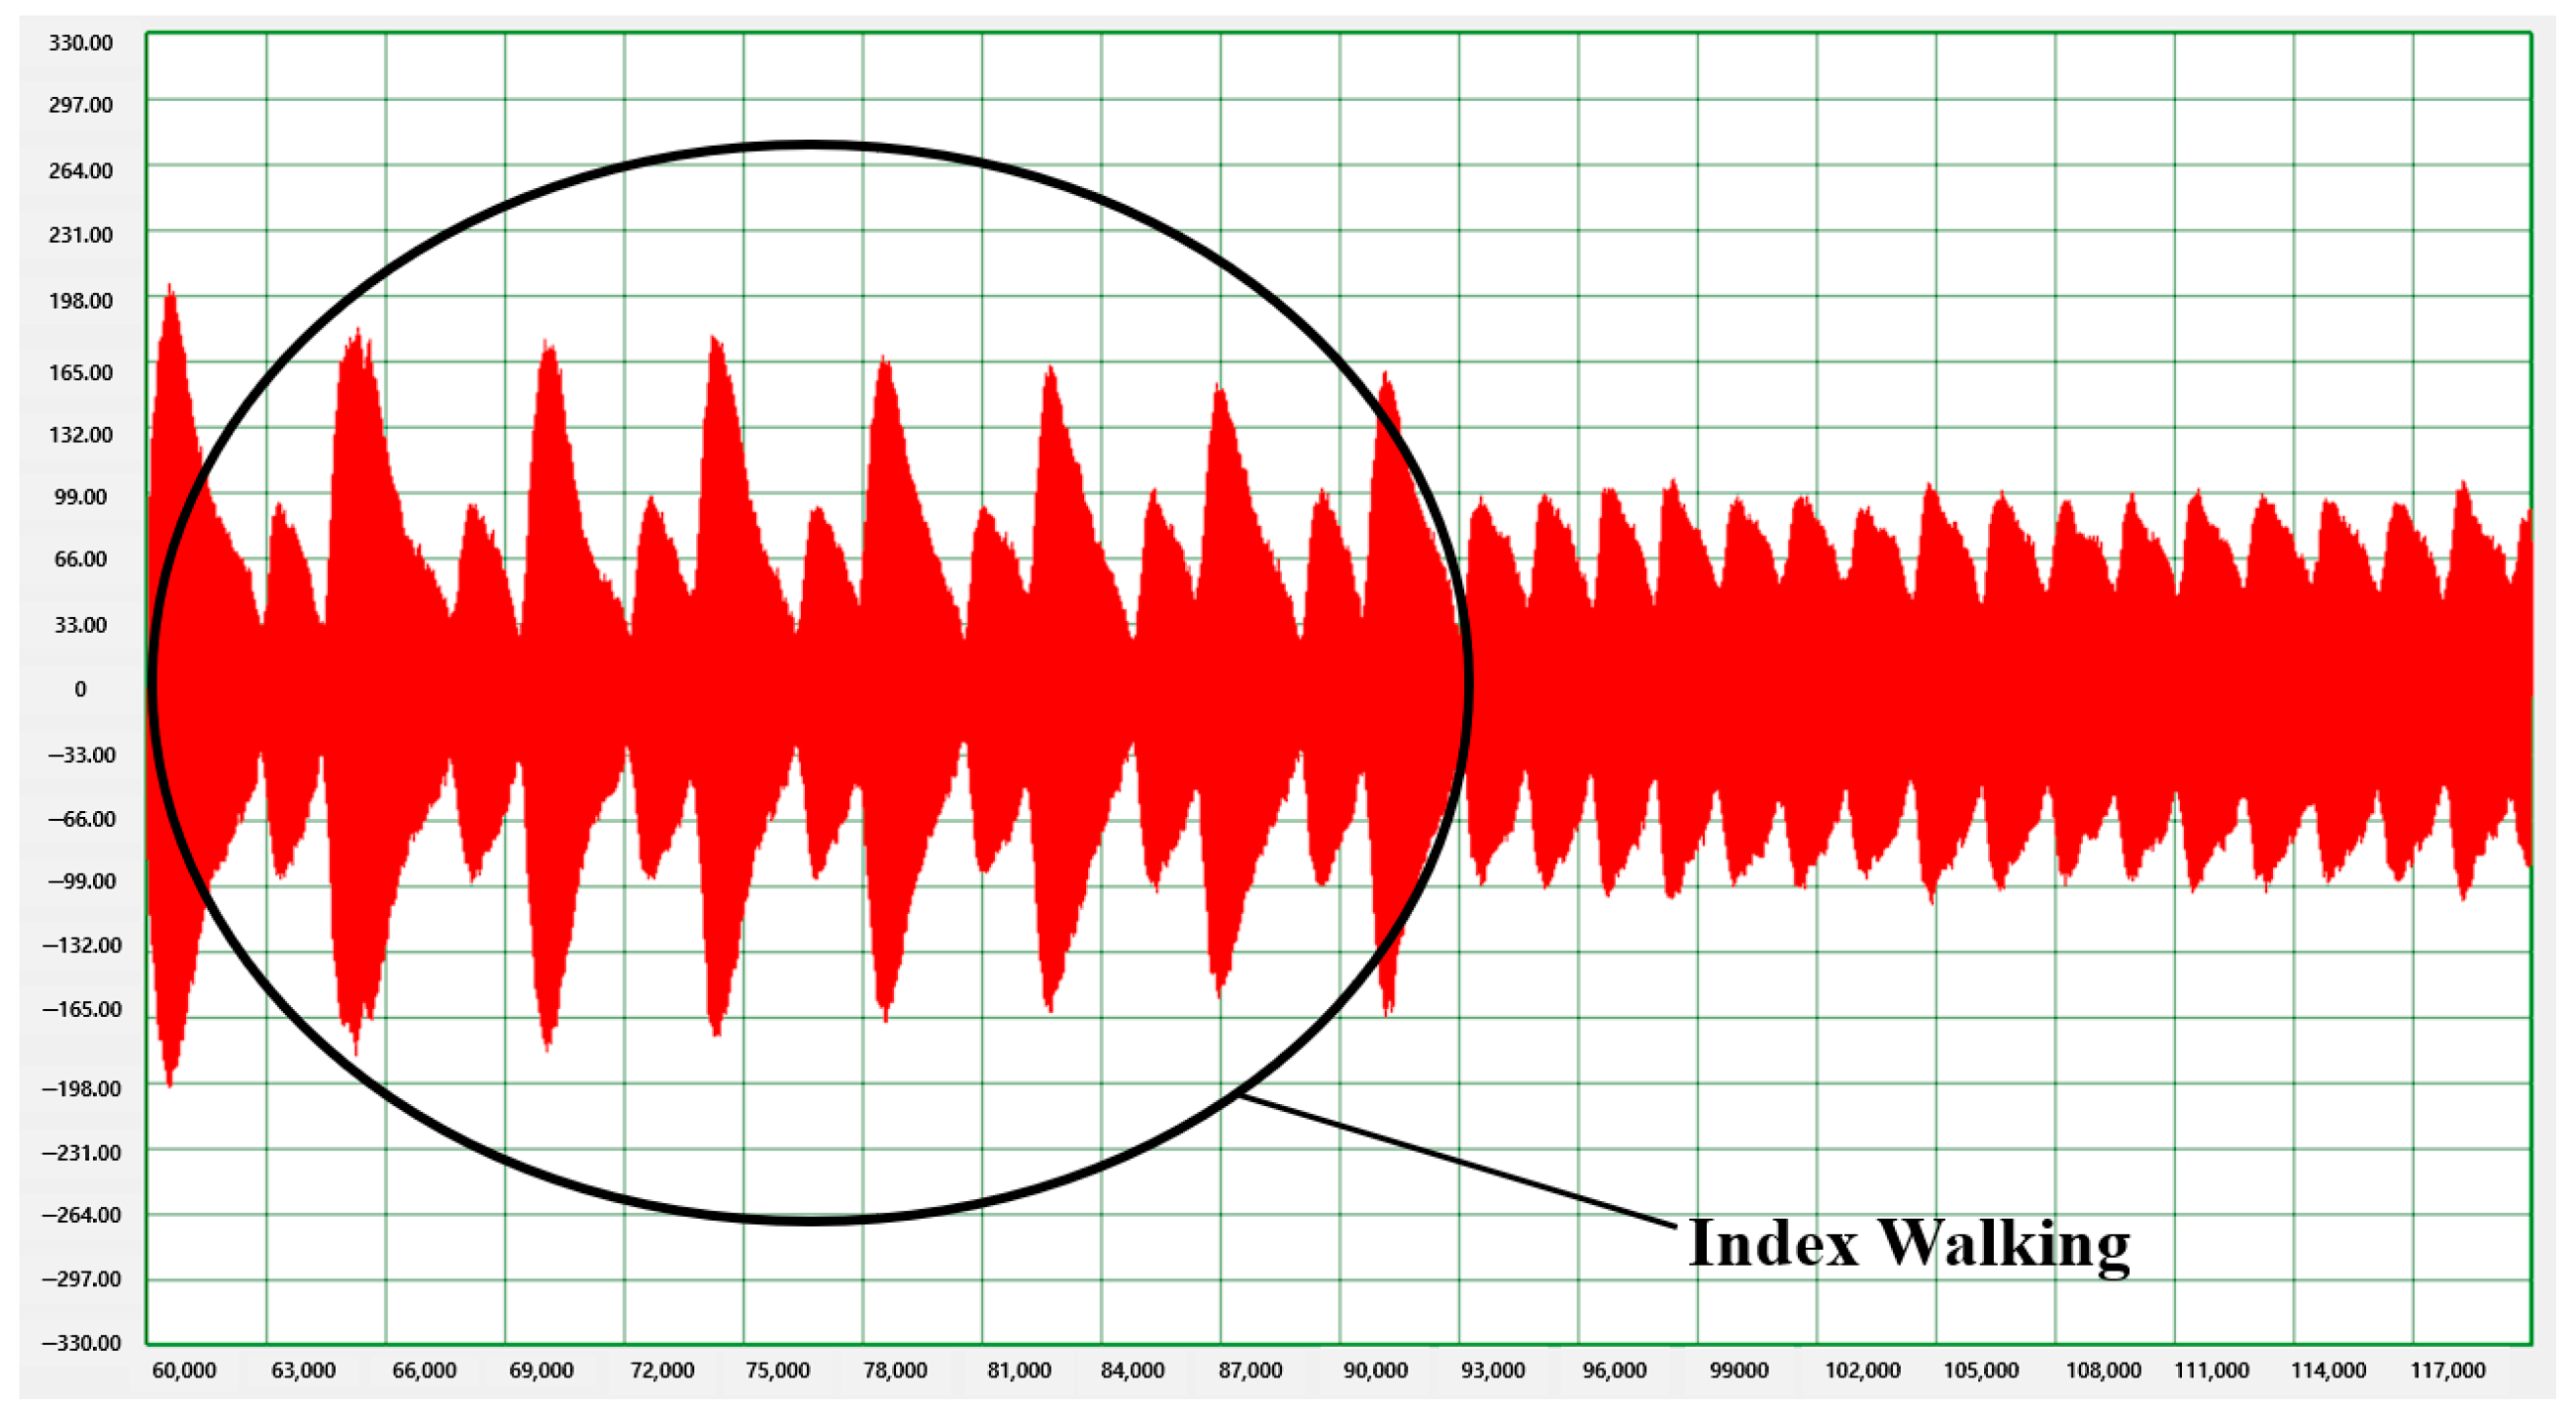
The instantaneous current consumption data contained 50 data points per second after raw data preprocessing and envelope extraction. The speed of 4 km/h set on the treadmill in this study is close to the average walking speed of an adult. A single stride requires an average of 0.6 to 0.7 s [
21] for an adult. Based on this, one gait cycle on the treadmill contained 30 data points, i.e., one envelope consisted of 30 data points, and gait features were extracted from these data points.
Feature points were extracted based on the gait cycle in
Figure 1 and the RLA gait model in
Figure 7. Although the event occurrence times of the feature points did not perfectly match those of the model, points with similar features were selected.
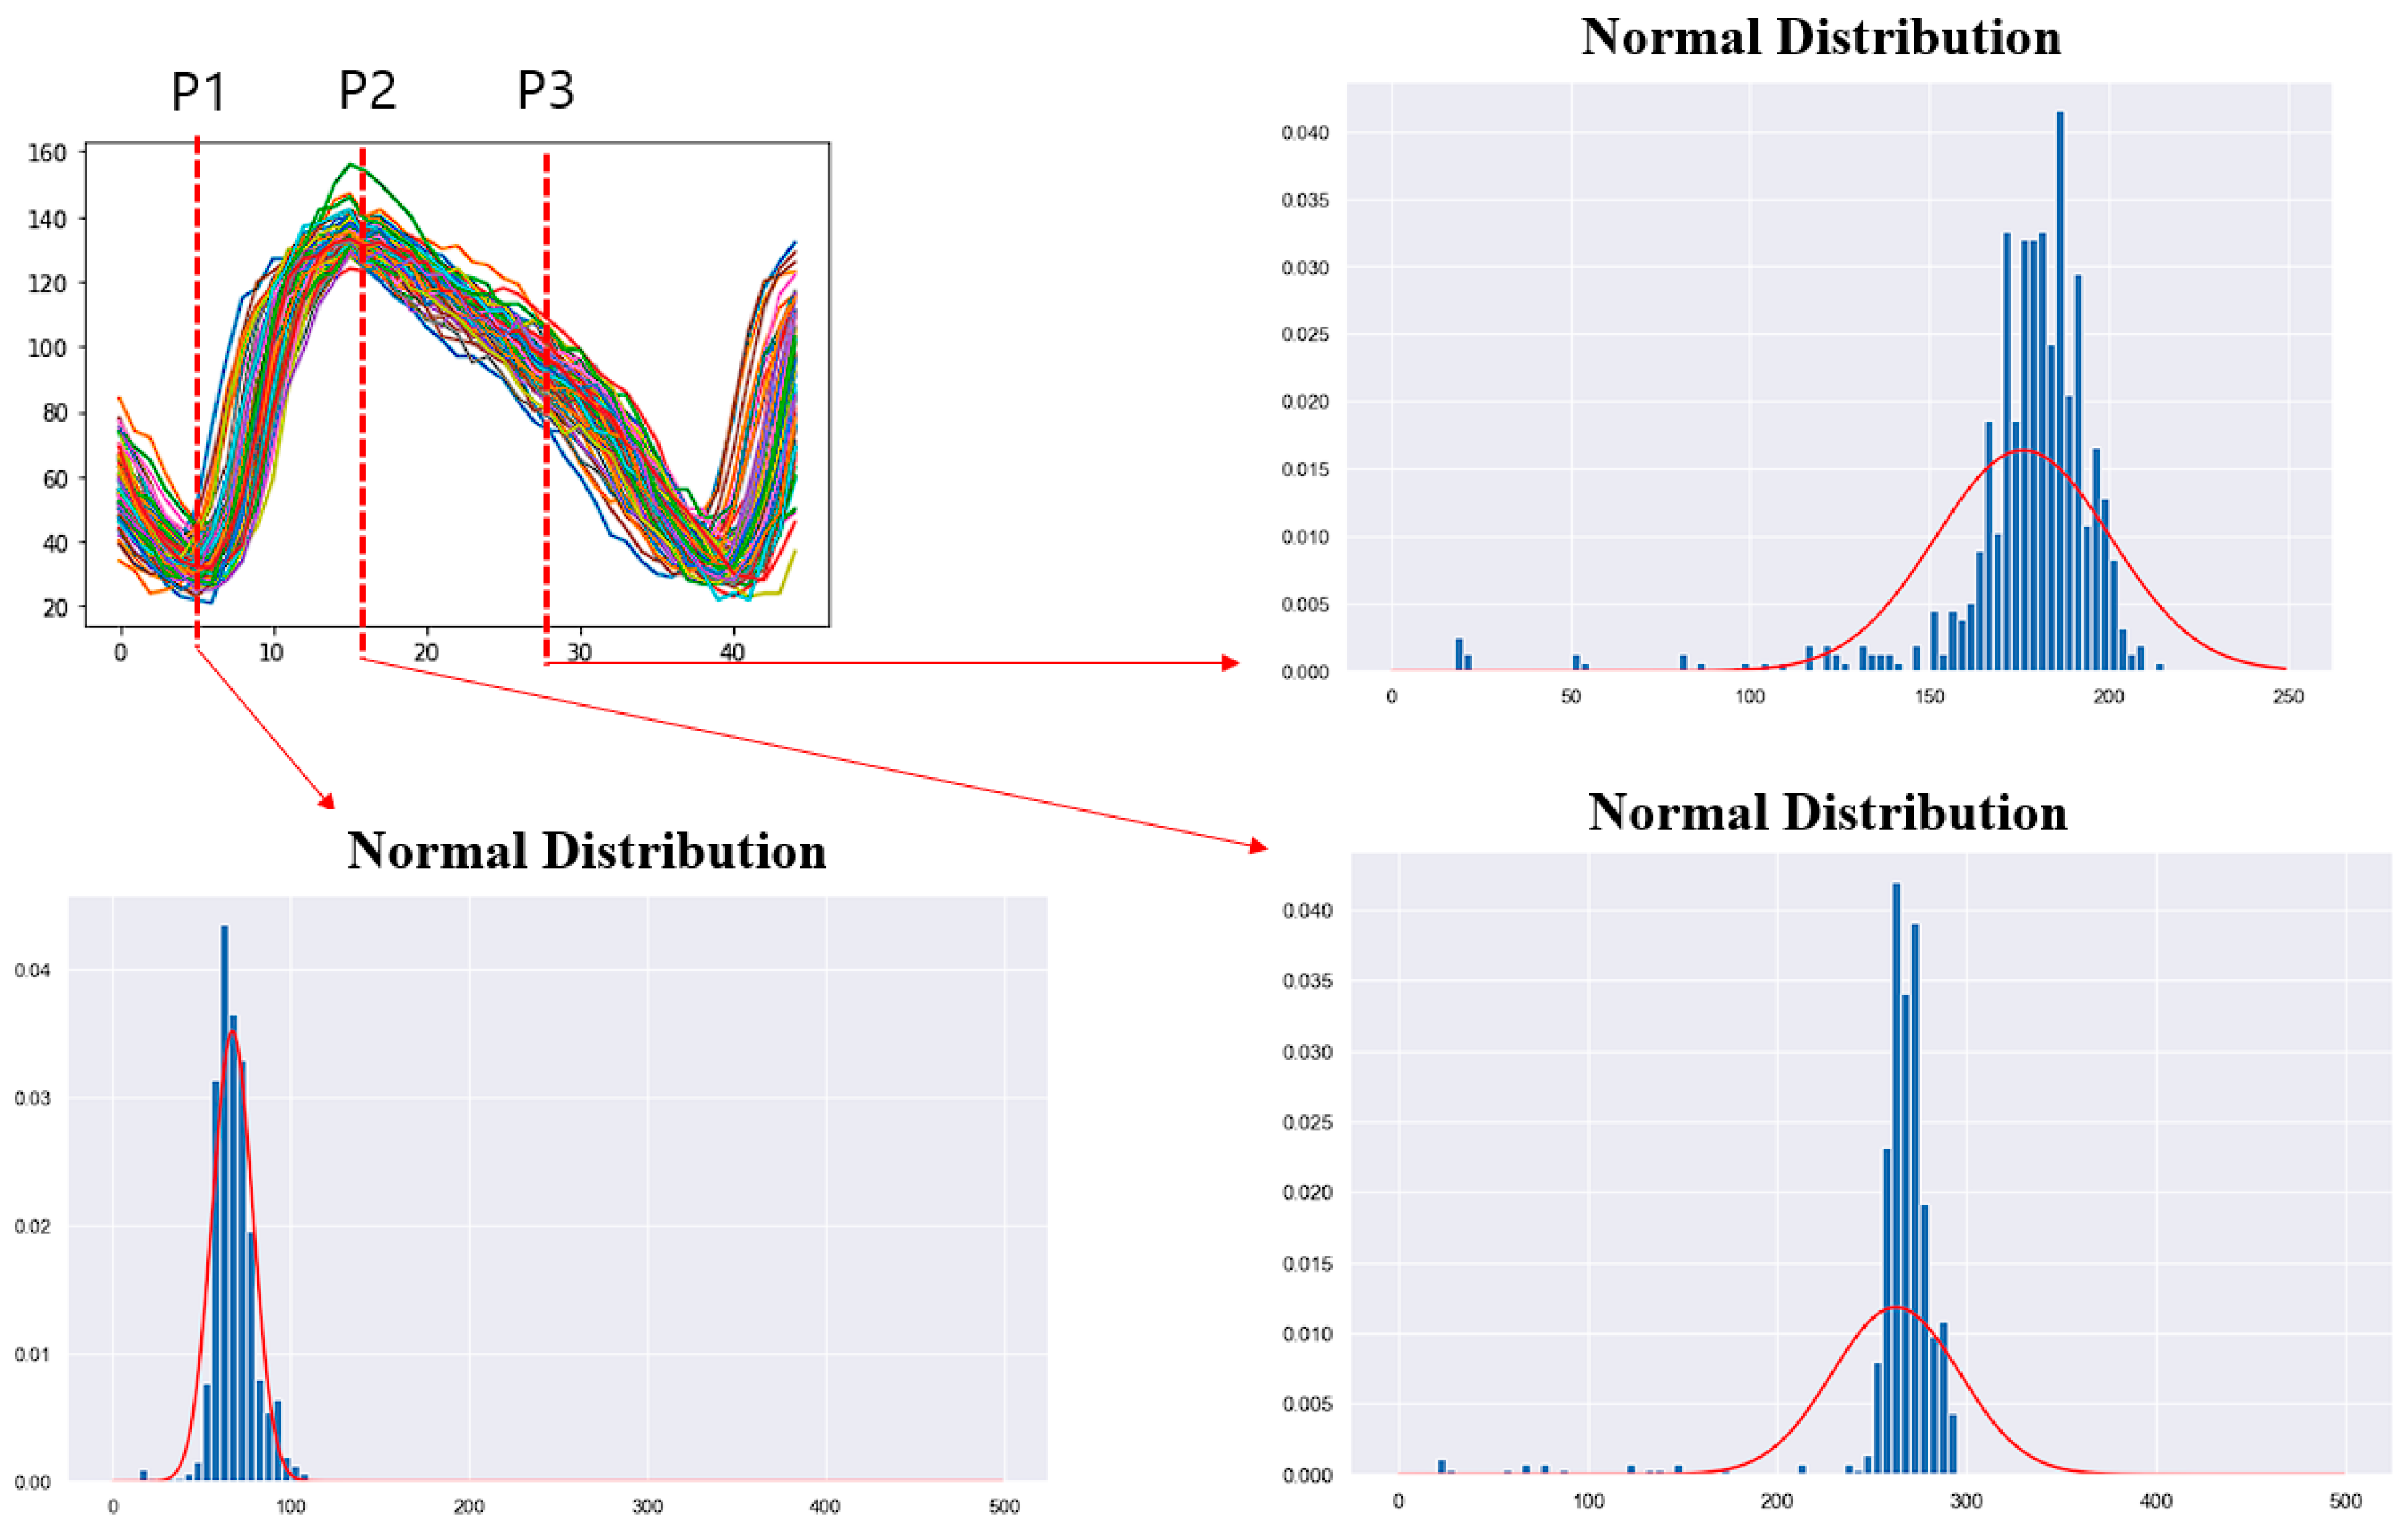
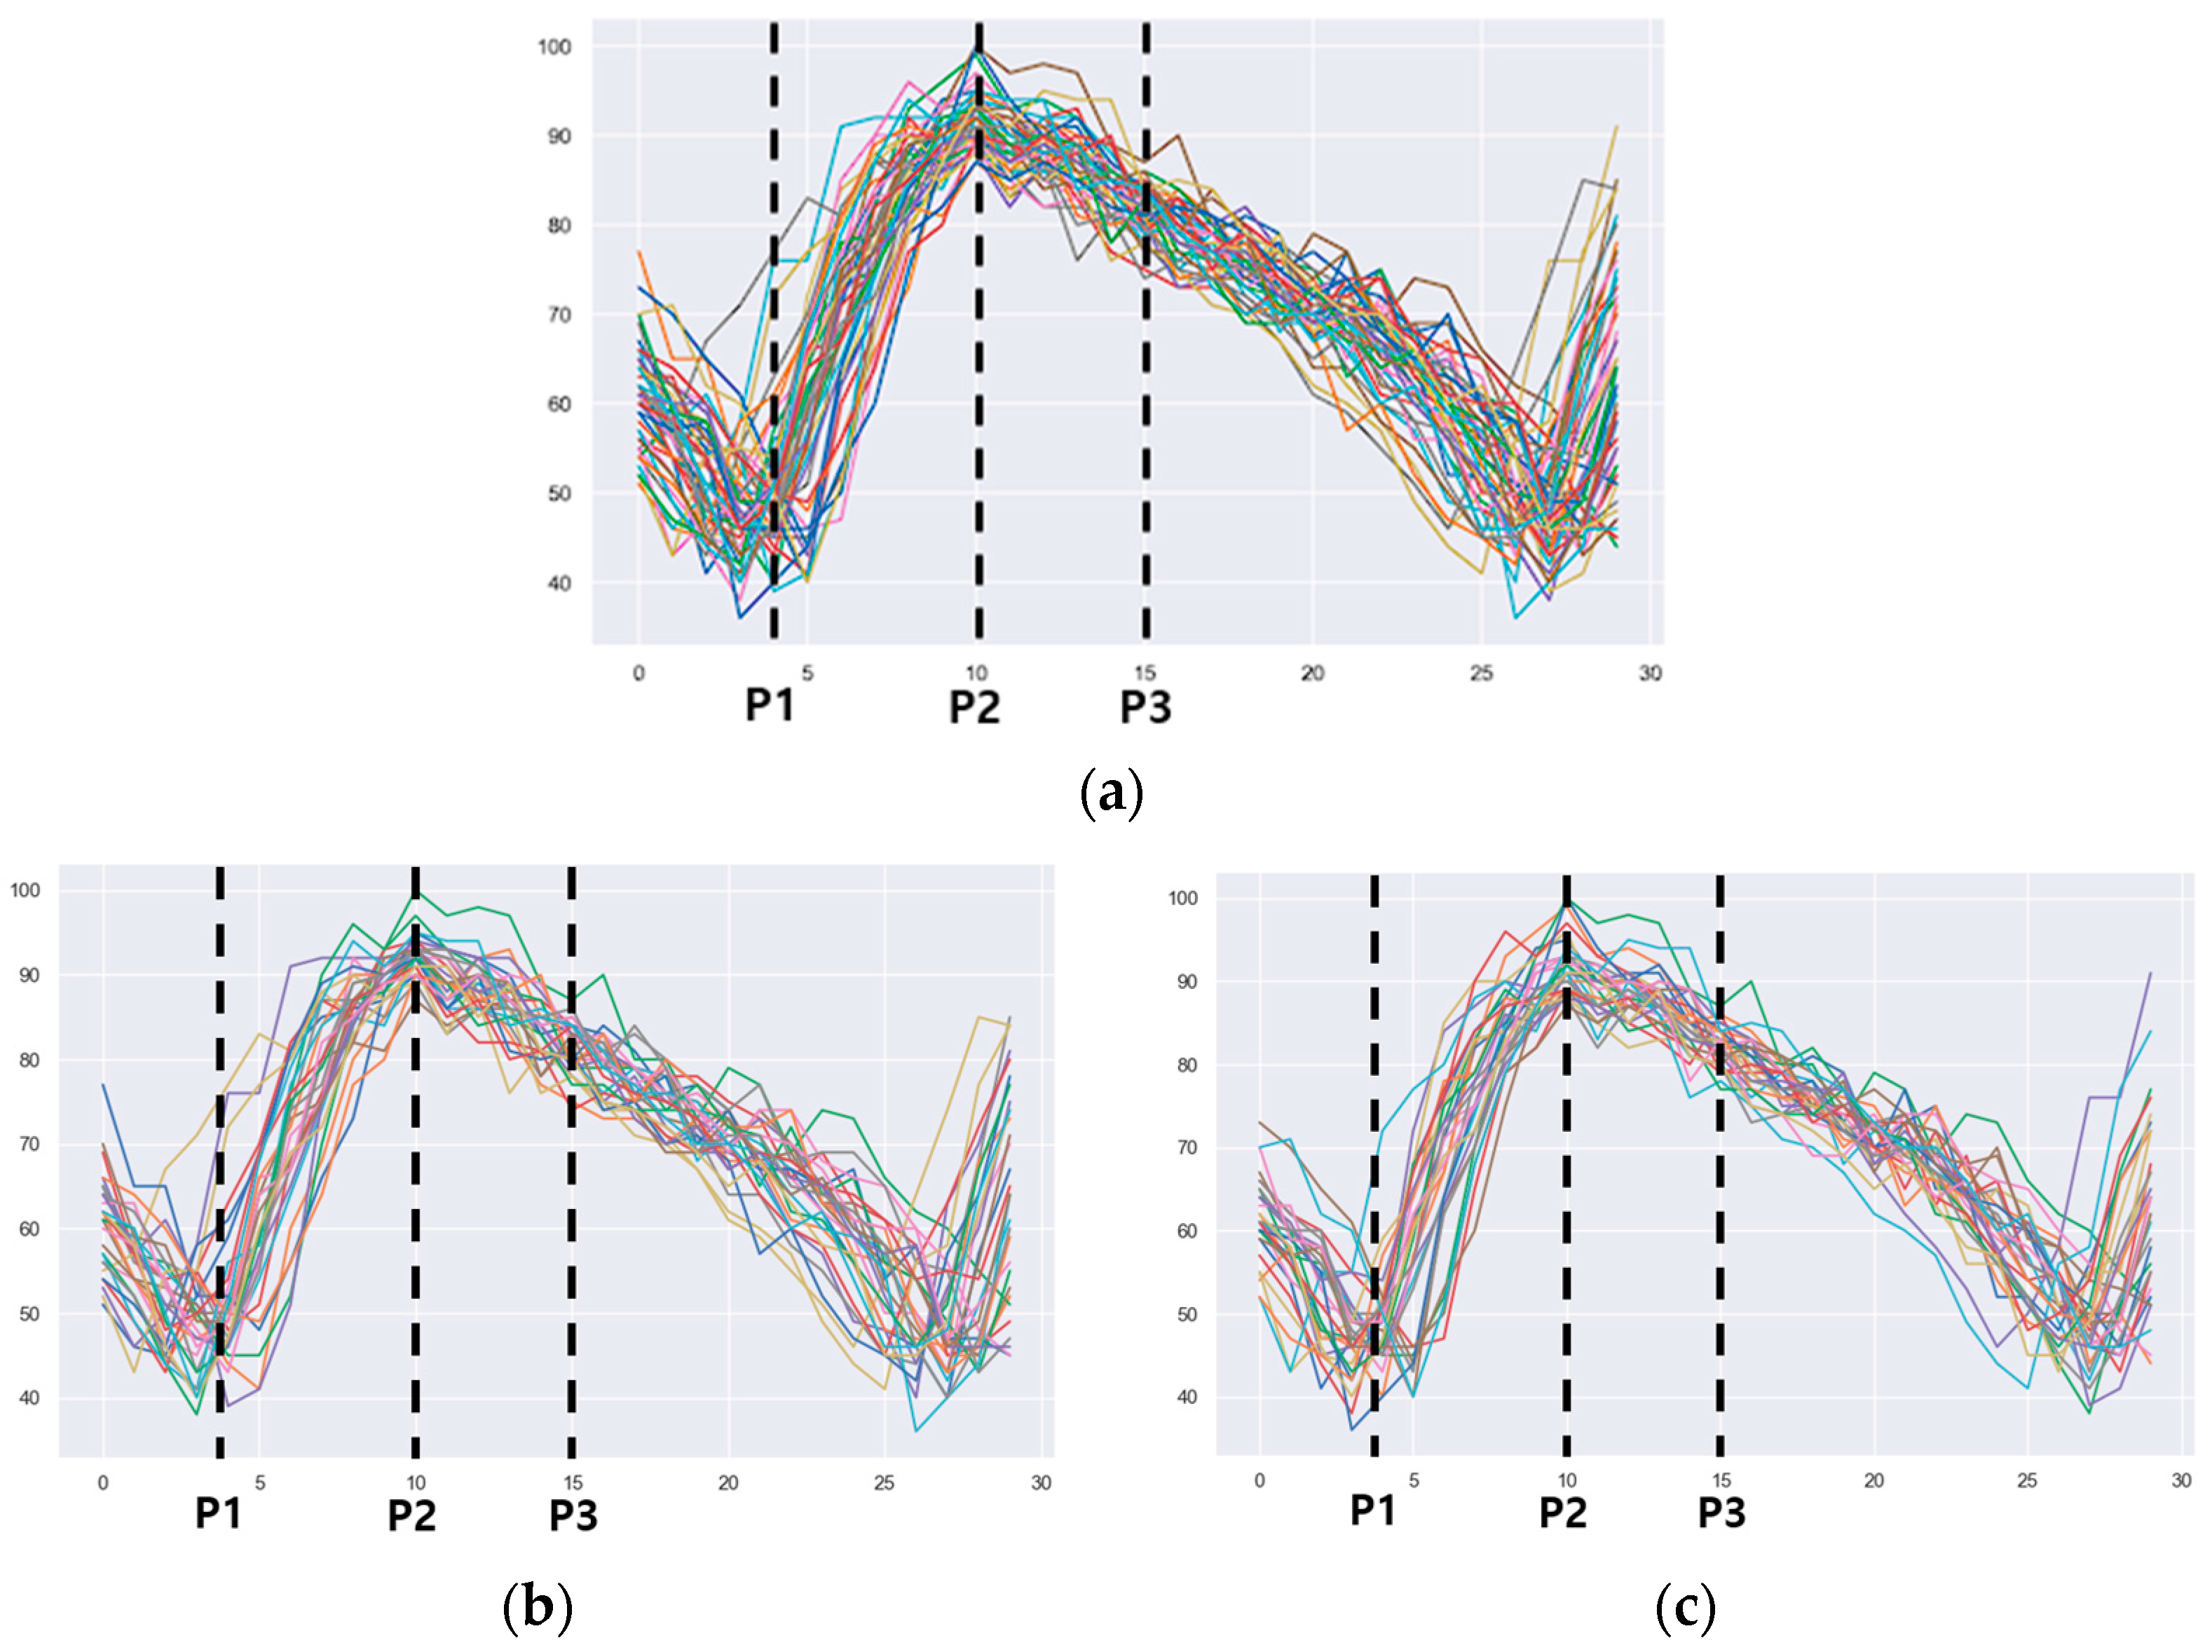
The feature points extracted from the nested envelopes are shown in
Figure 8. One envelope represents one footstep. For the human gait, the main points corresponding to specific events are the heel strike and the toe off points [
7,
14]. These points correspond to the stance phase of the gait. The foot flat and heel off points are also used for calibration [
7]. We extracted two feature points, P1 and P2, as points that had similar behavior to the heel strike and toe off points. The feature point P1 was the point where the foot touches the treadmill, and the stance phase begins. After the first step, one foot touched the treadmill, and the other foot moved away from the treadmill, intersecting with the end of the gait. The feature point P2 was the point where the value of the current consumption was maximized and corresponded to the state just before the transition from mid-stance to terminal stance, when all the pressure was concentrated on one foot. The feature point P3 was extracted based on the point where the value of the current consumption started to decrease. This corresponded to the transition from terminal stance to pre-swing in the gait cycle and coincided with the point when the foot was about to separate from the treadmill. Points with a minimum value after the feature point P2 were excluded because they might overlap with the feature point P1 in the next cycle. The selected feature point P3 was the point where the value of the current consumption started to continuously decrease from the maximum value.
Figure 8a overlays all footsteps,
Figure 8b overlays only the left footsteps, and
Figure 8c overlays only the right footsteps.
4. Experimental Results
In this paper, three feature points were extracted based on one step to model the subject’s gait pattern. By extracting the feature points for normal gait, a gait pattern standard dataset was built; then, the gait pattern of a subject was compared with that corresponding to the standard dataset to determine if the differences between the feature points were within an acceptable range. By doing so, we expected to determine whether the subject’s gait pattern was normal or abnormal. To verify the validity of this modeling, we conducted experiments based on gender, age, and BMI and tested for statistical significance. BMI was included as a comparison indicator because the instantaneous current consumption change of a treadmill is proportional to the pressure applied to the belt. In addition, to determine an abnormal gait, the gait patterns of the left and right feet were compared, i.e., the left and right asymmetrical gait was estimated by comparing differences by gait feature points.
4.1. Feature Point-Based Modeling by Sex
We conducted an experiment to see if there was a significant difference in gait pattern analysis by gender when applying feature point-based gait pattern modeling. To minimize the effect of BMI, we selected four male and four female subjects with a BMI between 20 and 25. In
Table 2, SD is the standard deviation, and the feature point values are the mean values, considering all the subjects. The difference for each parameter was obtained by subtracting the female subjects’ (F) mean value from the male subjects’ (M) minus value.
The average difference for the feature points according to gender was 8.4 and 7.0 for P1 and P2, respectively, and only 5.7 for P3. Although the difference between genders can be interpreted as significant, we cannot rule out the possibility that it was due to the fact that the BMI of the male subjects (22.9, mean) was about 10% higher than the BMI of the female subjects (20.6, mean).
For comparison, a total of five subjects (three males and two females) with BMIs between 25 and 27 were subjected to gait analysis, and the results are summarized in
Table 3. The differences between the male and female values were converted to absolute values. The average difference per feature point was almost similar for P1 and P3 but was 10.5 for P2. Given that P2 had the largest value (mean) of the three feature points, we believe that it changed specifically as the BMI increased. The higher the BMI, the greater the effects on the feature points exerted by physical parameters (height, weight, etc.).
4.2. Feature Point-Based Modeling by Age
The BMI was found to have a significant effect on the feature points in comparison to the gender. We then analyzed the effect of age and BMI on the feature points. For this purpose, a linear regression analysis was performed using BMI and age as dependent variables, and the results are summarized in
Table 4. It can be seen that the BMI had a significant effect on all three characteristic points. In particular, an increase in BMI had the effect of increasing the P2 value by more than three units. Additionally, the p values for all three feature points were found to be <0.05, indicating significant differences. On the other hand, there was almost no change in the characteristic points according to age.
4.3. Feature Point-Based Modeling by BMI
Based on the analysis results reported in the previous section, we excluded the factors of age and gender and conducted a gait analysis by feature point based on BMI. The subjects were divided into three groups according to their BMI: normal (20 to 25), overweight (25 to 30), and obese (30 or more), and the experimental results are summarized in
Table 5.
Table 5 shows the comparison of the subjects’ feature point averages by BMI. Difference is the difference between the maximum and the minimum values of each feature point. It can be seen that, as the BMI increased, the value of each feature point also increased.
In order to visually confirm the results reported in
Table 5, the feature points for each BMI group are displayed in
Figure 9 as a boxplot. As can be seen in
Figure 9, the values of the feature points showed an upward trend as the BMI increased.
The peculiarity is that the boxplot shape of the feature point P3 for the subjects in the BMI 25–30 group and of the feature point P1 for the subjects in the BMI 30+ group was very narrow. This small variation indicated that the gait patterns of the BMI 25–30 group and the BMI 30+ group were similar at a particular feature point.
According to the Kruskal–Wallis test [
23], the BMI was found to be significant as a dependent variable, with a
p value of 0.008. For further analysis, we performed a univariate regression and found that the effect of BMI on the feature points was significant. The BMI was separated into three variables, i.e., normal weight (BMI_normal), overweight (BMI_overweight), and obese (BMI_obese); normal-weight BMI was the control group, and OLS regression was performed to statistically determine the impact on each feature point value. The results for the entire population were also added to the table, indicated as BMI_continuous before separating the groups by BMI.
As shown in
Table 6, the results of the multivariate analysis for the three groups divided based on the BMI were different from the results of the univariate analysis (
Table 5). BMI_normal was the control group, with no numerical data. For the feature point P1, the difference between normal and overweight subjects was not significant, but the difference between normal and obese subjects was significant. For the feature point P2, the differences for both overweight and obese cases compared to normal subjects were statistically significant. For the feature point P3, we observed the same as for P1, i.e., the difference between normal and obese subjects was significant, but the difference between normal and overweight subjects was interpreted as not significant. The value of P1 increased by 3.113 in the case of overweight subjects compared to normal subjects and increased by 19.834 in the case of obese subjects. P2 showed the highest increase by group, with a 10.656 increase for overweight subjects compared to normal subjects and a 37.523 increase for obese subjects. P3 showed a very small increase (0.156) for overweight subjects compared to normal subjects and a very large increase (22.569) for obese subjects.
In summary, the higher the BMI, the higher the value of the feature points extracted from the gait analysis. Therefore, the normal gait of a person with a high BMI should be modeled based on the increased feature point values.
4.4. Feature Point-Based Modeling by BMI for Left and Right Footsteps
The adult gait typically exhibits a symmetrical pattern of left and right stepping [
24]. However, there are some adults who have asymmetrical gait patterns even though they do not have orthopedic or neurological conditions. A difference in the gait pattern between the left and the right foot can still be considered normal if there is no specific medical condition that impairs the gait. Therefore, we need criteria to determine if an asymmetrical gait is abnormal.
To determine the difference between left and right gait, the difference between the values of each feature point for left and right gait was calculated from the collected data. The figures shown in
Table 7 are the differences (absolute value) for each feature point for the subjects’ left and right gait. Also shown in
Table 7 is the BMI, which affected the feature points.
For most subjects, there was no difference in the gait pattern between the two feet. The average difference between the left and the right gait for all subjects per feature point was 0.69 for P1, 0.32 for P2, and 0.38 for P3. In particular, subjects 7, 10, and 16 showed very little difference between their left and right gait, suggesting that they had a very symmetrical gait, with no balance shift to one side.
On the other hand, for subject 11, the difference (5.8) was large for P1, the point where both feet step out. Compared to the averages for each feature point of the other subjects, we can see that the difference between the mean values of P1 for the left and right footsteps for subject 11 was very large. In other words, a distinct asymmetric gait pattern was extracted from subject 11.
We also compared whether the probability of asymmetrical gait was higher in the obese group, because subject 11 was in the obese group, with a BMI of 30 or more. When we restricted the data to subjects in this experimental group, we could not conclude that asymmetrical gait occurred only in the obese group. In particular, the difference for the gait point P1 was more than 1.0 even in the case of subject 1, who was underweight. Therefore, we can assume that the asymmetrical gait is not related to the BMI.
For the other subjects excepting subject 11, the feature point difference between left and right gait was up to 1.11 for P1, 1.10 for P2, and 1.07 for P3. If the normal gait is evaluated by the change in current consumption on a treadmill, the acceptable range of the feature point difference between left and right gait can be estimated to be within ±2.0.
5. Conclusions
The treadmill gait analysis has the advantage that the subject walks at a certain preset speed, and the pressure distribution of each foot can be inferred by measuring the pressure applied during walking. The treadmill gait cycle begins at the heel strike event, with a sharp increase in pressure from the mid-stance to the terminal-stance, and ends with a decrease in pressure just before the toe off event. A similar pressure distribution curve was obtained when a self-made adapter sensor was attached to the treadmill to acquire and visualize the current consumption during walking.
To verify the validity of analyzing treadmill gait patterns by extracting feature points, we conducted experiments based on gender, age, and BMI. First, we found that the feature points differed by gender, but the impact of the BMI was greater than that of gender. There were no significant differences in the feature points associated with age. Based on the BMI, the gait analysis was conducted on three groups: normal, overweight, and obese. For the obese group with a BMI of 30 or more, the mean value of each feature point increased significantly compared to the normal weight and overweight groups. However, the values of feature point P1 were almost similar: 62.30 ± 5.70 for the normal-BMI group, 66.30 ± 4.50 for the overweight group, and 84.70 ± 2.60 for the obese group. For adults with normal gait the value of P1 was almost unchanged in groups with similar BMI.
We conducted an experiment to determine whether the walking patterns of the left and right feet were symmetrical. Although we could not determine whether the asymmetry in the left and right gait patterns was due to musculoskeletal disorders, we found that feature point modeling could detect abnormal patterns. It is expected that if a difference outside the acceptable error range appears for a feature point value, it can provide an indicator to determine whether a subject has a gait abnormality.


