Abstract
This research article explores a hybrid strategy that combines an adaptive iterative filtering (IF) method and the fast discrete lifting-based wavelet transform (LWT) to eliminate power-line noise (PLI) and baseline wander from an electrocardiogram (ECG) signal. Due to its correct mathematical basis and its guaranteed a priori convergence, the iterative filtering approach was preferred over empirical mode decomposition (EMD). The noisy modes generated from the IF are fed to an LWT system so as to be disintegrated into the detail and the approximation coefficients. These coefficients are then scaled using a threshold method to generate a noise-free signal. The proposed strategy improves the quality and allows us to precisely preserve the vital components of the signal. The method’s potency has been established empirically by calculating the improvement in signal-to-noise ratio, cross-correlation coefficient and percent root-mean-square difference for different recordings available on the MIT-BIH arrhythmia database and then compared to numerous existing methods.
1. Introduction
The electrocardiogram (ECG) signal records the electrical action of a human heart during depolarization and repolarization of heart muscle cells over a stretch of time [1]. It is a non-invasive tool that efficiently depicts the useful electrical information collected by employing a set of electrodes tied to the surface of the human body. The electrodes are generally made of non-noble metals such as silver–silver chloride in order to produce a high electrical performance. A twelve-lead ECG system consists of a combination of three limb leads designated as I, II and III, six chest leads designated from V1 to V6 and three augmented limb leads depicted as aVR, aVL and aVF. The three bipolar limb leads define the potential difference between the left arm and right arm, left leg and right arm and left leg and left arm, respectively. The three potentials are related to each other through Einthoven’s law [2]. The unipolar chest leads or precordial leads, which are anatomically placed over the left ventricle, provide a 3D view in reference to Wilson’s central terminal (WCT). The WCT is the sum of the potentials of the right arm, the left arm and the left leg. The remaining three unipolar augmented limb leads consist of a positive electrode in each limb referenced to a modified WCT. The researchers in [3] have discussed the various types of ECG acquisition systems in detail.
An ECG signal is necessarily corrupted by different sorts of noise during its acquisition with frequencies distributed over a wide range of values. These noises include baseline wander (0.15–0.3 Hz), 50/60 Hz power-line interference (narrow bandwidth of 1 Hz), artefacts due to muscle movement (large bandwidth), etc. [4]. The PLI and baseline wander are the most prominent noises that affect and severely distort the clinical information contained in an ECG signal, thereby making it quite laborious to diagnose. These artefacts need to be removed in order to avoid wrong assessments and to improve the diagnostic correctness.
In this paper, we have, therefore, discussed the usage of the iterative filtering (IF)-based method along with the less complex lifting scheme-based DWT to remove different types of noise from an ECG signal. It is pertinent to mention that the IF method does not utilize the ad hoc cubic spline method to form the upper and the lower envelopes. It instead relies on the iterative usage of certain types of moving average filters to generate the oscillatory modes. The improvements generated in the signal quality have been established in terms of two empirical performance parameters viz. improvements in signal-to-noise ratio (SNRimp), cross-correlation values (ρ) and percent root-mean-square difference (PRD) between the original signal and the output denoised signal. These values have further been compared with various au courant methods to prove its numerical efficacy. The various methods used for comparative analysis include eigenvalue value decomposition method as presented in [5] and a hybrid method utilizing highly efficient recursive least squares-based PLI estimator [6] in conjugation with Hilbert vibrational method [7]. Similarly, the results have been compared with the values obtained by using the classical EMD approach in conjugation with DWT or LWT and LPF where the EMD is used to decompose the noisy signal into modes, while DWT and LPF are used to remove high frequency and low frequency noise, respectively.
2. Literature Review
Several robust techniques using digital filters have been implemented to de-noise the ECG signal. In [8], the researchers have introduced two algorithms to realize FIR-based notch filter with minimal hardware to remove PLI noise. In [9], an adaptive ratio-based spectrum correction method based on Hanning window has been implemented to acquire high precision harmonic information with minimal energy leakage. In [10], a comparison between adaptive and non-adaptive notch filters to eliminate 60 Hz noise reveals that the adaptive filter is computationally more efficient and more effective in residual signal entropy reduction. In [11], a new real-time self-parameter-organization piloted acquisition and FIR filtering mechanism was put forward.
Due to the time–frequency localization ability, multiresolution wavelet transform-based methods have been implemented for noise reduction from ECG signals. In [12], DWT-based modulus maximum method has been used, while, as in [13], a threshold method has been implemented on the decomposed signal coefficients. Likewise, a dual tree-based DWT method was implemented in [14] to overcome the aliasing effects of the threshold method. The wavelet-based methods have been successfully used for medical image denoising as well [15,16].
Many purely data-driven computer-based methods have been presented over the last few years. In [5], the eigenvalue decomposition (EVD) method was used, while, as in [17], the Fourier decomposition method (FDM) was utilized. Similarly, many other methods such as Kalman filter [18], variational mode decomposition [19] and principal component analysis [20]-based methods were used to enhance the denoising performance.
Empirical mode decomposition has emerged as one of the most widely used data-driven methods for the removal of various types of noises from ECG signals since it is a purely data-driven mechanism and provides a good resolution in time–frequency (TF) domain [21,22,23,24].
A recent trend utilizing hybrid methods that involve the usage of EMD along with other filtering methods, such as discrete wavelet transform [25], stationary wavelet transform [26], adaptive switching mean filter [27], non-local means [28] and others [29], have been implemented to improve its de-noising efficiency. These schemes involve the combination of the purely data-driven EMD scheme with the various fixed basis methods such as DWT, SWT, etc. The main aim of this procedure is to generate a pure ECG signal. Since this procedure may lead to high computational complexity and a reduction in the processing speed, it becomes pertinent to utilize less complex and faster variants of the EMD as well as that of the wavelet transform.
The rest of the paper is organized as follows: Section 3 describes the theory of methods such as iterative filtering, lifting wavelet transform, wavelet selection, threshold method and dataset used in the proposed method. Consequently, the proposed denoising procedure is explained in detail in Section 4. Simulation results and relevant discussions are given in Section 5 to demonstrate the efficiency of the proposed scheme. Finally, concluding remarks are drawn in Section 6.
3. Preliminaries
3.1. Iterative Filtering
The traditional EMD is an adaptive, purely data-driven decomposition technique [30] that disintegrates a non-stationary and non-linear signal into a band of finite band-limited intrinsic mode functions (IMFs) along with a trend in the TF domain using a recursive strategy termed as sifting. Each IMF is an amplitude modulated–frequency modulated (AM–FM) signal defined as:
It is such that the number of extrema and the zero crossings differ at most by one, such that the mean of its upper and lower envelopes adds to zero [31]. The traditional method for calculating the envelopes from the minima and maxima is not supported by a proper mathematical theory. This is because it relies on an ad hoc method that is unstable and can cause the process to be sensitive to changes in the input signal [32]. Due to its unpredictable nature and unstable design, the sifting operation cannot be guaranteed to converge. To avoid this issue, researchers developed a new method called iterative filtering, which takes into account the various factors that affect the sifting operation. Instead of calculating the mean from the peaks, the researchers used an adaptive moving average to calculate the envelopes [33]. For simplicity, an adaptive local weighted mean is adopted in order for the sifting operation to converge. Consider a moving average operator £ applied on data Z, so that the sifting may be defined as:
where T is analogous to the first proto-IMF, which consists of several extrema in between zero crossings and, therefore, cannot be treated as an IMF. In classical EMD, the proto-IMF W is the mean of the lower and the upper envelopes such that:
when operator £ is applied to data Z successively n number of times, we obtain first IMF as:
Equation (5) implies that the moving average of the signal at each stage of sifting is subtracted from the previous proto-IMF until the obtained signal satisfies the conditions of IMF. In general, the IMF is calculated as:
When the data set has only one local maximum or local minimum, the sifting operation stops. The mode D represents trend of the data function Z. The moving average of Z is defined as , where a(n) = is the mask. While extracting the IMFs, the iterative filters make use of adaptively selected uniform masks for the operator £. The size of such a window can be chosen as:
such that the value of α when adjusted between 2 and 3 fetches best results. Here, M is the size of the data and K is the peak count in the input data. In [34], a non-uniform mask length was defined for the decomposition of non-stationary and non-linear data, but the process takes too much time, which hinders its use for real time applications.
In order to stop the iteration process, a same standard deviation (SD)-based stopping criterion is adopted as was used in the classical EMD method. For a small SD value, a greater number of IMFs are obtained, while, as for a larger value, a smaller number of IMFs are obtained, such that here exists a trade-off between various values of SD. In the numerical analysis, the SD value is generally chosen between 0.001 and 0.2. Once the residue signal becomes less than the adopted threshold or becomes a monotone so that no more IMFs can be derived from it, the process comes to halt. The final monotone or residue is also treated as an IMF. Let be the final residue, then the signal can be reconstructed from the generated IMFs as:
The EMD method uses a spline method to calculate the upper and lower envelope from the maxima and minima of the data, while as the IF method does so by utilizing a moving average filter over the regions of data without calculating any envelopes. The rationale behind using IF is its proper mathematical foundation, which is otherwise lacked by the EMD. Moreover, the IF is computationally more efficient since it generates lesser number of IMFs in comparison to EMD. Figure 1 shows the band of IMFs generated by disintegrating record 102 polluted with 50 Hz PLI and baseline wander noise at −10 dB input noise power.
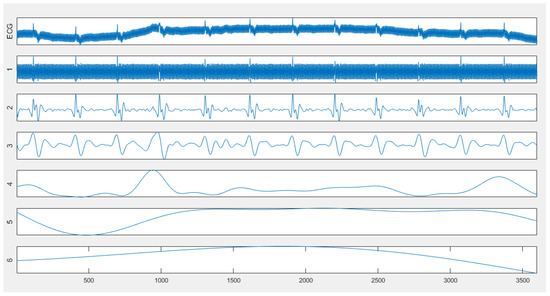
Figure 1.
Intrinsic mode functions of a noisy ECG signal using iterative filtering.
Table 1 draws a comparison between IF and EMD in terms of the number of IMFs generated for multiple ECG records at various input SNR values in the presence of 50 Hz PLI noise and baseline wander. The data reveal that IF generates a lesser number of IMFs at all input noise levels, thereby indicating less memory requirements.

Table 1.
Comparison between IF and EMD in terms of the number of IMFs generated at various input SNR values.
Moreover, as shown in Table 2, the average CPU time consumed by the proposed method is less than that consumed when EMD is used in place of IF, indicating lesser computational complexity of the proposed method.

Table 2.
Comparison between IF and EMD based methods in terms of execution time (in seconds) at various input SNR values.
3.2. Lifting Wavelet Transform
Wavelet transform is a very dynamic mechanism for the analysis and study of non-linear, non-stationary signals. Based on the shifts and dilations of scaling and wavelet functions, a real-valued signal is decomposed into a set of scaling coefficients holding coarse signal data and wavelet coefficients containing detail information. Relying on the property of vanishing moments, a real signal such as ECG is compressed into a few coefficients having large magnitude [35]. Moreover, after every level of decomposition, the frequency resolution doubles while the time resolution is halved. The term “vanishing moments” specifies how many zero moments there are in a wavelet, and it is always equivalent to half the entire number of coefficients. It restricts the ability of wavelets to represent polynomial behavior in a signal. A wavelet with a single vanishing moment encodes a polynomial with a single coefficient (a constant signal element), whereas a wavelet with two vanishing moments encodes a polynomial with two coefficients (constant and linear signal components), and so on. The association between a wavelet’s vanishing moments and its frequency characteristics has been examined analytically in [36].
The traditional wavelets, which are the dyadic translates and dilates of a particular mother wavelet, are regarded as first-generation wavelets. All these wavelets with the exception of Donoho wavelet depend on Fourier transform as their basic construction tool. In 1996, Sweldens developed a lifting method that completely avoided the usage of Fourier transform-based bandpass filter banks and instead divided the data into approximation and detail coefficients using a three-step iteration method utilizing prediction and update operators [37].
Since the classical wavelet transforms rely on the Fourier transform, the scaling coefficients at some scale are viewed as ‘predictors’ for the next higher level of resolution, while as the wavelet coefficients are taken to be the ‘errors’ generated in this prediction process between the scaling coefficients and the predicted data of higher resolution. A DWT framework based on the lifting scheme allows the designing of the second-generation wavelets, which demonstrate improved spectral as well as spatial localization preservation when compared to first generation wavelet-based DWT. The lifting method operates by minimizing the prediction error, while, at the same time, maintains the bi-orthogonality of the wavelets [38]. The algorithm to realize lifting scheme-based wavelet transform varies significantly from the Mallat algorithm used to calculate DWT.
The LWT of a discrete signal Y(n) is performed using the following three steps:
- (a)
- Split: The signal Y(n) is decomposed into two disjoint even and odd subsets as:
- (b)
- Predict: Based on the close relationship between the two subsets, the odd subset is predicted from various neighboring samples of the even subset using a linear prediction operator (P). The odd subset is then replaced by the difference between and the predicted sample, giving the next detail or wavelet coefficient given by:
- (c)
- Update: The even set is updated based on and an updating operator (U) as:
Through lifting, the high frequency detail coefficients and the low frequency approximation coefficients are generated.
The above process is repeated until the intended decomposition level is attained. The signal can be reconstructed using the inverse LWT, which is symmetrical to LWT. The complete lifting scheme involving decomposition and reconstruction is shown in Figure 2. The symbols S, P and U in the forward step represent splitting, predict and update steps, while, as in the reconstruction step, the symbols U, P and M denote update, predict and merge steps, respectively.
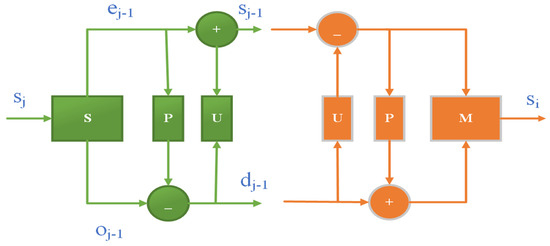
Figure 2.
Direct and inverse lifting.
The lifting scheme is a much more efficient, fast and flexible method resulting in the construction of bi-orthogonal wavelets with better spatial and spectral localization preservation when compared to the first-generation wavelet decomposition method [39]. It requires less memory while at the same time featuring all the important properties of conventional DWT [40,41].
3.3. Selection of Wavelet
Selection of an optimal wavelet for ECG denoising plays a crucial role in the improvement of the performance metrics in a wavelet transform. By the dilation and translation of a single mother wavelet , a wavelet basis is formed, which is orthonormal and compactly supported. The discrete wavelet transform offers a variety of mother wavelets having different characteristics. The general wavelet families mainly include Haar, Daubechies, symlet, Coiflet, Meyer, etc. In the lifting scheme, the choice of mother wavelet remains confined to Haar, Daubechies, symlet and Cohen–Daubechies–Feauveau (CDF) wavelets because other types of wavelets are not eligible for the lifting process. Furthermore, out of the eligible wavelets, only those with a limited order can be lifted. The CDF wavelets, which are also termed as db9/7 wavelets, constitute of two lifting steps containing five operations. It results in the increase in the number of filter coefficients, and, therefore, the complexity increases. Moreover, it does not provide more considerable improvements in the results than sym4 wavelet.
Each wavelet is characterized by the number of vanishing moments, symmetry, orthogonality and bi-orthogonality. The selection of a proper wavelet depends on the particular problem at hand, and, as such, we cannot prioritize any wavelet over another. Based on its symmetry and the similarity with the QRS complex, a symlet wavelet has been chosen for the denoising. The order of symlet wavelets varies from 2 to 45 but wavelets only with order 2 to 8 are feasible for lifting. Out of these, a wavelet of order 4 was chosen since it produced relatively better results in comparison to the other wavelets.
3.4. Threshold
The threshold method plays a vital role in the denoising process. Obtaining a threshold value can be accomplished by various methods such as universal, rigrsure, heursure and minimaxi, etc. [42]. In this paper, the fixed universal method of calculating the threshold was used due to its wide usage and simplicity. It was proposed by Donoho and Johnston and is calculated as:
where represents the standard deviation and N is the number of samples in the noisy signal.
The application of threshold on a signal is carried out by two methods [43]:
- (a)
- Hard threshold: It scales the coefficients with absolute values below the threshold to zero and keeps the remaining coefficients as such. It is implemented as:
- (b)
- Soft threshold: It scales the coefficients with absolute value below the threshold to zero and scales down the remaining coefficients such that:
Here is the updated detail coefficient, is the DWT coefficient and is the threshold.
Moreover, to account for any distortions produced by the boundary effects, a signal extension method-based DWT periodization has been used in place of the default symmetric extension mode.
3.5. Dataset Used
The ECG recordings used were obtained from MIT-BIH arrhythmia database available online. The used MIT-BIH arrhythmia database contains 48 half-hour excerpts of two-channel ambulatory ECG recordings, which have been collected from 47 subjects, from which 25 belonged to male patients aged between 32 to 89, while 22 belonged to female subjects aged between 22 to 89 with records 201 and 202 belonging to a single male patient. From a set of 4000 recordings gathered from a 60% populace of inpatients and 40% from outpatients at Boston’s Beth Israel Hospital, 23 recording signals were chosen at random, while the other 25 recordings were chosen from the same set, which included less prevalent but scientifically significant arrhythmias that otherwise are not well-presented in a small arbitrary sample. All the recorded signals are digitized with a sampling rate of 360 elements per second per channel having a bit-resolution of 11 over a space of 10 mV. Each record has been separately verified by two or more cardiologists with all the differences settled to attain the reference glossary of each beat, which are computer-readable [44]. The dataset has been widely used as a reference for ECG feature extraction [45], classification [46], QRS detection [47] and signal de-noising [48]. The records available of MIT-BIH arrhythmia have been divided by the Association for the Advancement of Medical Instrumentation (AAMI) into five major classes, which contain all the annotated beat types. The five AAMI classes are mapped to MIT-BIH beat types as [49]:
- (a)
- Non-ectopic beat (N): It contains normal (N), left bundle branch block (LBBB), right bundle branch block (RBBB), atrial escape (AE) and nodal escape (NE) beats.
- (b)
- Supraventricular ectopic beat (S): It consists of atrial premature beat (APB), aberrated atrial premature beat (AP), nodal premature beat (NP) and supraventricular premature beat (SP).
- (c)
- Ventricular ectopic beat (V): It consists of only two beat types viz. premature ventricular contraction (PVC) and ventricular escape (VE) beat.
- (d)
- Fusion beat (F): It contains a fusion of ventricular and normal beat.
- (e)
- Unknown beat (Q): It includes paced beat (P), fusion of paced and normal beat (f) and unclassified beat (U).
The records along with their MIT-BIH annotations selected for the analysis are 100 (N), 102 (P), 103 (N), 105 (N), 109 (LBBB), 116 (N), 123 (N), 201 (N), 221 (N) and 231 (RBBB). The dataset for the analysis not only consists of records with normal beats only but also with medical conditions such as paced beat, LBBB beat and RBBB beat as well.
Similarly, various ECG records were obtained from PTB diagnostic ECG database available online [50]. The PTB prototype recorder was used to collect the ECGs for this database, which has 549 records from 290 people and is broadly divided into nine groups, (i) Myocardial Infarction (ii) Cardiomyopathies (iii) Bundle Branch Blocks (iv) Dysrhythmias (v) Myocardial Hypertrophy (vi) Valvular Heart Disease (vii) Myocarditis (viii) Other Conditions and (ix) Healthy Controls. Seven records were chosen from the directory based on different clinical conditions as s0010 (i), s0200 (ii), s03221 (ix), s03641 (iii), s03651 (vi), s03381 (iv) and s03901 (v) [51].
Furthermore, the baseline wander noise has been retrieved from the MIT-BIH Noise Stress Test Database available online at [52].
4. Proposed ECG Denoising Process
We exploit the fast and efficient decomposition capabilities of the lifting method-based discrete wavelet transform along with the adaptive decomposition ability of IF to remove 50/60 Hz power-line interference and low frequency baseline wander from noisy ECG signals. We construct a noisy signal by adding a combination of the two noises at different SNR values to a clean, unadulterated ECG signal in MATLAB software. We have made use of Wavelet and DSP toolboxes present in MATLAB R2016a on a PC with Intel 2.4 GHz core i5 running on 64-bit Windows 10 operating system.
The block diagram of the proposed procedure for denoising is shown in Figure 3.
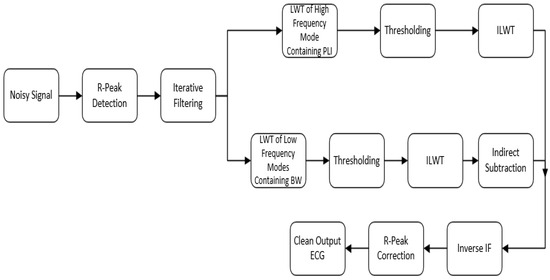
Figure 3.
Block diagram of the proposed denoising process.
Initially, a complete ensemble empirical mode decomposition-based R-peak detection method, as presented in [53], is applied to accurately locate all the fiducial points in the noisy signal. The selected detection method succeeds in providing a sensitivity of 99.96%, positive prediction value of 99.9% and 0.13% error. Once the fiducial points are located, the noisy signal is fed to an IF system to be decomposed into a band of IMFs along with a residue signal. The band of IMFs operates as a dyadic filter bank consisting of overlapping band-pass filters, with the first IMF being a high-frequency component, while the last one being a low-frequency component. The high frequency PLI noise is assumed to be distributed over the first few IMFs, while the low frequency baseline wander is supposed to remain confined over the last few IMFs. The number of such IMFs that contribute to noise are termed as noise order. The number of IMFs containing the PLI noise is represented by p while as the number of IMFs constituting the baseline wander is represented by q. The values of the noise order can be calculated by running a statistical t-test based on the zero-averaging property of the individual IMFs. However, instead of running the statistical t-test, the number of such IMFs is selected by visual scrutiny of the IMFs or a hit and trial method. Figure 4 draws a comparison between the choices of different noise orders in terms of percentage root mean square deviation (PRD) for recording number 100 in presence of 50 Hz PLI and baseline wander. It is evident that the PRD carries smallest value when p = 1 (with q = b − 3), where b is the number of IMFs generated by IF. The IMFs contributing to PLI noise are added to form the first sub-signal, while the second sub-signal is constructed by combining the IMFs containing baseline wander.
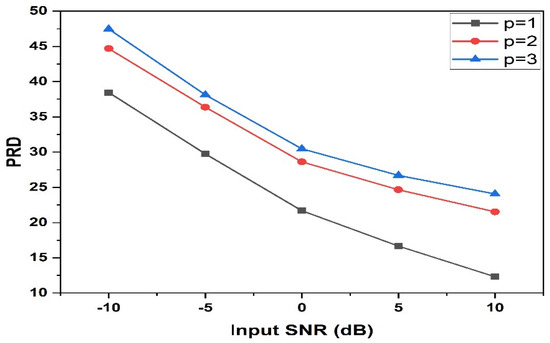
Figure 4.
Performance comparison for noise order for record 100.
Moreover, a Tukey window-based method is used to preserve the QRS complex from the first three IMFs based on the pre-determined positions of the zero crossings on two sides of the R-peaks adjacent to the Q and S peaks. The noisy IMFs are independently fed to an LWT system that decomposes the sub-signals into a band of approximation and detail coefficients at a given level of decomposition. A sym4 wavelet was used since it produces smaller PRD values than sym8, as is evident from Figure 5. Furthermore, due to its nearly symmetric nature and a smaller number of vanishing moments, its use has been preferred over the Daubechies wavelet.
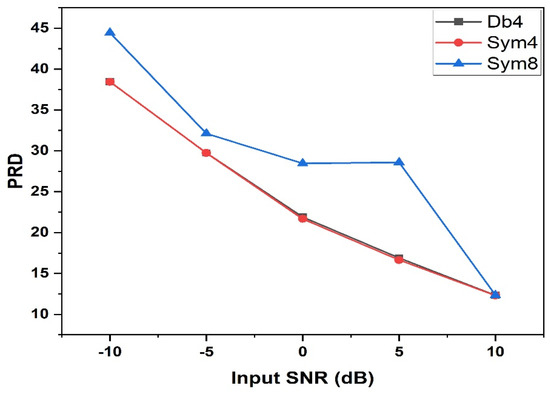
Figure 5.
Performance comparison between various types of wavelets used for record 100.
By applying a multi-level decomposition on the two sub-signals, the data are split into the approximation and the detail coefficients. The level of wavelet decomposition has a considerable effect on the evaluation process. The higher the level to which data is decomposed, the better the results fetched by the thresholding method. A level 3 decomposition is carried out on the first sub-signal, while a 2-level decomposition is adopted for the second sub-signal. These values are selected so as to ascertain the minimal computational complexity whilst obtaining good improvement results. This decomposition level has been experimentally verified to generate relatively better results than the lower levels of decomposition. Table 3 compares the computational complexity for various levels of wavelet decomposition in terms of execution time (T) in the units of second along with the SNR improvement produced. Here, (a,b) represents the number pair indicating decomposition levels selected for PLI and baseline removal, respectively.

Table 3.
Comparison between various wavelet decomposition levels in terms of execution time (T) and the corresponding SNR improvements generated at various input SNR values.
A universal thresholding scheme utilizing a hard thresholding program is then used on the wavelet coefficients because it generates relatively better results in comparison to other adaptive thresholding methods. The hard thresholding scheme is preferentially used over the soft or semi-soft thresholding since it provides smoother and better results by avoiding the discontinuities around the boundaries (see Figure 6).
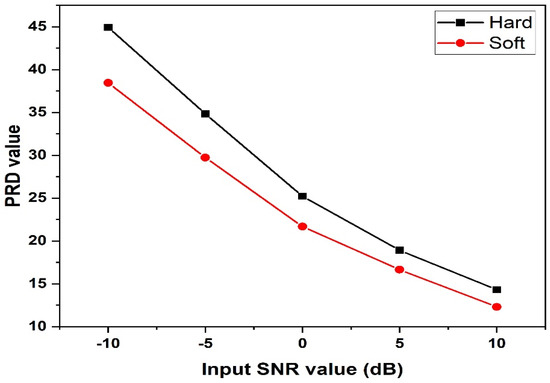
Figure 6.
Performance comparison for different thresholding methods for record 100.
Once the threshold is applied on the coefficients from the first sub-signal by assigning the noisy coefficients a zero value while as keeping the signal coefficients unaltered, the inverse LWT reconstructs the sub-signal back to its original state. Similarly, the processed coefficients of the second sub-signal are rebuilt using the inverse LWT, and, by subtracting it from the input sub-signal, the baseline-wander-free signal is constructed. The processed noise-free sub-signals and the unprocessed IMFs are finally combined to build a clean ECG signal. It is the place to mention that any attenuation produced in R peaks during the process may result in the loss of vital medical information. Hence, an R-peak correction method based on the algorithm presented in [27] is utilized. According to the algorithm, the data elements around each of the located R-peaks present in the denoised signal obtained after filtering it using wavelet thresholding are replaced by the corresponding elements of the noisy signal. It helps in the improvement of SNR values since most of the energy of the ECG signal is contained in the QRS complex.
5. Results and Discussion
5.1. Qualitative Analysis
A combination of a synthetic 50/60 Hz PLI noise and the baseline is supplemented to an ECG signal at various input SNR values of −10 dB, −5 dB, 0 dB, 5 dB and 10 dB in MATLAB R2016a software. A normal ECG signal mainly consists of a P-wave, a QRS complex and a T-wave. The P-wave epitomizes atrial depolarization, the QRS complex indicates ventricular depolarization, while the T-wave is the indication of ventricular repolarization. The presence or absence of any of these waves indicates an underlying cardiological problem. Hence, it becomes imperative that each portion of the ECG signal remains preserved along with its voltage as well as the time axis, otherwise the accurate clinical information may not be inferred, thereby leading to wrong assessments. Figure 7 shows the clean ECG wave from MIT-BIH database, the noisy wave and the denoised wave for recording 102 at an input SNR of 0 dB with 50 Hz PLI noise and baseline wander.
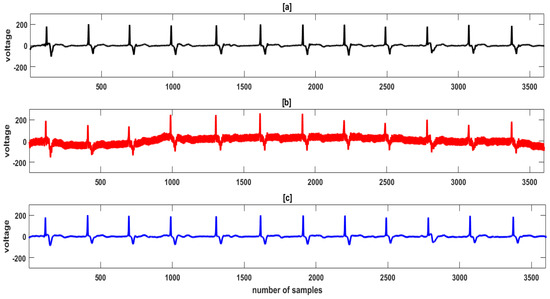
Figure 7.
(a) Original clean input ECG record no. 102 (b) Noisy signal with 50 Hz PLI noise and baseline wander at SNR 0 dB (c) Denoised output signal using IF-LWT method.
Through visual inspection of Figure 7, it can be seen that the morphological characteristics such as P wave, S wave, as well as the morphology of the QRS complex and its amplitude are well preserved. Likewise, the shapes of the various ECG beats present in different recordings have been preserved. The possibility of R-peak attenuation is overcome by the R-peak correction method applied using the information of their location using a proper method. The visual inspection of the waveforms depicts that the presented methods have been successful in judiciously eradicating the noise to a large extent.
The proposed denoising method is able to de-noise the ECG signals with certain cardiac conditions as well. Figure 8 compares the clean ECG record no. 119 affected by premature ventricular contraction (PVC), its noisy form and the final denoised signal. Again, we infer from the visual inspection of the signals that the method has successfully preserved the important features of the signals.
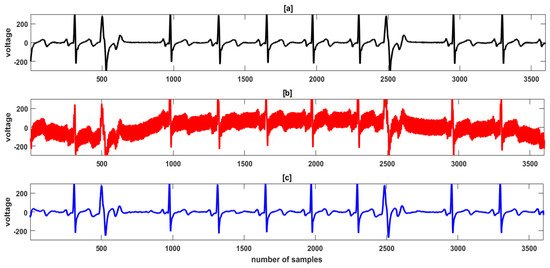
Figure 8.
(a) Original clean input ECG record no. 119 (b) Noisy signal with 50 Hz PLI noise and baseline wander at SNR 0 dB (c) Denoised output signal using IF-LWT method.
5.2. Quantitative Analysis
For the quantitative analysis of the data, 20 sections of signals with time span of 10-sec of lead I at a sampling rate of 360 are utilized. The PLI artefact with fundamental harmonics of 50/60 Hz and baseline wander are added to the clean ECG signals at −10 dB, −5 dB, 0 dB, 5 dB and 10 dB input SNR values, to ascertain that the analysis is performed over a broad range of noise power. The fundamental harmonics of PLI are generated using the sinusoidal signal , where f is the frequency of PLI, and is chosen to have a value of unity. The equation has been used to generate both 50 Hz as well as 60 Hz noise signals. The baseline wander noise signal has been obtained from the noise stress test database, which is available online at [44]. Both noises have been properly scaled corresponding to the required input SNR before adding them to the unblemished ECG signal. The effectiveness of the method has initially been verified individually for both the 50/60 Hz PLI and the baseline wander. The quantitative performance of the proposed denoising method has been evaluated primarily in terms of improvement in the signal-to-noise ratio, cross-correlation coefficients and percent root mean squared difference.
The improvement in SNR of the denoised ECG signal is calculated as:
Additionally, the cross-correlation between the two signals is given by:
Similarly, the PRD is calculated as:
where x(n) is the clean input signal, z(n) is the noisy signal, and y(n) is the output denoised signal.
Table 4 enumerates the improvements in SNR, cross-correlation coefficient and PRD values between the denoised output signals and the clean input signals against each of the records at various input SNR values when evaluated in presence of 50 Hz PLI noise, while Table 5 records the corresponding values when evaluated in presence of 60 Hz noise. The data is highly suggestive that the proposed method improves the SNR values substantially while producing an excellent correlation between the input and the denoised output signal at all levels of input noise. In the case of 50 Hz PLI, the proposed method provides average SNR improvement values of 12.93 dB, 17.43 dB and 21.62 dB at 5 dB, 0 dB, and −5 dB input SNR, respectively. The cross-correlation values are improved by an average of 0.9904, 0.9886 and 0.9868 at the respective input noise levels. Moreover, the average PRD values are 15.03, 16.68 and 17.33, respectively. Similarly, the data recorded in Table 3 reveals the efficiency of the proposed method when used to remove 60 Hz PLI noise.

Table 4.
Improvement in SNR, cross-correlation and PRD values between the denoised signal and the clean input signal in presence of 50 Hz PLI at various input SNR value.

Table 5.
Improvement in SNR, cross-correlation and PRD values between the denoised signal and the clean input signal in presence of 60 Hz PLI at various input SNR value.
Similarly, the average parameter values when the signal is processed for low-frequency baseline wander noise are given in Table 6. Again, the data reveal that the results are excellent at all levels of input noise. The average values of SNR improvement at 5 dB, 0 dB and −5 dB input noise levels are 11.42 dB, 12.11 dB and 13.15 dB, respectively. Similarly, the average cross-correlation values are 0.9729, 0.9404 and 0.8769, while the corresponding PRD values are 25.79, 42.67 and 69.93.

Table 6.
Improvement in SNR, cross-correlation and PRD values between the denoised signal and the clean input signal in presence of baseline wander at various input SNR value.
The performance comparison of the proposed method with EVD and NSLMS in eliminating 50 Hz PLI from a few ECG records has been drawn in Figure 9.
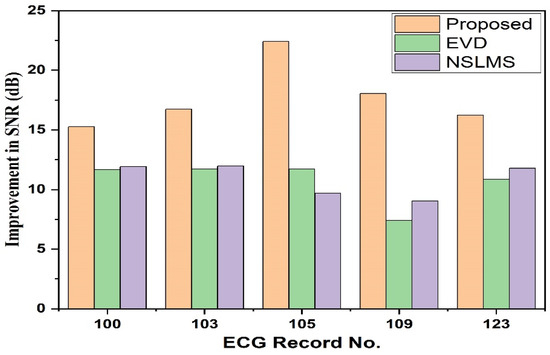
Figure 9.
Comparison of the proposed method with EVD and NSLMS methods in eliminating 50 Hz PLI in terms of the improvements in the SNR values at 0 dB input SNR.
Similarly, the improvements in SNR provided by the proposed method in presence of baseline wander have been compared with those provided by EVD and EMD-EWT [54] methods in Figure 10.
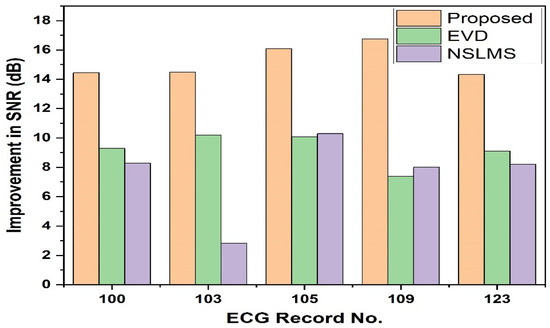
Figure 10.
Comparison of the proposed method with EVD and NSLMS methods in eliminating baseline wander in terms of the improvements in the SNR values at 0 dB input SNR.
The comparison drawn in Figure 9 and Figure 10 reveals that the proposed method generates better signal quality in comparison to some of the state-of-the-art methods.
The proposed method fetches excellent results when implemented to remove both PLI as well as baseline wander simultaneously. Figure 11, Figure 12 and Figure 13 collect the average improvements in SNR values, cross-correlation coefficients and PRD values. Moreover, the results are compared with various other methods for each record at different input SNR values in presence of 50 Hz PLI along with baseline wander [5,6,7,54].
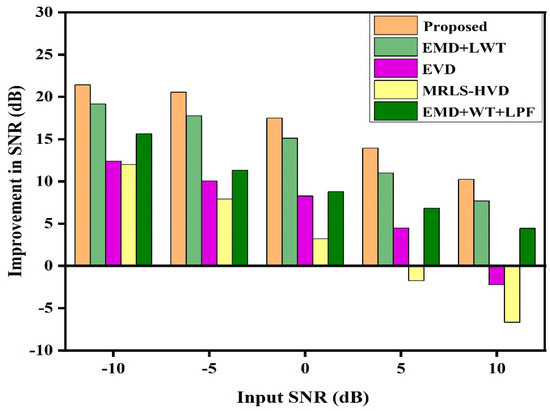
Figure 11.
Comparison between the proposed method and various other methods in terms of average improvements generated in the output SNR in presence of 50 Hz PLI and baseline wander.
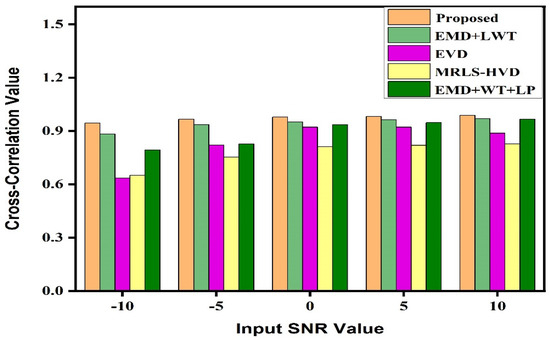
Figure 12.
Comparison between the proposed method and various other methods in terms of average cross-correlation values between the clean input and denoised output signals in presence of 50 Hz PLI and baseline wander.
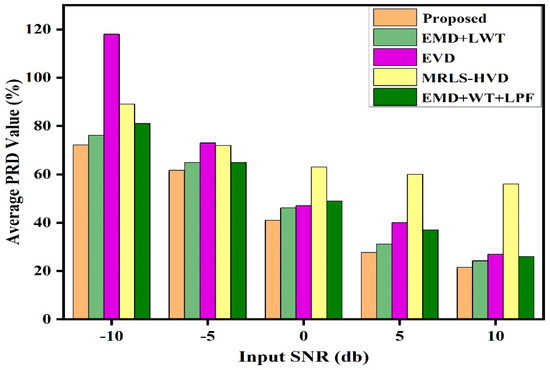
Figure 13.
Comparison between the proposed method and various other methods in terms of average PRD values between the clean input and denoised output signals in presence of 50 Hz PLI and baseline wander.
In Figure 14, Figure 15 and Figure 16, a similar comparison has been drawn between the proposed method and other various methods when implemented to remove 60 Hz PLI along with baseline wander.
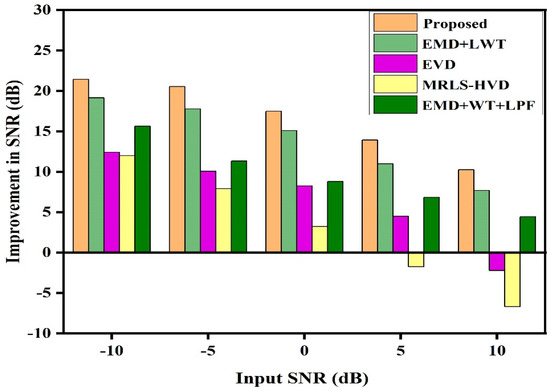
Figure 14.
Comparison between the proposed method and various other methods in terms of average improvements generated in the output SNR in presence of 60 Hz PLI and baseline wander.
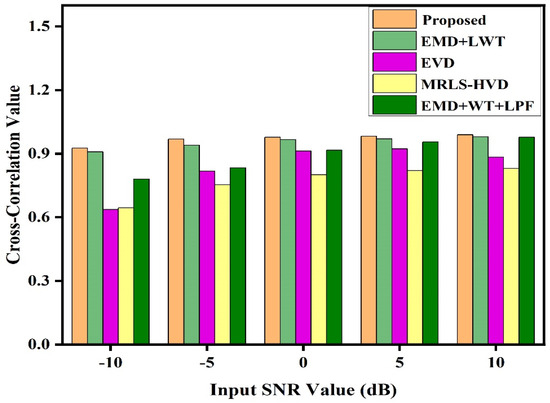
Figure 15.
Comparison between the proposed method and various other methods in terms of average cross-correlation values between the clean input and denoised output signals in presence of 60 Hz PLI and baseline wander.
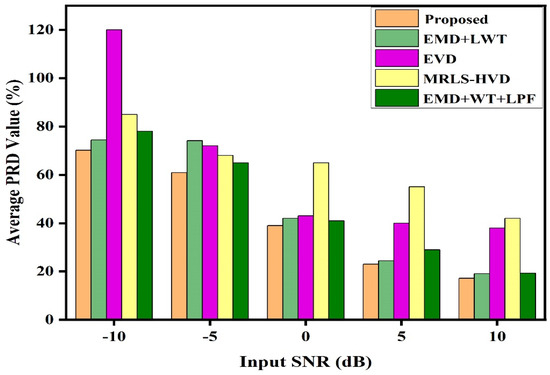
Figure 16.
Comparison between the proposed method and various other methods in terms of average PRD values between the clean input and denoised output signals in presence of 60 Hz PLI and baseline wander.
At −10 dB input SNR, the mean values of SNRimp, cross-correlation and PRD generated by the proposed method are 23.28 dB, 0.9456 and 72.9%, while at 10 dB input SNR these values are 10.47 dB, 0.9888 and 21.55 %, respectively. These values are better than the results from the other four methods used in comparison. Similarly, the proposed method improves the SNR by a significant amount of 21.41 dB in presence of 60 Hz PLI and baseline wander at −10 dB input SNR. The corresponding cross-correlation and PRD values are 0.9258 and 70.12 %, respectively. At higher input SNR value of 10 dB, the equivalent value produced are 10.25 dB, 0.9894 and 17.22%, respectively. The remaining four methods produce lower values of SNRimp and cross-correlation and higher values of PRD, thereby indicating the superiority of the proposed method over them.
6. Conclusions
In this paper, the performance of an adaptive data-driven iterative filtering for denoising an ECG signal has been demonstrated. The IF method has been used to decompose an ECG signal into a band of IMFs in presence of narrowband PLI with frequency 50 Hz or 60 Hz in combination with the wideband low-frequency baseline wander. The denoising has been performed by discarding those IMFs that contribute to noise and then reconstructing the signal from the remaining IMFs. An optimized value for the noise order representing the number of IMFs contributing to noise has been selected. Similarly, the QRS complex has been preserved using a Tukey window-based method. Furthermore, the denoising has been carried out by applying a universal hard threshold on the wavelet coefficients of the noise-affected IMFs using discrete wavelet transform based on the lifting scheme. An R-peak location detection method has been used to apply a window function for the correct preservation of the QRS complex when convolved with the signal components. Finally, R-peak correction method has been applied to undo any attenuation caused in the peak value of QRS complex. The efficiency of the presented method has been validated primarily in terms of the improvements in SNR, cross-correlation coefficients and PRD value between the clean input and the output signal. The numerical values are better in comparison to the results fetched by other considered methods such as EMD-LWT, EVD, MRLS-HVD and EMD-WT-LPF. The signal extension method based on periodization ensures better edge preservation in comparison to the default symmetric method. Moreover, the proper mathematical theory behind the proposed IF method and the lesser number of IMFs generated makes it a better choice for signal decomposition in comparison to the classical EMD method. The presented IF-based method can be modified by using adaptive mask length-based IF, so as to be able to decompose the non-linear and non-stationary data efficiently. Moreover, instead of using a wavelet method for noise removal, other reliable data adaptive schemes such as EWT or FBSE-EWT methods can be availed. These methods can further be used to remove other types of noises such as muscle artefact and electrode motion artefact as well.
Author Contributions
The author contributions are as follows: S.A.M. Conceptualization; methodology; software; validation; formal analysis; investigation; resources; data curation; writing—original draft preparation; writing—review and editing; visualization. S.A.P. Methodology; investigation; resources; data curation; writing—original draft preparation; writing—review and editing; visualization. H.A. Supervision; project administration; funding acquisition; Visualization. B.A.M. Software; validation; formal analysis; writing—original draft preparation; writing—review and editing; visualization. All authors have read and agreed to the published version of the manuscript.
Funding
This research was funded by the Princess Nourah bint Abdulrahman University under Researchers Supporting Project number (PNURSP2023R45), Princess Nourah bint Abdulrahman University, Riyadh, Saudi Arabia.
Institutional Review Board Statement
Not applicable.
Informed Consent Statement
Not applicable.
Data Availability Statement
The data presented in this study are available in the article.
Acknowledgments
The researchers acknowledge the Deanship of Scientific Research at Princess Nourah bint Abdulrahman University for funding this work.
Conflicts of Interest
The authors declare no conflict of interest.
Correction Statement
This article has been republished with a minor correction to the existing affiliation information. This change does not affect the scientific content of the article.
References
- Goldberger, A.L.; Goldberger, Z.D.; Shivlkin, A. Goldberger’s Clinical Electrocardiography: A Simplified Approach, 8th ed.; Elsevier: Amsterdam, The Netherlands, 2012. [Google Scholar] [CrossRef]
- Breen, C.J.; Kelly, G.P.; Kernohan, W.G. ECG interpretation skill acquisition: A review of learning, teaching and assessment. J. Electrocardiol. 2022, 73, 125–128. [Google Scholar] [CrossRef] [PubMed]
- Sornmo, L.; Laguna, P. Bioelectrical Signal Processing in Cardiac and Neurological Applications; Elsevier Academic Press: Burlinton, CA, USA, 2005; Volume 8. [Google Scholar] [CrossRef]
- Maggio, A.C.V.; Bonomini, M.P.; Leber, E.L.; Arini, P.D. Quantification of ventricular repolarization dispersion using digital processing of the surface ECG. In Advances in Electrocardiograms-Methods and Analysis; IntechOpen: London, UK, 2012; pp. 181–206. [Google Scholar] [CrossRef]
- Sharma, R.R.; Pachori, R.B. Baseline wander and power line interference removal from ECG signals using eigenvalue decomposition. Biomed. Sig. Proc. Contr. 2018, 45, 33–49. [Google Scholar] [CrossRef]
- Keshtkaran, M.R.; Yang, Z. A fast, robust algorithm for power line interference cancellation in neural recording. J. Neural Eng. 2014, 11, 026017. [Google Scholar] [CrossRef] [PubMed]
- Feldman, M. Time-varying vibration decomposition and analysis based on the Hilbert transform. J. Sound Vib. 2006, 295, 518–530. [Google Scholar] [CrossRef]
- Meidani, M.; Mashoufi, B. Introducing new algorithms for realizing an FIR filter with less hardware in order to eliminate power line interference from the ECG signal. IET Sig. Process. 2016, 10, 709–716. [Google Scholar] [CrossRef]
- Chen, B.; Li, Y.; Cao, X.; Sun, W.; He, W. Removal of Power line interference from ECG signals using adaptive notch filters of sharp resolution. IEEE Access 2019, 7, 150667–150675. [Google Scholar] [CrossRef]
- Razzaq, N.; Sheikh, S.; Salman, M.; Zaidi, T. An Intelligent Adaptive Filter for Elimination of Power Line Interference from High Resolution Electrocardiogram. IEEE Access 2016, 4, 1676–1688. [Google Scholar] [CrossRef]
- Qaisar, M. Baseline wander and power-line interference elimination of ECG signals using efficient signal-piloted filtering. Healthc. Technol. Lett. 2020, 7, 114–118. [Google Scholar] [CrossRef]
- Yzu, Q.R. Realization and improvement of the modulus maximum de-noising method based on wavelet transformation. J. Nanjing Uni. Posts Telecom. 2009, 29, 74–79. [Google Scholar]
- Donoho, D.L. De-noising by soft-thresholding. IEEE Trans. Inf. Theory 1995, 41, 613–627. [Google Scholar] [CrossRef]
- B’charri, O.E.; Latif, R.; Elmansouri, K.; Abenaou, A.; Jenkal, W. ECG signal performance de-noising assessment based on threshold tuning of dual-tree wavelet transform. BioMed. Eng. OnLine 2017, 16, 16–26. [Google Scholar] [CrossRef] [PubMed]
- Hostalkova, E.; Vyasta, O.; Prochazka, A. Multi-dimensional biomedical image de-noising using Haar transform. In Proceedings of the 2007 15th International Conference on Digital Signal Processing, Cardiff, UK, 1–4 July 2007; pp. 175–178. [Google Scholar] [CrossRef]
- Jerhotova, E.; Svihlik, J.; Prochakza, A. Biomedical Image volumes denoising via the wavelet transform. In Applied Biomedical Engineering; IntechOpen: London, UK, 2011; pp. 435–438. [Google Scholar]
- Singh, P.; Srivastava, I.; Singhal, A.; Gupta, A. Baseline wander and power-line interference removal from ECG signals using Fourier decomposition method. In Machine Intelligence and Signal Analysis; Springer: Singapore, 2019; pp. 25–36. [Google Scholar] [CrossRef]
- Hesar, H.D.; Mohebbi, M. An adaptive Kalman filter bank for ECG denoising. IEEE J. Biomed. Health Infor. 2020, 25, 13–21. [Google Scholar] [CrossRef] [PubMed]
- Singh, P.; Gayadhar, P. Variational mode decomposition based ECG denoising using non-local means and wavelet domain filtering. Austr. Phy. Eng. Sci. Med. 2018, 41, 891–904. [Google Scholar] [CrossRef] [PubMed]
- Shridhar, S.; Karuna, Y.; Saladi, S.; Reddy, R. Denoising of ECG signals using wavelet transform and principal component analysis. In Proceedings of the International Conference on Sustainable Computing in Science, Technology and Management (SUSCOM), Jaipur, India, 26–28 February 2019; pp. 1111–1119. [Google Scholar] [CrossRef]
- Blanco-Velasco, M.; Weng, B.; Barner, K.E. ECG signal denoising and baseline-wander correction based on the empirical mode decomposition. Comp. Biol. Med. 2008, 38, 1–13. [Google Scholar] [CrossRef]
- Zhao, Z.D.; Chen, Y.O. A new method for removal of baseline wander and power line interference in ECG signals. In Proceedings of the 2006 International Conference on Machine Learning and Cybernetics, Dalian, China, 13–16 August 2006; pp. 4342–4347. [Google Scholar] [CrossRef]
- Nimunkar, A.J.; Tompkins, W.J. EMD-based 60-Hz noise filtering of the ECG. In Proceedings of the 2007 29th Annual International Conference of the IEEE Engineering in Medicine and Biology Society, Lyon, France, 22–26 August 2007; pp. 1904–1907. [Google Scholar] [CrossRef]
- Jain, S.; Bajaj, V.; Kumar, A. Riemann Liouvelle Fractional Integral based Empirical Mode Decomposition for ECG Denoising. J. Biomed. Health Infor. 2017, 22, 1133–1139. [Google Scholar] [CrossRef]
- Kabir, M.A.; Shahnaz, C. Denoising of ECG signals based on noise reduction algorithms in EMD and wavelet domains. Biomed. Sig. Proc. Cont. 2012, 7, 481–489. [Google Scholar] [CrossRef]
- Dwivedi, A.K.; Ranjan, H.; Menon, A.; Periasamy, P. Noise reduction in ECG signal using Ensemble Empirical Mode Decomposition with stationary wavelet transform. Circ. Sys. Sig. Proc. 2021, 40, 827–844. [Google Scholar] [CrossRef]
- Rakshit, M.; Das, S. An efficient ECG denoising methodology using empirical mode decomposition and adaptive switching mean filter. Biomed. Sig. Process. Con. 2018, 40, 140–148. [Google Scholar] [CrossRef]
- Kumar, S.; Panigrahy, D.; Sahu, P.K. Denoising of Electrocardiogram (ECG) signal by using empirical mode decomposition (EMD) with non-local mean (NLM) techniques. Biocybern. Biomed. Eng. 2018, 38, 297–312. [Google Scholar] [CrossRef]
- Malik, S.A.; Parah, S.A.; Malik, B.A. Power line noise and baseline wander removal from ECG signals using empirical mode decomposition and lifting wavelet transform technique. Health Tech. 2022, 12, 745–756. [Google Scholar] [CrossRef]
- Huang, N.; Shen, Z.; Long, S.; Wu, M.; Shih, H.; Zheng, Q.; Yen, N.; Tung, C.; Liu, H. The empirical mode decomposition and the Hilbert spectrum for nonlinear and non-stationary time series analysis. Proc. R. Society A Maths. Phys. Eng. Sci. 1998, 454, 903–995. [Google Scholar] [CrossRef]
- Daubechies, I.; Lu, J.; Wu, H.T. Synchro-squeezed wavelet transforms: An empirical mode decomposition-like tool. App. Comp. Har. Analy. 2011, 30, 243–261. [Google Scholar] [CrossRef]
- Singh, P.; Srivastava, P.K.; Patney, R.K.; Joshi, S.D.; Saha, K. Nonpolynomial spline based empirical mode decomposition. In Proceedings of the 2013 International Conference on Signal Processing and Communication (ICSC), Noida, India, 12–14 December 2013; pp. 435–440. [Google Scholar]
- Lin, L.; Wang, Y.; Zhou, H. Iterative filtering as an alternative algorithm for empirical mode decomposition, Advance. Adapt. Data Analy. 2009, 1, 543–560. [Google Scholar] [CrossRef]
- Cicone, A. Iterative filtering as direct method for the decomposition of non-stationary signals. Num. Algorithms 2019, 85, 811–827. [Google Scholar] [CrossRef]
- Daubechies, I. Ten Lectures on Wavelets. Comput. Phys. 1992, 6, 697. [Google Scholar] [CrossRef]
- Peng, Z.; Wang, G. Study on optimal selection of wavelet vanishing moments for ECG denoising. Sci. Rep. 2017, 7, 4564. [Google Scholar] [CrossRef]
- Claypoole, R.L.; Baraniuk, R.G.; Nowak, R.D. Adaptive wavelet transforms via lifting. In Proceedings of the 1998 IEEE International Conference on Acoustics, Speech and Signal Processing, ICASSP’98, Seattle, WA, USA, 15–15 May 1998; Volume 3, pp. 1513–1516. [Google Scholar]
- Lifting Method for Constructing Wavelets. Available online: https://in.mathworks.com/help/wavelet/ug/lifting-method-for-constructing-wavelets.html (accessed on 15 September 2022).
- Chen, H.; Xu, W.; Broderick, N.; Han, J. An adaptive denoising method for Raman spectroscopy based on lifting wavelet transform. J. Raman Spectrosc. 2018, 49, 1529–1539. [Google Scholar] [CrossRef]
- Tek, Y.I.; Tuna, E.B.; Savascihabes, A.; Ozen, A. A new PAPR and BER enhancement technique based on lifting wavelet transform and selected mapping method for the next generation waveforms. Int. J. Electron. Commun. 2021, 138, 153871. [Google Scholar] [CrossRef]
- Anilkumar, P.H.; Beulet, P.A.S. Lifting-based discrete wavelet transform for real-time signal detection. Indian J. Sci. Technol. 2015, 8, 1–6. [Google Scholar] [CrossRef]
- Yang, Y.; Rao, J. Robust and efficient harmonics denoising in large data set based on random SVD and soft thresholding. IEEE Access 2019, 7, 77607–77617. [Google Scholar] [CrossRef]
- Dhannawat, R.A.; Patankar, A.B. New fast and efficient techniques for image denoising using VQ, PCA, SVD, Soft thresholding and wiener. In Advances in Cybernetics, Cognition, and Machine Learning for Communication Technologies; Springer: Singapore, 2020; Volume 643. [Google Scholar]
- MIT-BIH Arrhythmia Database. Available online: https://physionet.org/content/mitdb/1.0.0/ (accessed on 15 September 2022).
- Rodríguez, R.; Mexicano, A.; Billa, J.; Cervantes, S.; Ponse, R. Feature extraction of electrocardiogram signals by applying adaptive threshold and principal component analysis. J. Appl. Res. Tech. 2015, 13, 261–269. [Google Scholar] [CrossRef]
- Luz, E.J.D.S.; Shcwartz, W.R.; Camara-Chavez, G.; Menotti, D. ECG-based heartbeat classification for arrhythmia detection: A survey. Com. Meth. Progr. Biomed. 2016, 127, 144–164. [Google Scholar] [CrossRef] [PubMed]
- Jia, M.; Li, F.; Wu, J.; Chen, Z.; Pu, Y. Robust QRS detection using high-resolution wavelet packet decomposition and time-attention convolutional neural network. IEEE Access 2020, 8, 16979–16988. [Google Scholar] [CrossRef]
- Singh, P.; Pradhan, G. A new ECG denoising framework using generative adversarial network. IEEE/ACM Trans. Comput. Biol. Bioinf. 2020, 18, 759–764. [Google Scholar] [CrossRef]
- Lassoued, H.; Ketata, R. ECG multi-class classification using neural network as machine learning model. In Proceedings of the 2018 International Conference on Advanced Systems and Electric Technologies (IC_ASET), Hammamet, Tunisia, 22–25 March 2018; pp. 473–478. [Google Scholar] [CrossRef]
- PTB Diagnostic ECG Database. Available online: https://www.physionet.org/content/ptbdb/1.0.0/ (accessed on 5 December 2022).
- Bousseljot, R.; Kreiseler, D.; Schnabel, A. Nutzung der EKG-Signaldatenbank CARDIODAT der PTB über das Internet. Biomed. Eng. Biomed. Tech. 2009, 40, 317–318. [Google Scholar] [CrossRef]
- The MIT-BIH Noise Stress Test Database. Available online: https://www.physionet.org/physiobank/database/nstdb/ (accessed on 1 October 2022).
- Hossain, M.B.; Bashar, S.K.; Walkey, A.J.; McManus, D.D.; Chon, K.H. An accurate QRS co mplex and P wave detection in ECG signals using complete ensemble empirical mode decomposition with adaptive noise approach. IEEE Access 2019, 7, 128869–128880. [Google Scholar] [CrossRef]
- Boda, S.; Mahadevappa, M.; Dutta, P.K. A hybrid method for removal of power line interference and baseline wander in ECG signals using EMD and EWT. Biomed. Signal Process. Control. 2021, 67, 102466. [Google Scholar] [CrossRef]
Disclaimer/Publisher’s Note: The statements, opinions and data contained in all publications are solely those of the individual author(s) and contributor(s) and not of MDPI and/or the editor(s). MDPI and/or the editor(s) disclaim responsibility for any injury to people or property resulting from any ideas, methods, instructions or products referred to in the content. |
© 2023 by the authors. Licensee MDPI, Basel, Switzerland. This article is an open access article distributed under the terms and conditions of the Creative Commons Attribution (CC BY) license (https://creativecommons.org/licenses/by/4.0/).