
Machine Learning-Based Intrusion Detection for Rare-Class Network Attacks


Abstract
:1. Introduction
- 1.
- Geometric SMOTE (G-SMOTE) enhances the linear interpolation mechanism by introducing geometric transformations in the feature space, allowing for a better approximation of the distribution of minority class samples. The G-SMOTE algorithm is applied to the intrusion detection field, and the Kernel Density Estimation (KDE) algorithm is adopted to improve the G-SMOTE algorithm to handle imbalanced processing in high-dimensional and imbalanced IoT traffic.
- 2.
- A feature extraction module, Multi-Noise and Attention Mechanism-based Denoising Autoencoder (MDSAE), is proposed to extract deep feature representations of high-dimensional IoT data, thereby enhancing the robustness of the data after dimensionality reduction.
- 3.
- The integration of three modules, KGSMOTE, MDSAE, and Soft-Voting Ensemble Model (SVEDM), for multi-category anomaly detection of IoT traffic effectively improves the overall detection rate of the IDS. The ablation experiments show that these modules are interrelated and mutually reinforcing, and the detection performance of the multi-module IDS is better than that of the single-module intrusion detection model. The comparison experiments show that KGMS-IDS has higher overall detection rate and lower false alarm rate compared with other intrusion detection methods.
2. Related Work
2.1. Dealing with High-Dimensional Data
2.2. Machine-Learning Ensembles
2.3. Dealing with Imbalanced Data
2.4. Our Approach
3. Method
3.1. Model Structure
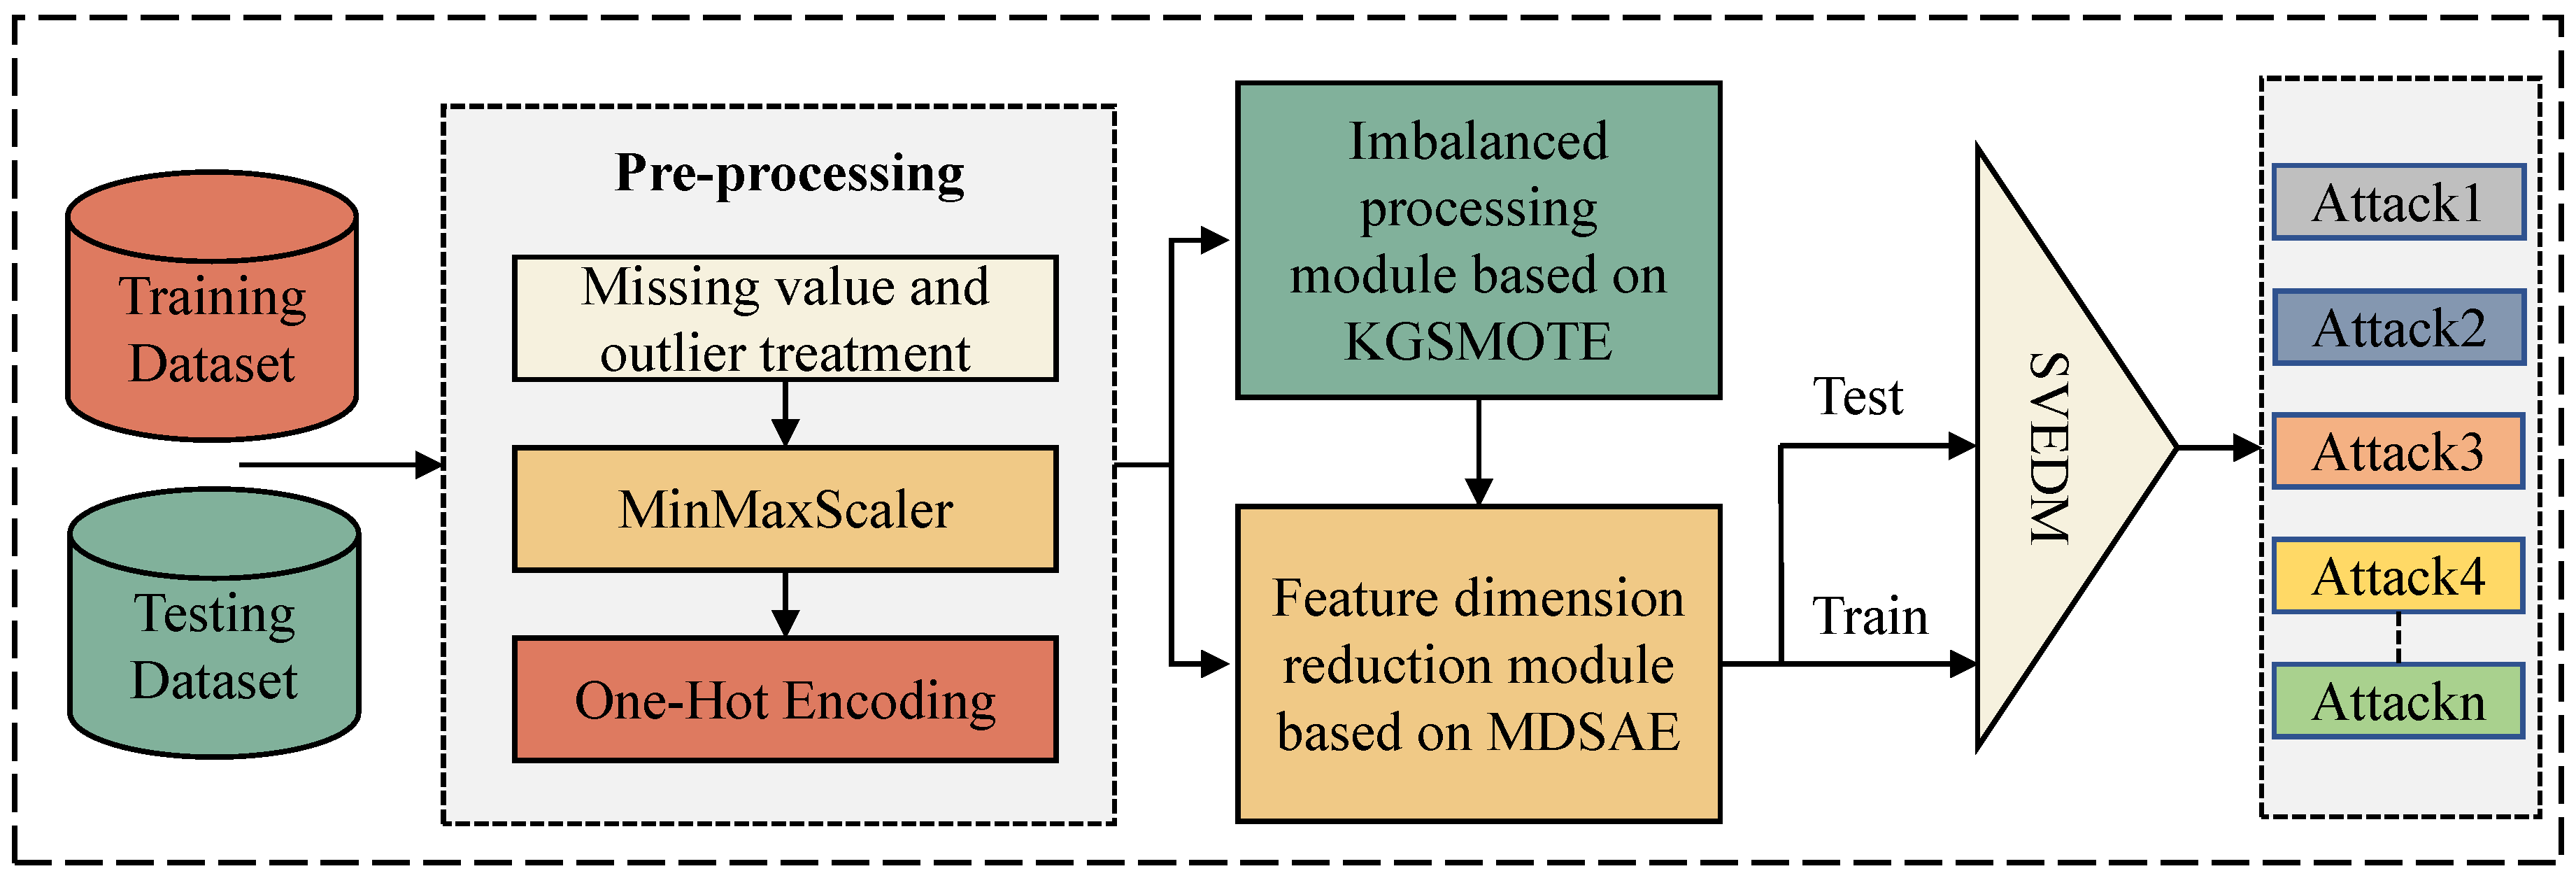
- 1.
- Data pre-processing module: The training and test sets are input into the data preprocessing module, and the data are cleaned and transformed to form clean data for model training. Firstly, the data are processed by missing values and outliers, and the irregular data in the original data such as the rows containing None, NaN, inf, and nan in the numerical feature columns are removed. Secondly, the MinMaxScaler method is used to normalize the cleaned data and limit the pre-processed data to [0, 1]. Finally, the one-hot method is used to transform the discrete features in the data into a vector group of 0, 1 combinations. The data after the data pre-processing module are input to the next imbalance processing module for imbalance processing.
- 2.
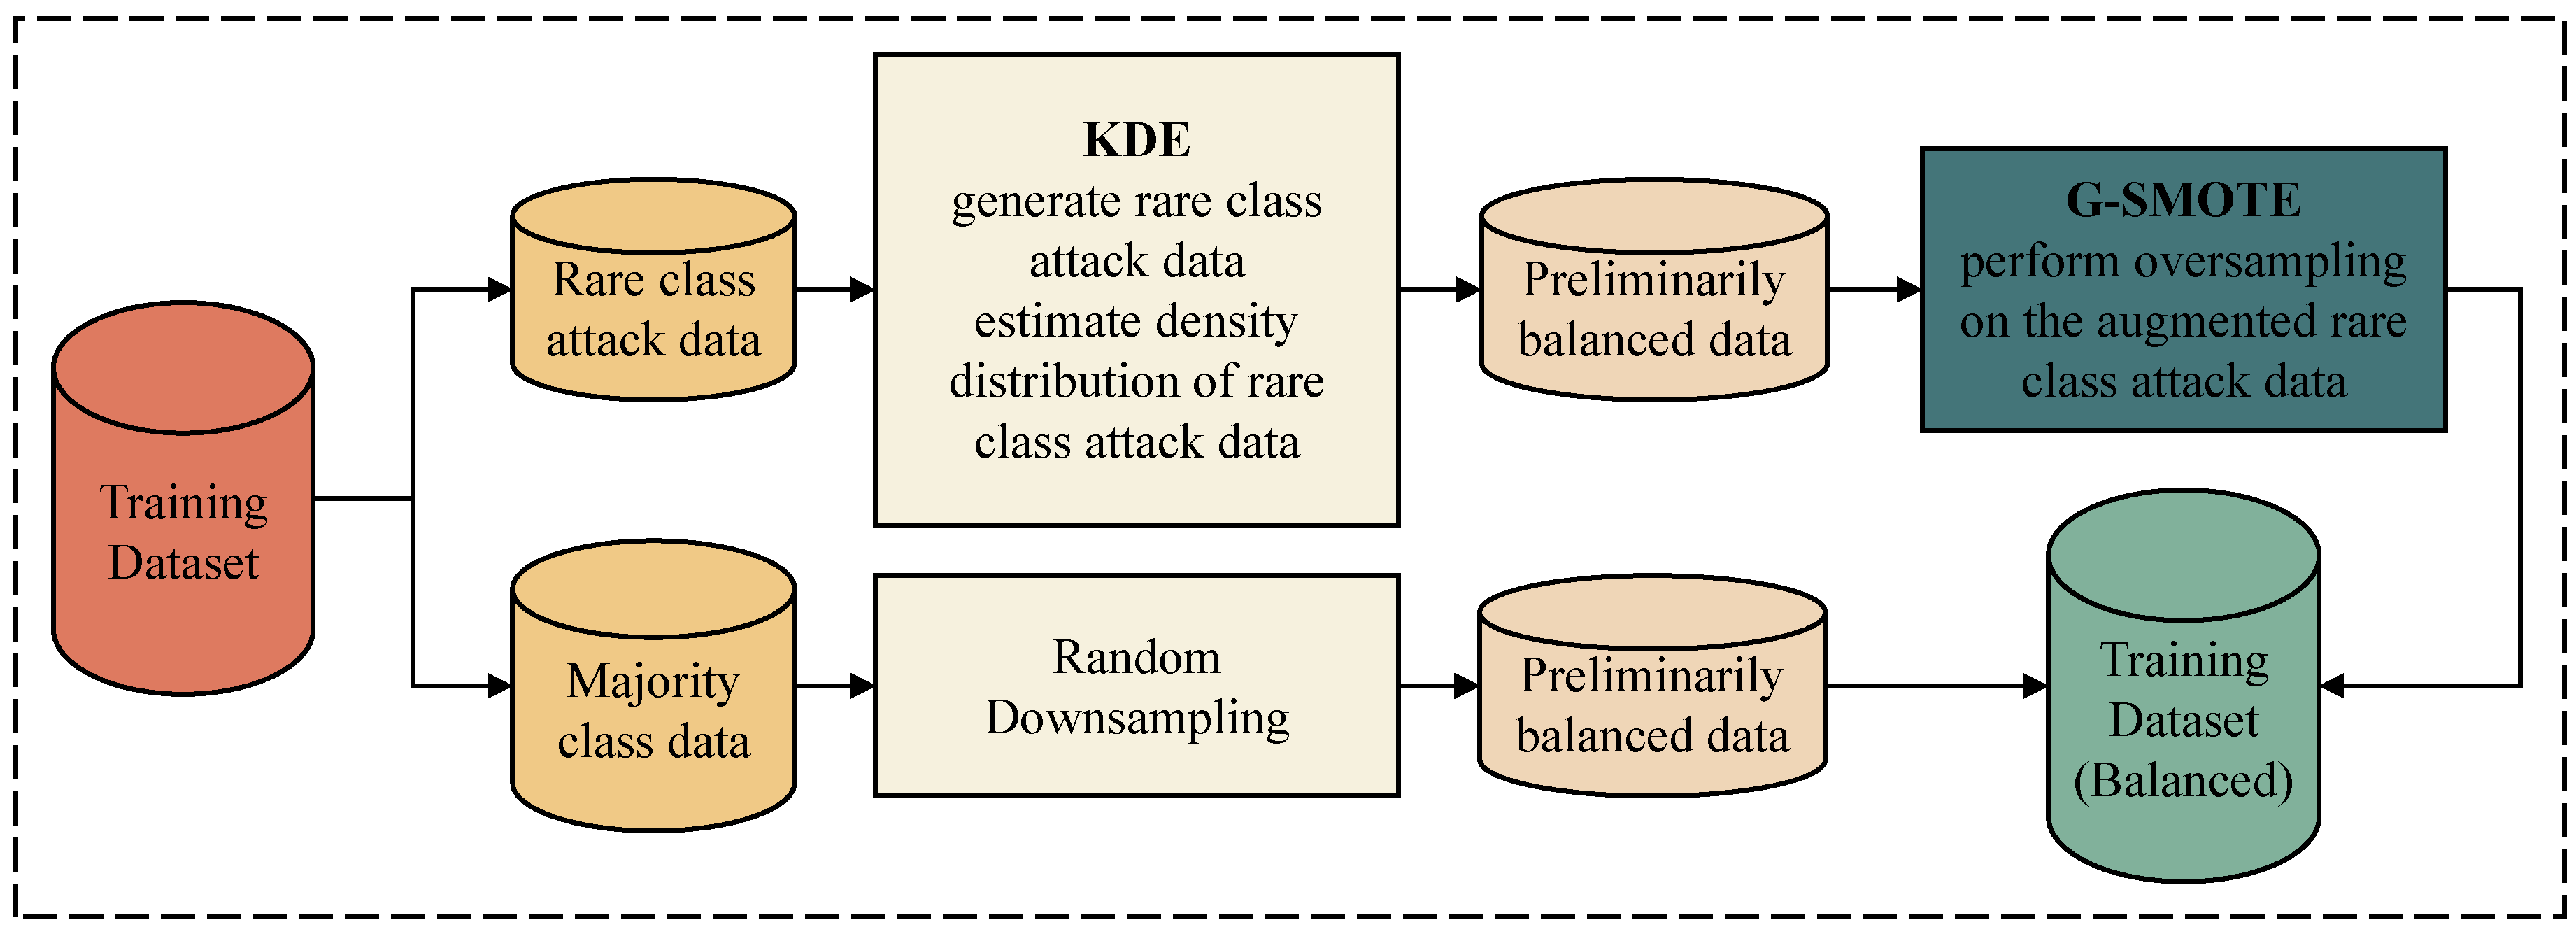
- Imbalance processing module: The imbalance processing module is mainly based on the random downsampling algorithm and the KGSMOTE algorithm. The training set in the data after pre-processing is taken out, and the training set is input into the imbalance processing module based on KGSMOTE. The majority class traffic in the dataset is first randomly downsampled, and then the rare-class attack data are generated by the KGSMOTE algorithm. It should be noted that the KGSMOTE model only performs imbalance processing on the training set to meet the requirements of an IDS deployed in a real IoT environment. The data after the imbalance processing module are input to the feature downsampling module for feature downsampling.
- 3.
- Feature reduction module: The training data processed by the imbalance processing module are input into the MDSAE-based feature reduction module to train the MDSAE model. The encoder part of the trained MDSAE model is taken out and the trained parameters are kept. The trained encoder is then used to perform feature downscaling on the training and test sets of the IoT dataset, respectively. The dimensionality reduction removes the redundant information from the original high-dimensional data and improves the robustness of the data. The processed data from the feature dimensionality reduction module are input into the classification module to detect multi-class anomalous attacks.
- 4.
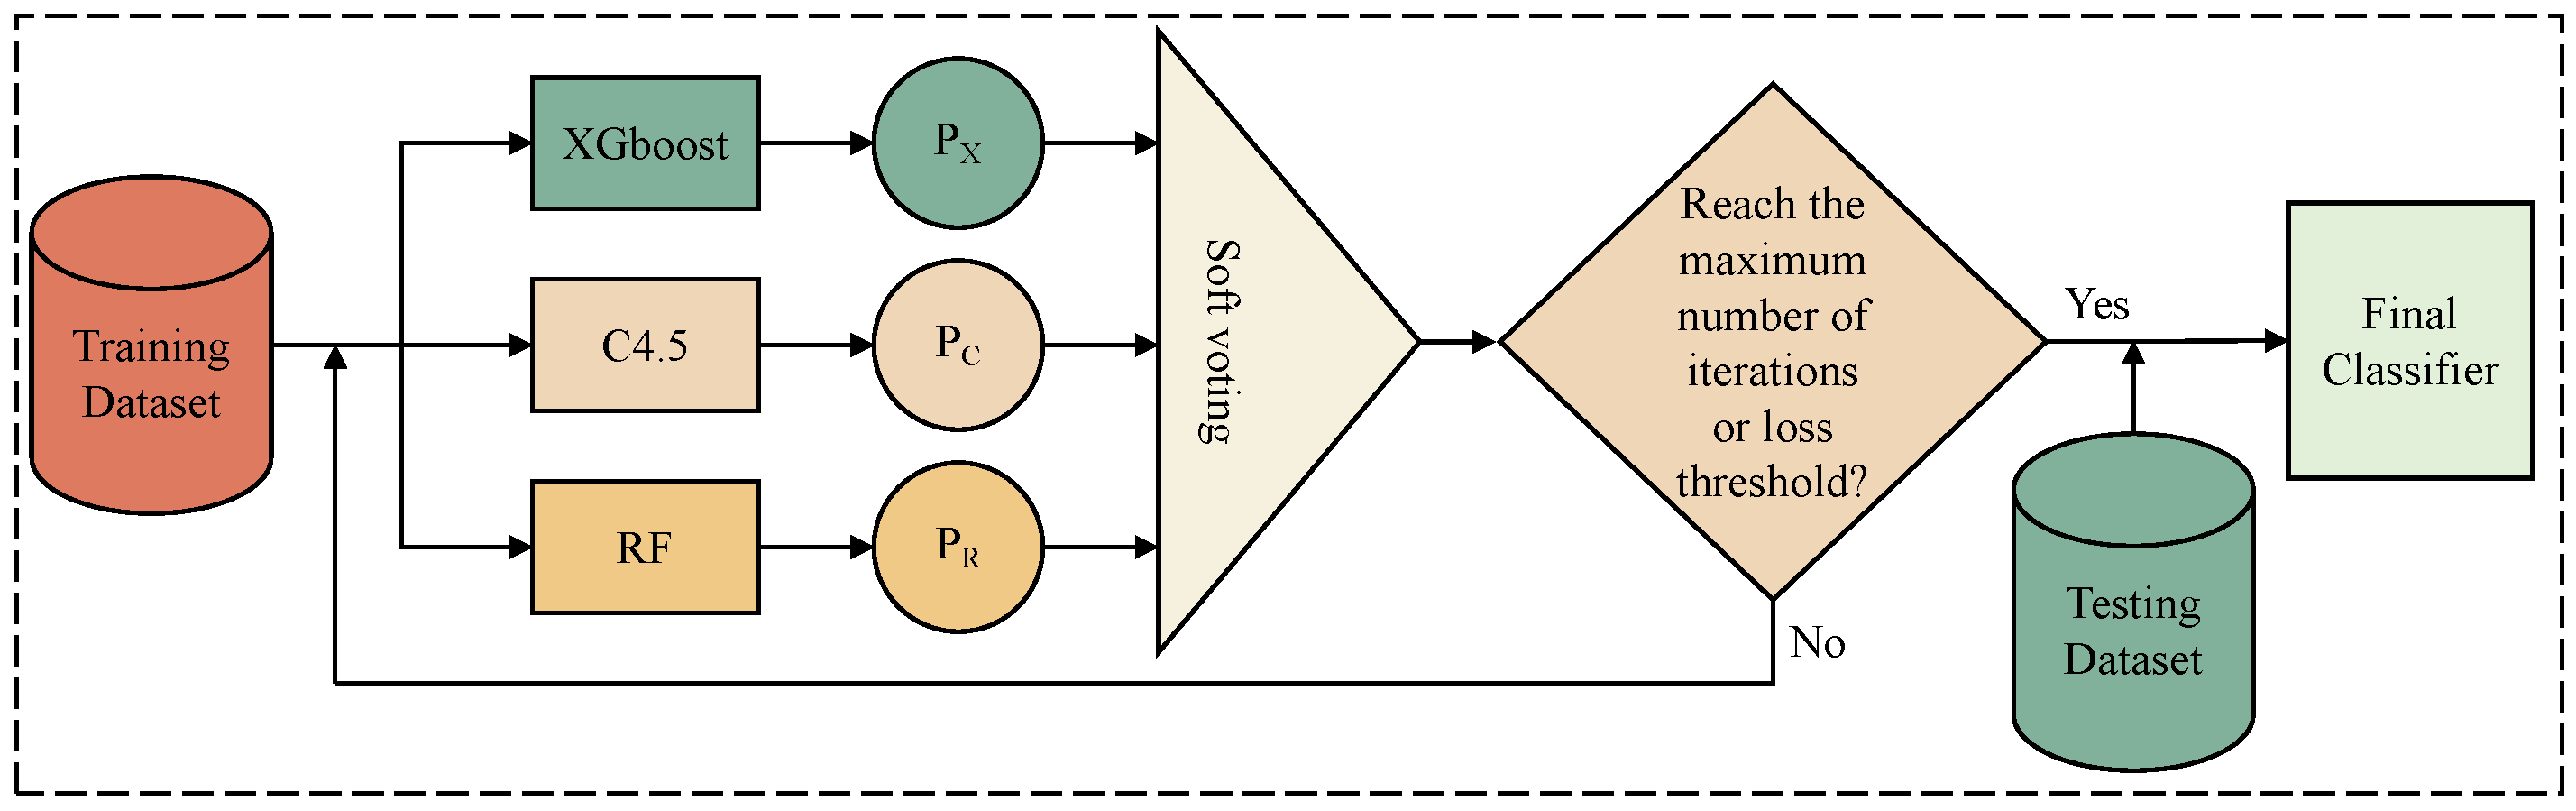
- Classification module: First, the SVEDM-based classification module is trained using the training dataset processed by the dimensionality reduction module. Then, the test dataset is input into the trained classification module for multi-classification anomaly detection, and the final detection results are obtained.
3.2. Imbalanced Data Processing Module Based on KGSMOTE
| Algorithm 1: Oversampling algorithm of KDE-based G-SMOTE. |
| Input: Rare-class attack data R = {r1, r2, r3, …, rn} |
| Output: Augmented rare-class attack data |
| 1: Use KDE to estimate density distribution of rare-class attack data |
| density = kernel_density_estimation(rare_class_attack_data, h) |
| 2: Generate new rare-class attack data based on the estimated density distribution |
| new_rare_class_attack_data = generate_data_from_density(density) |
| 3: Combine new rare-class attack data with original training data |
| training_data = combine(original_training_data, new_rare_class_attack_data) |
| 4: Use G-SMOTE to perform oversampling on the augmented rare-class attack data |
| oversampled_data = G_Smote(training_data) |
| 5: Return oversampled_data |
| 6: End |
3.3. Feature Dimension Reduction Module Based on MDSAE
3.4. A Multi-Class Anomaly Detection Module Based on SVEDM
3.5. Dataset Description
3.5.1. NSL-KDD
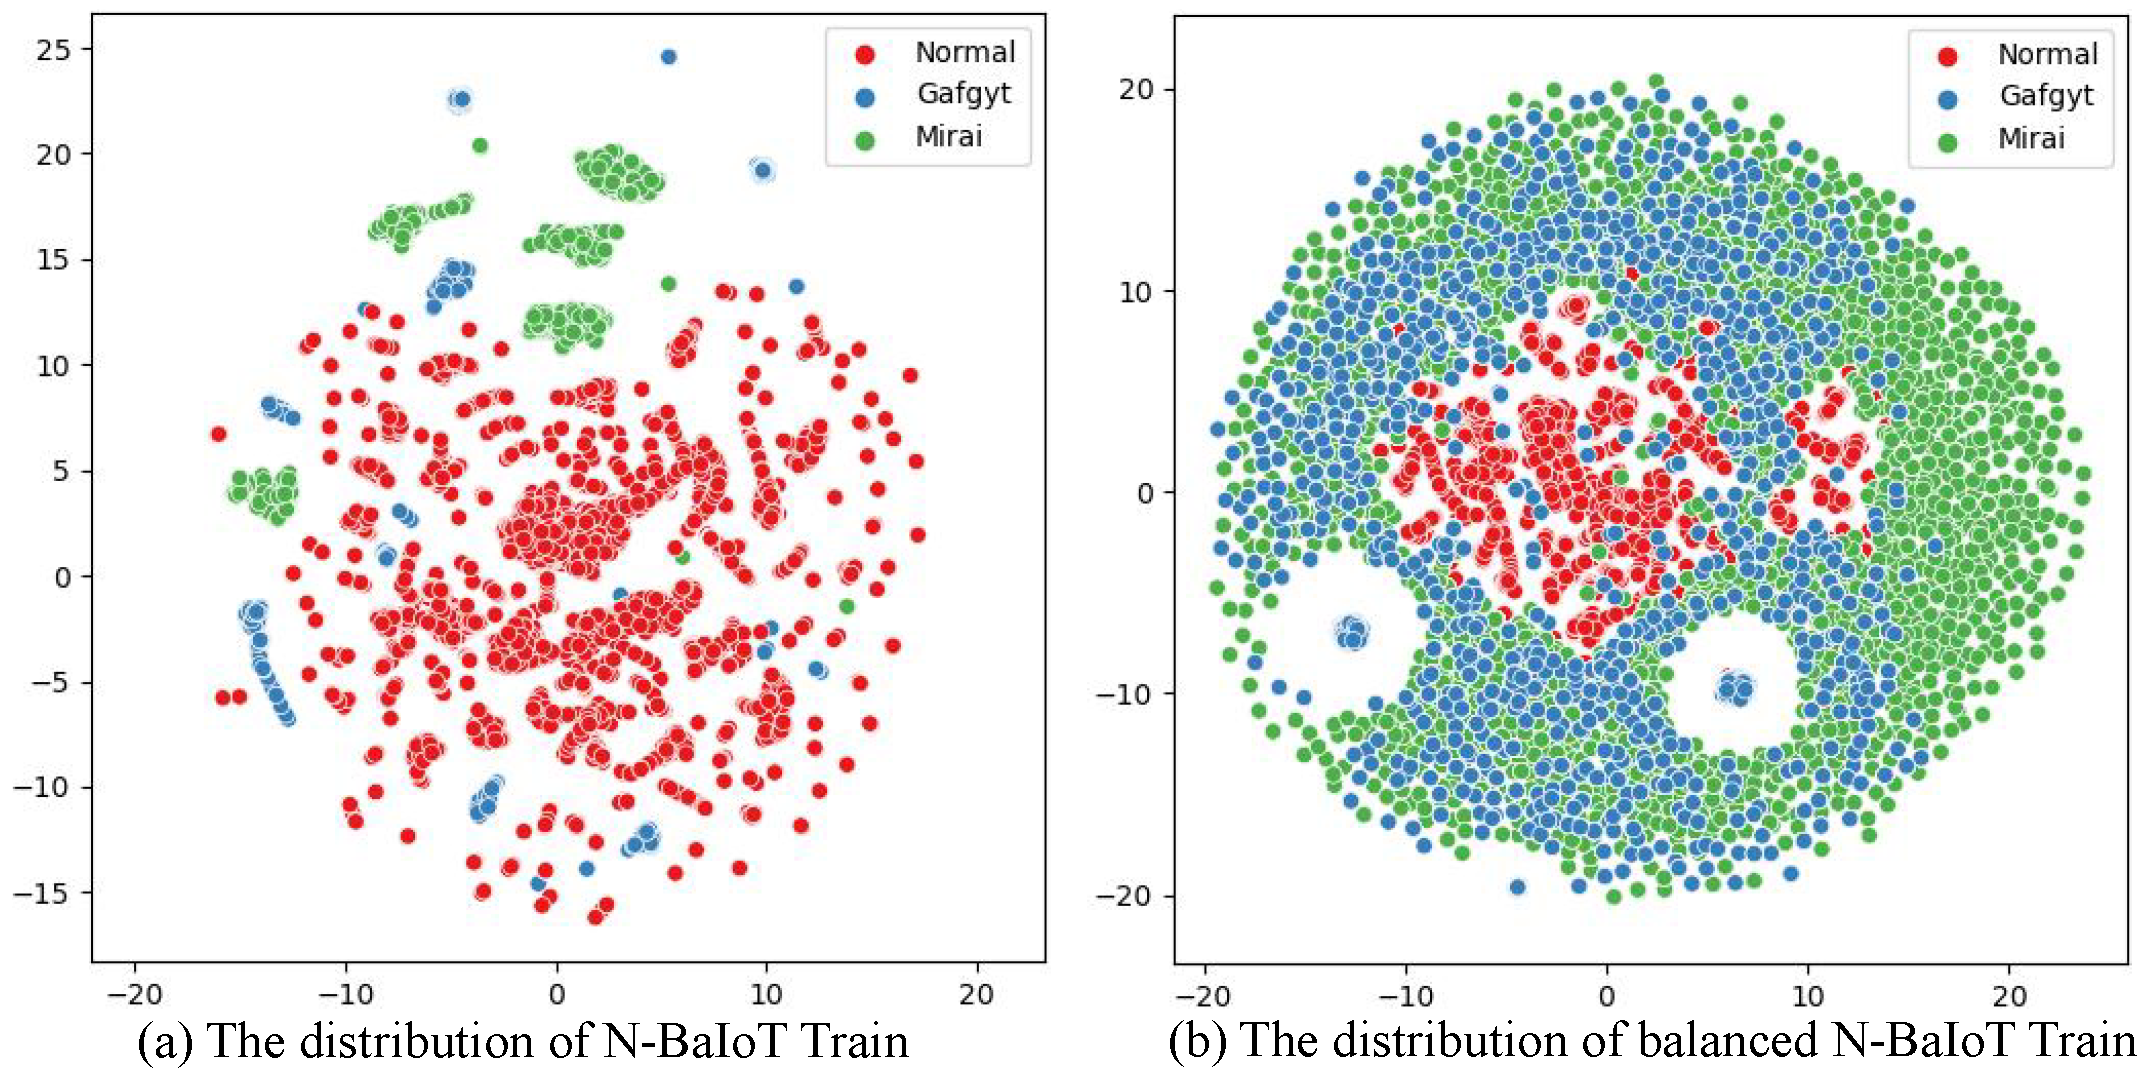
3.5.2. N-BaIoT
4. Experimental Results and Analysis
4.1. Evaluation Metrics
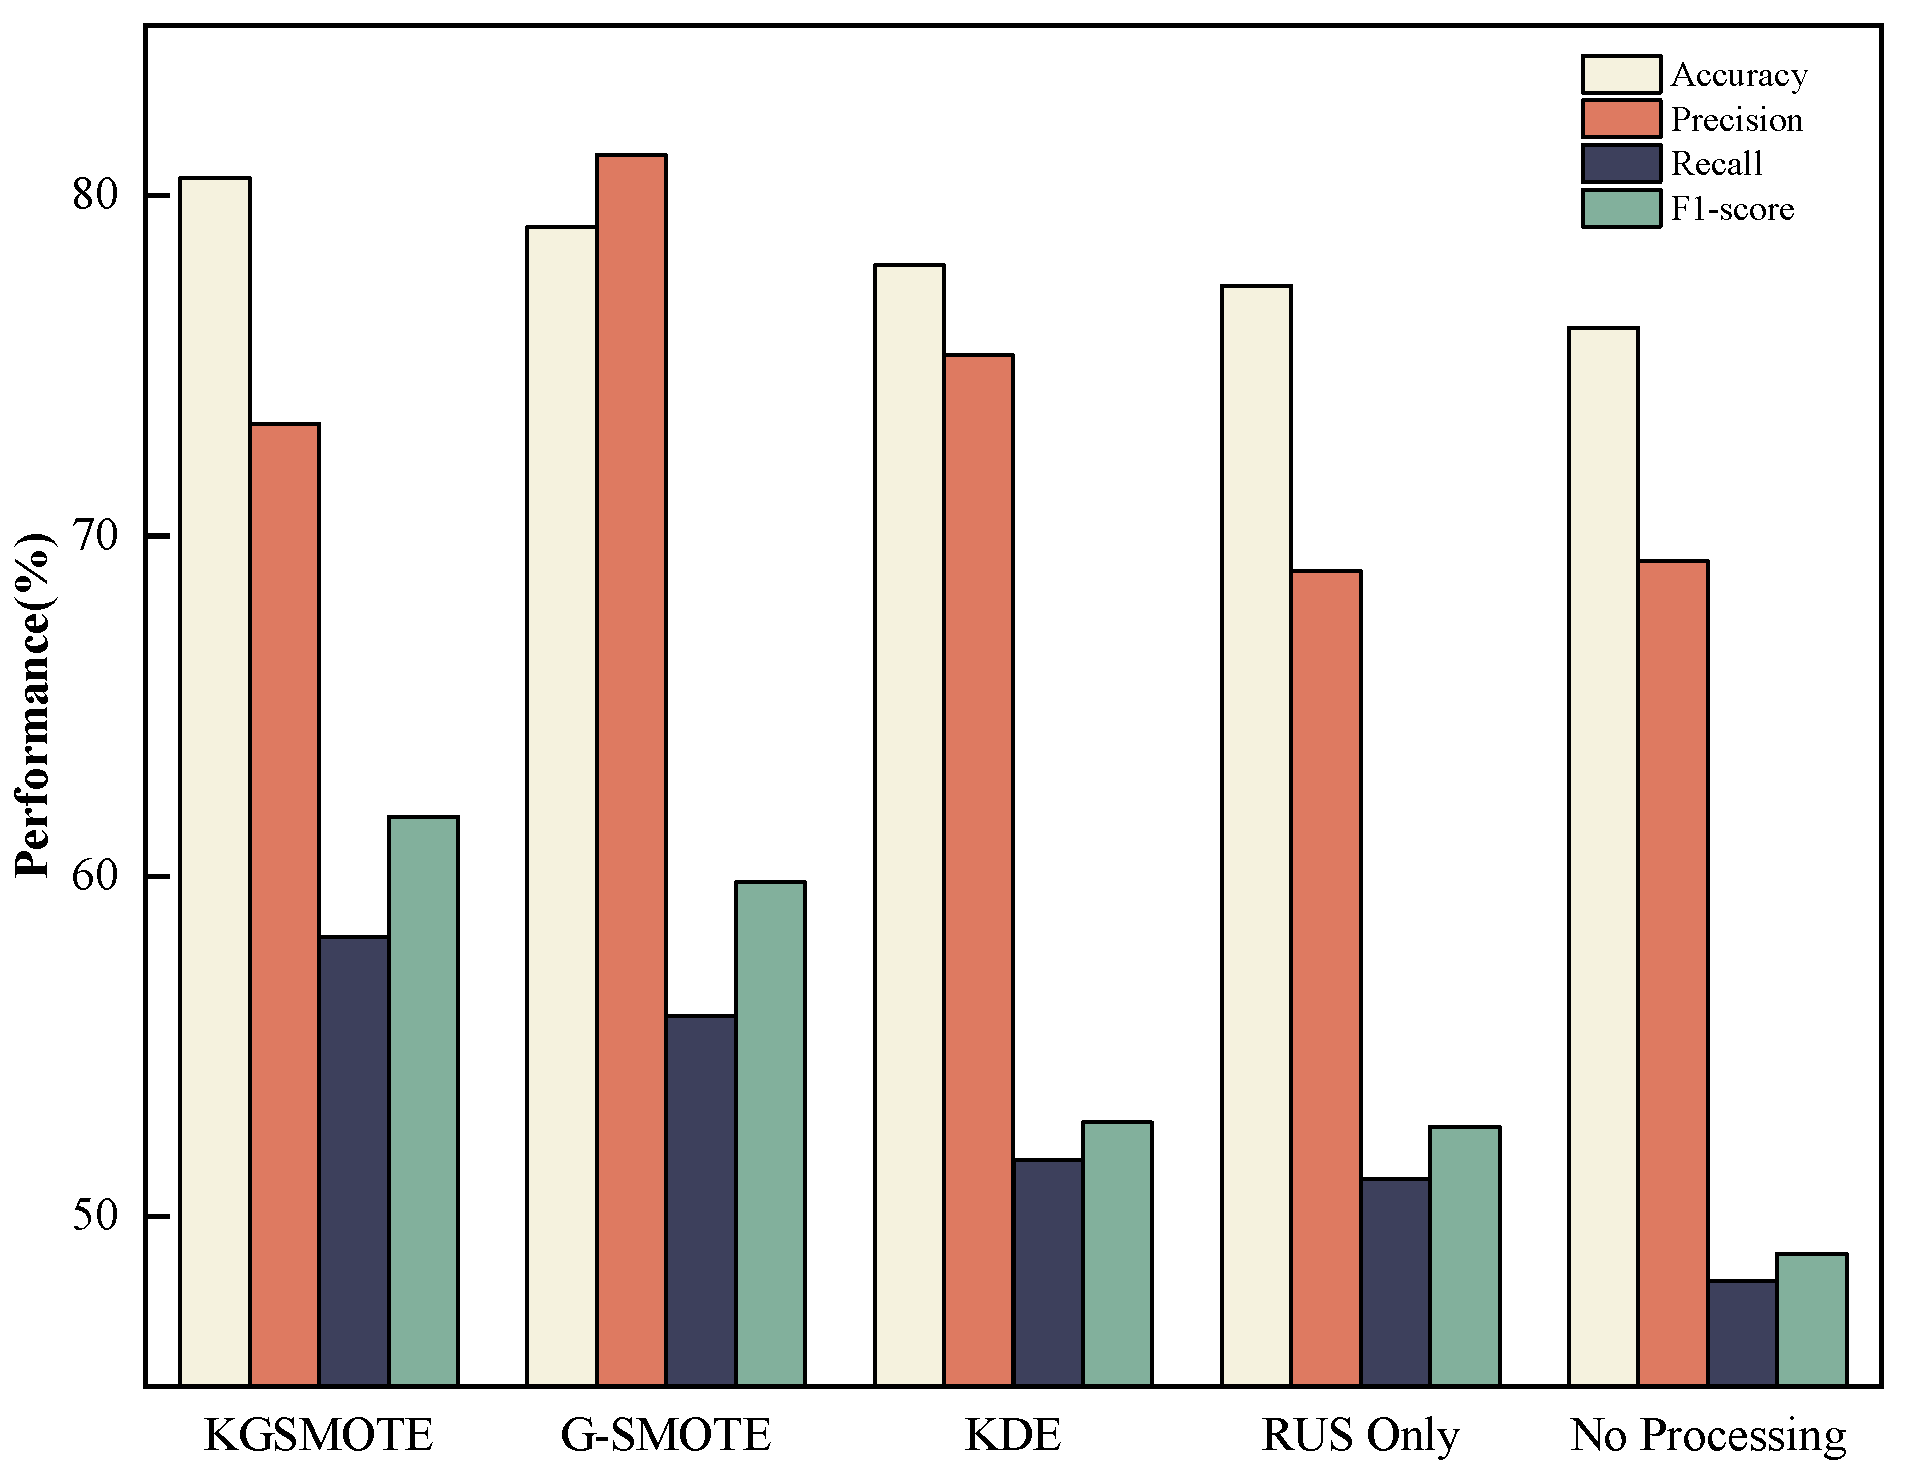
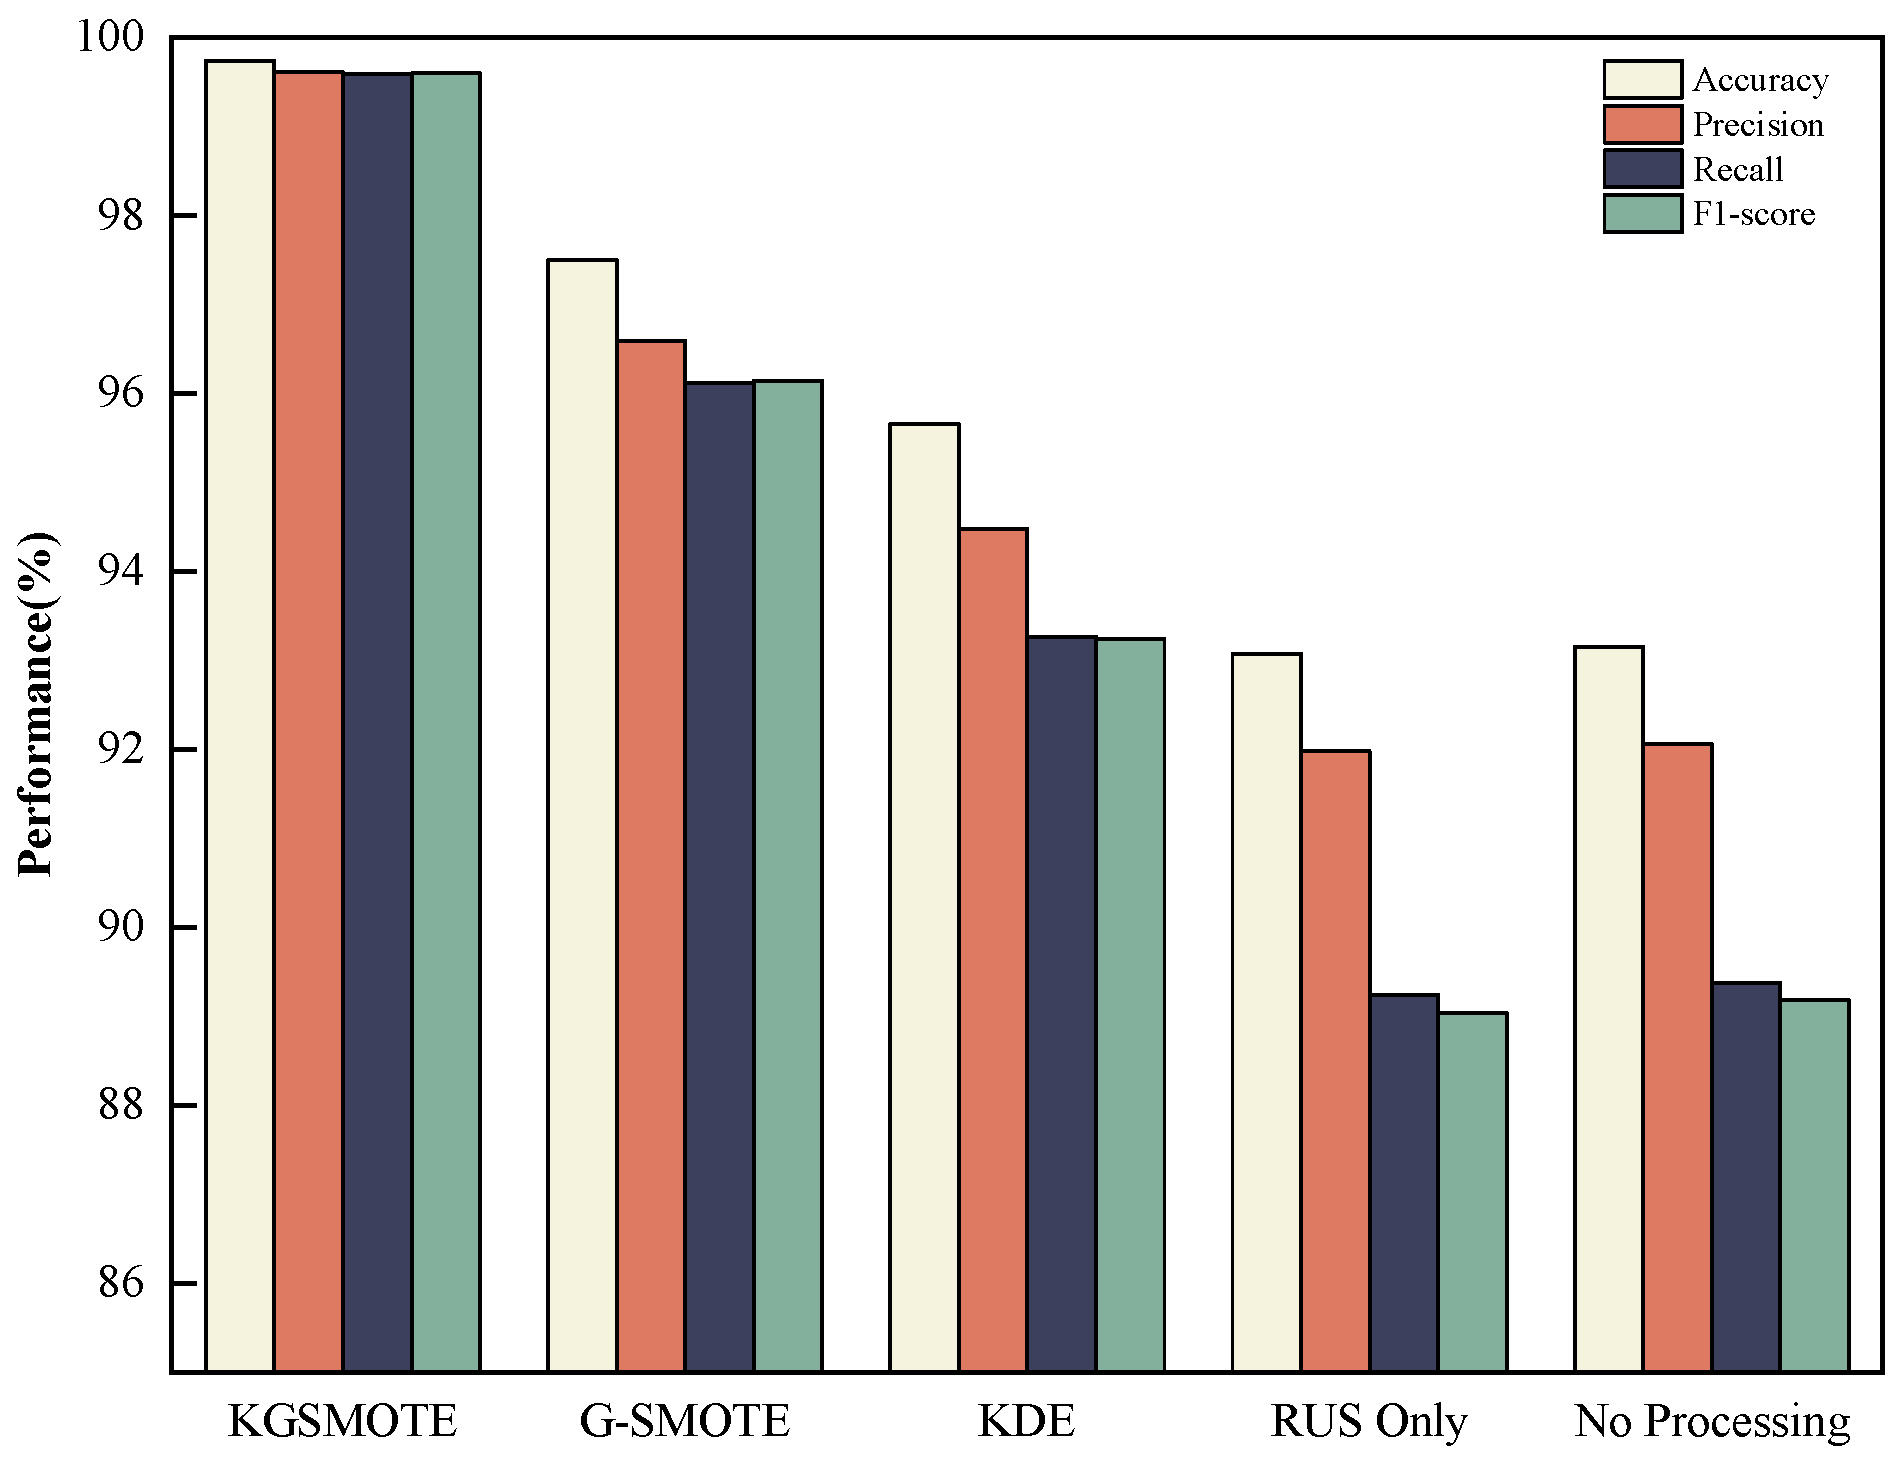
4.2. Imbalanced Processing Based on KGSMOTE
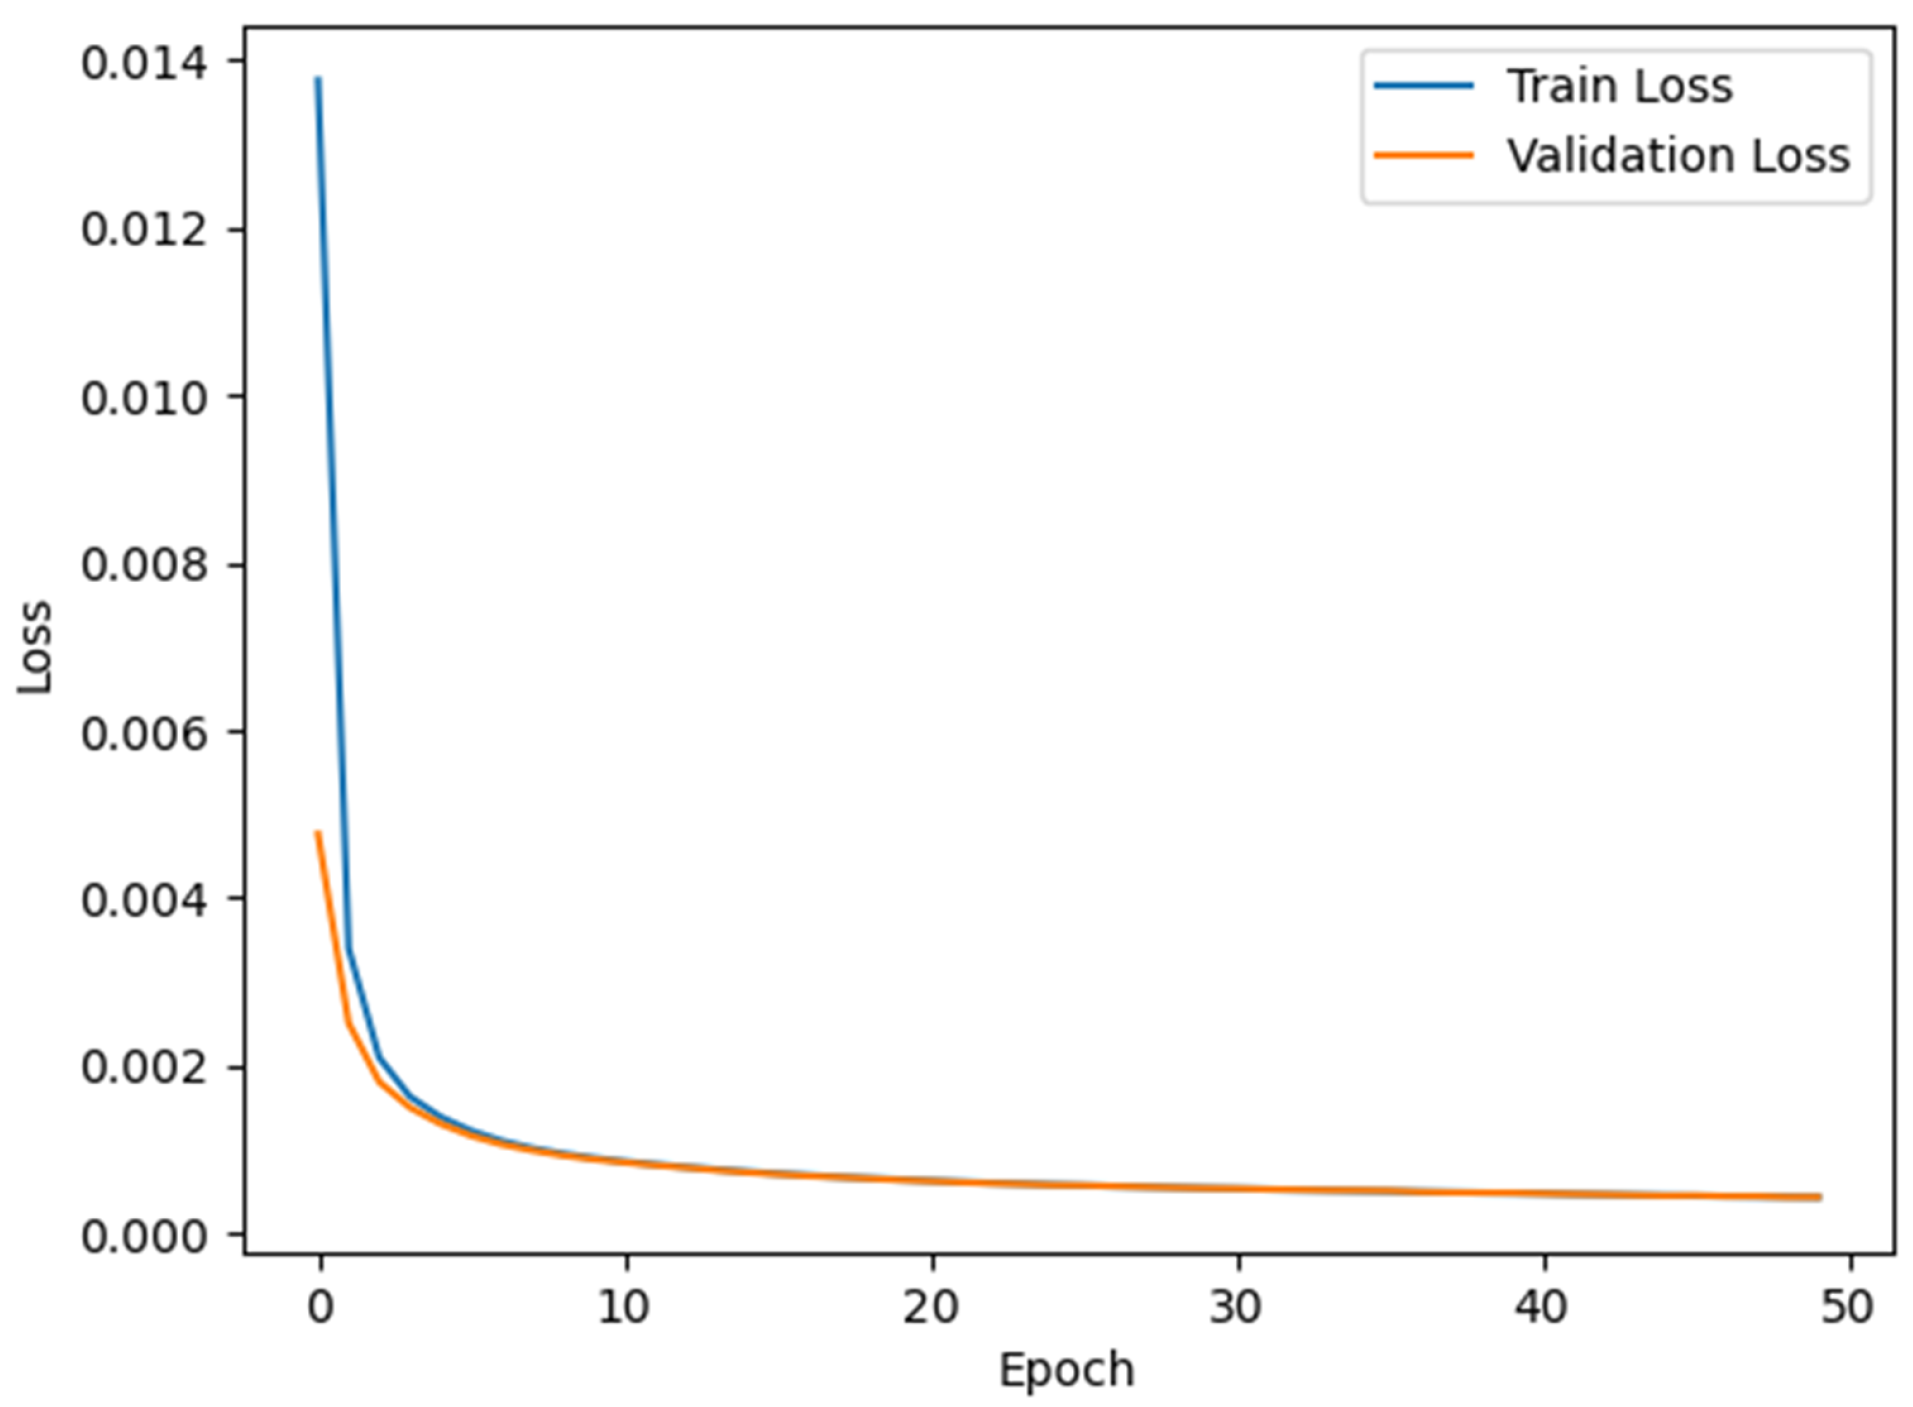
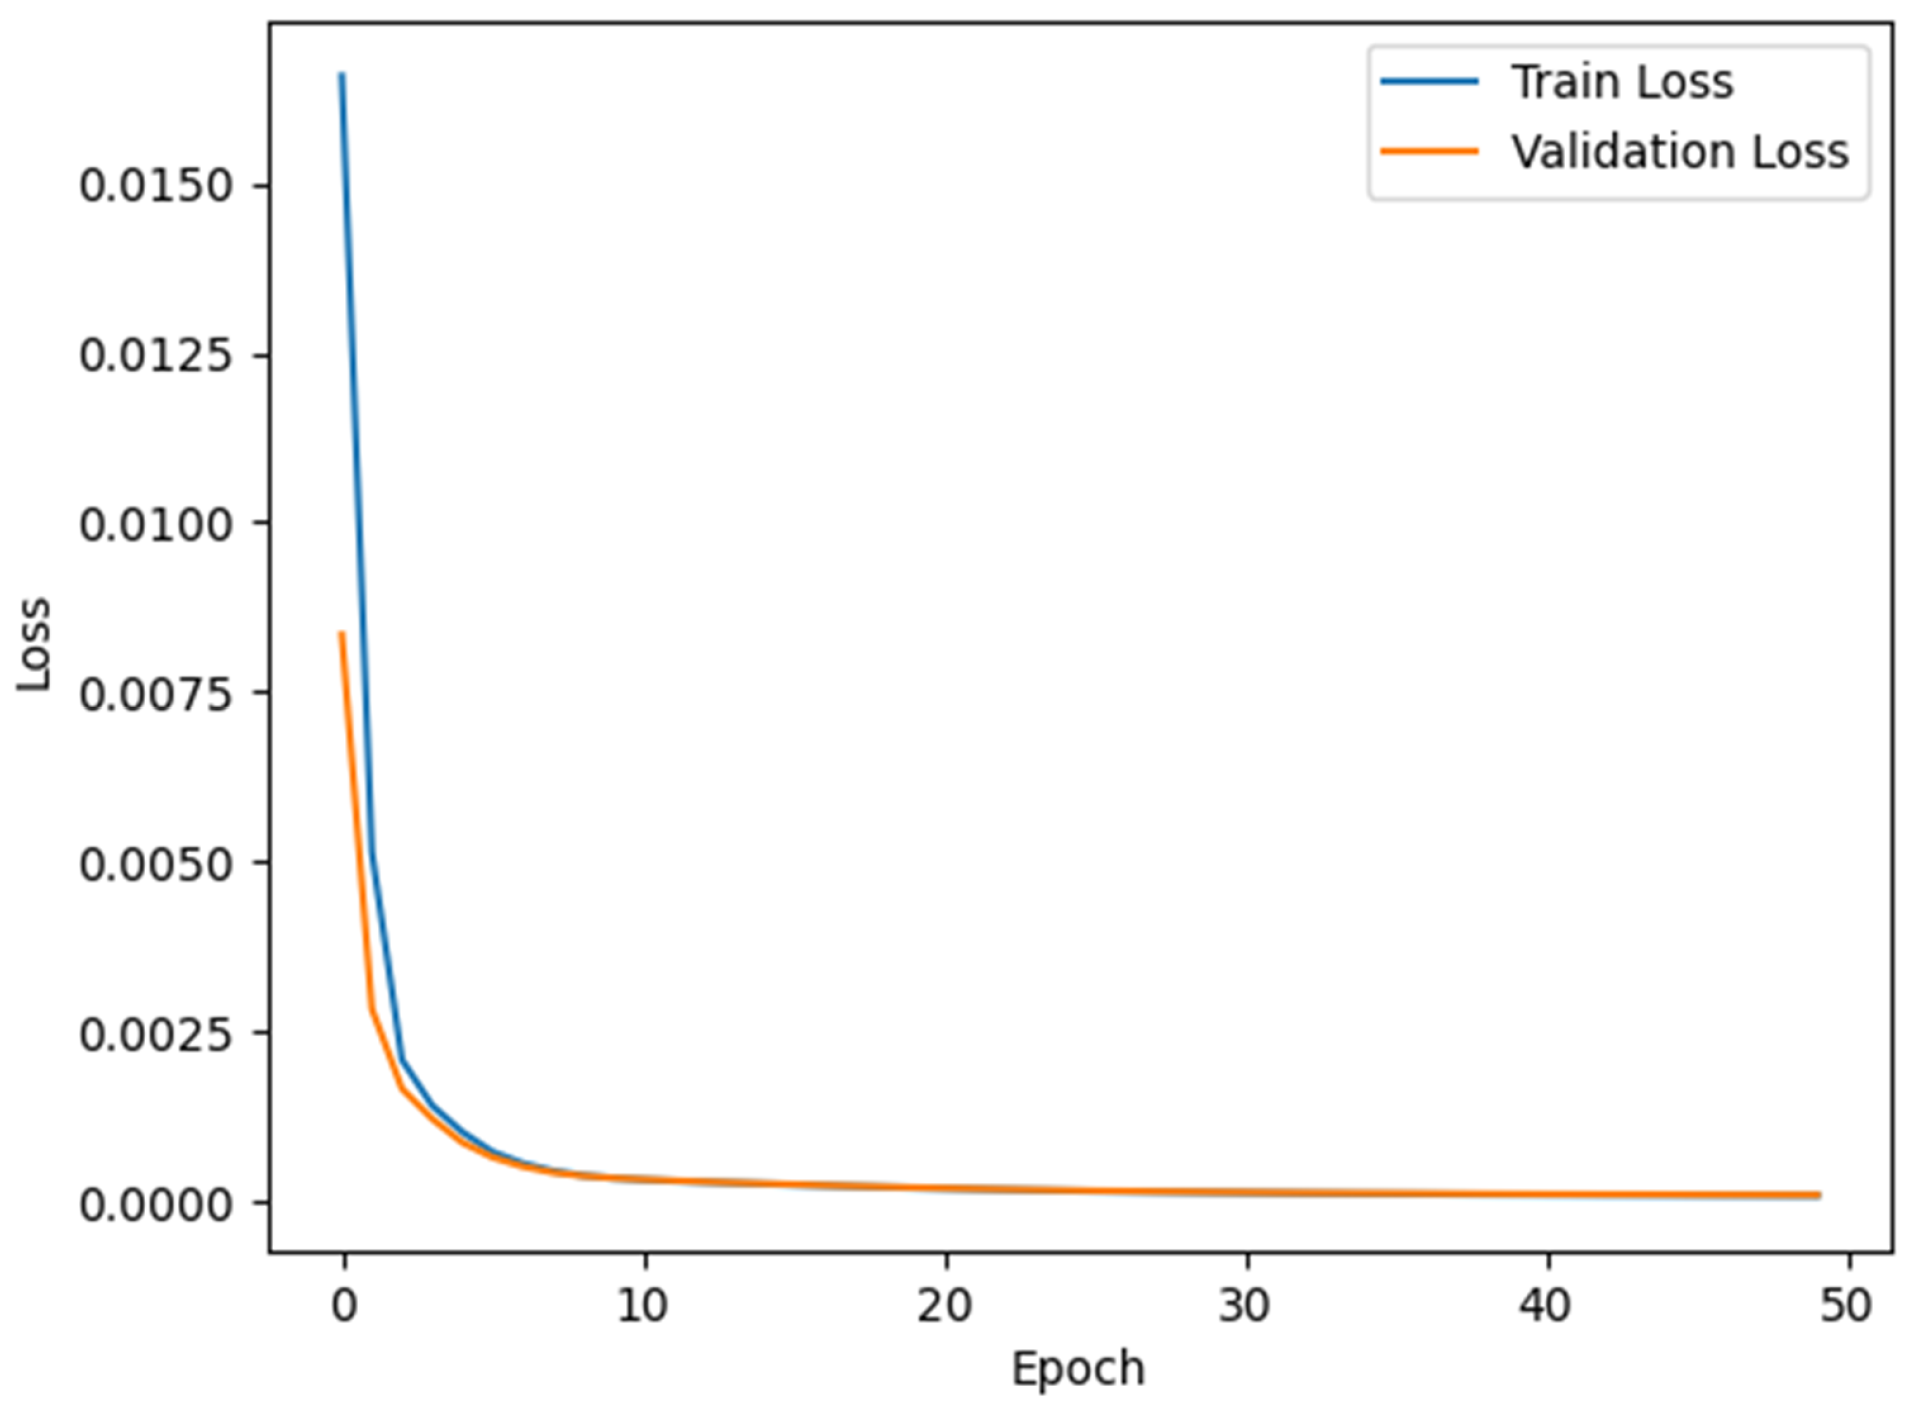
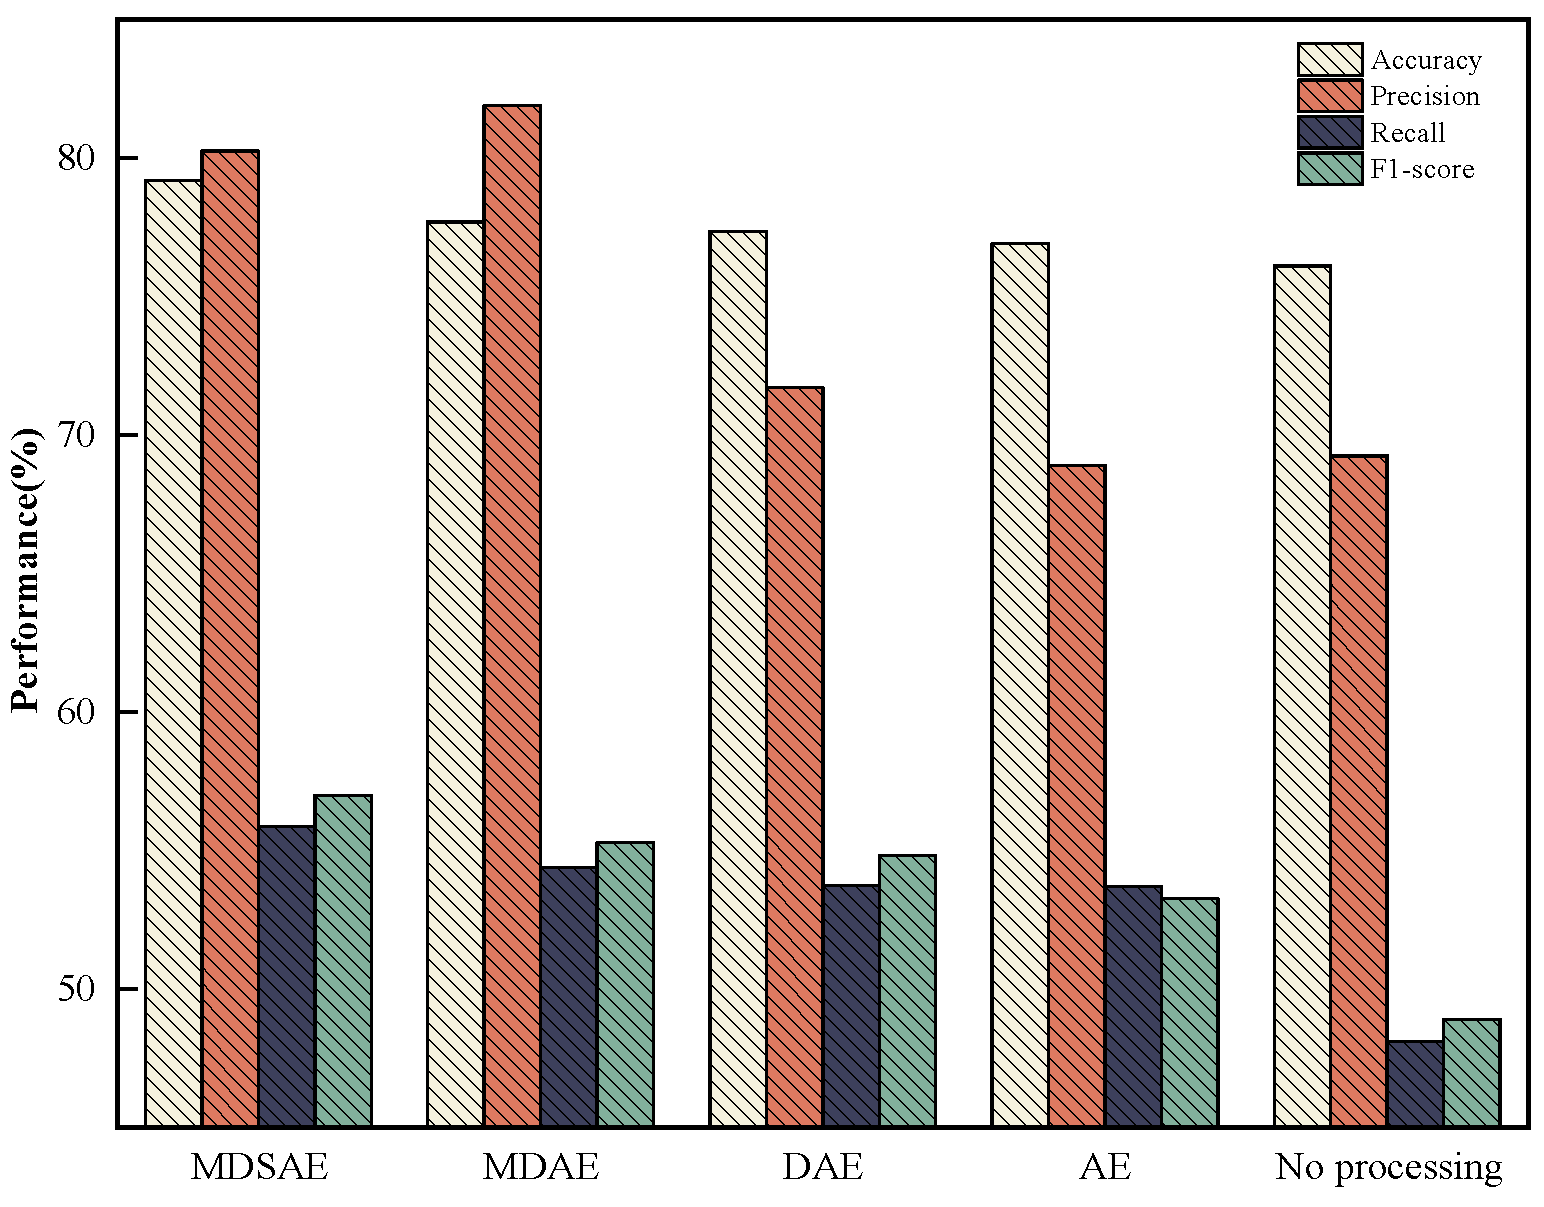
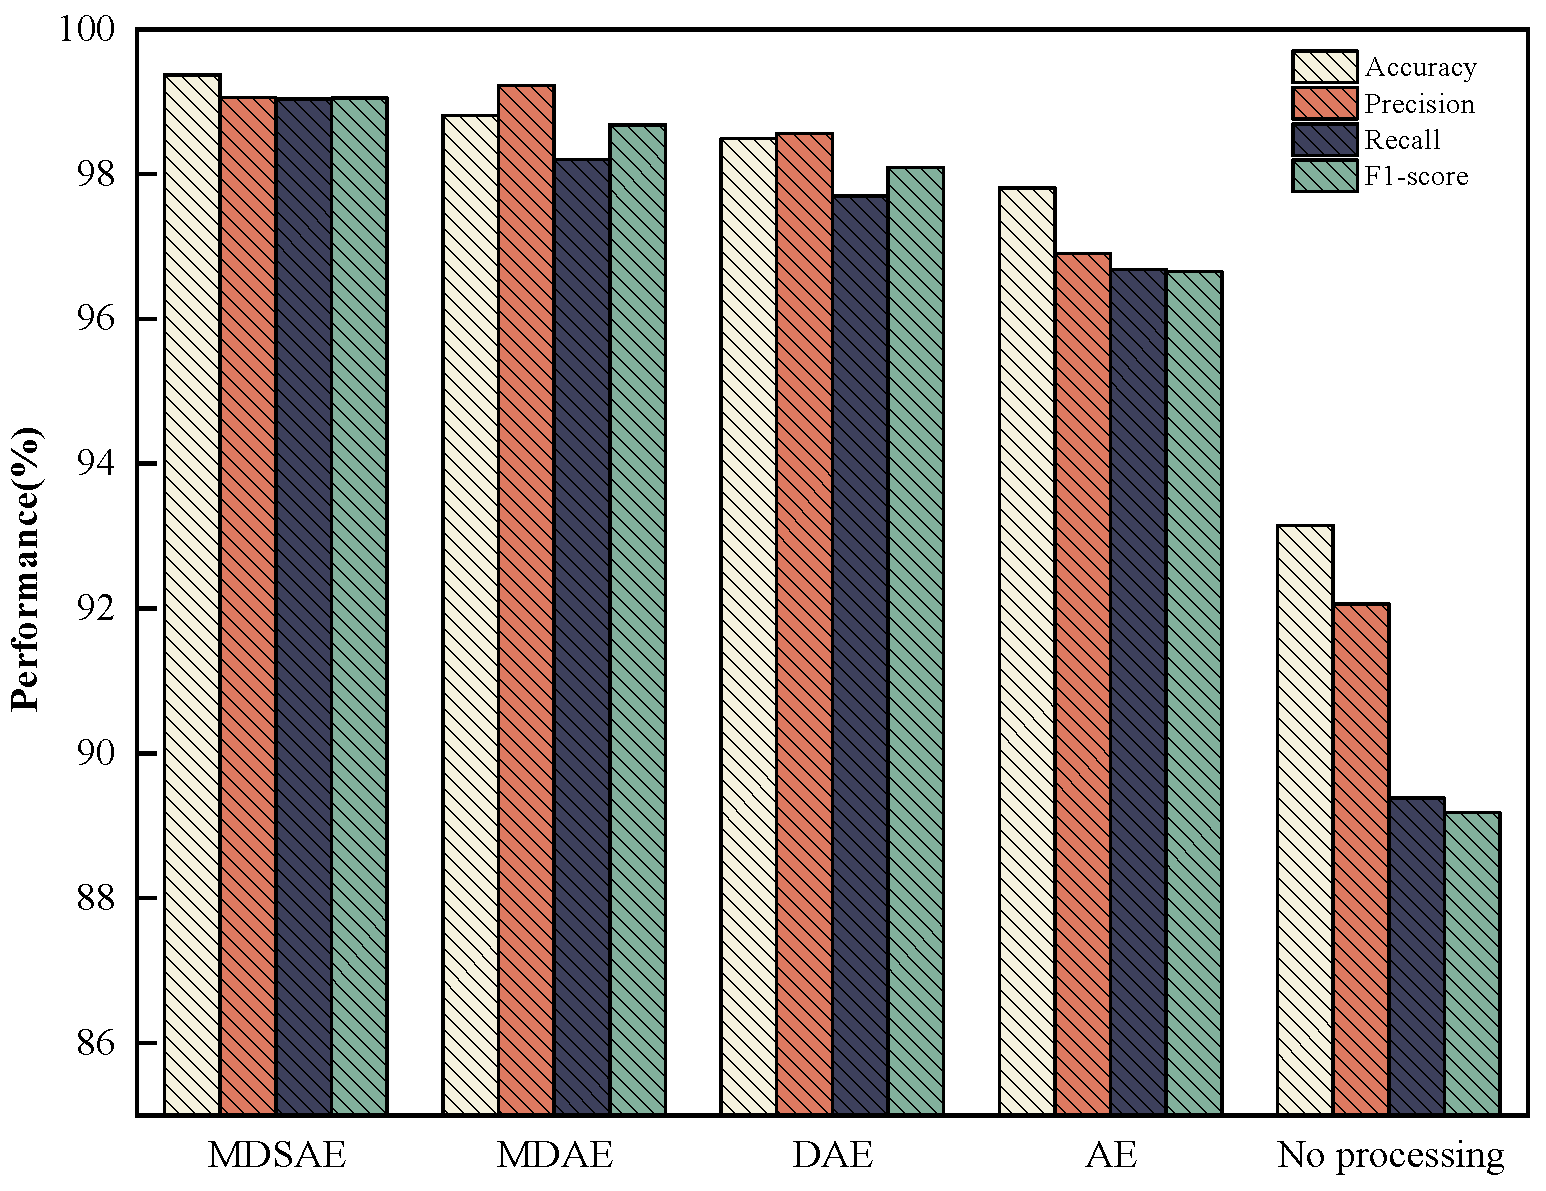
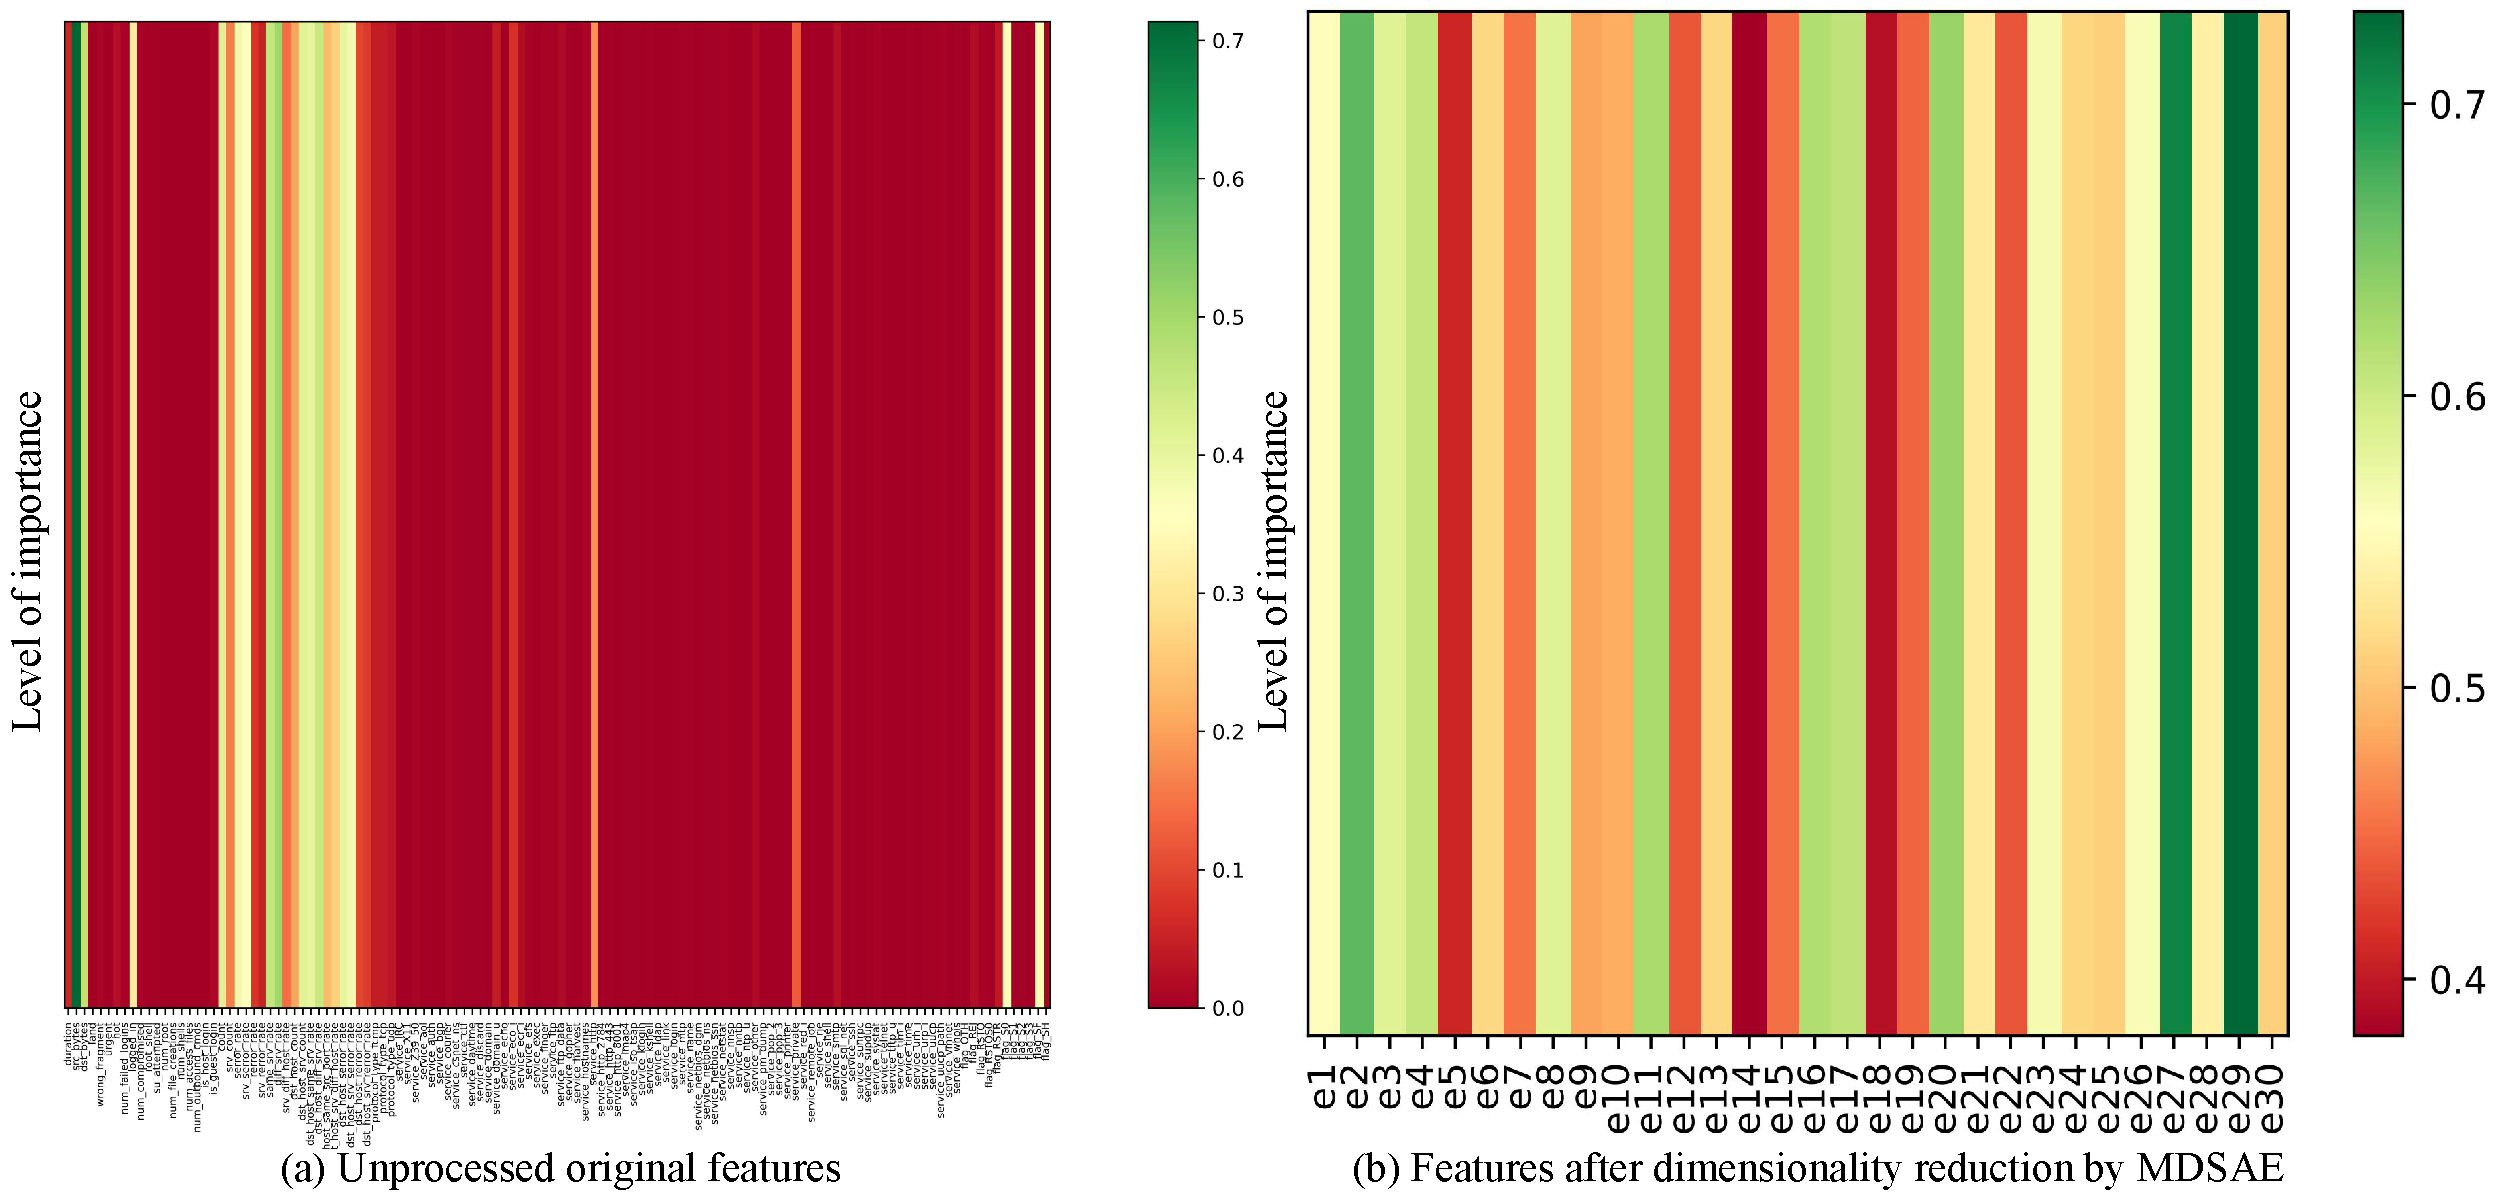
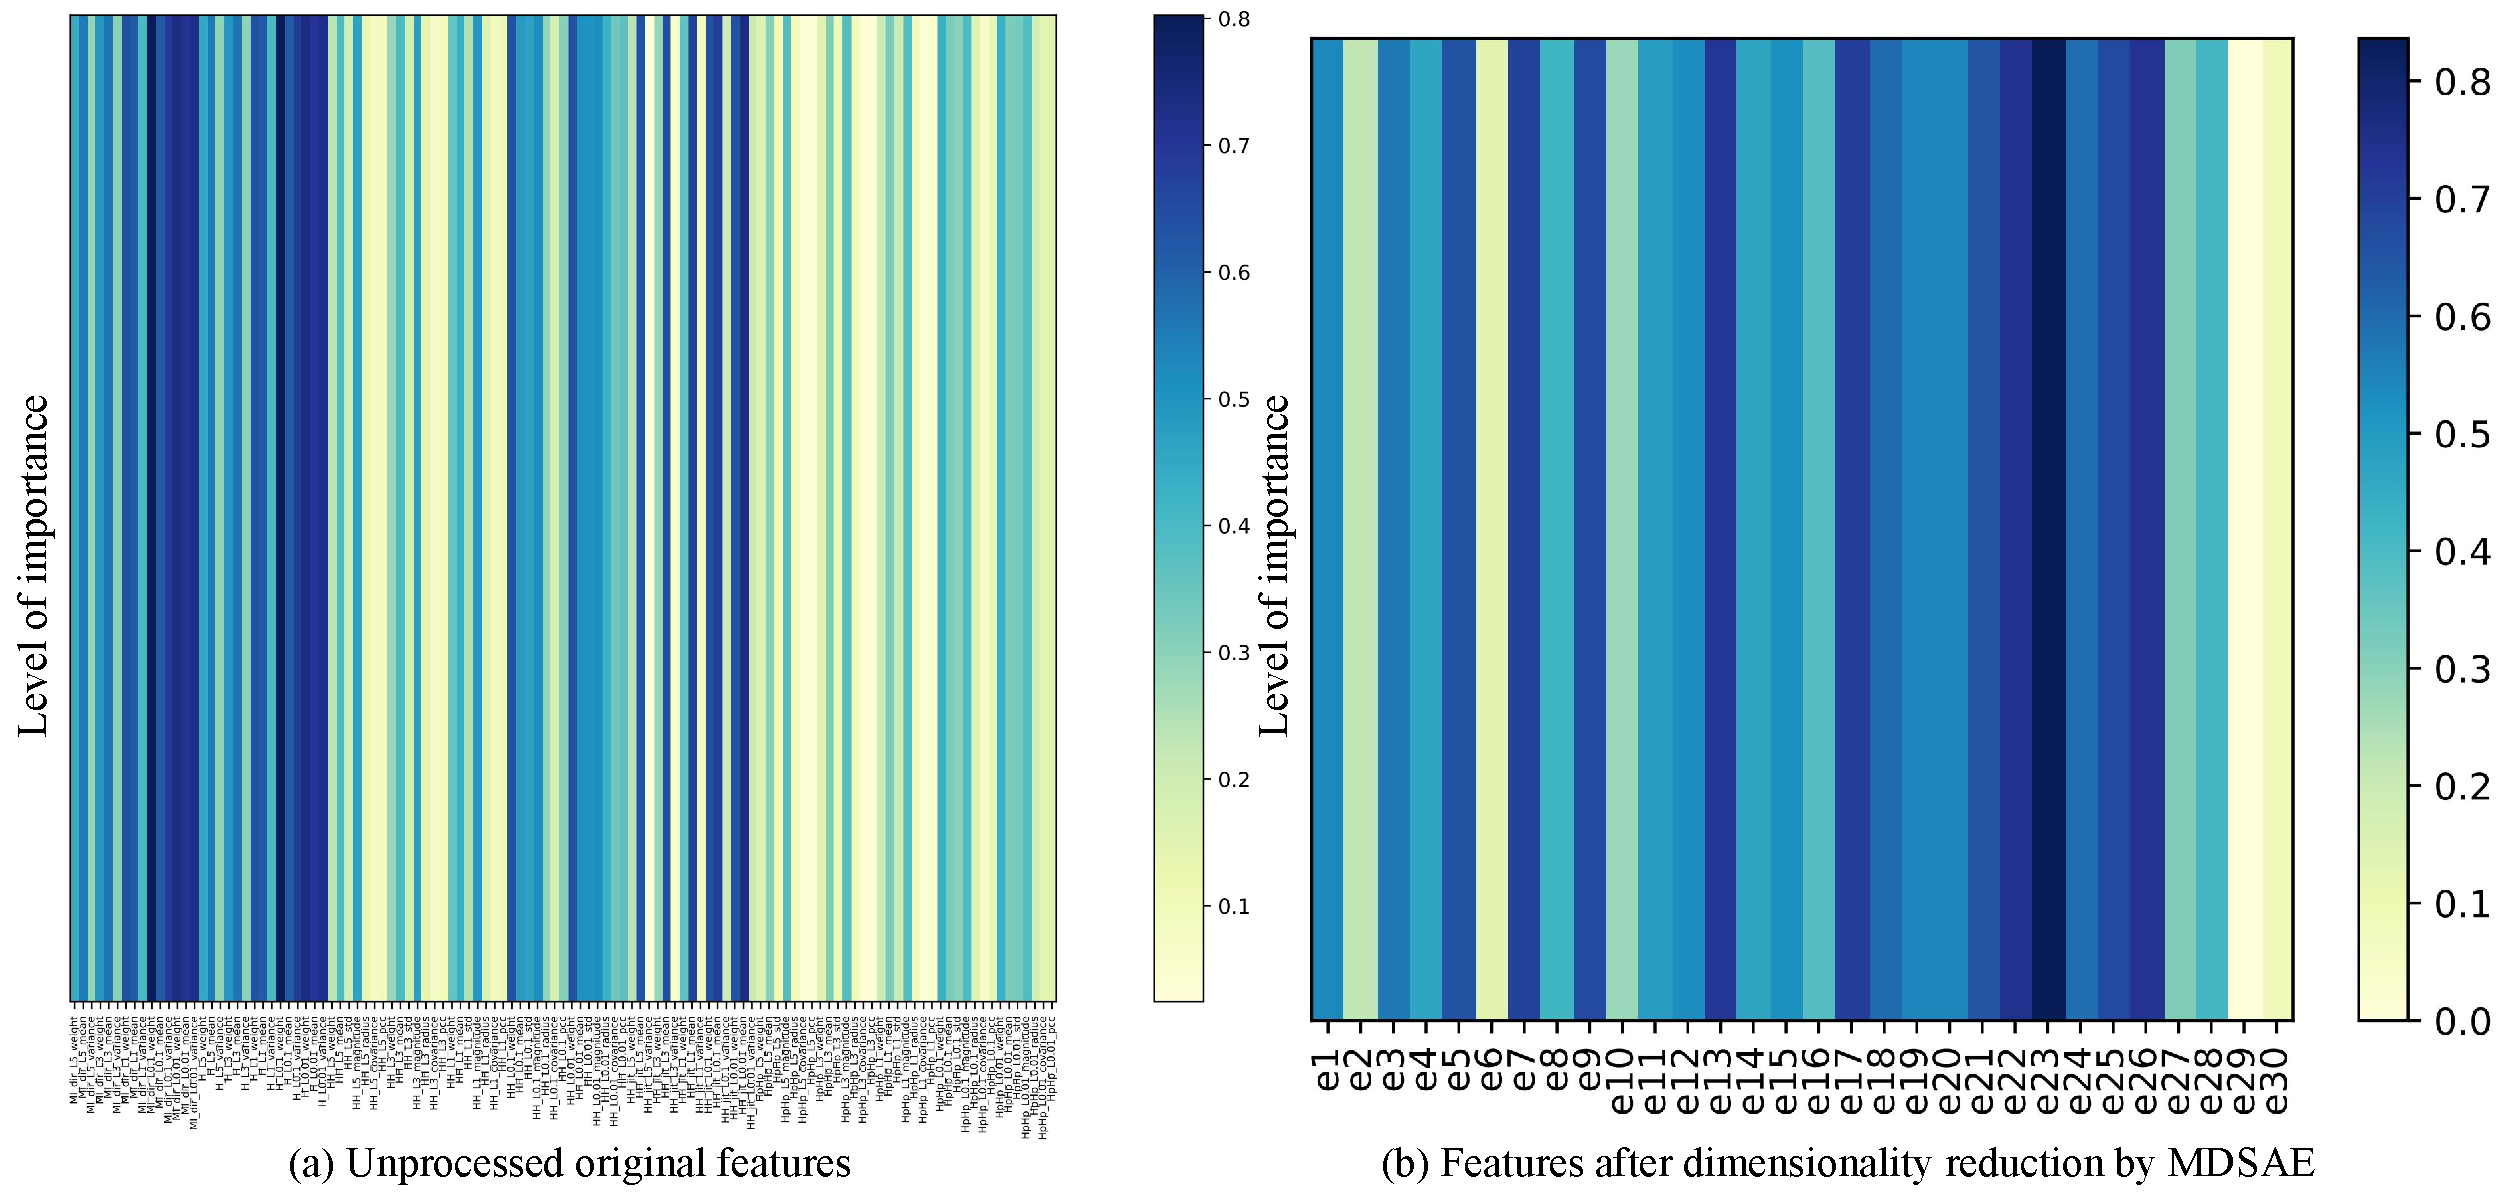
4.3. Deep Feature Extraction Based on MDSAE
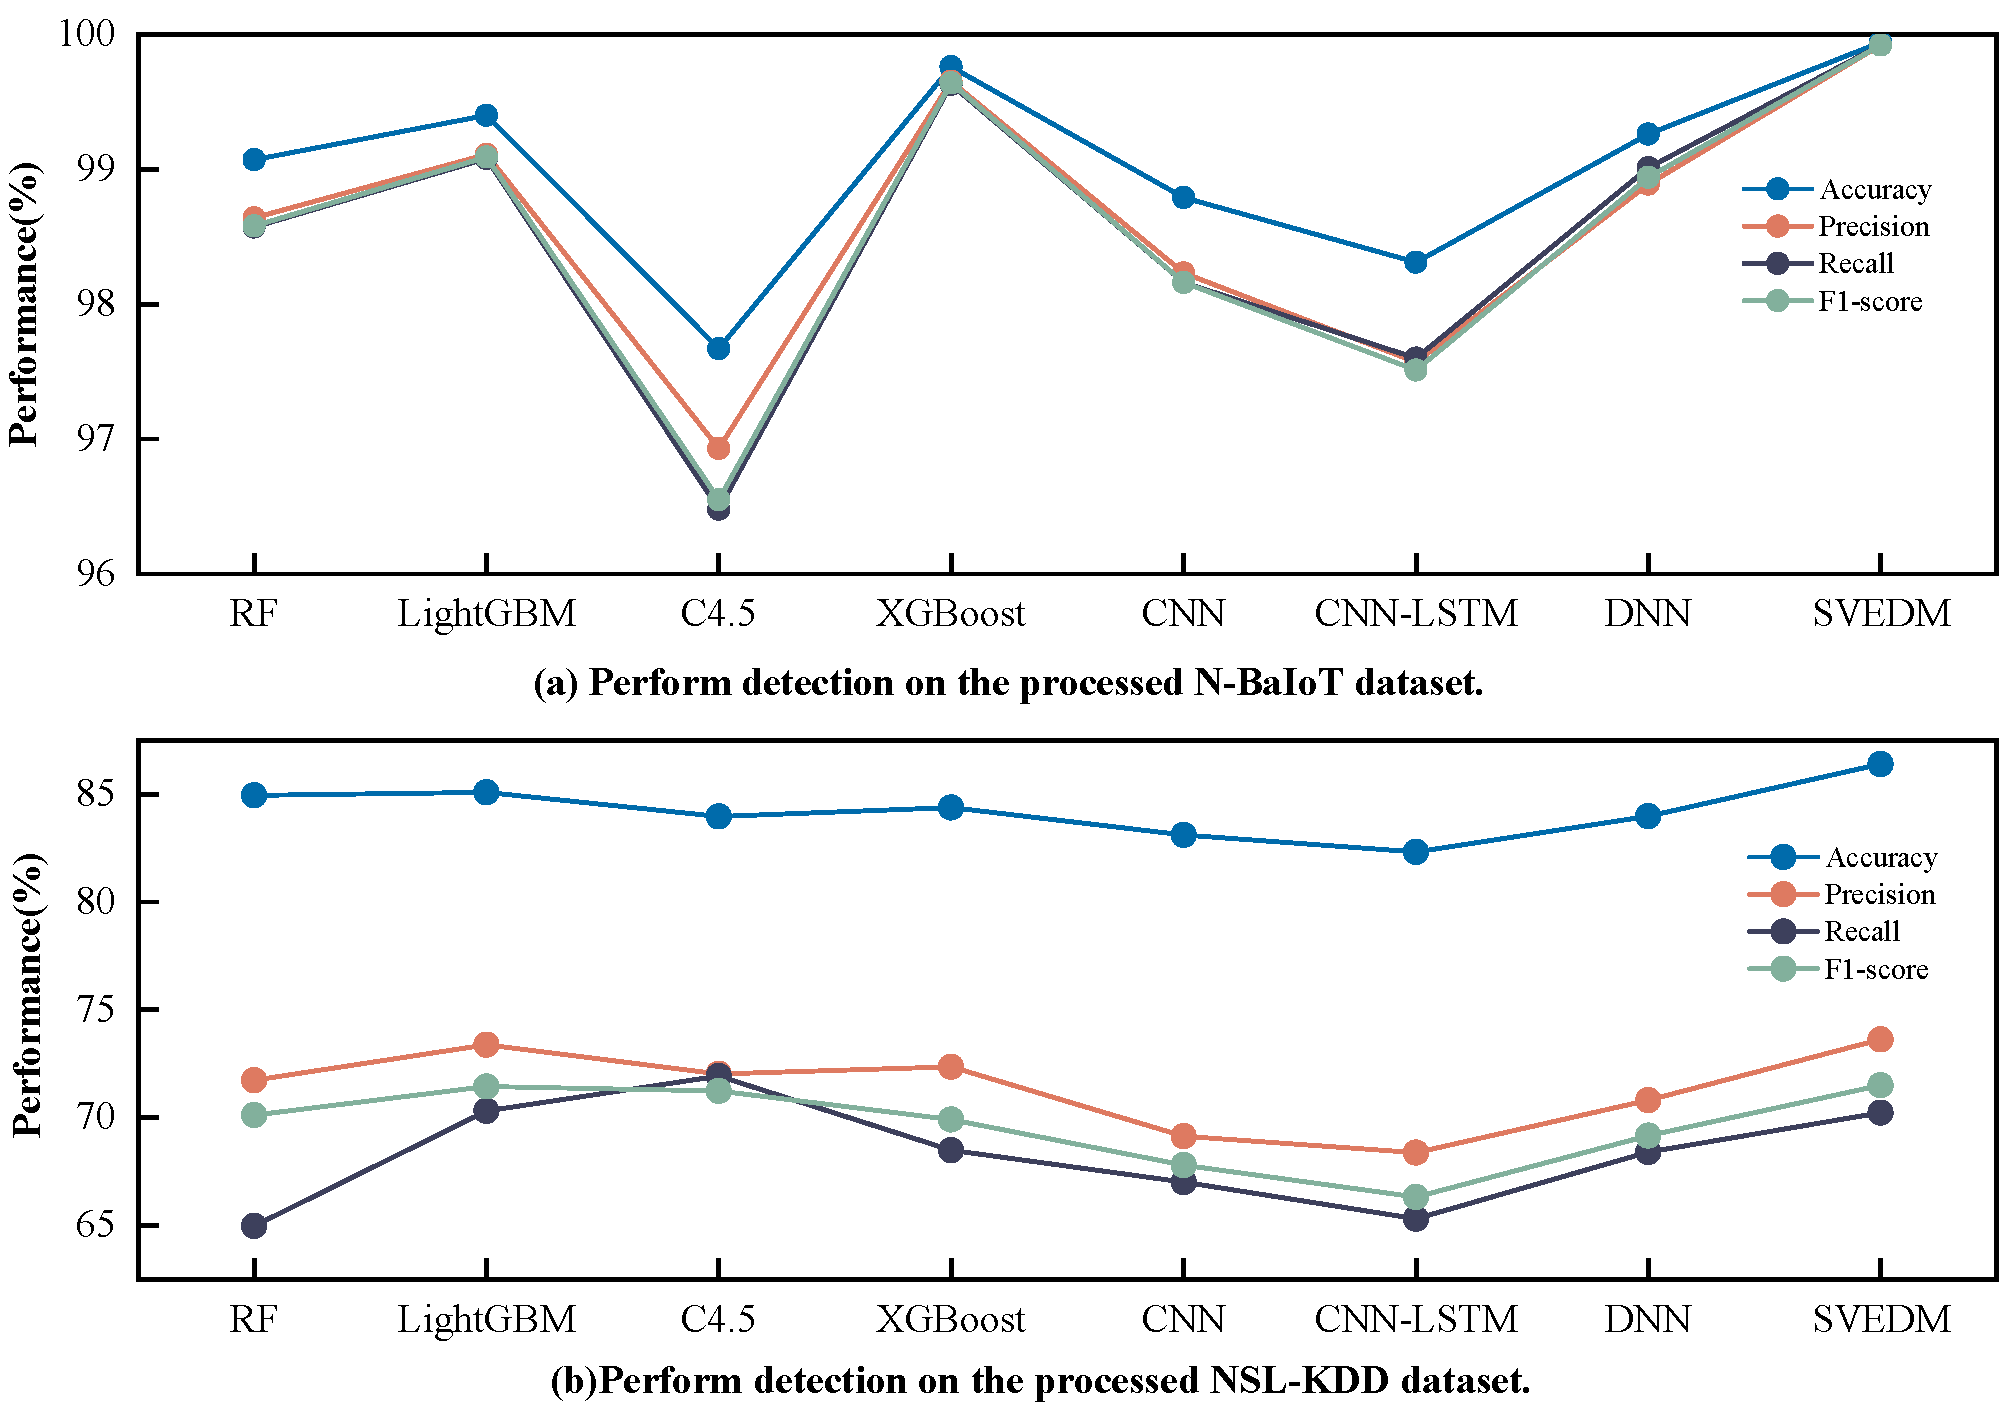
4.4. Intrusion Detection Based on SVEDM
4.5. Performance Evaluation and Ablation Study of the Proposed Model
- 1.
- Only SVEDM: The intrusion detection system will solely use the SVEDM module to only evaluate the classification performance of this module.
- 2.
- w/o KGSMOTE: The KGSMOTE module is excluded from KGMS-IDS, while retaining the MDSAE and SVEDM modules, to assess the feature extraction capability of MDSAE.
- 3.
- w/o MDSAE: The MDSAE module is removed from KGMS-IDS to examine the imbalance handling ability of the KGSMOTE module for high-dimensional data.
5. Conclusions and Future Work
Author Contributions
Funding
Institutional Review Board Statement
Data Availability Statement
Conflicts of Interest
References
- Arisdakessian, S.; Wahab, O.A.; Mourad, A.; Otrok, H.; Guizani, M. A survey on IoT intrusion detection: Federated learning, game theory, social psychology, and explainable AI as future directions. IEEE Internet Things J. 2023, 10, 4059–4092. [Google Scholar] [CrossRef]
- Evans, D. How the Next Evolution of the Internet Is Changing Everything. Internet Things 2011. Available online: http://www.cisco.com/web/about/ac79/docs/innov/IoT_IBSG_0411FINAL.pdf (accessed on 22 September 2021).
- Wang, M.; Yang, N.; Weng, N. Securing a Smart Home with a Transformer-Based IoT Intrusion Detection System. Electronics 2023, 12, 2100. [Google Scholar] [CrossRef]
- Alazab, A.; Khraisat, A.; Singh, S.; Bevinakoppa, S.; Mahdi, O.A. Routing attacks detection in 6lowpan-based internet of things. Electronics 2023, 12, 1320. [Google Scholar] [CrossRef]
- Alani, M.M.; Awad, A.I. An Intelligent Two-Layer Intrusion Detection System for the Internet of Things. IEEE Trans. Ind. Inform. 2022, 19, 683–692. [Google Scholar] [CrossRef]
- Qu, Y.; Ma, H.; Jiang, Y.; Bu, Y. A Network Intrusion Detection Method Based on Domain Confusion. Electronics 2023, 12, 1255. [Google Scholar] [CrossRef]
- Kim, T.; Pak, W. Scalable Inline Network-Intrusion Detection System with Minimized Memory Requirement. Electronics 2023, 12, 2061. [Google Scholar] [CrossRef]
- Yang, L.; Moubayed, A.; Shami, A. MTH-IDS: A multitiered hybrid intrusion detection system for internet of vehicles. IEEE Internet Things J. 2021, 9, 616–632. [Google Scholar] [CrossRef]
- Zhang, Y.; Liu, H.; Dong, X.; Li, C.; Zhang, Z. HyIDSVis: Hybrid intrusion detection visualization analysis based on rare category and association rules. J. Vis. 2022, 25, 175–190. [Google Scholar] [CrossRef]
- Erlacher, F.; Dressler, F. On high-speed flow-based intrusion detection using snort-compatible signatures. IEEE Trans. Dependable Secur. Comput. 2020, 19, 495–506. [Google Scholar] [CrossRef]
- Zhang, C.; Jia, D.; Wang, L.; Wang, W.; Liu, F.; Yang, A. Comparative research on network intrusion detection methods based on machine learning. Comput. Secur. 2022, 121, 102861. [Google Scholar] [CrossRef]
- Apruzzese, G.; Pajola, L.; Conti, M. The cross-evaluation of machine learning-based network intrusion detection systems. IEEE Trans. Netw. Serv. Manag. 2022, 19, 5152–5169. [Google Scholar] [CrossRef]
- Liu, C.; Antypenko, R.; Sushko, I.; Zakharchenko, O. Intrusion Detection System After Data Augmentation Schemes Based on the VAE and CVAE. IEEE Trans. Reliab. 2022, 71, 1000–1010. [Google Scholar] [CrossRef]
- Telikani, A.; Shen, J.; Yang, J.; Wang, P. Industrial IoT intrusion detection via evolutionary cost-sensitive learning and fog computing. IEEE Internet Things J. 2022, 9, 23260–23271. [Google Scholar] [CrossRef]
- Ganesan, R.; Jajodia, S.; Cam, H. Optimal scheduling of cybersecurity analysts for minimizing risk. ACM Trans. Intell. Syst. Technol. (TIST) 2017, 8, 1–32. [Google Scholar] [CrossRef]
- Wang, Y.C.; Houng, Y.C.; Chen, H.X.; Tseng, S.M. Network Anomaly Intrusion Detection Based on Deep Learning Approach. Sensors 2023, 23, 2171. [Google Scholar] [CrossRef] [PubMed]
- Khraisat, A.; Alazab, A. A critical review of intrusion detection systems in the internet of things: Techniques, deployment strategy, validation strategy, attacks, public datasets and challenges. Cybersecurity 2021, 4, 18. [Google Scholar] [CrossRef]
- Dutta, M.; Granjal, J. Towards a secure Internet of Things: A comprehensive study of second line defense mechanisms. IEEE Access 2020, 8, 127272–127312. [Google Scholar]
- Jayalaxmi, P.; Saha, R.; Kumar, G.; Conti, M.; Kim, T.H. Machine and Deep Learning Solutions for Intrusion Detection and Prevention in IoTs: A Survey. IEEE Access 2022, 10, 121173–121192. [Google Scholar] [CrossRef]
- Mehmood, M.; Javed, T.; Nebhen, J.; Abbas, S.; Abid, R.; Bojja, G.R.; Rizwan, M. A hybrid approach for network intrusion detection. CMC-Comput. Mater. Contin. 2022, 70, 91–107. [Google Scholar] [CrossRef]
- Hammad, M.; Hewahi, N.; Elmedany, W. MMM-RF: A novel high accuracy multinomial mixture model for network intrusion detection systems. Comput. Secur. 2022, 120, 102777. [Google Scholar] [CrossRef]
- Xie, J.; Wang, H.; Garibaldi, J.M.; Wu, D. Network Intrusion Detection Based on Dynamic Intuitionistic Fuzzy Sets. IEEE Trans. Fuzzy Syst. 2021, 30, 3460–3472. [Google Scholar] [CrossRef]
- Prajisha, C.; Vasudevan, A. An efficient intrusion detection system for MQTT-IoT using enhanced chaotic salp swarm algorithm and LightGBM. Int. J. Inf. Secur. 2022, 21, 1263–1282. [Google Scholar] [CrossRef]
- Kumar, R.; Kumar, P.; Tripathi, R.; Gupta, G.P.; Garg, S.; Hassan, M.M. A distributed intrusion detection system to detect DDoS attacks in blockchain-enabled IoT network. J. Parallel Distrib. Comput. 2022, 164, 55–68. [Google Scholar] [CrossRef]
- Kunang, Y.N.; Nurmaini, S.; Stiawan, D.; Suprapto, B.Y. Attack classification of an intrusion detection system using deep learning and hyperparameter optimization. J. Inf. Secur. Appl. 2021, 58, 102804. [Google Scholar] [CrossRef]
- Lv, Z.; Qiao, L.; Li, J.; Song, H. Deep-learning-enabled security issues in the internet of things. IEEE Internet Things J. 2020, 8, 9531–9538. [Google Scholar] [CrossRef]
- Wang, C.; Sun, Y.; Lv, S.; Wang, C.; Liu, H.; Wang, B. Intrusion Detection System Based on One-Class Support Vector Machine and Gaussian Mixture Model. Electronics 2023, 12, 930. [Google Scholar] [CrossRef]
- Muhammad, G.; Hossain, M.S.; Garg, S. Stacked autoencoder-based intrusion detection system to combat financial fraudulent. IEEE Internet Things J. 2020, 10, 2071–2078. [Google Scholar] [CrossRef]
- Khan, M.A.; Iqbal, N.; Jamil, H.; Kim, D.H. An optimized ensemble prediction model using AutoML based on soft voting classifier for network intrusion detection. J. Netw. Comput. Appl. 2023, 212, 103560. [Google Scholar] [CrossRef]
- Albashish, D.; Aburomman, A. Weighted heterogeneous ensemble for the classification of intrusion detection using ant colony optimization for continuous search spaces. Soft Comput. 2022, 27, 4779–4793. [Google Scholar] [CrossRef]
- Hossain, M.A.; Islam, M.S. Ensuring network security with a robust intrusion detection system using ensemble-based machine learning. Array 2023, 19, 100306. [Google Scholar] [CrossRef]
- Zhang, Y.; Liu, Q. On IoT intrusion detection based on data augmentation for enhancing learning on unbalanced samples. Future Gener. Comput. Syst. 2022, 133, 213–227. [Google Scholar] [CrossRef]
- Andresini, G.; Appice, A.; De Rose, L.; Malerba, D. GAN augmentation to deal with imbalance in imaging-based intrusion detection. Future Gener. Comput. Syst. 2021, 123, 108–127. [Google Scholar] [CrossRef]
- Kumar, V.; Sinha, D. Synthetic attack data generation model applying generative adversarial network for intrusion detection. Comput. Secur. 2023, 125, 103054. [Google Scholar] [CrossRef]
- Balla, A.; Habaebi, M.H.; Elsheikh, E.A.; Islam, M.R.; Suliman, F. The Effect of Dataset Imbalance on the Performance of SCADA Intrusion Detection Systems. Sensors 2023, 23, 758. [Google Scholar] [CrossRef] [PubMed]
- Talukder, M.A.; Hasan, K.F.; Islam, M.M.; Uddin, M.A.; Akhter, A.; Yousuf, M.A.; Alharbi, F.; Moni, M.A. A dependable hybrid machine learning model for network intrusion detection. J. Inf. Secur. Appl. 2023, 72, 103405. [Google Scholar] [CrossRef]
- Lavanya, T.; Rajalakshmi, K. Heterogenous ensemble learning driven multi-parametric assessment model for hardware Trojan detection. Integration 2023, 89, 217–228. [Google Scholar] [CrossRef]
- Liu, J.; Gao, Y.; Hu, F. A fast network intrusion detection system using adaptive synthetic oversampling and LightGBM. Comput. Secur. 2021, 106, 102289. [Google Scholar] [CrossRef]
- Douzas, G.; Bacao, F. Geometric SMOTE a geometrically enhanced drop-in replacement for SMOTE. Inf. Sci. 2019, 501, 118–135. [Google Scholar] [CrossRef]
- Kamalov, F.; Moussa, S.; Avante Reyes, J. KDE-Based Ensemble Learning for Imbalanced Data. Electronics 2022, 11, 2703. [Google Scholar] [CrossRef]
- Boppana, T.K.; Bagade, P. GAN-AE: An unsupervised intrusion detection system for MQTT networks. Eng. Appl. Artif. Intell. 2023, 119, 105805. [Google Scholar] [CrossRef]
- Mushtaq, E.; Zameer, A.; Umer, M.; Abbasi, A.A. A two-stage intrusion detection system with auto-encoder and LSTMs. Appl. Soft Comput. 2022, 121, 108768. [Google Scholar] [CrossRef]
- Lopes, I.O.; Zou, D.; Abdulqadder, I.H.; Ruambo, F.A.; Yuan, B.; Jin, H. Effective network intrusion detection via representation learning: A Denoising AutoEncoder approach. Comput. Commun. 2022, 194, 55–65. [Google Scholar] [CrossRef]
- Li, Z.; Chen, S.; Dai, H.; Xu, D.; Chu, C.K.; Xiao, B. Abnormal Traffic Detection: Traffic Feature Extraction and DAE-GAN With Efficient Data Augmentation. IEEE Trans. Reliab. 2022, 72, 498–510. [Google Scholar] [CrossRef]
- Tseng, S.M.; Yeh, Z.T.; Wu, C.Y.; Chang, J.B.; Norouzi, M. Video Scene Detection Using Transformer Encoding Linker Network (TELNet). Sensors 2023, 23, 7050. [Google Scholar] [CrossRef]
- Islam, M.M.; Hasan, M.; Athrey, K.S.; Braskich, T.; Bertasius, G. Efficient Movie Scene Detection using State-Space Transformers. In Proceedings of the IEEE/CVF Conference on Computer Vision and Pattern Recognition, Vancouver, BC, Canada, 18–22 June 2023; pp. 18749–18758. [Google Scholar]
- Xie, J.; Liu, S.; Chen, J.; Jia, J. Huber loss based distributed robust learning algorithm for random vector functional-link network. Artif. Intell. Rev. 2023, 56, 8197–8218. [Google Scholar] [CrossRef]
- Revathi, S.; Malathi, A. A detailed analysis on NSL-KDD dataset using various machine learning techniques for intrusion detection. Int. J. Eng. Res. Technol. (IJERT) 2013, 2, 1848–1853. [Google Scholar]
- Tavallaee, M.; Bagheri, E.; Lu, W.; Ghorbani, A.A. A detailed analysis of the KDD CUP 99 data set. In Proceedings of the 2009 IEEE Symposium on Computational Intelligence for Security and Defense Applications, Ottawa, ON, Canada, 8–10 July 2009; pp. 1–6. [Google Scholar]
- Meidan, Y.; Bohadana, M.; Mathov, Y.; Mirsky, Y.; Shabtai, A.; Breitenbacher, D.; Elovici, Y. N-baiot—network-based detection of iot botnet attacks using deep autoencoders. IEEE Pervasive Comput. 2018, 17, 12–22. [Google Scholar] [CrossRef]
- Popoola, S.I.; Ande, R.; Adebisi, B.; Gui, G.; Hammoudeh, M.; Jogunola, O. Federated deep learning for zero-day botnet attack detection in IoT-edge devices. IEEE Internet Things J. 2021, 9, 3930–3944. [Google Scholar] [CrossRef]
- Yang, Y.; Zheng, K.; Wu, C.; Niu, X.; Yang, Y. Building an effective intrusion detection system using the modified density peak clustering algorithm and deep belief networks. Appl. Sci. 2019, 9, 238. [Google Scholar] [CrossRef]
- Xu, X.; Li, J.; Yang, Y.; Shen, F. Toward effective intrusion detection using log-cosh conditional variational autoencoder. IEEE Internet Things J. 2020, 8, 6187–6196. [Google Scholar] [CrossRef]
- Shams, E.A.; Rizaner, A.; Ulusoy, A.H. A novel context-aware feature extraction method for convolutional neural network-based intrusion detection systems. Neural Comput. Appl. 2021, 33, 13647–13665. [Google Scholar] [CrossRef]
- Li, X.; Kong, K.; Shen, H.; Wei, Z.; Liao, X. Intrusion detection method based on imbalanced learning classification. J. Exp. Theor. Artif. Intell. 2022, 1–21. [Google Scholar] [CrossRef]
- Rani, M. Effective network intrusion detection by addressing class imbalance with deep neural networks multimedia tools and applications. Multimed. Tools Appl. 2022, 81, 8499–8518. [Google Scholar] [CrossRef]
- Om Kumar, C.; Marappan, S.; Murugeshan, B.; Beaulah, P.M.R. Intrusion Detection Model for IoT Using Recurrent Kernel Convolutional Neural Network. Wirel. Pers. Commun. 2023, 129, 783–812. [Google Scholar] [CrossRef]
- Saurabh, K.; Singh, A.; Singh, U.; Vyas, O.; Khondoker, R. GANIBOT: A Network Flow Based Semi Supervised Generative Adversarial Networks Model for IoT Botnets Detection. In Proceedings of the 2022 IEEE International Conference on Omni-Layer Intelligent Systems (COINS), Barcelona, Spain, 1–3 August 2022; pp. 1–5. [Google Scholar]
- Abu Al-Haija, Q.; Al-Dala’ien, M. ELBA-IoT: An ensemble learning model for botnet attack detection in IoT networks. J. Sens. Actuator Netw. 2022, 11, 18. [Google Scholar] [CrossRef]
- Attique, D.; Hao, W.; Ping, W. Fog-Assisted Deep-Learning-Empowered Intrusion Detection System for RPL-Based Resource-Constrained Smart Industries. Sensors 2022, 22, 9416. [Google Scholar] [CrossRef]


| Industry 5.0 | Autonomous Driving | Smart City | Smart Factory |
|---|---|---|---|
| Ransomware | Jamming | DDoS | APT |
| Malware | Spoofing | Cyber Espionage | Phishing |
| APT | Disrupting | APT | Malware |
| Phishing | Injecting | IoT device hacking | Social Engineering |
| Problem Solved | Methods | Datasets | Ensemble Leaning | Unknown Attack | Year |
|---|---|---|---|---|---|
| Feature Dimensionality Reduction. | RFRFE-FGSVM [20] | NSL-KDD | - | - | 2022 |
| MMM-RF [21] | CSE-CIC-IDS2018 | - | - | 2022 | |
| IFSs [22] | KDD 99/NSL-KDD/UNSW-NB15 | - | - | 2021 | |
| ECSSA-LightGBM [23] | MC-IoT/MQTTset/MQTT-IoT-IDS2020 | - | - | 2022 | |
| RF/XGBoost [24] | BoT-IoT | - | - | 2022 | |
| PTDAE-DNN [25] | NSL-KDD/CSE-CIC-IDS2018 | - | - | 2021 | |
| SDAE-SVM [26] | NSL-KDD | - | - | 2020 | |
| AE-OCSVM-GMM [27] | NF-BoT-IoT-V2/NF-CSE-CIC-IDS2018-V2 | - | - | 2023 | |
| SAE-DNN [28] | KDDCup99/NSL-KDD/aegean WIFI | - | - | 2023 | |
| Machine-learning classifier. | OE-IDS [29] | UNSW-NB15/CIC-IDS2017 | ✓ | - | 2023 |
| ACOR-WMV [30] | NSL-KDD | ✓ | - | 2022 | |
| PCA-EL [31] | Ten public cybersecurity datasets | ✓ | - | 2023 | |
| Imbalance processing. | ICVAE-BSM [32] | NSL-KDD/CIC-IDS2017/ CIC-IDS2018 | - | - | 2022 |
| GAN-CNN [33] | KDDCUP99/UNSW-NB15/ CIC-IDS2017/AAGM17 | - | - | 2021 | |
| WCGAN-XGBoost [34] | NSL-KDD/BoT-IoT/UNSW-NB15 | - | - | 2023 | |
| SCADA-IDS [35] | Morris power dataset/CIC-IDS2017 | - | - | 2023 | |
| Both | Proposed method | NSL-KDD/N-BaIoT | ✓ | ✓ | 2023 |
| Module | Parameter Settings | |
|---|---|---|
| KGSmote | K(x) = Gaussian kernel | |
| bandwidth = 0.2 | ||
| truncation_factor = 1, sampling_rate = 0.8/0.3 | ||
| k_neighbors = 5 | ||
| MDSAE | Batch size = 1024 | |
| Optimizer = Adam, learning rate = 0.001 | ||
| Epoch = 50 | ||
| Activation = Relu | ||
| Loss function = Huber Loss | ||
| Hidden layer1 = 80, Hidden layer2 = 30 | ||
| SVEDM | XGBoost (weights = 0.286) | max_depth = 10 |
| learning_rate = 0.4 | ||
| subsample = 0.8 | ||
| n_estimators = 400 | ||
| RF (weights = 0.571) | n_estimators = 100 | |
| max_depth = 10 | ||
| C4.5 (weights = 0.143) | n_estimators = 100 | |
| max_depth = 10 | ||
| Class | KDDTrain+ | Number | KDDTest+ | (Unknow Attack) | Number |
|---|---|---|---|---|---|
| Normal | normal | 67,343 | normal | ∖ | 9711 |
| DoS | back, land, neptune, pod, smurf, teardrop | 45,927 | back, land, neptune, smurf, teardrop, pod | apache2, mailbomb, processtable, udpstorm | 7458 |
| Probe | ipsweep, nmap, portsweep, satan | 11,656 | ipsweep, nmap, portsweep, satan | saint, mscan | 2421 |
| R2L | buffer_overflow, loadmodule, perl, rootkit | 995 | buffer_overflow, rootkit, perl, loadmodule | xterm, sqlattack, ps, httptunnel | 2754 |
| U2R | ftp_write, guess_passw, imap, warezmaster, spy multihop, phf, warezclient | 52 | ftp_write, imap guess_passwd, phf warezmaster, multihop | snmpgetattack, worm xlock, sendmail, xsnoop, named, snmpguess | 200 |
| Total | 23 | 125,973 | 21 | 17 | 22,544 |
| Class | N-BaIoT Train | Number | N-BaIoT Test | (Unknow Attack) | Number |
|---|---|---|---|---|---|
| Normal | normal | 34,806 | normal | ∖ | 14,917 |
| BASHLITE Attack | Scan(BASH), Junk COMBO, UDP(BASH) | 6869 | Scan(BASH), COMBO Junk, UDP(BASH) | TCP flooding | 5778 |
| Mirai Attack | Ack, Syn, UDPplain | 6051 | Ack, Syn, UDPplain | Scan(Mirai), UDP(Mirai) | 5663 |
| Total | 8 | 47,726 | 8 | 3 | 26,358 |
| Project | Parameters |
|---|---|
| CPU | Intel Core i7-11800H 2.30 GHz |
| GPU | NVIDIA RTX3070 |
| Python version | 3.9.13 |
| TensorFlow version | 2.8.0 |
| Keras version | 2.8.0 |
| Pytorch version | 1.10.1 |
| XGBoost | C4.5 | RF | Adaboost | LightGBM | Accuracy | Precision | Recall | F1-Score |
|---|---|---|---|---|---|---|---|---|
| ✓ | - | ✓ | ✓ | - | 85.41% | 72.79% | 70.46% | 71.30% |
| ✓ | - | ✓ | - | ✓ | 85.31% | 72.61% | 70.61% | 71.30% |
| ✓ | ✓ | - | - | ✓ | 85.11% | 72.48% | 69.36% | 70.52% |
| ✓ | ✓ | - | ✓ | - | 84.95% | 71.28% | 69.18% | 69.82% |
| ✓ | - | - | ✓ | ✓ | 84.56% | 72.65% | 68.83% | 70.23% |
| - | ✓ | ✓ | ✓ | - | 84.09% | 69.42% | 69.42% | 69.02% |
| - | ✓ | ✓ | - | ✓ | 84.94% | 72.60% | 69.76% | 70.62% |
| - | ✓ | - | ✓ | ✓ | 85.58% | 72.96% | 70.95% | 71.62% |
| - | - | ✓ | ✓ | ✓ | 85.30% | 73.33% | 70.37% | 71.38% |
| ✓ | ✓ | ✓ | ✓ | ✓ | 85.53% | 73.35% | 70.44% | 71.51% |
| ✓ | ✓ | ✓ | - | - | 86.39% | 73.62% | 70.22% | 71.49% |
| XGBoost | C4.5 | RF | Adaboost | LightGBM | Accuracy | Precision | Recall | F1-Score |
|---|---|---|---|---|---|---|---|---|
| ✓ | - | ✓ | ✓ | - | 99.79% | 99.69% | 99.69% | 99.69% |
| ✓ | - | ✓ | - | ✓ | 99.86% | 99.80% | 99.80% | 99.80% |
| ✓ | ✓ | - | - | ✓ | 97.75% | 96.90% | 96.52% | 96.54% |
| ✓ | ✓ | - | ✓ | - | 98.74% | 98.19% | 98.06% | 98.07% |
| ✓ | - | - | ✓ | ✓ | 99.55% | 99.34% | 99.32% | 99.32% |
| - | ✓ | ✓ | ✓ | - | 98.59% | 97.98% | 97.85% | 97.86% |
| - | ✓ | ✓ | - | ✓ | 98.60% | 98.01% | 97.85% | 97.87% |
| - | ✓ | - | ✓ | ✓ | 96.07% | 94.92% | 93.93% | 93.92% |
| - | - | ✓ | ✓ | ✓ | 99.68% | 99.53% | 99.52% | 99.52% |
| ✓ | ✓ | ✓ | ✓ | ✓ | 99.01% | 98.56% | 98.48% | 98.49% |
| ✓ | ✓ | ✓ | - | - | 99.94% | 99.92% | 99.92% | 99.92% |
| Method | Accuracy | Precision | Recall | F1-Score | Kappa |
|---|---|---|---|---|---|
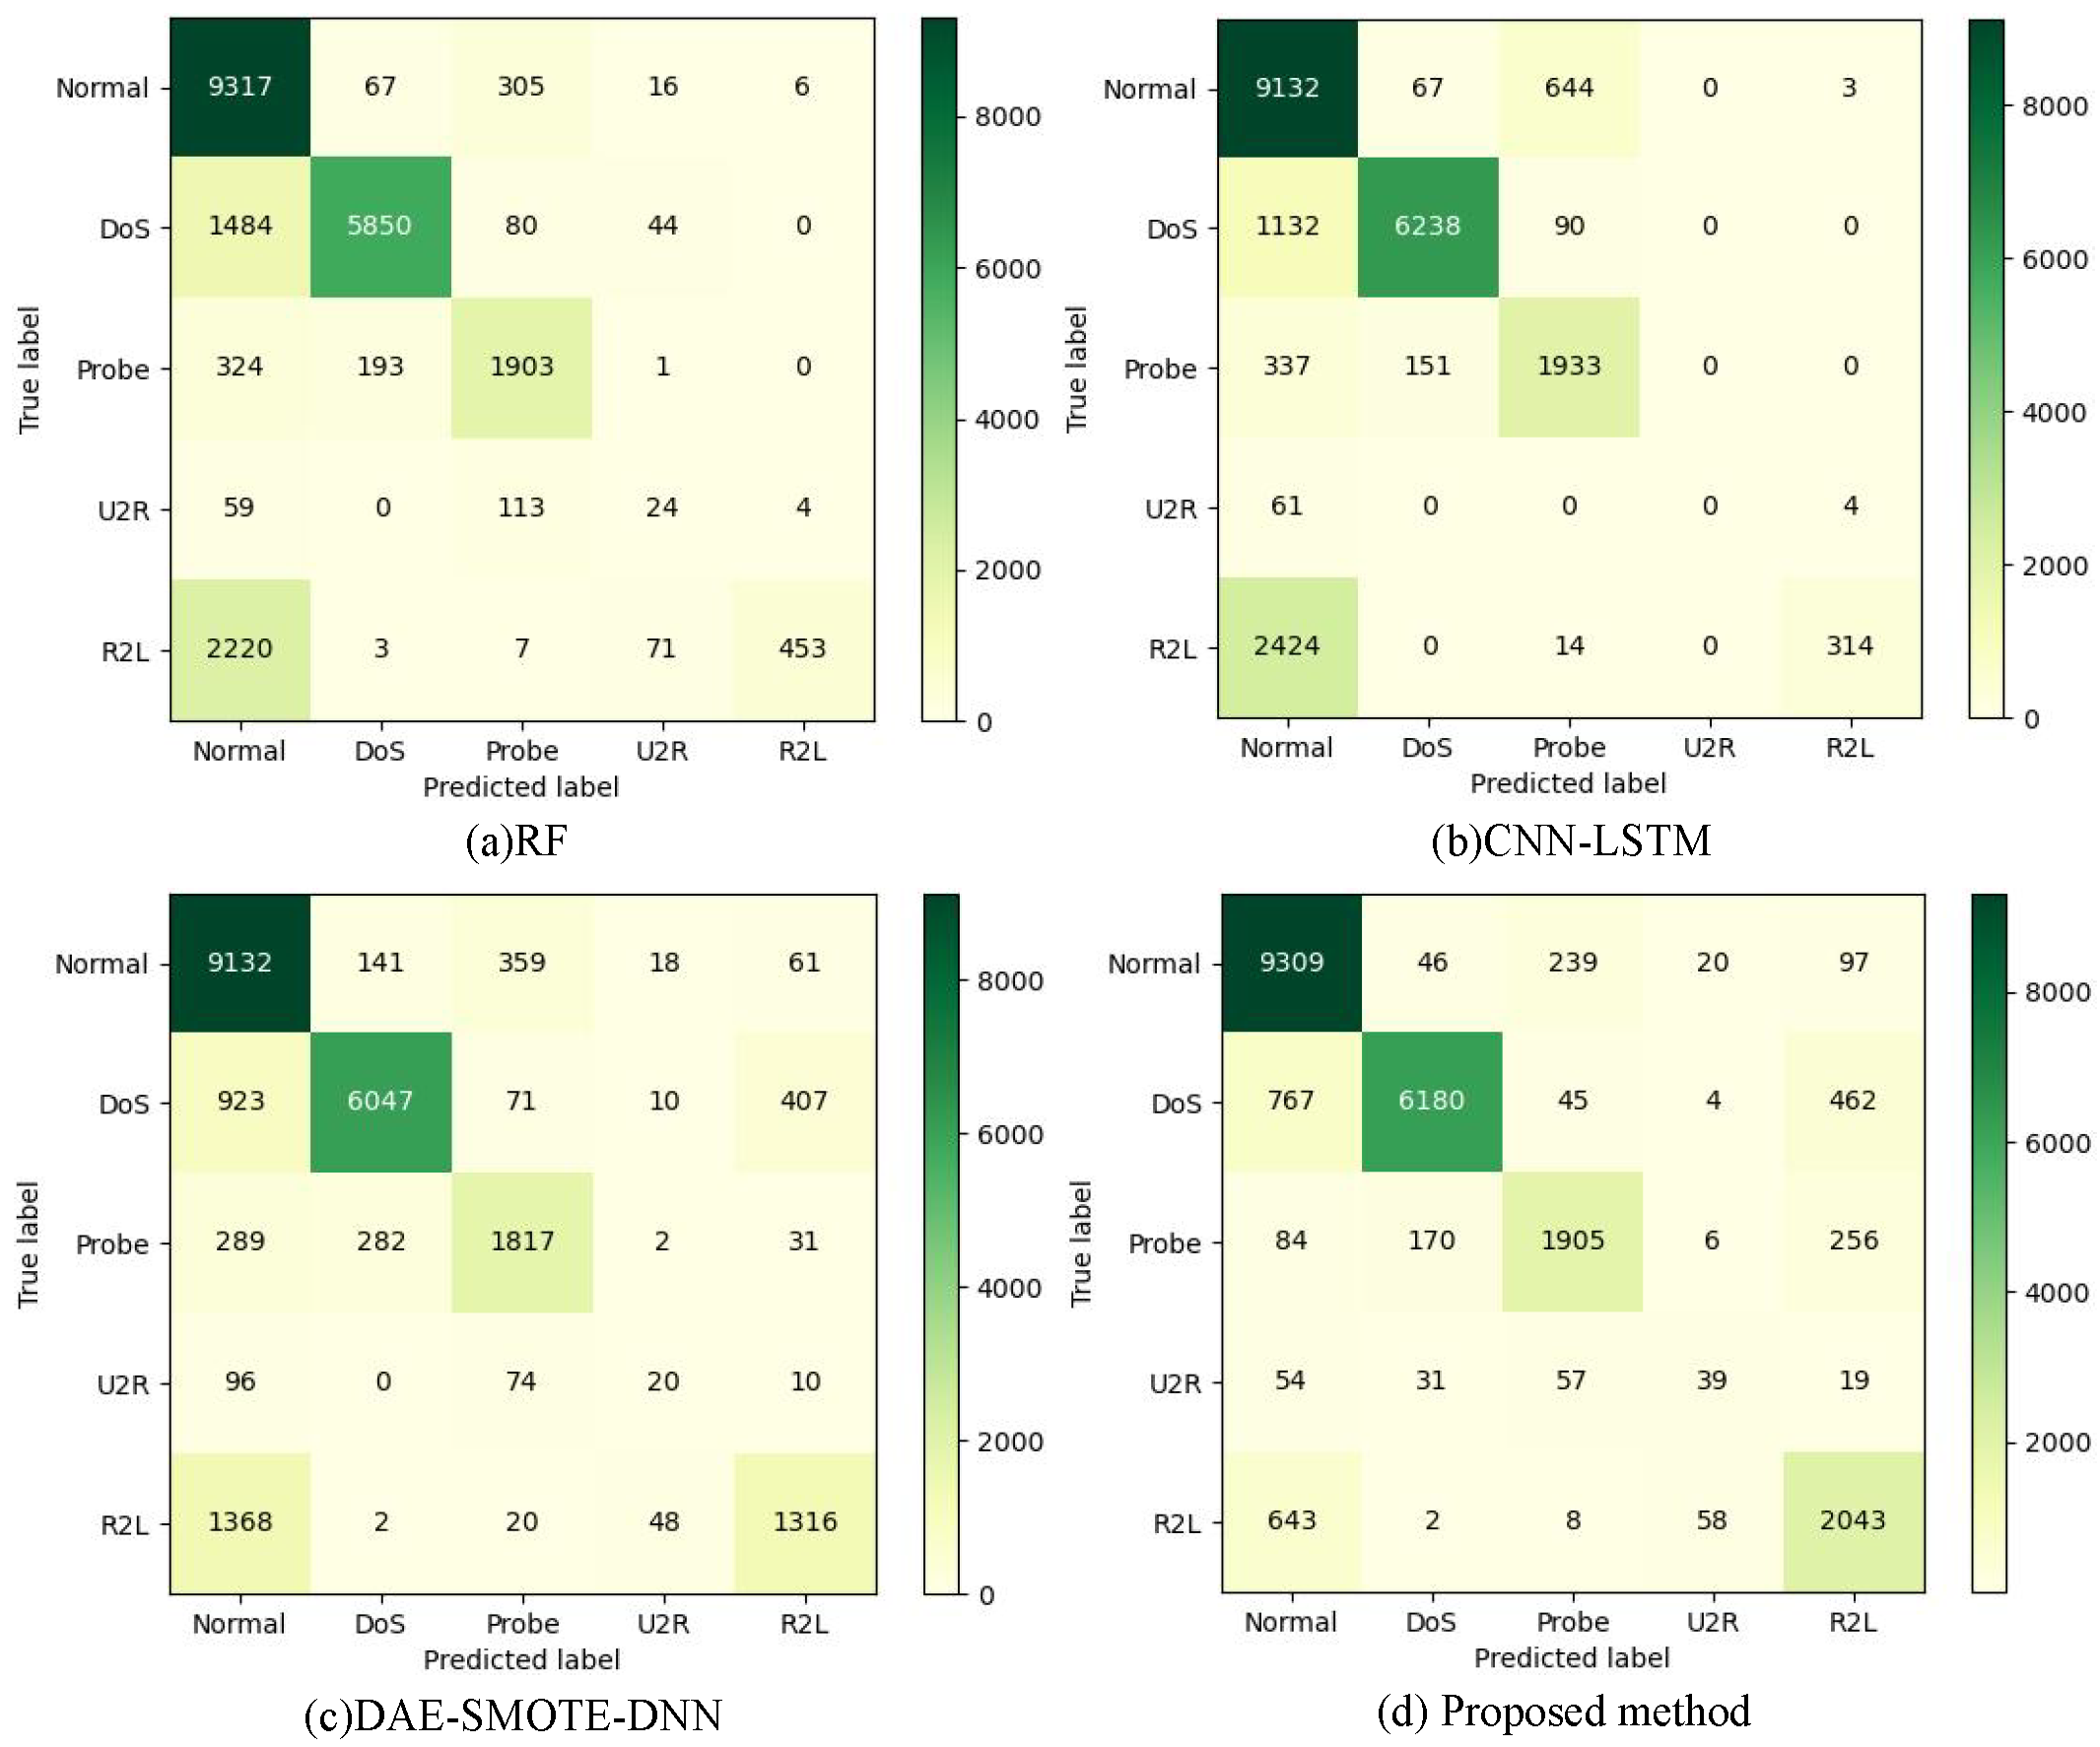
| RF | 75.88% | 88.68% | 49.11% | 50.36% | 61.40% |
| C4.5 | 75.62% | 79.03% | 49.68% | 49.48% | 65.70% |
| XGBoost | 75.52% | 68.08% | 46.81% | 48.01% | 60.54% |
| LightGBM | 75.70% | 80.00% | 49.36% | 52.69% | 60.91% |
| CNN | 79.75% | 86.46% | 56.96% | 59.71% | 67.90% |
| CNN-LSTM | 78.14% | 67.27% | 53.52% | 53.10% | 65.70% |
| DAE-SMOTE-DNN | 81.31% | 68.18% | 61.59% | 63.78% | 71.62% |
| Proposed method | 86.39% | 73.62% | 70.22% | 71.49% | 79.74% |
| Method | Accuracy | Precision | Recall | F1-Score | Kappa |
|---|---|---|---|---|---|
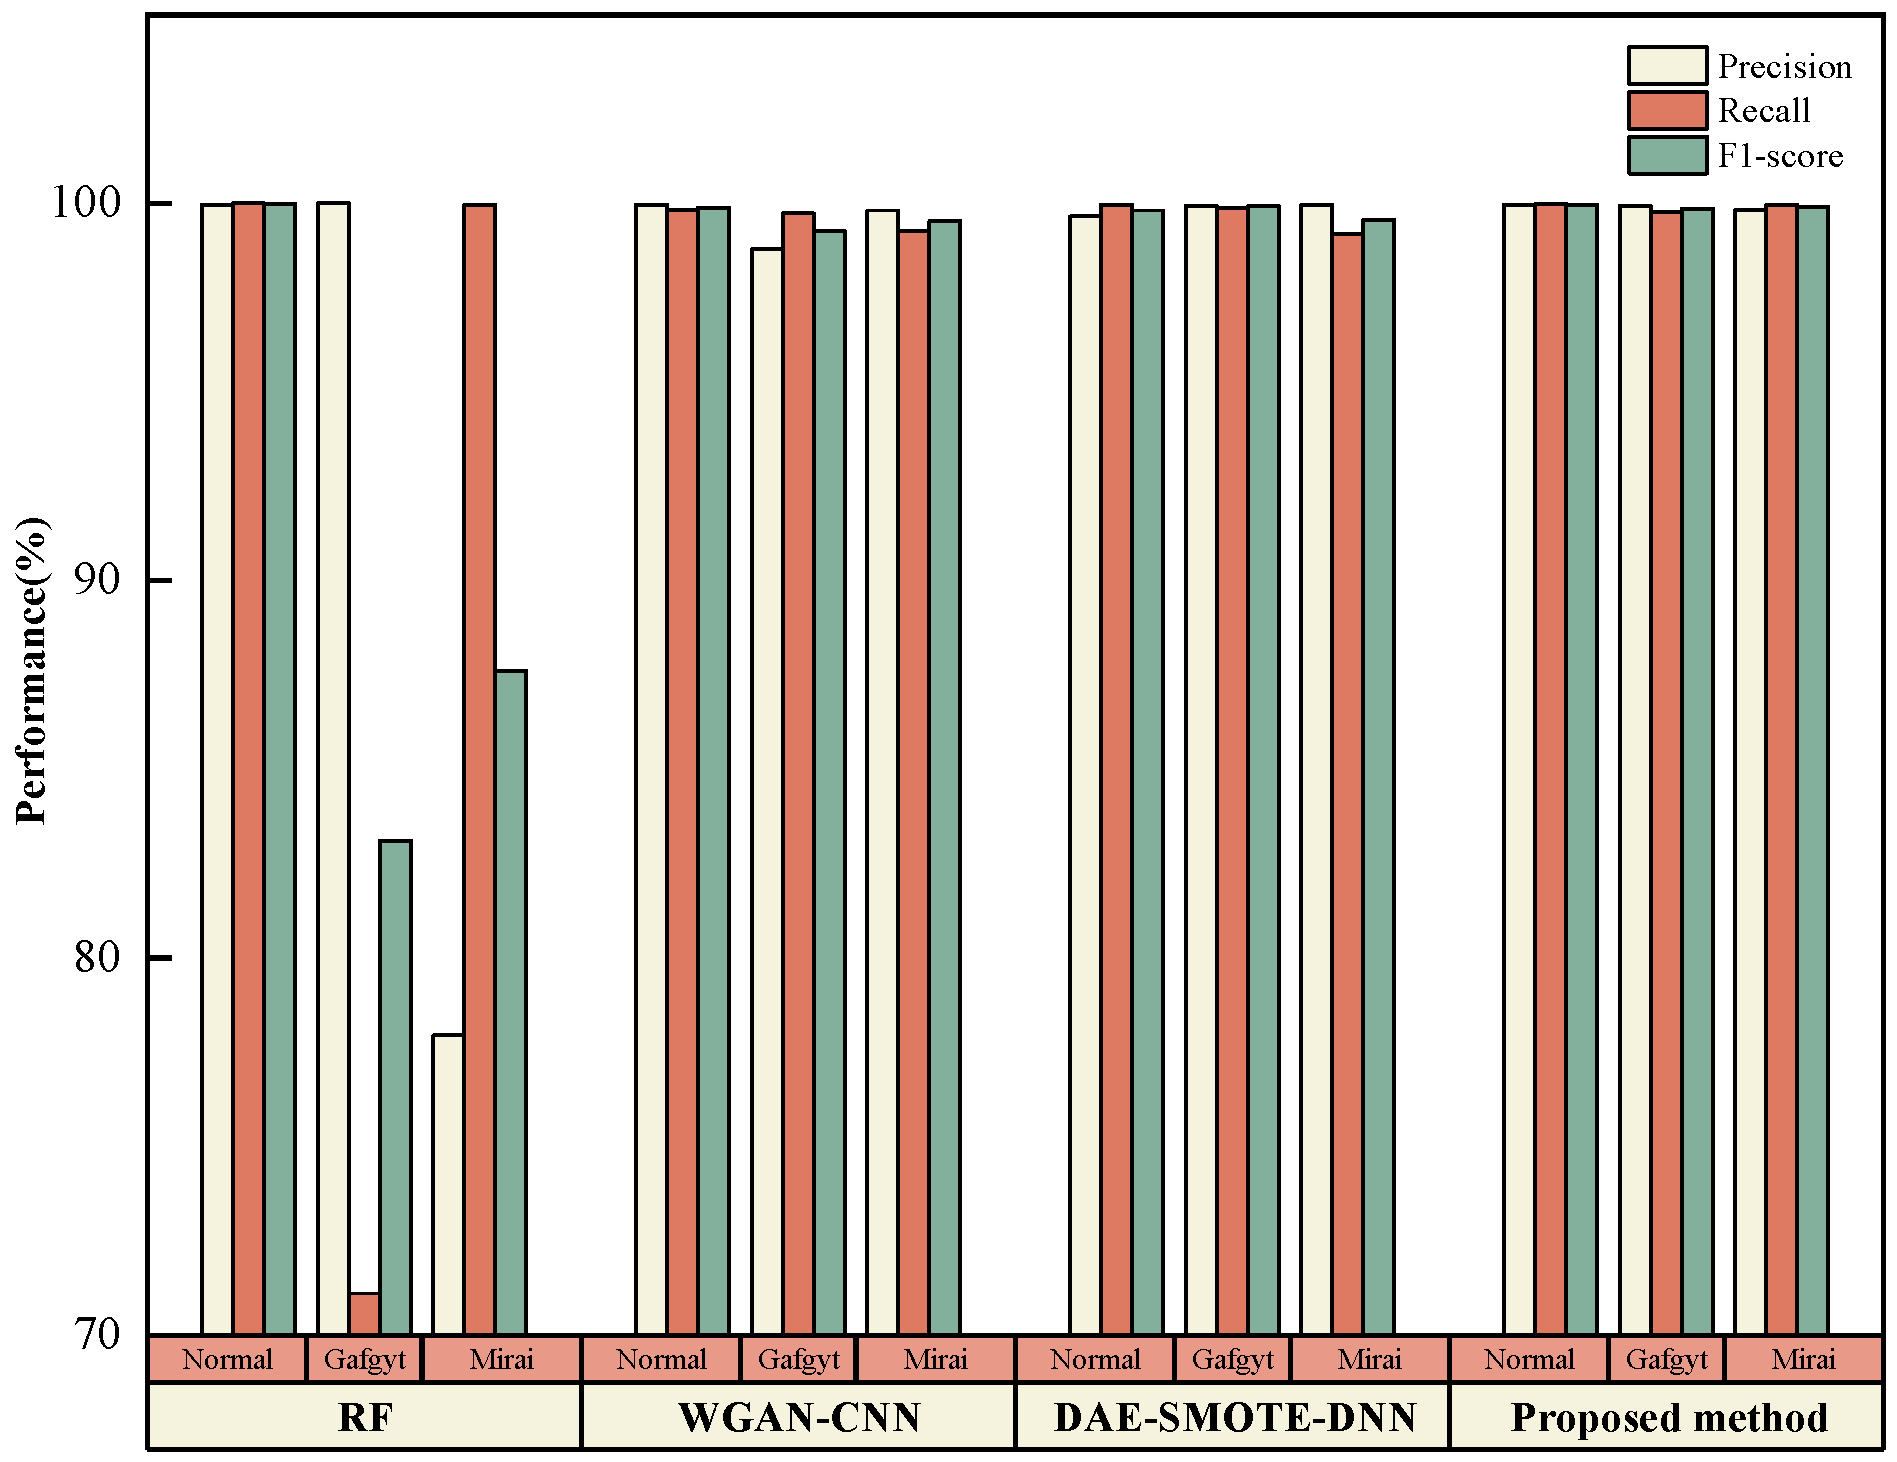
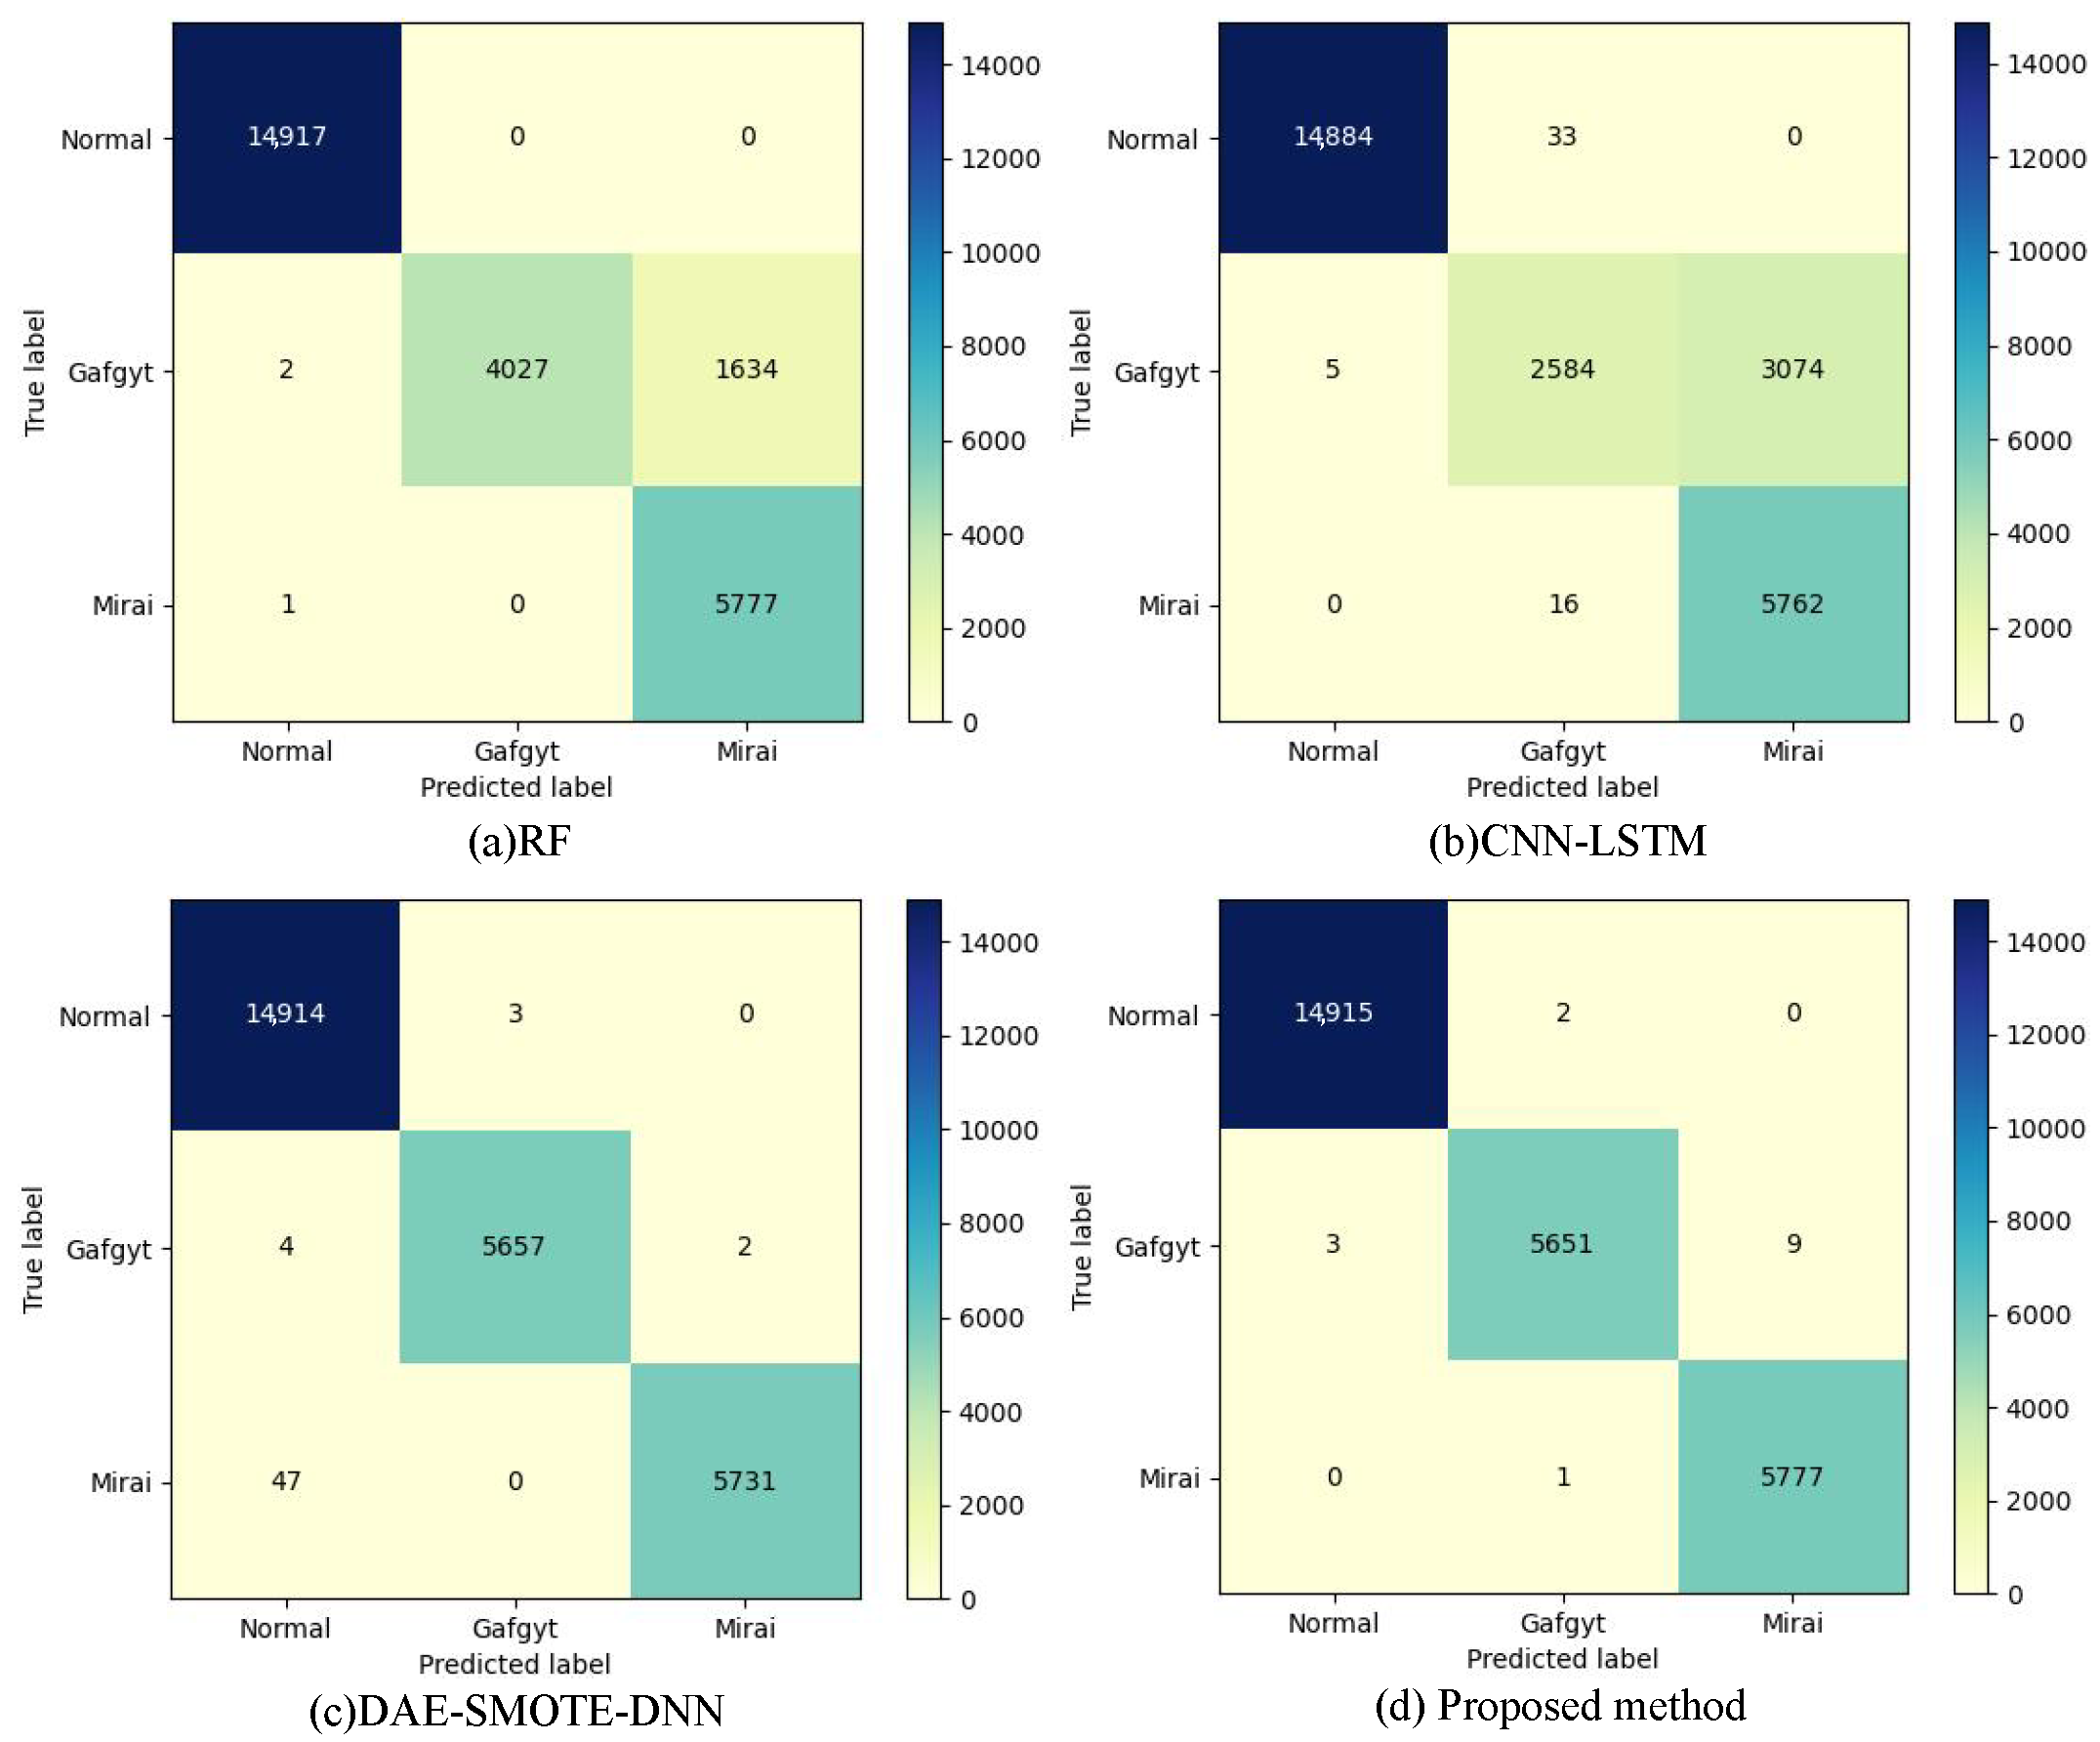
| RF | 93.79% | 92.64% | 90.36% | 90.24% | 89.39% |
| C4.5 | 97.28% | 96.20% | 95.85% | 95.84% | 95.36% |
| XGBoost | 90.36% | 89.59% | 85.04% | 84.55% | 83.45% |
| LightGBM | 88.42% | 88.46% | 82.03% | 80.94% | 80.14% |
| CNN | 99.68% | 99.52% | 99.61% | 99.56% | 99.46% |
| CNN-LSTM | 88.13% | 87.77% | 81.71% | 80.34% | 79.73% |
| DAE-SMOTE-DNN | 99.78% | 99.86% | 99.69% | 99.77% | 99.64% |
| Proposed method | 99.94% | 99.92% | 99.92% | 99.92% | 99.90% |
| Method | Module | NSL-KDD | |||||
|---|---|---|---|---|---|---|---|
| KGSMOTE | MDSAE | SVEDM | Acc | Pre | Re | F1 | |
| Proposed method | ✓ | ✓ | ✓ | 86.39 | 73.62 | 70.22 | 71.49 |
| (1) Only SVEDM | - | - | ✓ | 76.10 | 69.25 | 48.10 | 48.90 |
| (2) w/o KGSMOTE | - | ✓ | ✓ | 79.19 | 80.25 | 55.86 | 56.98 |
| (3) w/o MDSAE | ✓ | - | ✓ | 80.50 | 73.29 | 58.22 | 61.75 |
| Method | Module | N-BaIoT | |||||
|---|---|---|---|---|---|---|---|
| KGSMOTE | MDSAE | SVEDM | Acc | Pre | Re | F1 | |
| Proposed method | ✓ | ✓ | ✓ | 99.94 | 99.92 | 99.92 | 99.92 |
| (1) Only SVEDM | - | - | ✓ | 93.15 | 92.06 | 89.38 | 89.18 |
| (2) w/o KGSMOTE | - | ✓ | ✓ | 99.37 | 99.06 | 99.04 | 99.05 |
| (3) w/o MDSAE | ✓ | - | ✓ | 99.74 | 99.61 | 99.59 | 99.60 |
| Model | Year | Datasets | Accuracy | Classifification | Unknown Attack |
|---|---|---|---|---|---|
| MDPCA-DBN [52] | 2019 | NSL-KDD | 82.08 | Multi (5) | ✓ |
| LCVAE [53] | 2020 | NSL-KDD | 85.51 | Multi (5) | ✓ |
| CAFE-CNN [54] | 2021 | NSL-KDD | 83.34 | Multi (5) | ✓ |
| ID-UL [55] | 2022 | NSL-KDD | 81.48 | Multi (5) | ✓ |
| CS-NN [56] | 2022 | NSL-KDD | 85.56 | Multi (5) | ✓ |
| LGBA-NN [57] | 2022 | N-BaIoT | 90.00 | Multi (11) | - |
| SGAN-IDS [58] | 2022 | N-BaIoT | 99.89 | Binary (2) | - |
| EL-DTs [59] | 2022 | N-BaIoT | 99.60 | Multi (10) | - |
| Cu-DNNGRU [60] | 2022 | N-BaIoT | 99.39 | Multi (9) | - |
| GSMOTE-AE-RF(Baseline) | 2023 | NSL-KDD | 80.99 | Multi (5) | - |
| GSMOTE-AE-RF(Baseline) | 2023 | N-BaIoT | 98.47 | Multi (3) | - |
| KGMS-IDS(Proposed) | 2023 | NSL-KDD | 86.39 | Multi (5) | ✓ |
| KGMS-IDS(Proposed) | 2023 | N-BaIoT | 99.94 | Multi (3) | ✓ |
Disclaimer/Publisher’s Note: The statements, opinions and data contained in all publications are solely those of the individual author(s) and contributor(s) and not of MDPI and/or the editor(s). MDPI and/or the editor(s) disclaim responsibility for any injury to people or property resulting from any ideas, methods, instructions or products referred to in the content. |
© 2023 by the authors. Licensee MDPI, Basel, Switzerland. This article is an open access article distributed under the terms and conditions of the Creative Commons Attribution (CC BY) license (https://creativecommons.org/licenses/by/4.0/).
Share and Cite
Yang, Y.; Gu, Y.; Yan, Y. Machine Learning-Based Intrusion Detection for Rare-Class Network Attacks. Electronics 2023, 12, 3911. https://doi.org/10.3390/electronics12183911
Yang Y, Gu Y, Yan Y. Machine Learning-Based Intrusion Detection for Rare-Class Network Attacks. Electronics. 2023; 12(18):3911. https://doi.org/10.3390/electronics12183911
Chicago/Turabian StyleYang, Yu, Yuheng Gu, and Yu Yan. 2023. "Machine Learning-Based Intrusion Detection for Rare-Class Network Attacks" Electronics 12, no. 18: 3911. https://doi.org/10.3390/electronics12183911
APA StyleYang, Y., Gu, Y., & Yan, Y. (2023). Machine Learning-Based Intrusion Detection for Rare-Class Network Attacks. Electronics, 12(18), 3911. https://doi.org/10.3390/electronics12183911