Abstract
As the world increasingly becomes more interconnected, the demand for safety and security is ever-increasing, particularly for industrial networks. This has prompted numerous researchers to investigate different methodologies and techniques suitable for intrusion detection systems (IDS) requirements. Over the years, many studies have proposed various solutions in this regard, including signature-based and machine learning (ML)-based systems. More recently, researchers are considering deep learning (DL)-based anomaly detection approaches. Most proposed works in this research field aim to achieve either one or a combination of high accuracy, considerably low false alarm rates (FARs), high classification specificity and detection sensitivity, lightweight DL models, or other ML and DL-related performance measurement metrics. In this study, we propose a novel method to convert a raw dataset to an image dataset to magnify patterns by utilizing the Short-Term Fourier transform (STFT). The resulting high-quality image dataset allowed us to devise an anomaly detection system for IDS using a simple lightweight convolutional neural network (CNN) that classifies denial of service and distributed denial of service. The proposed methods were evaluated using a modern dataset, CSE-CIC-IDS2018, and a legacy dataset, NSLKDD. We have also applied a combined dataset to assess the generalization of the proposed model across various datasets. Our experimental results have demonstrated that the proposed methods achieved high accuracy and considerably low FARs with high specificity and sensitivity. The resulting loss and accuracy curves have demonstrated the efficacy of our raw dataset to image dataset conversion methodology, which is evident as an excellent generalization of the proposed lightweight CNN model was observed, effectively avoiding overfitting. This holds for both the modern and legacy datasets, including their mixed versions.
1. Introduction
Computer networks have revolutionized various aspects of our lives, including communication, knowledge acquisition, and interaction. Numerous sectors, such as healthcare, manufacturing, finance, education, aviation, and entertainment, heavily rely on computer networks, including cloud computing and online gaming. The proliferation of cloud computing has also paved the way for the Internet of Things (IoT), which has found applications across diverse industries. However, the widespread adoption of computer networks and the Internet has also created opportunities for cyberattacks, prompting cybersecurity concerns. Fortinet, a prominent network security provider, reports that global businesses expended more than USD 170 billion in 2022 to counter cybercrimes, highlighting the persistent disruption caused by these threats [1]. Malware and ransomware, phishing, distributed denial of service (DDoS), denial of service (DoS), structured query language (SQL) injection, zero-day exploit, domain name system (DNS) tunneling, and man-in-the-middle are among the most common cyberattacks and network breaches. Particularly, DDoS and malware attacks can be considered the most dangerous attacks, depending on the attack scales and the type of industry attacked.
In this study, we aim to specifically examine DDoS attacks. These attacks have been observed to exhibit a growing level of sophistication, frequency, volume, and efficiency and possess the capability to cause massive damage to various entities. DDoS attacks are a significant cybersecurity threat, with over 8.4 million attacks recorded in 2019 alone, averaging 23,000 attacks per day or 16 attacks per minute [2]. These attacks can severely damage organizations, disrupting applications and services by overwhelming networks with malicious traffic. Motivations for DDoS attacks range from hacktivism to cybercrime and espionage [3]. Recent instances include attacks on government websites in Ukraine before the Russian invasion [4]. DDoS attacks utilize multiple compromised computers and IoT devices to flood networks, targeting critical assets such as physical locations, data centers, servers, and domains [3]. In cybersecurity and intrusion detection, various mechanisms have been proposed for detecting, identifying, and classifying cyberattacks. DDoS attacks can be categorized based on the network components they target, such as Layer-7 attacks like hypertext transfer protocol (HTTP) flood, Protocol attacks like synchronize (SYN) flood, volumetric attacks such as DNS amplification, and other forms of DDoS attacks with different techniques [5].
Over the years, researchers have proposed diverse techniques for intrusion detection, identification, and mitigation. These range from simple rule-based or signature-based systems to machine learning (ML) and deep neural (DL) network-based approaches. Their pursuit of the optimal technique is driven by objectives such as improving attack detection and classification accuracy, processing time efficiency, resource requirements, real-time applicability, interpretability, and minimizing false alarm rates (FARs). Researchers have explored various ML algorithms and DL methods to develop efficient attack and classifier models. The central focus often revolves around ML and/or DL-based anomaly detection for identifying and classifying malicious traffic flows. Anomaly detection is a broad research field with diverse proposed techniques and approaches. An anomaly can be defined as an observation that appears inconsistent with the rest of a dataset, exhibiting a specific pattern that displays significant changes in a network’s normal traffic level [6]. Numerous papers have proposed different anomaly-based models by employing statistical, ML, and DL algorithms, such as Markov processes, statistical moments, multivariate distributions, Bayesian networks, fuzzy logic, decision trees, and neural networks [7,8,9,10,11,12].
Among those, DL has recently gained popularity, demonstrating itself to be an effective approach for cyberattack detection, classification, and mitigation across various network environments, including industrial control systems and IoT environments. DL has facilitated the development of anomaly-based detection models that require minimal human intervention and can detect zero-day attacks, unlike signature-based approaches. DL offers advantages such as increased detection rates, robustness to noise, high accuracy, improved system performance, computational efficiency, reduced false alarm rates (FAR), and decreased system complexity [13,14,15,16,17,18,19,20,21,22,23,24,25], but none of the prior work successfully achieved high performance with low system complexity.
In this paper, our objective is to develop a lightweight model that achieves higher accuracy, exhibits robust generalization across different datasets, and effectively reduces alarm rates in detecting and classifying DoS and DDoS attacks while avoiding overfitting. To achieve this, we employ a feature transformation approach to convert the CSE-CIC-IDS2018 and NSLKDD datasets into spectrogram-based images. The underlying hypothesis is that by transforming the original dataset into an image-based representation, we can enhance the patterns utilized by detector and classifier algorithms. Consequently, we could design a lightweight IDS model that yields improved performance metrics of significant importance.
This paper is structured as follows: Section 1 introduces the topic, Section 2 covers related works, Section 3 presents the proposed methodology and model, Section 4 showcases results and includes experimental graphs, discussion, and comparison, and finally, Section 5 concludes the paper and suggests future research directions.
2. Related Work
Numerous studies employed different ML algorithms for anomaly-based intrusion detection systems, including principal component analysis (PCA) based models [8] that proposed a novel general form for distance calculation and a new PCA-based detection method for IoT networks. Similarly, reference [9] proposes a robust anomaly detection technique where the training phase is supported using the decision tree algorithm and a hybrid of cuckoo search optimization and k-means is cascaded for detection. This model produced an improved detection rate and FAR among the other measurement matrices. Similarly, R.B. Basnet et al. [10] propose ML-based models to overcome the vulnerabilities of cloud computing networks to attacks such as DDoS cyberattacks. In this study, the authors proposed an intrusion detection system that combines fuzzy c-means clustering (FCM) and support vector machines (SVM) to significantly improve timely detection accuracy in a cloud computing environment.
Other ML algorithms are also effective in detecting and classifying several cyberattacks in various environments. Z. Ahmed et al. [11] present supervised ML algorithms, which include k-nearest neighbors (KNN), logistic regression (LR), SVM, multilayer perceptron (MLP), decision tree (DT), and random forest (RF), for detection and classification in IoT security. In this study, the authors successfully detected and classified specific attacks, including DDoS, DoS, reconnaissance, and information theft in IoT networks. As SVM is among the frequently used ML algorithms in anomaly detection for network security, the study in [12] proposes a one-class SVM for anomaly detection. Despite its computational cost and significant memory requirement, this algorithm is excellent at capturing traffic patterns and malicious anomalies in IoT environments.
Widely used DL approaches for handling complex and high-dimensional data include restricted Boltzmann machines, deep belief networks, feed-forward neural networks, deep neural networks, recurrent neural networks, CNNs, and deep auto-encoders, among others, as identified in various survey papers [8]. DL is suitable for networks in various environments, such as the IoT. The survey by S. Tsimenidis et al. [9] details the application of DL approaches in IoT environments with a detailed review of DL models that have been recently proposed for IoT intrusion detection. Based on [9], DL solutions are classified comprehensively based on the application of DL for IoT cybersecurity as effective IoT intrusion detection solutions. Numerous DL-based intrusion detection studies face challenges owing to the shortcomings of publicly available datasets, as highlighted in various survey works [10]. These datasets often suffer from poor representation, outdated information, high data redundancy, unrealistic simulation, limited traffic diversity, and a lack of generalized modern traffic data. The scarcity of high-quality datasets has prompted researchers to develop diverse DL-based solutions specifically designed for intrusion detection systems.
To address zero-day cyberattacks in IoT infrastructure and reduce FARs, ref. [11] proposes a DNN-based IDS using mutual information (MI) for feature dimension reduction. This achieves high accuracy and a low FAR with reduced network complexity. I. Idrisi et al. [12] present a DL-based IDS against BotNet attacks in the IoT, utilizing CNNs to detect popular Botnet attacks and outperforming RNN-based systems. M. Ge et al. [13] introduce a customized DL approach for detecting and classifying IoT-based cyberattacks, such as DoS, DDoS, data gathering, and data theft, achieving high classification accuracy through feed-forward neural networks with embedding layers and transfer learning. R. Yao et al. [14] train and evaluate robust IDS using the commonly used datasets KDD Cup 99 and NSLKDD. This study employs CNN-LSTM neural networks for cross-layer feature fusion, capturing both temporal and global characteristics of intrusion information for enhanced detection capabilities. By connecting CNN and LSTM, the IDS achieves accurate intrusion identification by leveraging comprehensive features extracted from regional and periodic traffic signal characteristics.
Y. Imrana et al. [15] introduce a bidirectional long short-term memory (BiLSTM) IDS to address high FARs and low detection accuracies in certain attack classes, specifically user-to-root (U2R) and remote-to-local (R2L) attacks in the NSLKDD dataset. The proposed solution outperforms LSTM-based IDSs, achieving better accuracy and significantly reducing FARs for U2R and R2L classes. In reference [16], a self-adaptive IDS is proposed using a DL-based model that dynamically adjusts the network structure for different attack types, enabling detection without altering the entire IDS structure. This system, based on an improved genetic algorithm (GA) and deep belief network (DBN), achieves high detection and recognition rates with a compact structure and reduced neural network complexity. A. Mezina et al. [17] present an anomaly detection-based approach that addresses model overfitting using temporal CNNs and U-Net networks for attack classification with generalization characteristics. This study evaluates the proposed model on both the old KDD99 dataset and the modern large-scale CSE-CIC-IDS2018 dataset while mitigating data imbalance challenges using the focal loss function. The results demonstrate the model’s generalization ability and effectiveness in handling severe class imbalances.
The utilization of deep learning-based generative models, specifically generative adversarial networks (GANs) and variational autoencoders (VAEs), is emphasized in reference [18]. These models demonstrate remarkable performance in generating realistic dataset content for augmenting existing datasets and addressing class imbalance issues. V. Pham et al. [19] leveraged generative networks to build an anomaly-based IDS with reduced FARs and improved generalization. The proposed weakly supervised model utilizes GANs to generate malicious samples during training, leading to improved detection rates and lower FARs.
We have managed to find only a handful of related works in the research area where a given dataset is transformed into another format to produce better models. One work where the CSE-CIC-IDS2018 datasets, as well as the KDD datasets, are transformed into their respective image datasets to construct an improved DL-based intrusion detection model for DoS attacks is presented in [18]. In this work, a CNN model is proposed, wherein an input image is prepared by rearranging the dataset’s features into a matrix-like representation. For both datasets used in their work, they have generated colored and grayscale image datasets by rearranging the features in both datasets and color coding them to have image pixels of 13 × 9 × 1 or 3 (that is, 1 or 3 representing the color channels) and 13 × 6 × 1 or 3 for both KDD and CSE-CIC-IDS2018 datasets, respectively. After that, several CNN models with different hyperparameters were tested for best performance based on the prepared image dataset. Though the authors reported excellent model accuracy and performance for multi-class classification, generalizing their proposed method to avoid overfitting remains a challenge.
A lightweight IDS was reported in [19], where raw traffic is converted into image data. In this study, the proposed method improves computational efficiency, but the reported experimental results demonstrate that the detection accuracy is considerably low. In contrast, the authors in [20] proposed a system that takes grayscale 2D-image datasets as input, which are prepared from a few packets of captured raw traffic data. By creating the pattern for the raw traffic data, the authors proposed an IDS model that consists of CNNs and AEs for auto-profiling the traffic patterns and filtering abnormal traffic, and they have reported high classification accuracy and low false alarms in their experimental results. While their unsupervised proposed DL model achieved high accuracy, the FAR is substantially high. Additionally, the design model consists of layers of CNN cascading with an auto-profiling auto-encoder. This adds a considerable amount to the complexity of the systems, hence the heavyweight network.
Another study, which is closely related to our method, is published in reference [21]. Expecting to reduce the high FARs observed in many proposed IDSs, the authors of [21] proposed a network IDS framework using a deep CNN that uses network spectrogram images generated using the short-time Fourier transform consuming the CSE-CIC-IDS2017 network dataset. They successfully converted the dataset into images and attempted to reduce the FAR to approximately 1.033% while managing to achieve an average of 98.758% accuracy for the multi-class classification. They have also used a two-layer CNN and two layers of 128 neurons to build their fully connected module, which results in numerous learnable parameters, which in turn increases system complexity.
In this study, we aim to reduce the FAR and increase the accuracy, specificity, and sensitivity by proposing a novel approach to transforming datasets into images with augmented patterns by utilizing the short-term Fourier transform (STFT), and this high-quality image dataset allows us to use a simple, lightweight CNN-based IDS model capable of detecting and classifying DoS and DDoS cyberattacks.
3. Proposed Methodology and Model
3.1. Spectrogram Images
Spectrogram images serve as visual representations of signal frequency content evolving over time, providing a robust means to analyze and visualize the intricate frequency components of a signal. In our investigation, spectrogram images were derived from network traffic data utilizing the short-term Fourier transform (STFT), facilitating the concurrent capture of temporal and frequency information.
The decision to incorporate spectrogram images into our research methodology stemmed from their intrinsic ability to amplify pattern recognition and contribute to anomaly detection within intrusion detection systems (IDS). Through the conversion of raw network traffic data into spectrogram images and subsequent manipulations to accentuate patterns, we harness the capability to effectively elucidate subtle deviations and anomalies indicative of potentially malicious activity.
Spectrogram images exhibit distinct visual attributes reflective of the underlying frequency content inherent within the signal. These characteristics encompass variations in color intensity, symbolizing signal amplitude, alongside discernible patterns corresponding to specific frequency components. By examining and interpreting these visual features, deep insights into the nature of network traffic can be garnered, facilitating the identification of potential threats and anomalous behaviors.
Spectrogram images play a critical role in our intrusion detection methodology by providing a visual representation of network traffic data. Understanding the definition, rationale, and visual characteristics of spectrogram images is essential for interpreting our research findings and insights.
3.2. Methodology
In this section, we delineate the methodology employed in our study, focusing on transforming publicly available datasets into an image format suitable for deep learning networks, with an emphasis on data conversion as the main contribution enabling the development of a lightweight CNN architecture for IDS.
Our study adopts a novel approach aimed at facilitating the development of high-performance, lightweight designs for DL networks, particularly in the context of IDS. To achieve this, we devised a unique methodology centered around transforming publicly available datasets into a more accessible format for DL networks.
Central to our methodology is the utilization of the STFT technique to generate spectrogram-based representations of network traffic data. This technique, commonly employed in signal analysis for various purposes, such as observing frequency and time localizations, serves as the cornerstone of our data transformation process. By leveraging STFT-based spectrogram representations, we aim to enhance the discernibility of distinctive patterns within processed network traffic signals.
In our study, we harnessed this concept to augment the interpretability of network traffic data, thereby enabling more effective detection and classification of anomalies. Through our methodology, we successfully converted the CSE-CIC-IDS2018 dataset into an image format suitable for DL networks. Furthermore, to showcase the versatility and generalizability of our approach, we extended our analysis to the NSLKDD dataset, demonstrating its applicability across both older and modern traffic datasets.
In essence, our study presents a pioneering methodology that bridges the gap between raw network traffic data and DL-based anomaly detection systems. By converting datasets into an image format through the STFT technique, we pave the way for the development of lightweight DL architectures capable of robustly detecting and classifying network traffic flows. This innovative approach not only enhances the accessibility and usability of DL techniques in the field of network security but also underscores the potential for broader application across diverse datasets and domains.
3.2.1. Data Preprocessing: Cleaning and Preparation
Initially, the publicly available CSE-CIC-IDS2018 and NSLKDD datasets underwent comprehensive data preprocessing procedures. Beyond standard cleaning processes, we tailored the preprocessing steps to prioritize feature relevance and minimize noise. This involved the removal of timestamps and handling missing or infinite values. By curating the datasets to include only normal traffic flows and specific types of DoS and DDoS attacks, we refined our analysis scope.
To illustrate, Figure 1 outlines our data collection process and depicts each stage along their specific outputs, where we obtained the primary dataset, CSE-CIC-IDS2018, from the Canadian Institute for Cybersecurity (CIC) and acquired the NSLKDD dataset to assess the generalizability of our methodology across different network datasets. Upon obtaining both datasets, we initiated a data preprocessing step to ensure cleanliness and uniformity. This step involved the removal of unnecessary features, such as timestamps, and the exclusion of irrelevant data points to streamline our analysis.
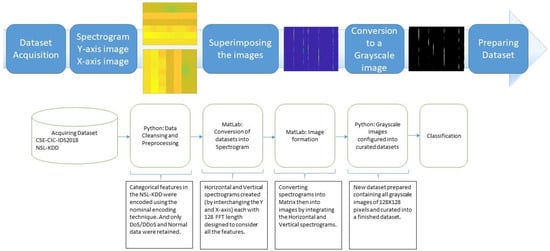
Figure 1.
Proposed dataset to image conversion module.
Subsequently, we retained only the normal traffic flows and the different types of DoS and DDoS attacks, excluding any other types of attacks. The selected attacks, in addition to the normal traffic flows, included Hulk, GoldenEye, Slowloris, and Slowhttptest as DoS attacks and Low Orbit Ion Canon HTTP (LOIC-HTTP), Low Orbit Ion Canon UDP (LOIC-UDP), and High Orbit Ion Cannon (HOIC) as DDoS attacks. This dataset, as explained in [22], has 80 features extracted using the CICFlowMeter-V3 tool. Similarly, after the preprocessing, 117 features were considered for the NSLKDD dataset, where only DoS attacks and normal flows were considered (DoS types of apache2, back, land, Neptune, mailbomb, pod, processtable, smurf, teardrop, udpstorm, and worm).
3.2.2. Spectrogram Image Generation
After this meticulous data-cleaning process, we proceeded to convert each entry in the datasets into its corresponding spectrogram representation, as depicted in both horizontal and vertical displays in Figure 2.
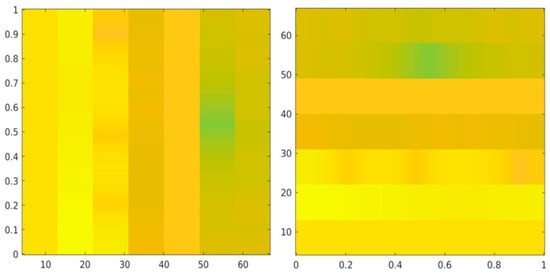
Figure 2.
Spectrograms display horizontal, right, and vertical, left.
After obtaining these spectrogram representations, we integrated them to form a pattern-augmented image representation of the dataset entry. The conversion was facilitated by Equation (1), which entails taking the absolute value of the division of the squared values of the vertical spectrogram points by the horizontal points, where α and β represent the vertical and horizontal spectrogram images in complex number representation, respectively. It is noteworthy that spectrogram values are inherently complex numbers, necessitating the extraction of their absolute value to specify color data as numeric or logical values during image creation. This process ensures consistency and coherence in the resulting image dataset, facilitating seamless interpretation and analysis.
The integration of the two spectrogram image matrixes produces the superimposed pattern-augmented images, as shown in Figure 3.
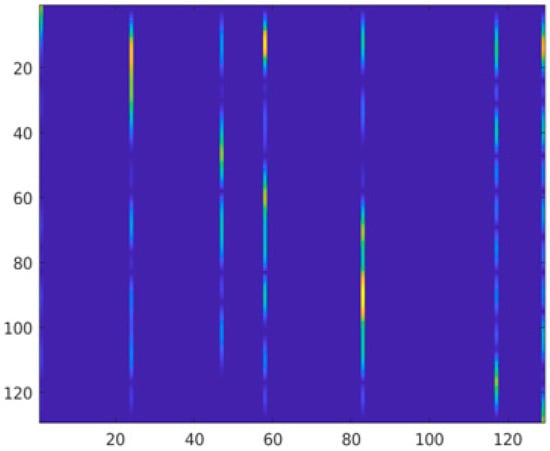
Figure 3.
Pattern augmented image.
After obtaining the images for each dataset entry across all utilized datasets, we converted these into grayscale representations and stored them as an image dataset file to be used in the DL networks. By transitioning from colorful images, as shown in Figure 3, to grayscale images, as illustrated in Figure 4, we streamlined data storage and processing requirements. Furthermore, the utilization of grayscale format for both normal and attack traffic flows further optimized resource utilization.
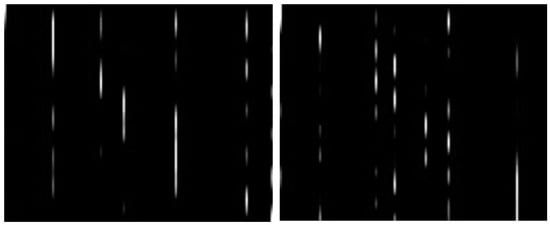
Figure 4.
Traffic flow is normal on the right, and the DDoS attack is on the left.
In our study, we employed both Python (www.python.org accessed on 26 February 2024) and MATLAB (www.mathworks.com accessed on 26 February 2024) for different stages of our research pipeline. Python served as the primary tool for data preprocessing, model development, and training, benefiting from its extensive libraries and frameworks tailored for deep learning tasks. On the other hand, MATLAB was utilized for specific signal processing tasks, particularly in generating network spectrogram images using the short-term Fourier transform (STFT). We opted for MATLAB in this context due to its rich signal-processing toolbox and familiarity with the signal-processing research community.
It is worth noting that the choice of MATLAB was primarily driven by its specialized capabilities in signal processing rather than any exclusive requirement. Our primary goal was to prepare image datasets for high accuracy and low alarm rates. However, it should be understood that Python also offers robust libraries for Fourier transforms and other signal analysis tools, making it a viable alternative for generating the image dataset.
3.2.3. DL Models: Showcasing the Benefits of the Data Conversion
The benefits stemming from our innovative data conversion method played a pivotal role in expediting the detection and classification processes within our experimental DL model. By prioritizing simplicity and efficiency, we achieved remarkable gains in computational performance, enabling swift and accurate analysis of network traffic data. This streamlined approach not only enhances the feasibility of deploying deep learning networks for intrusion detection but also underscores the transformative impact of our methodology in advancing network security solutions.
To showcase the efficacy of the dataset conversion method, we used simple CNN and ANN models. ANN model (Figure 5) is compared with the CNN model (Figure 6 and Figure 7) to highlight the significant reduction in network weight achieved through our dataset conversion method, as demonstrated by the lightweight CNN model (Figure 6 and Figure 7).
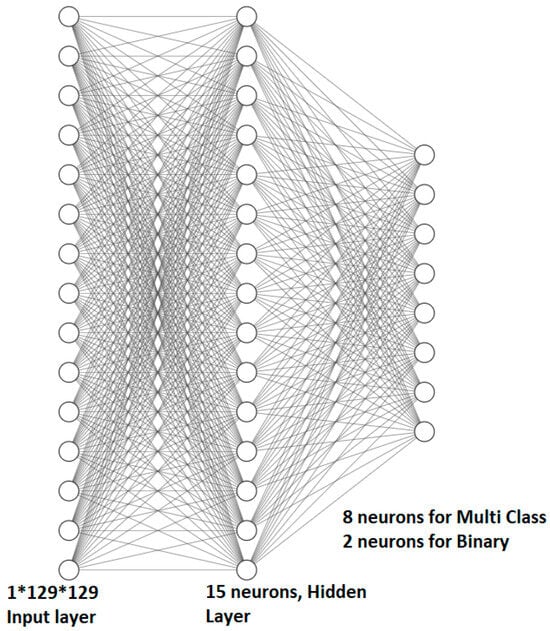
Figure 5.
ANN model for binary and multi-class.
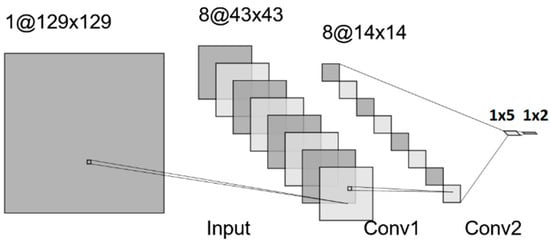
Figure 6.
CNN—binary-class model.
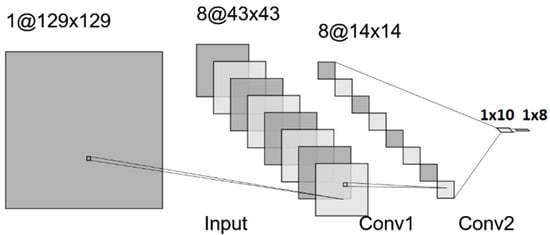
Figure 7.
CNN—multi-class model.
To delve deeper into the significance of our proposed conversion method, it is crucial to understand why we opted for both convolutional neural network (CNN) and artificial neural network (ANN) models in our experimentation. CNNs are particularly well-suited for image-based tasks due to their ability to automatically learn hierarchical representations of data. Given that our dataset was transformed into an image format, CNNs were a natural choice for processing such data. Their architecture allows for the extraction of spatial hierarchies and patterns from images, making them highly effective for tasks like anomaly detection in network traffic.
On the other hand, we also considered ANN models for their simplicity and interpretability. While not as adept at handling image data as CNNs, ANN models are valuable for their straightforward architecture and ease of implementation. In our experimentation, we employed a shallow ANN model to contrast with the CNN, showcasing the significant reduction in network weight achieved through our dataset conversion method. The lightweight nature of our CNN model, as demonstrated in Figure 6 and Figure 7, reflects the high quality and low bias–variance characteristics of the converted dataset.
The conversion of our dataset into a visually informative format not only enhances the interpretability of the Dl models but also contributes to the development of a lightweight IDS. This is underscored by the remarkable bias–variance characteristics observed in our converted dataset, as evidenced by our experimental results, notably the accuracy and loss curves obtained during both the training and testing phases. A pivotal objective of our study is to propose dataset conversion so that an IDS model that strikes a balance between effectiveness and computational efficiency is possible. This objective is realized through the preparation of our datasets, circumventing the typical necessity for deeper and more complex neural networks. By prioritizing data cleanliness and leveraging our innovative conversion methodology, we pave the way for the creation of a streamlined and effective IDS model capable of delivering robust performance without excessive computational overhead.
As shown in Figure 5, the ANN model is an extremely shallow model with only a single hidden layer with 15 neurons and consists of input and output layers. In this model, the input is a 1 × 129 × 129 grayscale image, and the input layer should effectively accept this input. As shown in Figure 6, the input layer is set only for illustration purposes as it does not contain any learnable parameters, unlike the hidden and output layers. These two layers have numerous learnable parameters, as shown in Table 4 (for the binary-class ANN model). In the case of multi-class classification, the output layer of the network consists of eight neurons, representing the assumed seven classes of attacks along with the normal class from the CSE-CIC-IDS2018 dataset. However, when performing binary-class classification in both the ANN and CNN networks, the number of neurons in the output layer is reduced to two.
We have set all the parameters and hyperparameters the same, including mainly the learning rate, the weight initialization method, epoch numbers, batch sizes, the optimizer technique, and types of activation functions. The ReLU activation function was used in all layers other than the output layers, where a softmax activation function was used. The CNN binary and multi-class classification models are shown in Figure 6 and Figure 7, respectively.
Both the multi and binary CNN models have almost similar structures and components, except that they slightly differ in the hidden and output layers. Similar to the ANN model, the input for the CNN model is 1 × 129 × 129 pixels of an image. After the input layer, to process the image input, we utilize two convolutional layers, each consisting of eight filters with a size of 3 × 3. The fully connected input and output layers in the CNN models are similar to those of the corresponding binary-class and multi-class ANN models, with similar parameters and hyperparameters. The relationship among the inputs and outputs across the layers for the CNN models is depicted in Table 5. Both Tables 4 and 5 demonstrate the distinct system complexity between the ANN and CNN models, despite their similar performance in detecting and classifying cyberattacks. The ANN networks outperform the CNN networks, but they also generate a high number of learnable parameters when compared with the CNN counterpart models. Hence, the proposed CNN models are useful as lightweight intrusion detection and classification systems.
3.2.4. Training Settings
In this section, we present a detailed overview of the training settings employed for this study, focusing specifically on the binary and multi-class classification CNN models, as depicted in Table 1. These settings encompass essential hyperparameters, optimization algorithms, and other parameters during the training phase. By transparently documenting the training settings, we aim to facilitate a comprehensive understanding of the experimental setup and enable the reproducibility of our findings. The tabulated presentation of training settings offers readers a clear and concise reference point for assessing the methodological rigor of our study. Through this detailed exposition, we underscore our commitment to fostering transparency and facilitating future research endeavors in the domain of intrusion detection.

Table 1.
Training setting.
It is noteworthy that our novel dataset transformation technique ensures the production of high-quality image datasets. Consequently, neither the CNN nor the ANN models necessitated explicit regularization techniques, showcasing outstanding regularization and generalization performance.
3.2.5. Evaluation Metrics
This section explains the most commonly used evaluation metrics for measuring and evaluating the performance of DL models. The evaluation metrics are based on the different attributes used in a confusion matrix, which is a two-dimensional matrix providing information about the Actual and Predicted classes, which are True Positive (TP), False Negative (FN), False Positive (FP), and True Negative (NG) [23].
Accuracy: Ratio of correctly classified instances to the total number of instances.
Precision: Ratio of correctly predicted attacks to all the samples predicted as attacks.
Recall: Ratio of all samples correctly classified as attacks to all the samples that are actually attacks.
F1 Score: Calculated as the harmonic mean of the precision and recall scores.
False Positive Rate: Ratio of wrongly predicted attack samples to all the samples that are normal.
4. Results and Discussion
In this section, we present a comprehensive analysis of the results obtained from our experiments conducted using the CSE-CIC-IDS2018 and NSLKDD datasets, both individually and in combination, as summarized in Table 2.
Table 2.
Sample dataset.
The choice of 90% to 10% for the CSE-CIC-IDS2018 and 95% to 5% for the combined datasets of NSLKDD + CSE-CIC-IDS2018 split for training and testing data in machine learning experiments offers a balance between several key considerations. It ensures ample data for model training while still providing a sizable test set for reliable evaluation, as we have a sufficiently large dataset. This split allows for accurate performance estimation, statistical significance, and efficient computational usage. Additionally, it supports cross-validation within the training set, further enhancing the assessment of model performance. Overall, the split is a commonly accepted choice, especially when the dataset is sufficiently large to support it and when the model is relatively simple.
Based on our experimental results, as displayed in Table 3, we observe the efficacy of our dataset conversion method, reflected in the high accuracy, precision, recall, and F-1 scores for all the assumed datasets applied to the binary-class models. We generated these evaluation metrics as they are crucial for assessing our proposed conversion methodology.
Table 3.
Evaluation metrics for binary-class classification.
As observed in Table 3, both models exhibit comparable performance, with the ANN slightly outperforming the CNN architecture. When we interpret this in conjunction with other conditions, such as the model complexity and loss/accuracy curves, we can deduce that CNN is a significantly robust model. By examining Table 4 and Table 5, it becomes evident that the CNN model achieves commendable performance despite having a significantly smaller number of learnable parameters when compared to the ANN model. The CNN model only required 8521 learnable parameters to achieve comparable performance to the ANN model for binary-class classification, while the ANN required approximately a quarter of a million learnable parameters. Furthermore, the comparative analysis between the CNN and ANN models reveals interesting insights. While the ANN model exhibits marginally better performance, the CNN model showcases remarkable robustness despite having significantly fewer learnable parameters. This highlights the effectiveness of our image dataset preparation method in facilitating the development of lightweight yet powerful IDS models.
Table 4.
ANN binary-class model summary.
Table 5.
CNN binary-class model summary.
In addition, the CNN model in both the binary and multi-class models has achieved excellent performance in avoiding overfitting when compared with the ANN models. For this, we have generated the loss/accuracy curves during the training and evaluation sessions, as shown in Figure 8 and Figure 9.
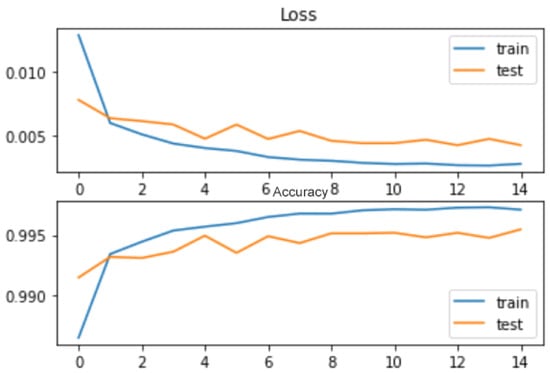
Figure 8.
CSE-CIC-IDS2018: Binary-ANN loss/accuracy during training/testing.
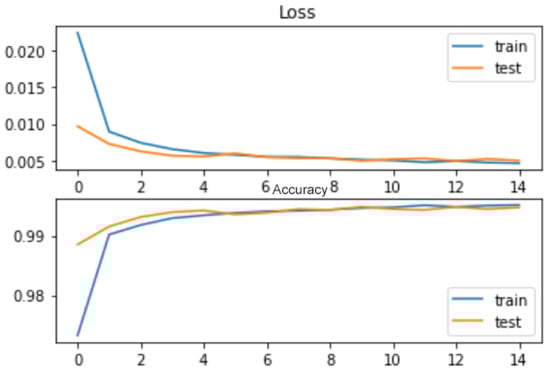
Figure 9.
CSE-CIC-IDS2018: Binary-CNN loss/accuracy during training/testing.
As shown in Figure 8 and Figure 9, the CNN model exhibits better generalization and avoids overfitting more effectively than the ANN model. It has been recorded that both models avoided overfitting, with ANN’s accuracy as Train: 0.9975, Test: 0.9955, and CNN’s accuracy as Train: 0.9956, Test: 0.9948. From this, it is clear that, based on the bias–variance analysis, the ANN model effectively minimizes the gap toward the maximum possible accuracy of 100%. However, the CNN model performs well in reducing the disparity between training and testing accuracies, which is a crucial indicator of its ability to handle unseen datasets compared to the ANN model. Thus far, the CNN model has achieved remarkable performance while avoiding overfitting and with few learnable parameters, which makes it an extremely lightweight model compared to the ANN model. Excellent performance was also observed from the ROC-AUC-generated curves. From Figure 10 and Figure 11, it is evident that both models are effective in reducing FARs. The lightweight CNN model for the binary class achieved an FPR of 0.0089 and an FNR of 0.0037, while the ANN model for the binary class achieved an FPR of 0.0121 and an FNR of 0.0027. This shows the excellent specificity and sensitivity of the proposed models, and this is also an indication that the lightweight CNN model will likely outperform other proposed systems for real-time applications.
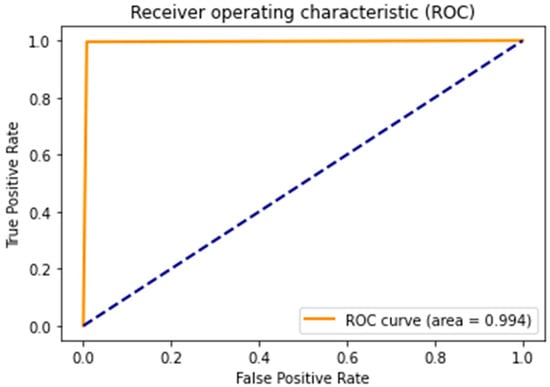
Figure 10.
CSE-CIC-IDS2018: ROC-AUC curve for binary ANN.
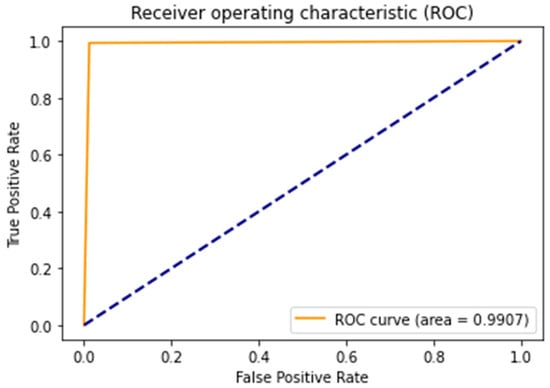
Figure 11.
CSE-CIC-IDS2018: ROC-AUC curve for binary CNN.
To demonstrate the performance and generalization of our proposed approach and models on both legacy and modern network traffic flows, we have generated separate performance curves for the NSLKDD dataset, which represents an older network dataset, and the CSE-CIC-IDS2018 dataset, which is a more up-to-date network dataset. Furthermore, we compared the proposed approach with different existing study articles in terms of overall performance with achieved accuracy (Acc.), detection rate (DR), and FAR whenever included in the study articles.
In addition to binary classification, our system demonstrates exceptional performance in multi-class classification tasks. All the results demonstrated excellent performance both for the NSLKDD and for multi-class classification in the CSE-CIC-IDS2018 datasets. The confusion matrix as shown in Figure 12 illustrates the accurate classification of various attack types (i.e., classes Normal as normal, Hulk: Attack1, GoldenEye: Attack2, Slowloris: Attack3, Slowhttptest: Attack4, LOIC-HTTP: Attack5, LOIC-UDP: Attack6, and HOIC: Attack7 as shown in Table 6) using the CNN lightweight model for multi-class classification. In addition, we have also evaluated our system’s performance by testing it with a mixture of these two datasets, which belong to different network versions and time instances and serve as inputs to our proposed system. Subsequently, our system could effectively classify the mixed normal and attack signals without difficulties, as observed in Figure 13 (loss/accuracy) for binary-class classification (achieving train: 0.9955, test: 0.9937 accuracy). This indicates the versatility and adaptability of our proposed approach to handling diverse network traffic scenarios.
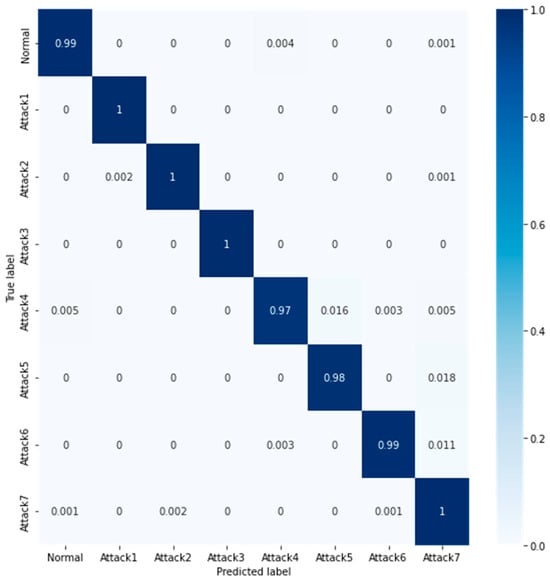
Figure 12.
CSE-CIC-IDS2018: Confusion matrix for the multi-class CNN model.
Table 6.
Class distribution (CSE-CIC-IDS2018).
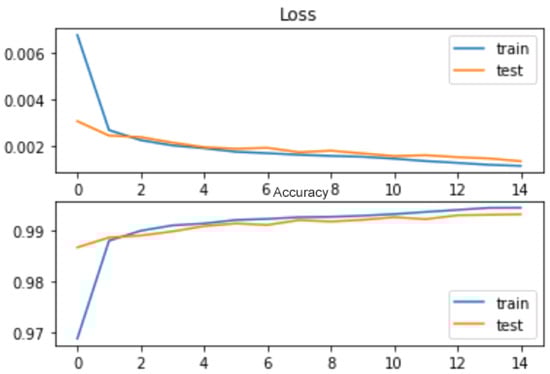
Figure 13.
NSLKDD + CSE-CIC-IDS2018 CNN binary classification loss/accuracy.
To provide further validation of our approach, we conducted a comparative analysis with existing studies in the field. Table 7 and Table 8 present detailed comparisons of our proposed method with other approaches, highlighting the enhancements achieved in terms of accuracy, detection rate, and FAR for both the NSLKDD and CSE-CIC-IDS2018 datasets. Specifically, Table 8 focuses on models and articles related to the NSLKDD dataset, while Table 7 encompasses those related to the CSE-CIC-IDS2018 dataset. Our method, both for the binary and multi-class classification modes, not only outperforms most existing approaches but also enables the utilization of simplified neural models, thus offering a practical and efficient solution for intrusion detection. While several techniques share commonalities in these aspects, our methodology stands out due to its innovative data conversion process. By transforming raw network traffic data into image representations using a meticulous conversion method, we amplify underlying patterns and anomalies, leading to enhanced accuracies across various evaluation metrics. This strategic augmentation not only improves model interpretability but also enables the adoption of simplified neural architectures, paving the way for lightweight intrusion detection systems with robust performance and generalization capabilities; our approach paves the way for more effective and efficient network security solutions.
Table 7.
Comparison table—CSE-CIC-IDS family datasets.
Table 8.
Comparison table—KDD family datasets.
When comparing our work with other studies, we took into account key considerations such as the dataset employed, model complexity, objectives of the specific study, etc., which play crucial roles in ensuring the integrity and fairness of the comparison. Our work is grounded in a novel dataset conversion technique aimed at enhancing accuracy and reducing false negative rates, employing a lightweight, simple CNN model. In contrast, as in the related works, other studies in the field utilize various complex models, often addressing accuracy enhancement, the possibilities of applying ML and AI-based models, scalability and efficiency, dataset imbalance, etc.
In our study, the primary objective was to enhance detection accuracy and lower false alarm rates specifically for DoS and DDoS attacks, addressing a critical subset of cybersecurity threats prevalent in network environments, and for this, primarily, we employed the CSE-CIC-IDS2018 dataset. This targeted objective reflects our focus on optimizing detection mechanisms tailored to these specific attack vectors. In contrast, the objectives of other studies in the domain may vary, encompassing a broader spectrum of cyber threats or emphasizing different performance metrics and optimization criteria.
Central to our comparative analysis is the evaluation of detection accuracy attained in our work vis-à-vis other studies in the field. While our study takes a focused approach to improving accuracy and minimizing false alarm rates for DoS and DDoS attacks, we recognize that the objectives and methodologies of other studies may differ. Despite these variations, our comparative assessment seeks to elucidate the effectiveness and relative performance of different approaches in achieving detection accuracy, thereby providing valuable insights into the state-of-the-art in cyber threat detection.
In addition to the primary objectives and methodologies, several key considerations should be raised when comparing our work with others in the field of cybersecurity classification models. Firstly, the scope of evaluation plays a crucial role in determining the applicability and generalizability of the proposed detection mechanisms. While our study focuses specifically on DoS and DDoS attacks, other studies shown in Table 7 and Table 8 may encompass a wider range of cyber threats, leading to differences in dataset composition, model architectures, and evaluation metrics. Furthermore, the interpretability of classification models is an essential factor to consider when assessing their real-world utility and practicality. Our lightweight, simple convolutional neural network (CNN) model prioritizes interpretability and transparency, offering insights into the decision-making process and facilitating easier integration into existing security infrastructures.
5. Conclusions
From our study, we have uncovered the potential of signal analysis techniques, including short-time Fourier transform (STFT) and other analytical tools, when applied to image generation and pattern augmentation. Leveraging these methods, we successfully transformed the CSE-CIC-IDS2018 and NSLKDD datasets into corresponding image representations, thereby enhancing the efficacy of designing anomaly-based intrusion detection systems. Our innovative approach, rooted in converting datasets into image formats, facilitated the development of a very lightweight intrusion detection model. Remarkably, this model not only boasts a reduced false alarm rate (FAR) but also exhibits outstanding system performance, characterized by high accuracy and remarkable sensitivity and specificity measures. Moreover, it mitigates the risk of overfitting, a common challenge encountered in DL methodologies.
The accuracy curves presented in our study serve as more than just visualizations of the model’s performance; they offer valuable insights into its efficiency, particularly in terms of time utilization. Upon analyzing these curves, it becomes evident how rapidly our model achieves high accuracy levels within a few training epochs. This swift convergence underscores the model’s time efficiency, indicating its capabilities for swiftly learning and adapting to underlying data patterns. Such efficiency is especially critical in time-sensitive applications or environments where computational resources are constrained. Thus, the accuracy curves not only showcase the model’s accuracy but also underscore its remarkable efficiency in achieving high performance levels within a brief timeframe, establishing it as a crucial metric for evaluating both accuracy and time efficiency.
In our future endeavors, we aim to expand upon our current findings by exploring diverse network datasets and refining our intrusion detection models further. One of our primary objectives is to shrink the size of the converted images without compromising their quality, specifically aiming to reduce the dimensions of the grayscale images from 129 × 129 pixels. Additionally, we intend to evaluate various ML and DL algorithms and architectures to ascertain optimal performance with our prepared dataset. Furthermore, motivated by the promising outcomes of our study, we envision extending this methodology to other application domains, such as modulation identification systems. By leveraging the insights observed from our research, we can chart new paths toward enhancing performance and broadening the applicability of our approach.
Author Contributions
Conceptualization, Y.E.T.; Methodology, Y.E.T.; Data curation, Y.E.T.; Writing—review & editing, Y.-J.C.; Supervision, Y.-J.C. All authors have read and agreed to the published version of the manuscript.
Funding
This work was supported by the National Research Foundation of Korea (NRF) grant funded by the Korea government (MSIT) (No. 2023R1A2C1003783) and supported by Institute of Information & communications Technology Planning & Evaluation (IITP) under the Artificial Intelligence Convergence Innovation Human Resources Development (IITP-2024-RS-2023-00255968) grant funded by the Korea government (MSIT).
Data Availability Statement
CSE-CIC-IDS. (2018). Datasets Research from the Canadian Institute for Cybersecurity, UNB, 2018. [Online]. Available: https://www.unb.ca/cic/datasets/ids-2018.html (accessed on 5 March 2023). NSLKDD Dataset. Available online: https://www.unb.ca/cic/datasets/nsl.html (accessed on 5 March 2023).
Conflicts of Interest
The authors declare no conflicts of interest.
References
- cybersecurity-statistics @ www.fortinet.com. Available online: https://www.fortinet.com/resources/cyberglossary/cybersecurity-statistics (accessed on 6 July 2022).
- Munroe, C.; IDC MarketScape. IDC MarketScape: Worldwide Service Providers 2018 Vendor Assessment; Orange Business: Paris, France, 2018. [Google Scholar]
- Cisco, C. 5 Steps to Protecting Your Organization from a DDoS Attack. 2022. Available online: https://www.cisco.com/c/en/us/products/collateral/security/ddos-5steps-protect-organization-so.html (accessed on 20 July 2022).
- Available online: www.cfr.org/blog/tracking-cyber-operations-and-actors-russia-ukraine-war (accessed on 5 April 2022).
- index @ www.cloudflare.com. Available online: https://www.cloudflare.com/ (accessed on 6 July 2022).
- Fernandes, G.; Rodrigues, J.J.P.C.; Carvalho, L.F.; Al-Muhtadi, J.F.; Proença, M.L. A comprehensive survey on network anomaly detection. Telecommun. Syst. 2019, 70, 447–489. [Google Scholar] [CrossRef]
- Protic, D.; Stankovic, M. A hybrid model for anomaly-based intrusion detection in complex computer networks. In Proceedings of the 2020 21st International Arab Conference on Information Technology (ACIT), Giza, Egypt, 28–30 November 2020; Volume 2020, pp. 2160–2167. [Google Scholar] [CrossRef]
- Ferrag, M.A.; Maglaras, L.; Moschoyiannis, S.; Janicke, H. Deep learning for cyber security intrusion detection: Approaches, datasets, and comparative study. J. Inf. Secur. Appl. 2020, 50, 102419. [Google Scholar] [CrossRef]
- Tsimenidis, S.; Lagkas, T.; Rantos, K. Deep Learning in IoT Intrusion Detection; Springer: New York, NY, USA, 2022; Volume 30. [Google Scholar] [CrossRef]
- Basnet, R.B.; Shash, R.; Johnson, C.; Walgren, L.; Doleck, T. Towards detecting and classifying network intrusion traffic using deep learning frameworks. J. Internet Serv. Inf. Secur. 2019, 9, 1–17. [Google Scholar] [CrossRef]
- Ahmad, Z.; Shahid Khan, A.; Nisar, K.; Haider, I.; Hassan, R.; Haque, M.R.; Tarmizi, S.; Rodrigues, J.J. Anomaly detection using deep neural network for iot architecture. Appl. Sci. 2021, 11, 7050. [Google Scholar] [CrossRef]
- Idrissi, I.; Boukabous, M.; Azizi, M.; Moussaoui, O.; El Fadili, H. Toward a deep learning-based intrusion detection system for iot against botnet attacks. IAES Int. J. Artif. Intell. 2021, 10, 110–120. [Google Scholar] [CrossRef]
- Ge, M.; Syed, N.F.; Fu, X.; Baig, Z.; Robles-Kelly, A. Towards a deep learning-driven intrusion detection approach for Internet of Things. Comput. Netw. 2021, 186, 107784. [Google Scholar] [CrossRef]
- Yao, R.; Wang, N.; Liu, Z.; Chen, P.; Sheng, X. Intrusion detection system in the advanced metering infrastructure: A cross-layer feature-fusion CNN-LSTM-based approach. Sensors 2021, 21, 626. [Google Scholar] [CrossRef]
- Imrana, Y.; Xiang, Y.; Ali, L.; Abdul-Rauf, Z. A bidirectional LSTM deep learning approach for intrusion detection. Expert Syst. Appl. 2021, 185, 115524. [Google Scholar] [CrossRef]
- Zhang, Y.; Li, P.; Wang, X. Intrusion Detection for IoT Based on Improved Genetic Algorithm and Deep Belief Network. IEEE Access 2019, 7, 31711–31722. [Google Scholar] [CrossRef]
- Mezina, A.; Burget, R.; Travieso-Gonzalez, C.M. Network Anomaly Detection With Temporal Convolutional Network and U-Net Model. IEEE Access 2021, 9, 143608–143622. [Google Scholar] [CrossRef]
- Kim, J.; Kim, J.; Kim, H.; Shim, M.; Choi, E. CNN-based network intrusion detection against denial-of-service attacks. Electronics 2020, 9, 916. [Google Scholar] [CrossRef]
- Pham, V.; Seo, E.; Chung, T.M. Lightweight convolutional neural network based intrusion detection system. J. Commun. 2020, 15, 808–817. [Google Scholar] [CrossRef]
- Hwang, R.H.; Peng, M.C.; Huang, C.W.; Lin, P.C.; Nguyen, V.L. An Unsupervised Deep Learning Model for Early Network Traffic Anomaly Detection. IEEE Access 2020, 8, 30387–30399. [Google Scholar] [CrossRef]
- Khan, A.S.; Ahmad, Z.; Abdullah, J.; Ahmad, F. A Spectrogram Image-Based Network Anomaly Detection System Using Deep Convolutional Neural Network. IEEE Access 2021, 9, 87079–87093. [Google Scholar] [CrossRef]
- A Realistic Cyber Defense Dataset (CSE-CIC-IDS2018). Available online: https://registry.opendata.aws/cse-cic-ids2018/ (accessed on 26 February 2024).
- Ahmad, Z.; Khan, A.S.; Shiang, C.W.; Abdullah, J.; Ahmad, F. Network intrusion detection system: A systematic study of machine learning and deep learning approaches. Trans. Emerg. Telecommun. Technol. 2021, 32, e4150. [Google Scholar] [CrossRef]
- Novaes, M.P.; Carvalho, L.F.; Lloret, J.; Proença, M.L. Adversarial Deep Learning Approach Detection and Defense against DDoS Attacks in SDN Environments. Futur. Gener. Comput. Syst. 2021, 125, 156–167. [Google Scholar] [CrossRef]
- Al Olaimat, M.; Lee, D.; Kim, Y.; Kim, J.; Kim, J. A Learning-based Data Augmentation for Network Anomaly Detection. In Proceedings of the 2020 29th International Conference on Computer Communications and Networks (ICCCN), Honolulu, HI, USA, 3–6 August 2020; pp. 1–10. [Google Scholar] [CrossRef]
- Huang, S.; Lei, K. IGAN-IDS: An imbalanced generative adversarial network towards intrusion detection system in ad-hoc networks. Ad Hoc Netw. 2020, 105, 102177. [Google Scholar] [CrossRef]
- Andresini, G.; Appice, A.; Di Mauro, N.; Loglisci, C.; Malerba, D. Multi-Channel Deep Feature Learning for Intrusion Detection. IEEE Access 2020, 8, 53346–53359. [Google Scholar] [CrossRef]
- Roopak, M.; Tian, G.-Y.; Chambers, J.A. Deep Learning Models for Cyber Security in IoT Networks. In Proceedings of the 2019 IEEE 9th Annual Computing and Communication Workshop and Conference (CCWC), Las Vegas, NV, USA, 7–9 January 2019; pp. 452–457. [Google Scholar]
- Atefinia, R.; Ahmadi, M. Network intrusion detection using multi-architectural modular deep neural network. J. Supercomput. 2021, 77, 3571–3593. [Google Scholar] [CrossRef]
- Catillo, M.; Rak, M.; Villano, U. 2L-ZED-IDS: A Two-Level Anomaly Detector for Multiple Attack Classes BT-Web. Artif. Intell. Netw. Appl. 2020, 1150, 687–696. [Google Scholar]
- Lin, P.; Ye, K.; Xu, C. Dynamic Network Anomaly Detection System by Using Deep Learning Techniques; Springer: Cham, Switzerland, 2019. [Google Scholar]
- Dlamini, G.; Fahim, M. DGM: A data generative model to improve minority class presence in anomaly detection domain. Neural Comput. Appl. 2021, 33, 13635–13646. [Google Scholar] [CrossRef]
- Ullah, I.; Mahmoud, Q.H. A Framework for Anomaly Detection in IoT Networks Using Conditional Generative Adversarial Networks. IEEE Access 2021, 9, 165907–165931. [Google Scholar] [CrossRef]
- Shone, N.; Ng, T.N.; Phai, V.D.; Shi, Q. A Deep Learning Approach to Network Intrusion Detection. IEEE Trans. Emerg. Top. Comput. Intell. 2018, 2, 41–50. [Google Scholar] [CrossRef]
- Ludwig, S.A. Intrusion Detection of Multiple Attack Classes using a Deep Neural Net Ensemble. In Proceedings of the 2017 IEEE Symposium Series on Computational Intelligence (SSCI), Honolulu, HI, USA, 27 November–1 December 2017. [Google Scholar]
- Yin, C.; Zhu, Y.; Fei, J.; He, X.-Z. A Deep Learning Approach for Intrusion Detection Using Recurrent Neural Networks. IEEE Access 2017, 5, 21954–21961. [Google Scholar] [CrossRef]
- Diro, A.A.; Chilamkurti, N.K. Distributed attack detection scheme using deep learning approach for Internet of Things. Futur. Gener. Comput. Syst. 2017, 82, 761–768. [Google Scholar] [CrossRef]
- Tang, T.A.; Mhamdi, L.; McLernon, D.C.; Zaidi, S.A.R.; Ghogho, M. Deep Recurrent Neural Network for Intrusion Detection in SDN-based Networks. In Proceedings of the 2018 4th IEEE Conference on Network Softwarization and Workshops (NetSoft), Montreal, QC, Canada, 25–29 June 2018; pp. 202–206. [Google Scholar]
Disclaimer/Publisher’s Note: The statements, opinions and data contained in all publications are solely those of the individual author(s) and contributor(s) and not of MDPI and/or the editor(s). MDPI and/or the editor(s) disclaim responsibility for any injury to people or property resulting from any ideas, methods, instructions or products referred to in the content. |
© 2024 by the authors. Licensee MDPI, Basel, Switzerland. This article is an open access article distributed under the terms and conditions of the Creative Commons Attribution (CC BY) license (https://creativecommons.org/licenses/by/4.0/).