Abstract
Bird identification is the first step in collecting data on bird diversity and abundance, which also helps research on bird distribution and population measurements. Most research has built end-to-end training models for bird detection task via CNNs or attentive models, but many perform unsatisfactorily in fine-grained bird recognition. Bird recognition tasks are highly influenced by factors, including the similar appearance of different subcategories, diverse bird postures, and other interference factors such as tree branches and leaves from the background. To tackle this challenge, we propose the Progressive Cross-Union Network (PC-Net) to capture more subtle parts with low-level attention maps. Based on cross-layer information exchange and pairwise learning, the proposed method uses two modules to improve feature representation and localization. First, it utilizes low- and high-level information for cross-layer feature fusion, which enables the network to extract more comprehensive and discriminative features. Second, the network incorporates deep semantic localization to identify and enhance the most relevant regions in the images. In addition, the network is designed with a semantic guidance loss to improve its generalization for variable bird poses. The PC-Net was evaluated on an extensively used birds dataset (CUB-200-2011), which contains 200 birds subcategories. The results demonstrate that the PC-Net achieved an impressive recognition accuracy of 89.2%, thereby outperforming maintained methods in bird subcategory identification. We also achieved competitive results on two other datasets with data on cars and airplanes. The results indicated that the PC-Net improves the accuracy of diverse bird recognition, as well as other fine-grained recognition scenarios.
1. Introduction
Birds, as an important part of the ecosystem, can be used as indicators to monitor the health and sustainability of green space ecosystems [1]. The identification and classification of birds contribute to a deeper understanding of their habits and ecological characteristics, which can help to study and conserve birds in greater depth. Accurate bird detection is particularly important in various applications [2], including ecological studies, bird category identification, field surveys, and tracking seasonal migration and habitat changes. For instance, in ecological studies, it is essential to monitor bird populations accurately to assess the impact of environmental changes on their habitats. Similarly, bird category identification requires precise detection to differentiate between similar subcategories and to understand their unique characteristics.
Identifying birds accurately has always been a challenging task, particularly in differentiating between birds of different families and genera within the same ornithological order. This is due to the large number and variety of birds, as well as their great differences in morphology, color, and size. These differences exist not only between different classes, but also within the same classes, thus making bird differentiation more difficult. As computer vision (CV) technology and deep learning algorithms evolve, bird recognition can be accomplished on machines that do not have a priori knowledge of ornithology. With the capability of feature learning, convolutional neural networks (CNNs) have sparked great progress in various computer vison tasks, including bird detection and classification. For instance, Wei et al. [3] introduced a Mask-CNN model that generates object/part masks based on part annotations to select useful feature descriptions. Zhang et al. [4] proposed a region-based model with detectors to select the parts with high feature responsiveness for training. However, these methods can only accomplish bird target detection and coarse category recognition. In bird image classification, there is often a high degree of feature crossover, where different subcategories may share the same features, and the same subcategories may vary greatly in appearance and posture. As shown in Figure 1, the target detection method cannot accurately distinguish the subcategories of birds, and it cannot achieve the requirements of the ecological scenarios to accurately count the distribution of birds. Therefore, fine-grained visual classification (FGVC) has now become a research hotspot.
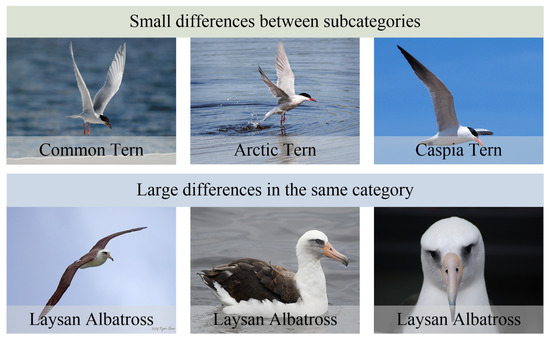
Figure 1.
Examples of small differences between different subcategories of birds and large differences in the same subcategories of birds.
Currently, most of the mainstream fine-grained research methods rely on supervised learning with manually annotated labeled information [5,6,7]. Manual annotation of an image is challenging for researchers due to the specialized knowledge required for labeling and the high cost of time. Moreover, labeled data may suffer from data bias problems, thus leading to models that cannot be generalized to new data or that perform poorly when trained on new data. Weakly supervised learning requires only image-level labeled data compared to strongly supervised learning, thus addressing the issue of data scarcity. By introducing weakly supervised signals, the model can better handle situations where there is crossover between categories, adapt to the features of different categories, and improve the generalization and processing capabilities. This approach enables models to learn from more diverse data and better capture the subtle differences between bird subcategories. Therefore, weakly supervised learning has become an increasingly popular approach in bird image classification. It offers a promising solution to the challenges posed by strongly supervised learning methods and bears the potential to significantly enhance the prediction precision of bird classification.
Recent research [8] has shown that low levels of information have higher sensitivity in fine-grained image categorization tasks. Given that birds are characterized by high similarity across subcategories and high variation within the same subcategory, we believe that low-level attention maps work better for capturing the more subtle parts that reflect differences between classes. Therefore, incorporating low-level attention maps in the feature extraction process could improve the efficiency of bird recognition. Building on this idea, this paper proposes a Progressive Cross-Union Network(PC-Net) that utilizes the spatial and semantic distinctions between different stages of the backbone to effectively integrate cross-layer features. Compared to other pairwise learning methods, PC-Net extracts highly responsive feature regions from images with the same label but different contents, thereby leading the network to learn meaningful parts. The main contributions of this work are as follows:
- (1)
- We present the Cross-Layer Fusion Module (CLFM) to interact with features from different stages to enrich semantic features.
- (2)
- We also propose the Deep Semantic Localization Module (DSLM) to strengthen highly responsive feature regions and to weaken the influence of the background.
- (3)
- We introduce a Semantic Guidance Loss (SGloss) to react to the spatial gap between different categories and to enhance the generalization of models.
During expriments, we evaluated the performance of the PC-Net on a dataset of 11,788 images with 200 bird subcategories, wherein we achieved a recognition accuracy of 89.2%, which outperformed most mainstream models.
The structure of the paper is as follows: In Section 2, we provide an overview of the related work. Section 3 outlines the methodology employed in this study. Section 4 covers the datasets and experimental details. In Section 5, we discuss the experiment results, including comparisons with existing models and an ablation study. Finally, we make a conlusion in Section 6.
2. Related Works
Many scholars studying weakly supervised learning have argued that the key to improving classification accuracy lies in the extraction of discriminative features. As a result, Zheng et al. [9] proposed a multiattention network that synergistically combines region localization and region-based feature learning. Zheng et al. [10] argued that most localization methods have limitations in that the number of localizations is specified. Thus, a trilinear attention sampler was proposed to improve this problem. Fu et al. [11] proposed a revolving network to learn informative features at multiple scales, which are optimized through two scale losses. Unlike other methods that address discriminative region localization separately and independently, it uses the correlation between the region detection and the fine-grained feature learning to make the two mutually reinforcing. All of these methods learn local features through a localization network, which often requires a multi-stage feature extraction network. However, this approach destroys the correlation between the local and the whole, thereby resulting in poor robustness. Despite the successes of these methods, there are still challenges in fine-grained bird recognition, such as high levels of feature crossover.
Other researchers have proposed higher-order feature encoding methods, among which the Bilinear Convolutional Network (B-CNN) proposed by Lin et al. [12] has been widely used. The B-CNN extracts fine-grained features by encoding highly parameterized feature representations; the feature representations after higher-order encoding have richer semantic information, thus improving the behavior of the model. This has led to the development of a series of higher-order feature coding methods aimed at improving the bilinear confluence process or streamlining the bilinear confluence, thus providing new ideas for FGVC. Li et al. [13] proposed a Semantic Bilinear Pooling CNN (SBP-CNN), which learns the correlation between neighboring levels and expands the distance between different samples through a generalized cross-entropy loss. Shu et al. [14] devised a method to enhance the accuracy of the B-CNN model while simultaneously reducing the parameter dimensions. Unlike the B-CNN, Shu et al. used a symmetric network model where both steams use the same CNN, thereby resulting in a decrease in the number of parameters.
In addition to the methods discussed above, many researchers have proposed a paired learning approach [15,16]. Zhuang et al. [17] proposed to learn contrast cues from image pairs to identify semantic differences between different classes. The cross-entropy loss (CELoss) [18] forces the network to mine features with higher confidence in the samples, which leads to a poorer generalization of the network. Dubey et al. [19] proposed the intentional introduction of obfuscation in the activations to solve the overfitting problem in fine-grained image classification. Their approach aimed to calculate the spatial distance between different category labels to encourage the network to learn other auxiliary cues. However, this method did not account for changes in the spatial location of the image and introduced additional disturbances to the model, which affected its classification accuracy. Further research is needed to develop more effective paired learning methods that can better capture the intricate differences between bird subcategories and improve the performance of the FGVC. Finally, we summarize the above work in Table 1.

Table 1.
Summary of recent research works. We summarize them in three categories.
3. Methods
3.1. Network Architecture
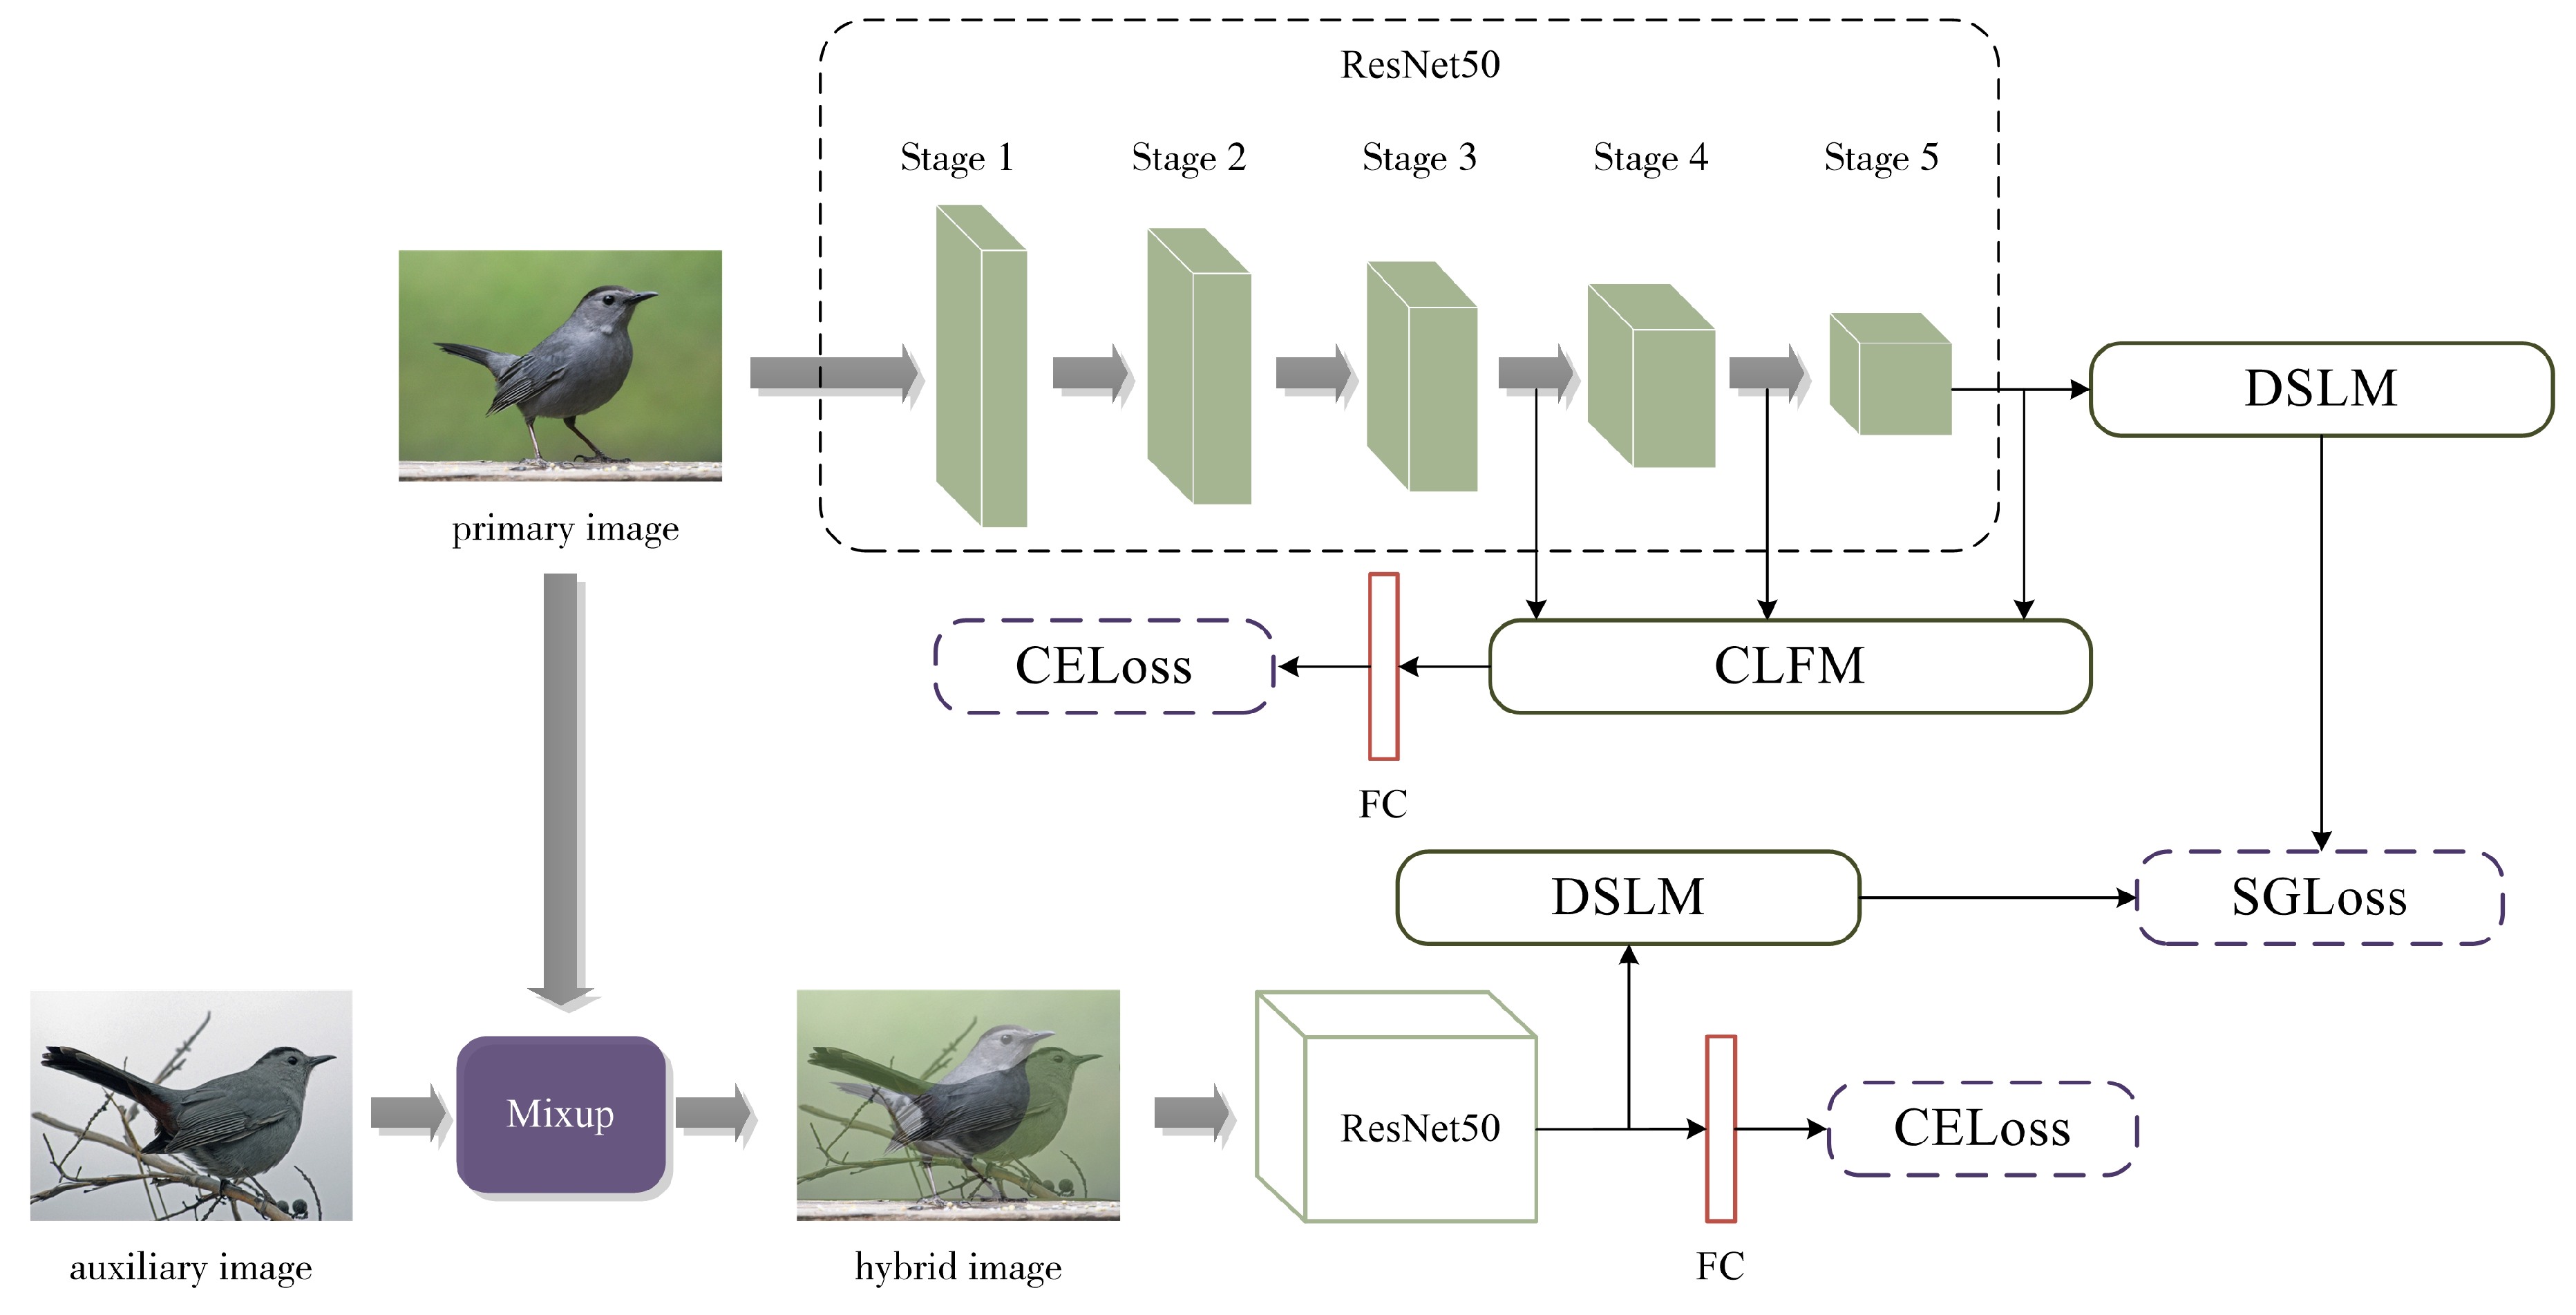
The overall network architecture of the PC-Net is illustrated in Figure 2, where ResNet50 [20] is used as the feature extractor, and the two inputs share the network parameters. The details of the design are as follows: (1) Image preprocessing uses the mixup data enhancement method [21] for data crossover to prevent overfitting. (2) The Cross-Layer Fusion Module (CLFM) obtains an overall feature representation containing both low- and high-level semantic information for classification. (3) The Deep Semantic Localization Module (DSLM) enhances the feature representation of discriminative regions, while irrelevant features are suppressed. (4) Semantic Guidance Loss (SGloss) and CELoss optimization training are performed. ResNet50 consists of multiple convolutional layers and residual connections, which contain 5 stages. The initial stage of ResNet50 exhibits a relatively straightforward structure, thus serving as a preprocessing step for the input image. The latter 4 stages have a more similar structure that consists of different numbers of residual blocks, including 3, 4, 6, and 3 residual blocks in that order. In this study, ResNet50 has been used as a backbone network for extracting features at different levels.
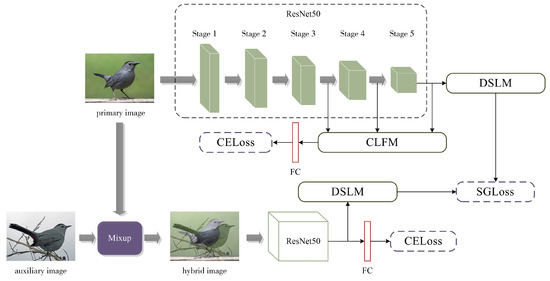
Figure 2.
Architecture diagram of Progressive Cross-Union Network. CLFM is used on stages 3, 4, and 5 for cross-layer fusion. DSLM operates in the fifth stage for deep semantic localization.
To better learn the feature relationships between different images, pairs of input two images belonging to the same category are used, where the auxiliary and primary images utilize the mixup data enhancement method in order to perform data crossover and prevent overfitting. Mixup is a method based on data augmentation that mixes two different samples to create a new sample. The two samples of PC-Net belong to the same label, which is also the label of this new sample. In this way, the diversity of data can be increased, thus improving the stability and generalization capabilities. According to the principle proposed in the literature [21], the beta distribution of the hyperparameters is first calculated as the mixing coefficients :
where refers to the beta distribution, and the hyperparameters and take the value of 1. From this, the mixing formula for mixup is obtained as follows:
where refers to the main image input by the method, refers to the auxiliary image input by the method, and refers to the mixed sample image. Due to the large differences between different samples of the same subcategories, applying this hybrid enhancement method can reduce the variability and provides more informative pairwise learning features.
3.2. Cross-Layer Fusion Module (CLFM)
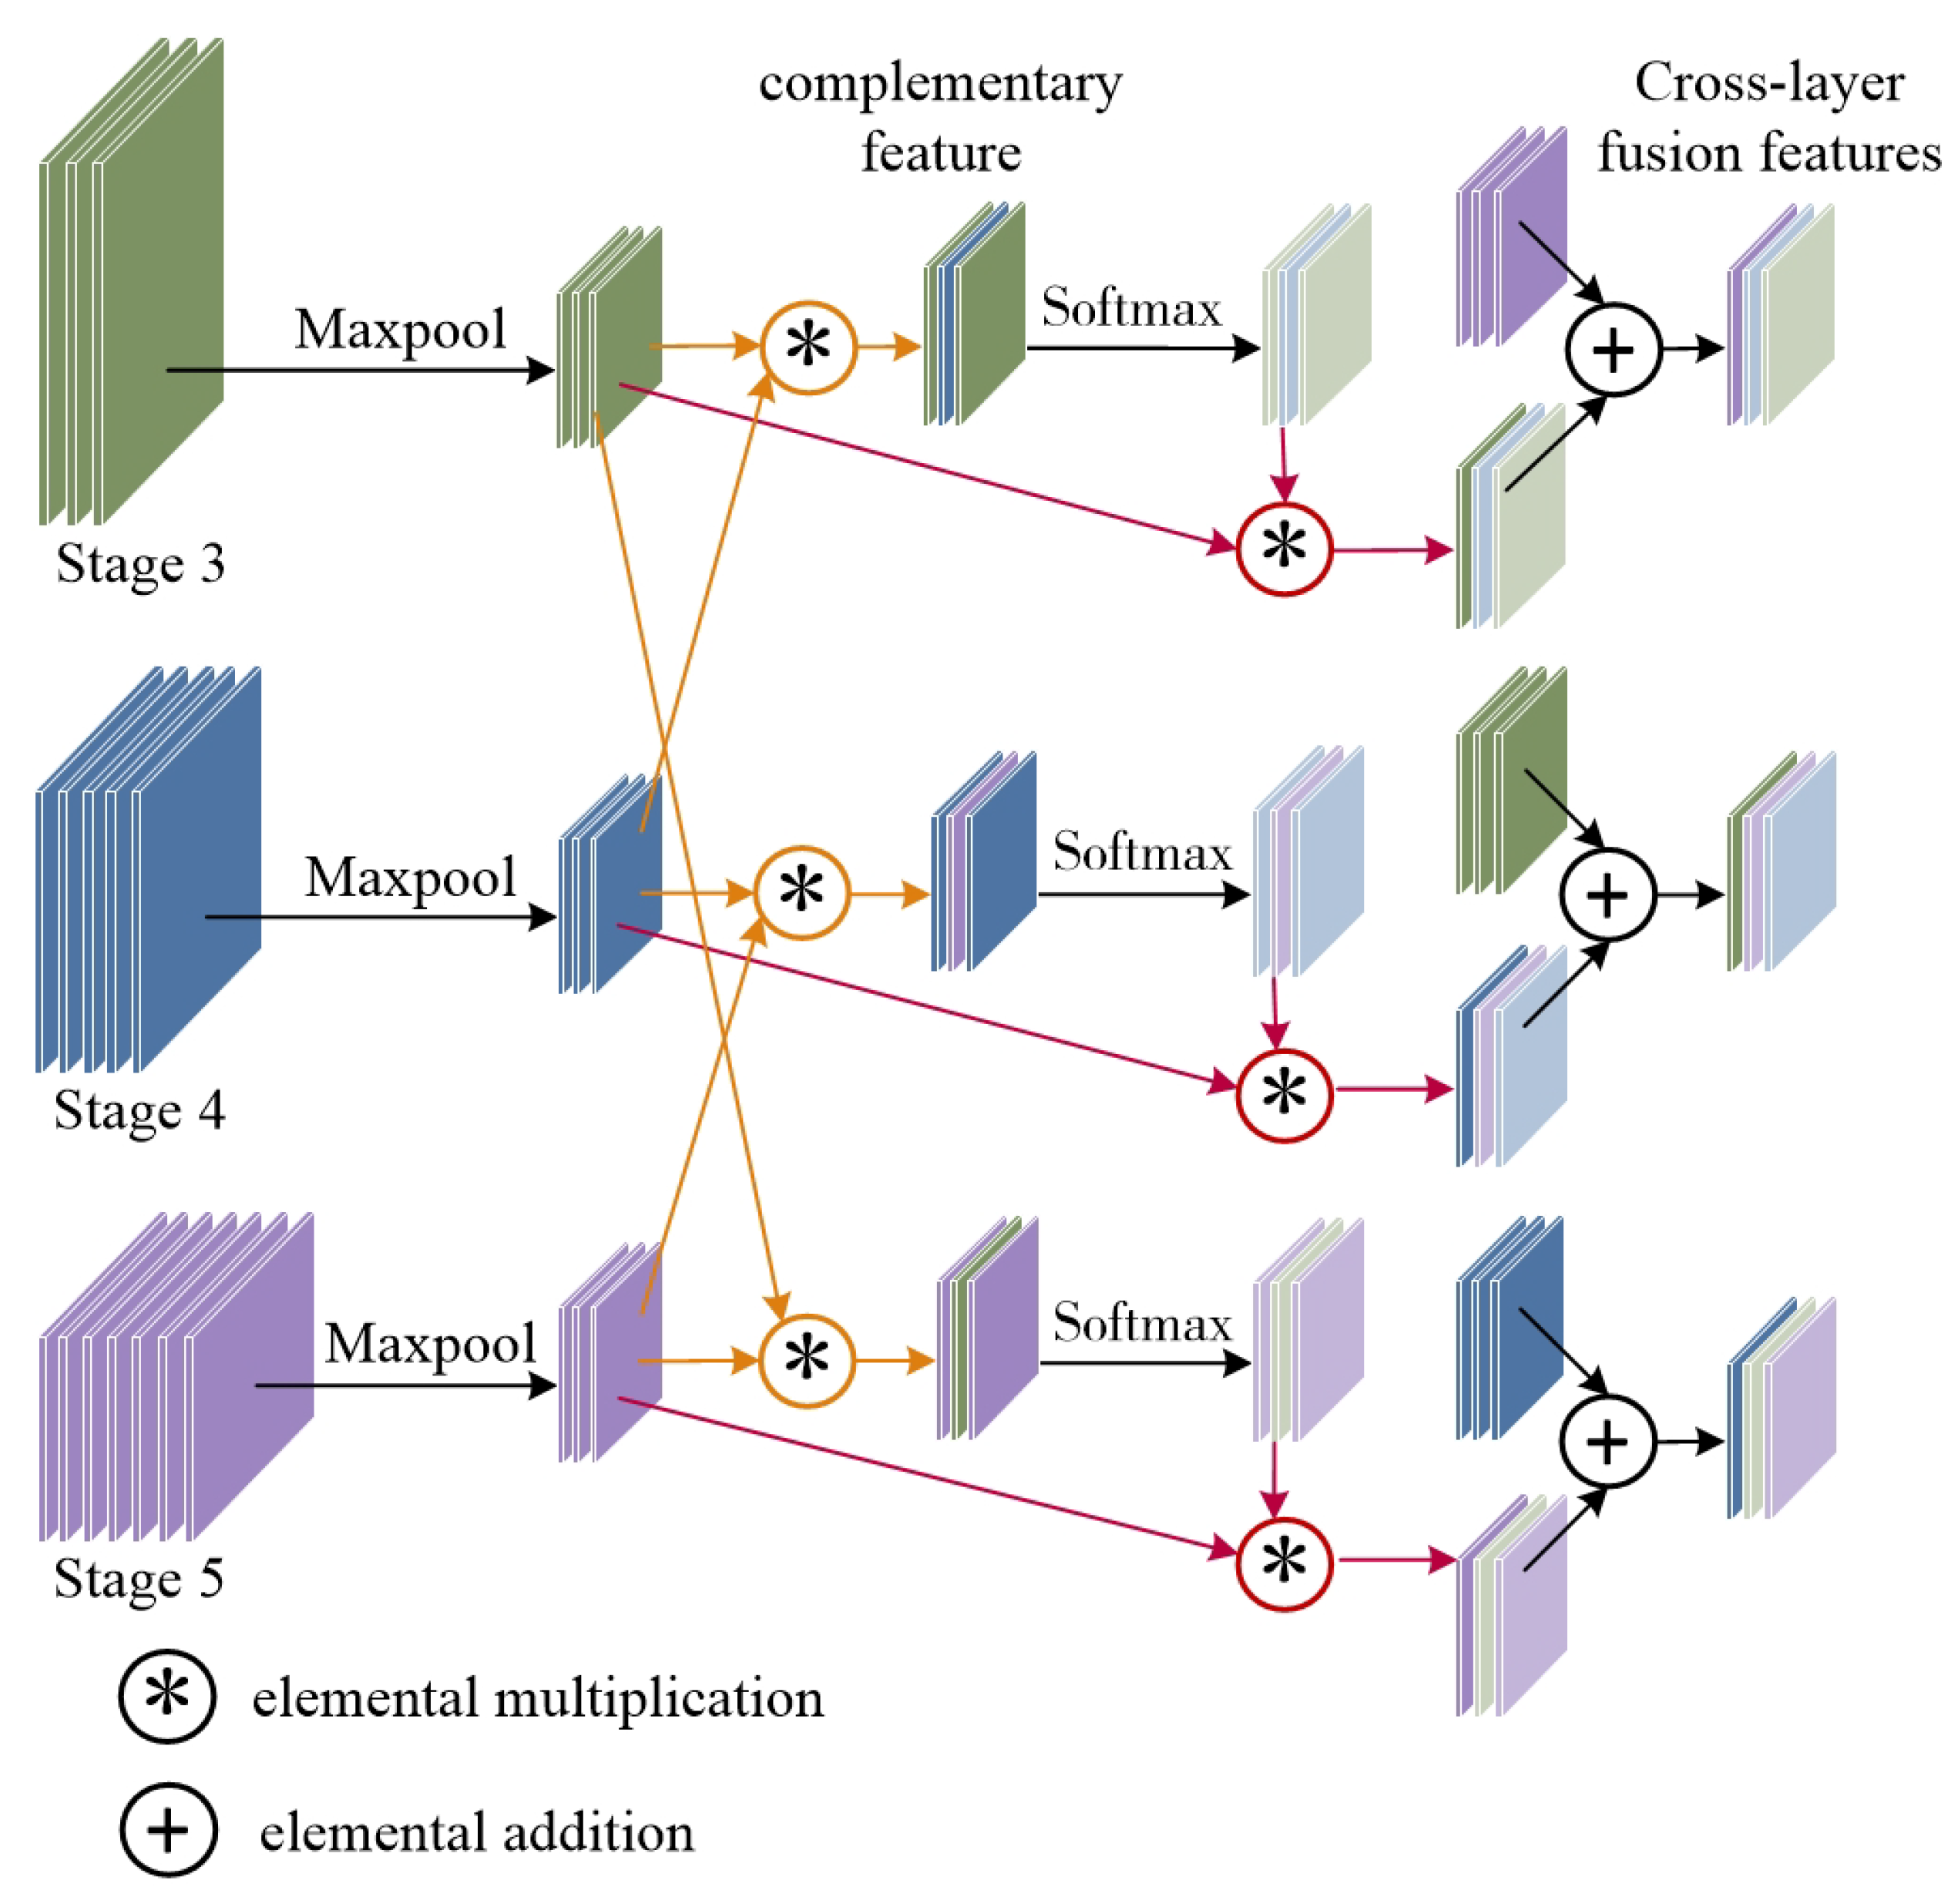
PC-Net uses cross-layer fusion to aggregate semantic information at different stages. Each layer learns other feature representations to close the information gap at different stages. Figure 3 illustrates the proposed Cross-Layer Fusion Module (CLFM), which combines the features of the 3rd, 4th, and 5th stages from the backbone network.

Figure 3.
An illustration of the CLFM.
Concretely, we have two different features from the pretrained backbone. We use global max pooling for to extract important information to prepare for cross fusion.
Next, we perform feature interactions on the two max pooling features in the channel dimension to obtain the complementary feature by elementwise multiplication:
where ⊗ denotes the elemental multiplication operation. The complementary features of are normalized by softmax to compute the feature weights for each part. The normalization principle equation is defined as follows:
The weight feature M contains complementary information about the features . Mapping it to the feature map X obtains a complementary feature of Y with respect to Y:
The above is the realization of two different stages of feature integration. We aim to achieve feature convergence across multiple phases. Further, for the feature maps of the 3rd, 4th, and 5th stages from ResNet50, they are taken to the two-by-two interaction described above.
where • denotes the fusion process introduced previously, denotes the complementary features of feature F with respect to feature T, denotes the complementary features of feature T with respect to feature P, and denotes the complementary features of feature P with respect to feature F. By this point, three features have been fused two-by-two. By cross-summing, the cross-layer fusion features for each stage with respect to the other two parts are finally obtained.
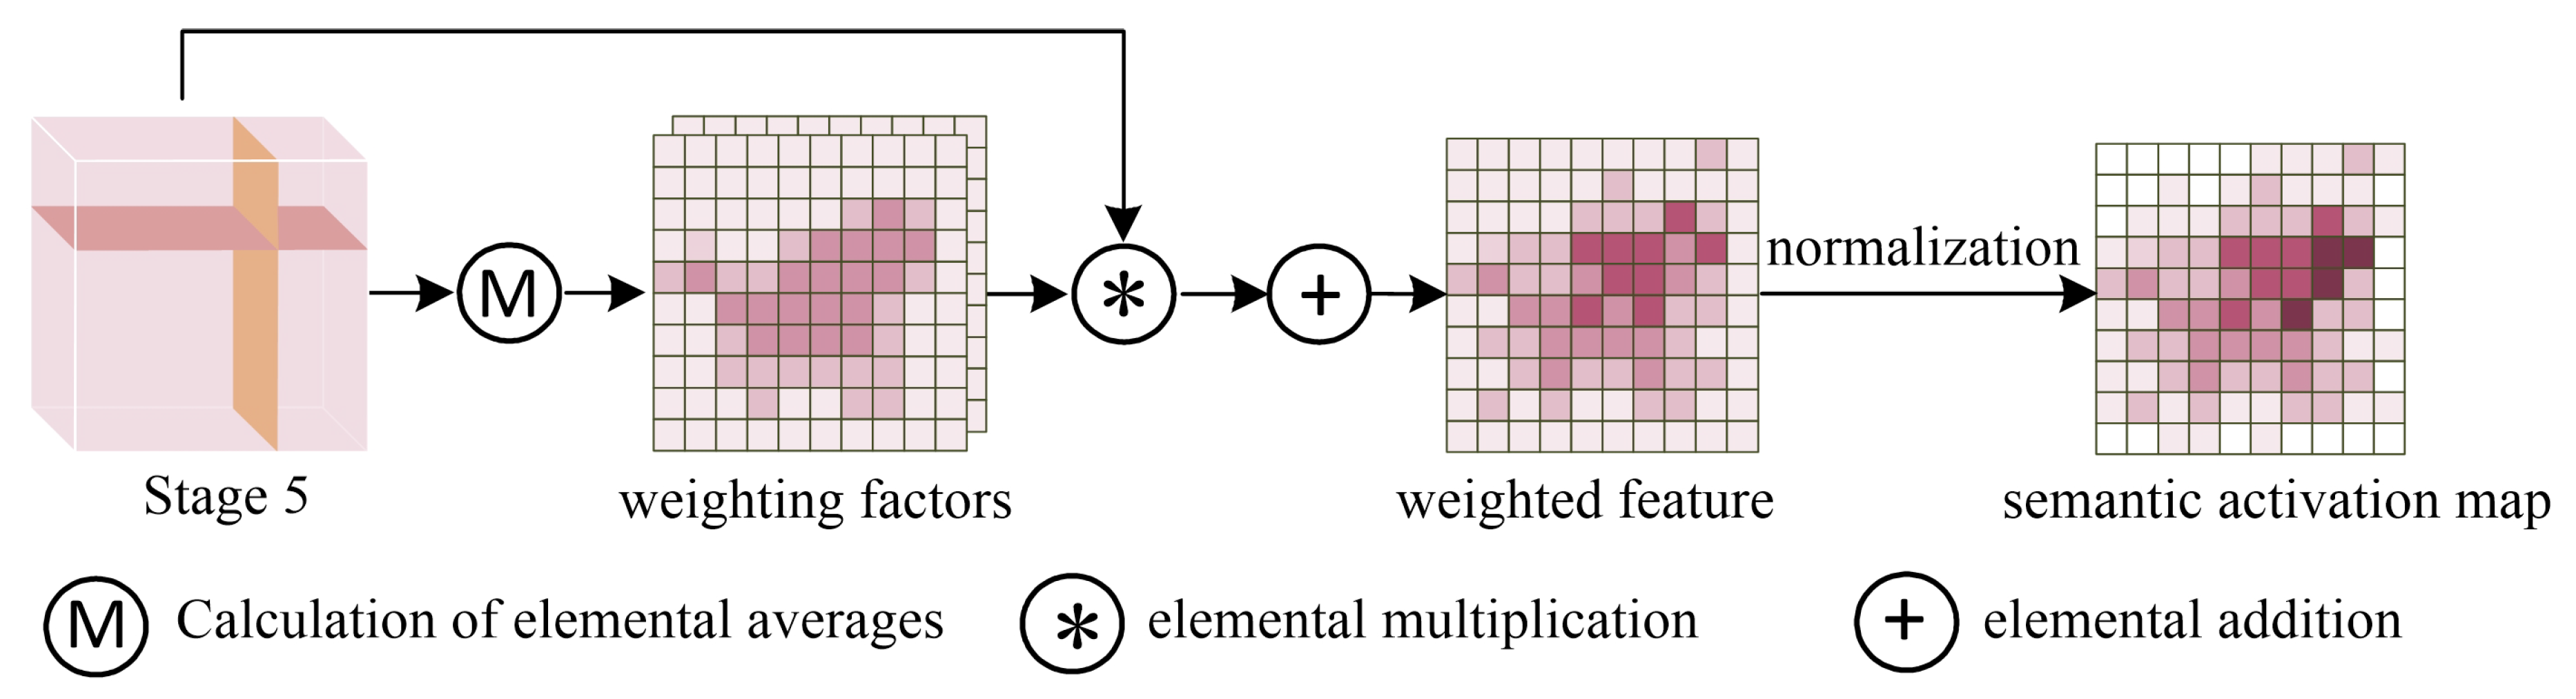
3.3. Deep Semantic Localization Module (DSLM)
Since the network focuses more and more on higher response regions as it deepens, this usually refers to the discriminative part of the foreground. The PC-Net proposes the Deep Semantic Localization Module (DSLM) that generates an independent activation graph to respond to these regions, thus paving the way for optimal pairwise learning, as shown in Figure 4.
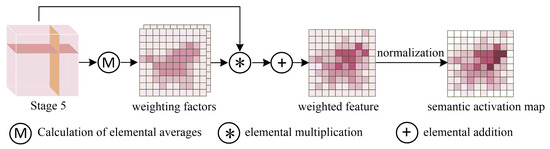
Figure 4.
An illustration of the DSLM.
The module takes feature as the input, where C, W, and H denote the number of channels, width, and height, respectively. We first compute the mean values on the H and W of the feature maps as the weighting factor:
where denotes the mean in height dimensions and denotes mean in width dimensions. The weighting factor g is applied elementwise to multiply the feature map K, thus resulting in the weighted feature with respect to K:
To obtain the semantically active part, the weighted feature is summed by a channel dimension:
Then, we remove the negative values in the tensor to obtain the foreground portion:
Finally, the semantic activation map E is obtained as follows:
3.4. Optimized Loss Function
A Semantic Guided Loss (SGLoss) was designed to better learn the spatial information between pairs of input images. For the semantic activation maps obtained from the DSLM, SGLoss calculates the spatial distance between its different images to ensure feature diversity.
Specifically, the input of SGLoss is the semantic activation map obtained from the DSLM. The semantic activation map a is first preprocessed to compute the mean and variance by rows, respectively.
where denotes the standard deviation over the height dimensions. Next, we use the mean and variance for data augmentation:
To avoid interference from background noise, the data in D are normalized:
Regarding the loss of spatial distance between the two graphs , the final SGLoss is computed as follows:
where N denotes the batch size.
In addition, the PC-Net uses CELoss to measure the prediction error. During training, the classification loss is calculated for each layer after the cross-fusion across layers:
where M is the number of object categories, y is the true labeled value of the input image, and is the vector of the predicted scores at stage i with respect to category c.
The final overall loss is defined as follows:
where is a hyperparameter used to balance the CELoss and SGLoss.
4. Experiment
4.1. Datasets
The proposed model was evaluated using the CUB-200-2011 [22], which is a popular benchmark for fine-grained image classification tasks. The CUB-200-2011 contains 11,788 images from 200 different bird categories. Compared to other fine-grained datasets(e.g., airplanes, cars), the poses of the birds are more variable.
To validate the generalization of the model, this study also experimented on the Stanford Cars dataset [23] and the Fine-Grained Version Visual Classification of Aircraft (FGVC-Aircraft) dataset [24]. Stanford Cars is a dataset of car images collected by Stanford University mainly for differentiating car type image classifications. The FGVC-Aircraft is derived from the Kaggle website dataset, which contains 10,000 images of 100 different aircraft model variants. Table 2 summarizes the detailed statistics for each dataset.
Table 2.
Details of experiment datasets used in this article.
4.2. Experiment Details
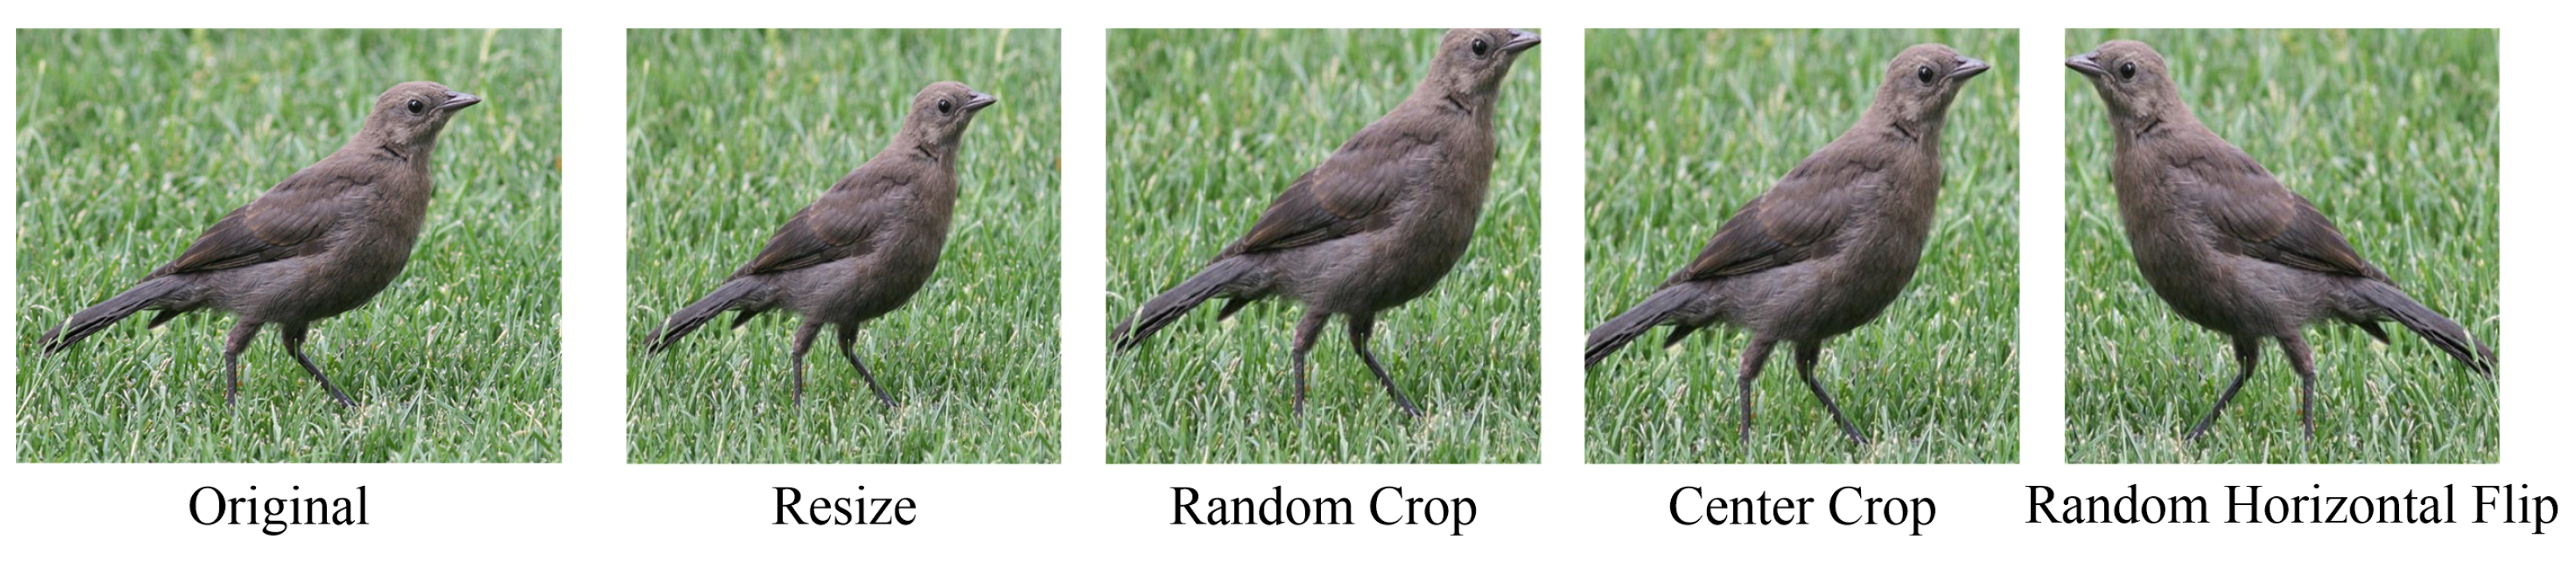
In the work, We used a pretrained ResNet50 with the ImageNet [25] as the baseline. Stochastic gradient descent(SGD) [26] was used as the optimizer, where the momentum was 0.9, the weight decay was 5 × 10⁻⁴, and the initial learning rate was 0.002. The epoch size was 200. The batch size was 16. The training process was optimized by a cosine annealing scheduler [27]. During training, random horizontal flipping was applied for data augmentation. The input was resized to 550 × 550 and then randomly cropped to 448 × 448. In the testing phase, a center crop was used, as is illustrated in Figure 5.
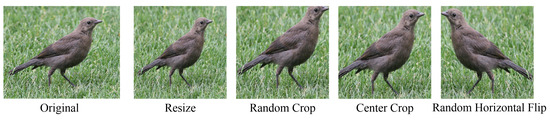
Figure 5.
Example of data enhancement.
All experiments were conducted within the Ubuntu 20.04.4 environment with NVIDIA GTX 3090 GPUs with 24 G of memory size. The deep learning framework used was PyTorch [28] version 1.12.1 with Cuda 11.6 for training.
5. Results and Discussions
5.1. Evaluation Indexes
The experiment used the accuracy as a classification evaluation metric, i.e., the probability of a correct prediction in all samples. The FGVC is a single label classification problem, where each image has a unique correct category. The accuracy is determined as follows:
where is true positive, which denotes the number of positive samples categorized as positive; is false negative, which denotes the number of samples labeled as positive samples that are categorized as negative; is false positive, which denotes the number of samples labeled as negative samples that are categorized as positive; and is true negative, which denotes the number of samples labeled as negative samples that are categorized as negative.
5.2. Results on the CUB-200-2011
Table 3 presents the results of the different methods on the CUB-200-2011 dataset, and the PC-Net achieved an optimal score of 89.2%.
Table 3.
The accuracy comparison of different algorithms on CUB-200-2011.
The RA-CNN, MA-CNN, and TASN are methods based on subnetwork localization, and they yielded accuracy values of 85.3%, 86.5%, and 87.9% respectively. The PC-Net obtained 1.3% higher results than the TASN, which shows that features can be mined more deeply by cross-layer fusion compared to the regional localization method.
The PCA-Net, Corss-X, API-Net, and PC-DenseNet are pairwise learning methods. The accuracy of the first three were 88.3%, 87.7%, and 87.7% on Resnet50, respectively, and 88.9% and 88.6% on Resnet101, respectively. Among them, the Corss-X was not tested on Resnet101. The PC-DenseNet achieved the best result of 86.8% on the DenseNet161 backbone, so Table 2 does not cite the results of this method on other backbone networks. The results of all such methods were slightly higher than those based on subnetwork localization. The localization methods only focused on the cropped region, which affected the recognition accuracy once the localization was deviated and the selected region was not accurate enough. The API-Net asserts to capture the comparison cues between two images, while the PCA-Net aims to learn the semantic similarity between images of the same category. This paper split the pairwise inputs into primary and auxiliary pictures, which were used to encourage the network to learn other semantically active parts. The PC-Net improved by 1.5% and 0.9% over the PCA-Net and API-Net, respectively, under the same backbone, and it outperformed them by 0.6% and 0.3%, respectively, on the results of the Resnet101, which is a deeper network.
Specifically, Table 4 shows the results of other metric evaluations. Figure 6 shows the training process of the PC-Net on the CUB-200-2011 dataset. The loss curve stabilized in the region around 100 rounds. Our curve changed significantly in the early rounds and then became slower. The high resolution of our dataset primarily contributed to this observation. Fine-grained models typically have more features and higher feature dimensions. These additional features provide more information and allow the model to capture subtle differences in the data more accurately. In addition, we used pairwise learning networks for training and individual networks for testing. There was a gap in the losses between the two.
Table 4.
FLOPs, params, and inference time for PC-Net.
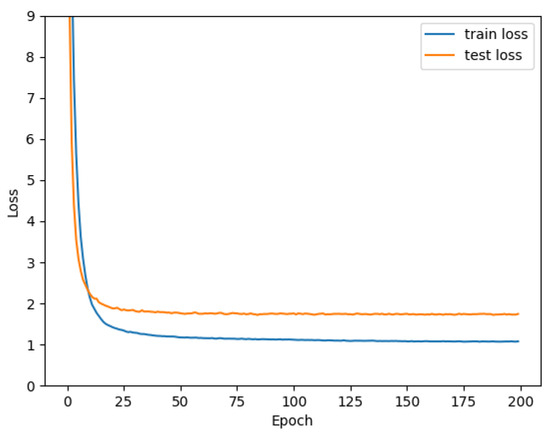
Figure 6.
Loss curves of PC-Net in CUB-200-2011.
5.3. Results on the Stanford Cars and FGVC-Aircraft
Although the PC-Net is not optimized on the Stanford Cars and FGVC-Aircraft datasets, which are commonly used for FGVC, it attained commendable outcomes, as are shown in Table 5. The accuracy of this method on the Stanford Cars reached 94.6% and 93.0% on the FGVC-Aircraft, which shows that the network has some capabilities in the recognition of other objects as well.
Table 5.
The accuracy comparison of different algorithms on Stanford Cars and FGVC-Aircraft.
API-Net’s Resnet101-based network achieved 94.9% and 93.4% accuracy on the datasets of Stanford Cars and FGVC-Aircraft, respectively, which is slightly higher than our method’s results in this study. However, the PCA-Net proposed in this study is based on the Resnet50, which is only 0.2% lower on the Stanford Cars data when compared to the API-Net’s Resnet50-based network. The overall results from the three datasets and using different depths of the backbone network show that the PCA-Net has better applicability.
5.4. Ablation Study
5.4.1. Effects of DSLM and CLFM
The PC-Net uses the ResNet50 model as its basis and adds the DSLM and CLFM to its structure. This study designed a series of ablation experiments based on this. The recognition accuracy curve is shown in Figure 7, which provides further evidence of the effectiveness of the PC-Net. Based on the picture the results present, the accuracy was improved with different additions of the DSLM and CLFM.
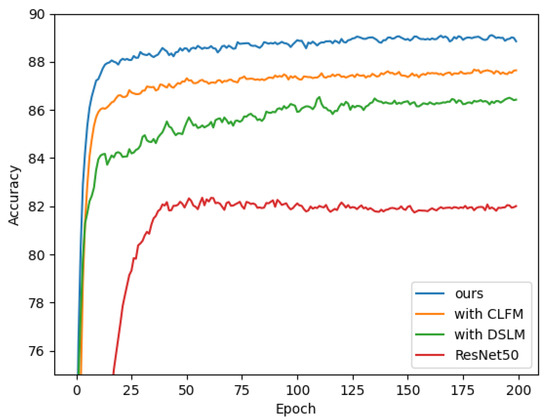
Figure 7.
Results of module ablation tests.
Table 6 shows the specific results of the ablated trials. Using the recognition accuracy on the ResNet50 as a reference, the model achieved a classification accuracy of only 82.5%. Adding the DSLM to the ResNet50 resulted in an accuracy of 86.4%, thus improving by 3.9% compared to the ResNet50 alone. This module is designed to augment the model’s proficiency in precisely discerning intricate details within an image. The PC-Net also employs the CLFM, which is a module that fuses different levels of information to improve model accuracy. An accuracy of 87.8% was obtained in the experiment where the CLFM was added to the ResNet50, thus improving it by 5.3%. Finally, with the addition of both the deep semantic localization module and the cross-layer cross-fertilization module, namely, the PC-Net proposed in this study, the model accuracy was 89.2%. This represents a substantial improvement of 6.7% over the ResNet50 alone, thus comparing 2.8% and 1.4%, respectively, for the addition of a single model. This shows that the proposed two modules have a significant effect on improving the model accuracy. Moreover, the use of these two modules is scalable and can be tried and optimized in different model architectures.
Table 6.
Results of module ablation tests. (“Y” and “N” respectively indicate whether the component is used or not).
Overall, the results of the ablation test prove the effectiveness of adding the DSLM and CLFM.
5.4.2. Effects of Mixup
To validate the efficacy of the mixup data enhancement operation, this study performed an additional ablation test. Since the mixup approach acts on pairwise inputs, our ablation experiments were based on the environment in the second row of Table 6. Figure 8 shows the accuracy change curve with or without mixup data enhancement. Initially, the model needed to learn more features, so the model without mixup had a higher accuracy. However, as the model iteration went deeper, the model using mixup gradually overtook it, thus demonstrating the stronger generalization ability of the mixup-enhanced model.
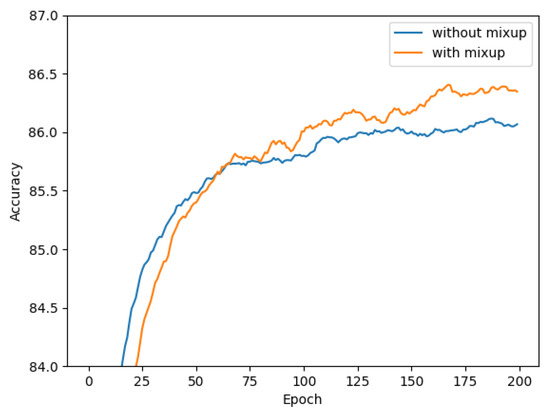
Figure 8.
Results of mixup ablation test.
The specific experimental results are presented in Table 7, indicating that the utilization of mixup can enhance the effect of the PC-Net. Without mixup, the accuracy of the model was 86.1%. After using the mixup data enhancement, the accuracy increased to 86.4%. This shows that mixup data enhancement works in the PC-Net.
Table 7.
Results of mixup ablation tests.
5.4.3. Effects of Loss
We investigated various strategies for loss function optimization. The previous study [29] demonstrated the efficacy of the CELoss in FGVC. The PC-Net introduced SGLoss to train a dual-input architecture for pairwise learning. The results in Table 8 directly indicate that the network incorporating SGLoss achieved superior performance.
Table 8.
Results of SGLoss ablation tests.
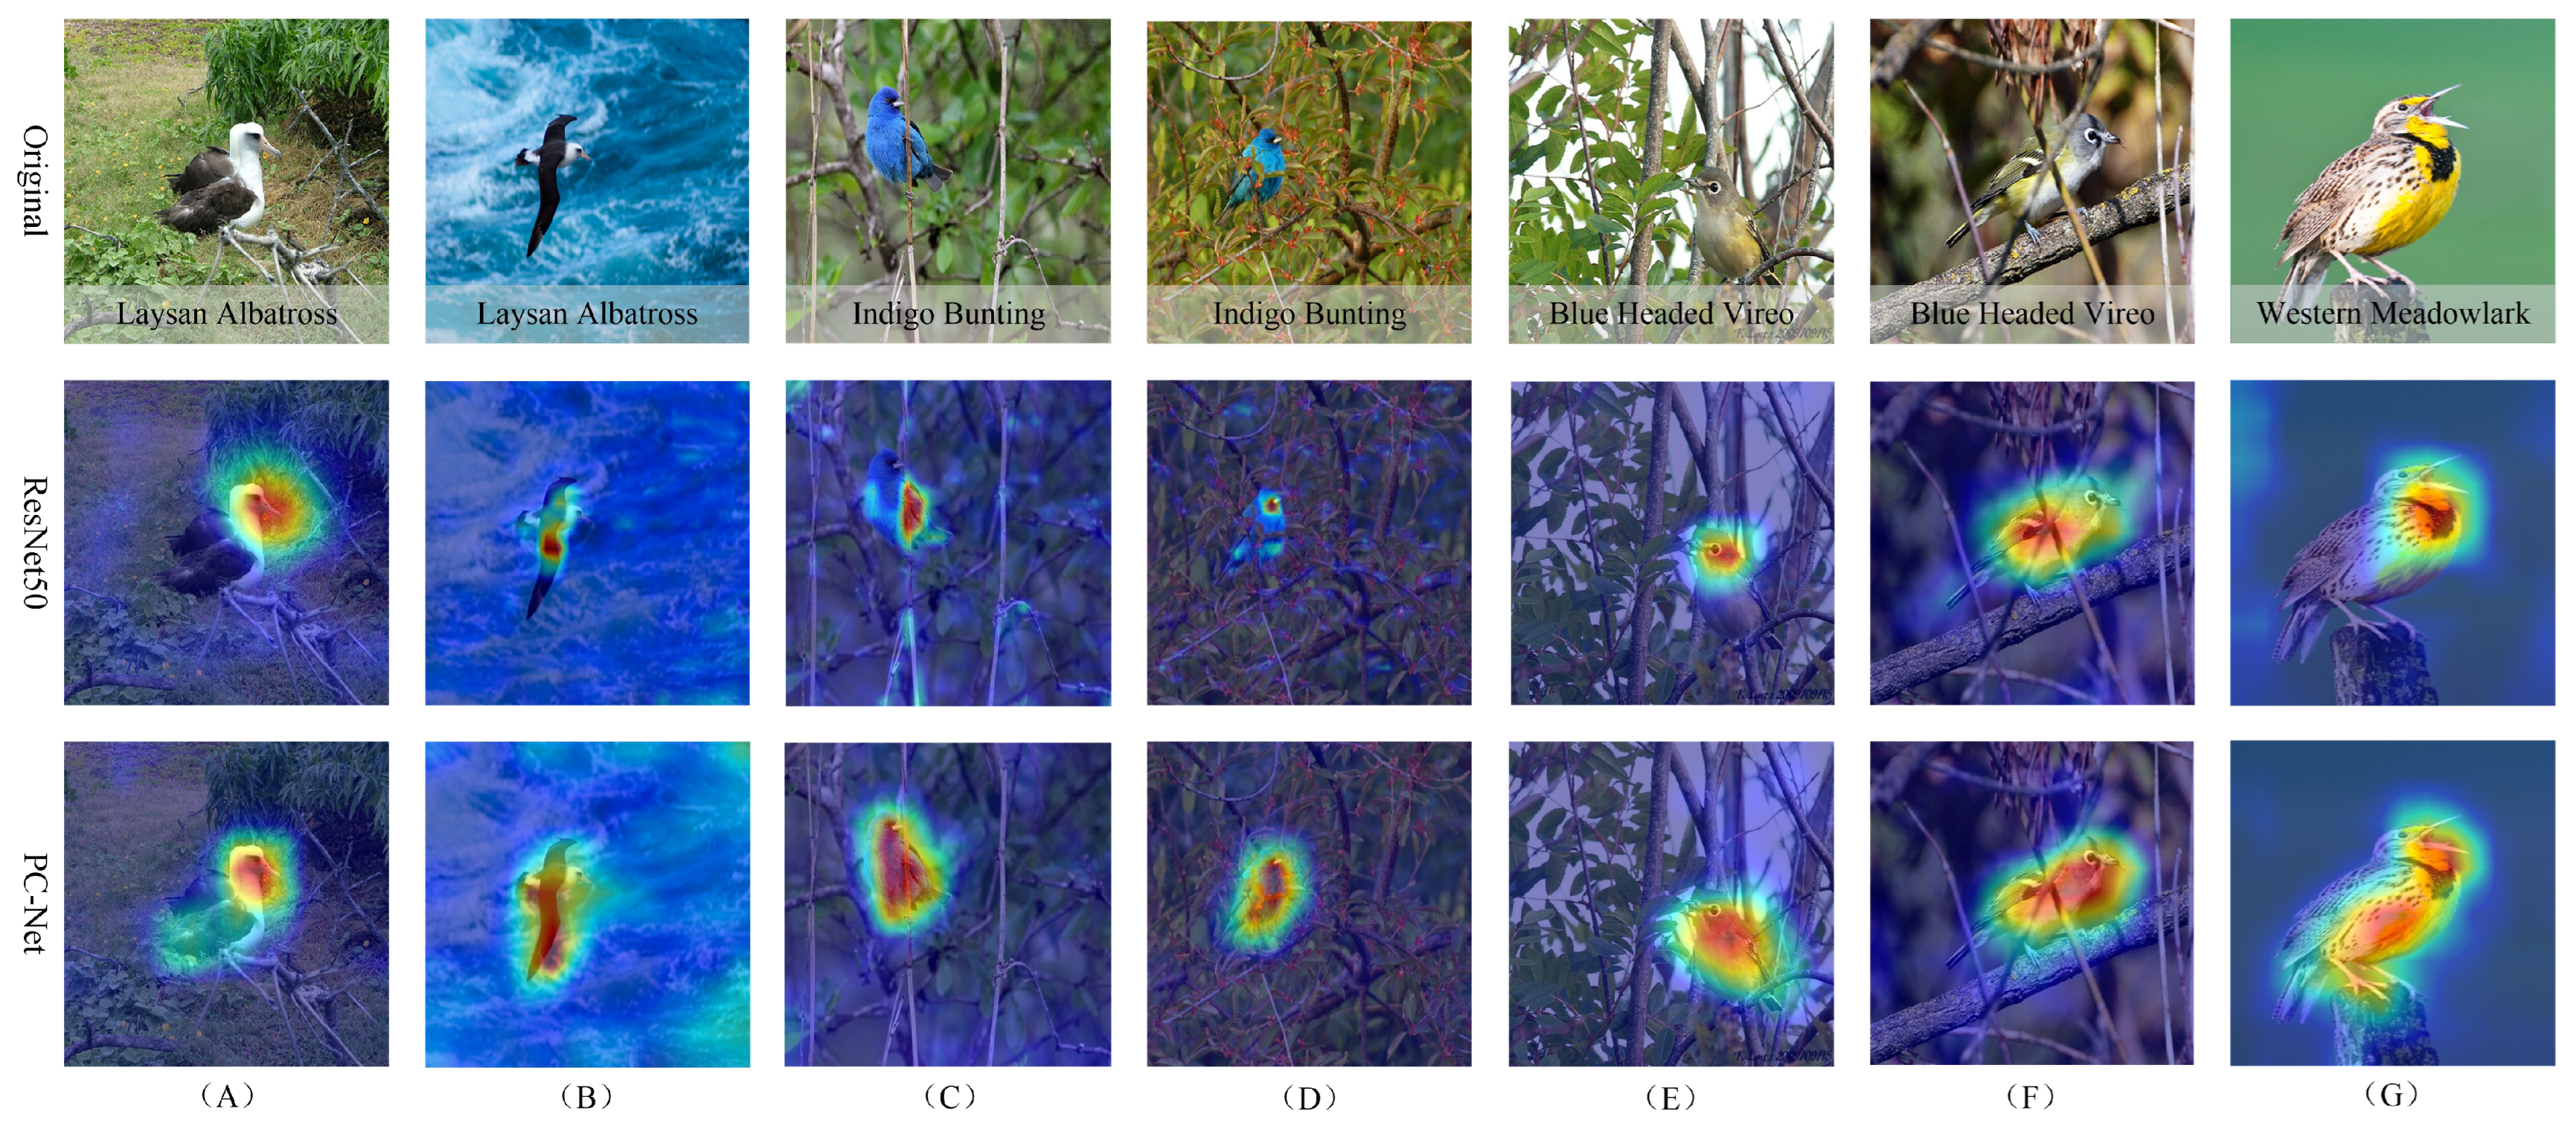
5.5. Visualization
To further assess the efficacy of the proposed PC-Net, images from the CUB-200-2011 dataset were visualized using Grad-CAM [30]. Grad-CAM is a weighted summation method based on a feature map that shows the importance of each region for its classification. The visualization results were compared with the baseline (ResNet50) as shown in Figure 9. By observing the results, we can see that the baseline could only learn a single region of the image, such as the beak. In contrast, the PC-Net could learn a richer set of distinguishing features. The Laysan albatross in (A,B) had two unposed states. The model captured the subject in both cases. Indigo buntings in (C,D) usually survive at the edge of scrubby forests. The baseline could not accurately capture image features against the complex background in the figure, but the PC-Net still performed well. The blue-headed vireo in (F) suffers from significant resin occlusion. The baseline’s attention was focused on the occlusion, while the PC-Net focused on the bird itself. (G) demonstrates that the PC-Net not only focused on salient features, but also encouraged the network to spread its attention to different regions and learn the subsalient parts. This resulted in a more comprehensive feature learning of the model and more accurate prediction results.

Figure 9.
Visualization of baseline and PC-Net activation maps on CUB-200-2011. (A,B) are cases of the same species with different postures. (C–F) are cases where the background is complex and the target is occluded. (G) is the case where there is no interference. In these cases, the PC-Net showed a strong adaptation.
6. Conclusions
In this paper, we introduced the PC-Net that can recognize bird categories at a more specialized level. The network comprises a cross-layer fusion module, a deep semantic localization module, and a semantic guidance loss. The cross-layer fusion module enables each layer to diversify its feature representation, and the fused features can ultimately express richer semantic information. The deep semantic localization module encourages the capture of features in high-frequency response regions while mitigating the influence of background noise and interfering factors. The semantic guidance loss considers the relationships between different pictures and supervises the alignment of features within the deep semantic localization module, thus forcing the network to learn other meaningful regions. Notably, the proposed method does not require bounding boxes or widget annotations, and only image-level labeling is needed. The proposed method showed significant improvement on the fine-grained bird dataset and achieved competitive results on two other common datasets, which included cars and airplanes. Various experiments were designed aiming to justify the feasibility of the proposed module. Currently, there is still a problem with respect to the small amount of data and the large number of species in bird studies, which leads to unbalanced datasets. Future directions of work will try to add the prior method to the model so that the model learns prior knowledge as if it were a human expert, as well as to improve the interpretability of the model.
Author Contributions
Conceptualization, J.L., Y.J. (Yao Jin) and S.Y.; methodology, L.H., Y.J. (Yao Jin), Y.J. (Yuan Ji) and S.Y.; validation, Y.J. (Yao Jin) and Y.J. (Yuan Ji); formal analysis, Y.J. (Yuan Ji), L.H. and S.Y.; investigation, L.H. and S.Y.; resources, J.L.; data curation, J.L.; writing—original draft preparation, J.L., Y.J. (Yao Jin) and L.H.; writing—review and editing, J.L. and S.Y.; visualization, Y.J. (Yao Jin); supervision, J.L. and S.Y.; project administration, J.L.; funding acquisition, L.H., J.L. and S.Y. All authors have read and agreed to the published version of the manuscript.
Funding
This research was funded by the Guizhou Power Grid Co., Ltd. (No. 066700KK52180021) and the National Natural Science Foundation of China (No. 61972357).
Data Availability Statement
The data are available upon request from the authors. Our code is available at https://github.com/syyang2022/PC-NET (accessed on 8 September 2023).
Acknowledgments
We thank Xinqi Yang and Weiyao Pan for their help during the research.
Conflicts of Interest
The authors declare no conflict of interest.
Abbreviations
| CUB-200-2011 | Caltech-UCSD Birds-200-2011 dataset |
| PC-Net | Progressive Cross-Union Network |
| CV | Computer Vision |
| CNN | Convolutional Neural Network |
| Part R-CNN | Region-Based Convolutional Neural Network |
| MA-CNN | Multi-Attention Convolutional Neural Network |
| TASN | Trilinear Attention Sampling Network |
| RA-CNN | Recurrent Attention Convolutional Neural Network |
| B-CNN | Bilinear Convolutional Network |
| SBP-CNN | Semantic Bilinear Pooling CNN |
| API-Net | Attentive Pairwise Interaction Network |
| DTD | Describable Textures Dataset |
| CLFM | Cross-Layer Fusion Module |
| DSLM | Deep Semantic Localization Module |
| SGloss | Semantic Guidance Loss |
| CELoss | Cross-Entropy Loss |
| FGVC-Aircraft | Fine-Grained Visual Classification of Aircraft |
| SGD | Stochastic Gradient Descent |
| Croxx-X | Cross-X Learning |
| FGVC | Fine-Grained Visual Classification |
| PC-DenseNet | Pairwise Confusion based on DenseNet |
| PCA-Net | Progressive Co-Attention Network |
| TP | True Positive |
| FN | False Negative |
| FP | False Positive |
| TN | True Negative |
References
- Yang, X.; Tan, X.; Chen, C.; Wang, Y. The influence of urban park characteristics on bird diversity in Nanjing, China. Avian Res. 2020, 11, 45. [Google Scholar] [CrossRef]
- Xie, J.; Zhong, Y.; Zhang, J.; Liu, S.; Ding, C.; Triantafyllopoulos, A. A review of automatic recognition technology for bird vocalizations in the deep learning era. Ecol. Inform. 2022, 73, 101927. [Google Scholar] [CrossRef]
- Wei, X.S.; Xie, C.W.; Wu, J.; Shen, C. Mask-CNN: Localizing parts and selecting descriptors for fine-grained bird species categorization. Pattern Recognit. 2018, 76, 704–714. [Google Scholar] [CrossRef]
- Zhang, N.; Donahue, J.; Girshick, R.; Darrell, T. Part-based R-CNNs for fine-grained category detection. In Proceedings of the Computer Vision–ECCV 2014: 13th European Conference, Zurich, Switzerland, 6–12 September 2014; Springer: Berlin/Heidelberg, Germany, 2014. Part I. Volume 13, pp. 834–849. [Google Scholar]
- Branson, S.; Van Horn, G.; Belongie, S.; Perona, P. Bird species categorization using pose normalized deep convolutional nets. arXiv 2014, arXiv:1406.2952. [Google Scholar]
- Huang, S.; Xu, Z.; Tao, D.; Zhang, Y. Part-stacked CNN for fine-grained visual categorization. In Proceedings of the IEEE Conference on Computer Vision and Pattern Recognition, Las Vegas, NV, USA, 27–30 June 2016; pp. 1173–1182. [Google Scholar]
- Lin, D.; Shen, X.; Lu, C.; Jia, J. Deep lac: Deep localization, alignment and classification for fine-grained recognition. In Proceedings of the IEEE Conference on Computer Vision and Pattern Recognition, Boston, MA, USA, 7–12 June 2015; pp. 1666–1674. [Google Scholar]
- Ding, Y.; Ma, Z.; Wen, S.; Xie, J.; Chang, D.; Si, Z.; Wu, M.; Ling, H. AP-CNN: Weakly supervised attention pyramid convolutional neural network for fine-grained visual classification. IEEE Trans. Image Process. 2021, 30, 2826–2836. [Google Scholar] [CrossRef] [PubMed]
- Zheng, H.; Fu, J.; Mei, T.; Luo, J. Learning multi-attention convolutional neural network for fine-grained image recognition. In Proceedings of the IEEE International Conference on Computer Vision, Venice, Italy, 22–29 October 2017; pp. 5209–5217. [Google Scholar]
- Zheng, H.; Fu, J.; Zha, Z.J.; Luo, J. Looking for the devil in the details: Learning trilinear attention sampling network for fine-grained image recognition. In Proceedings of the IEEE/CVF Conference on Computer Vision and Pattern Recognition, Long Beach, CA, USA, 15–20 June 2019; pp. 5012–5021. [Google Scholar]
- Fu, J.; Zheng, H.; Mei, T. Look closer to see better: Recurrent attention convolutional neural network for fine-grained image recognition. In Proceedings of the IEEE Conference on Computer Vision and Pattern Recognition, Honolulu, HI, USA, 22–25 July 2017; pp. 4438–4446. [Google Scholar]
- Lin, T.Y.; RoyChowdhury, A.; Maji, S. Bilinear CNN models for fine-grained visual recognition. In Proceedings of the IEEE International Conference on Computer Vision, Santiago, Chile, 7–13 December 2015; pp. 1449–1457. [Google Scholar]
- Li, X.; Yang, C.; Chen, S.L.; Zhu, C.; Yin, X.C. Semantic bilinear pooling for fine-grained recognition. In Proceedings of the 2020 25th International Conference on Pattern Recognition (ICPR), Milan, Italy, 10–15 January 2021; IEEE: New York, NY, USA, 2021; pp. 3660–3666. [Google Scholar]
- Kong, S.; Fowlkes, C. Low-rank bilinear pooling for fine-grained classification. In Proceedings of the IEEE Conference on Computer Vision and Pattern Recognition, Honolulu, HI, USA, 21–26 July 2017; pp. 365–374. [Google Scholar]
- Zhang, T.; Chang, D.; Ma, Z.; Guo, J. Progressive co-attention network for fine-grained visual classification. In Proceedings of the 2021 International Conference on Visual Communications and Image Processing (VCIP), Novotel Munich, Germany, 5–8 December 2021; IEEE: New York, NY, USA, 2021; pp. 1–5. [Google Scholar]
- Luo, W.; Yang, X.; Mo, X.; Lu, Y.; Davis, L.S.; Li, J.; Yang, J.; Lim, S.N. Cross-x learning for fine-grained visual categorization. In Proceedings of the IEEE/CVF International Conference on Computer Vision, Seoul, Republic of Korea, 27 October–2 November 2019; pp. 8242–8251. [Google Scholar]
- Zhuang, P.; Wang, Y.; Qiao, Y. Learning attentive pairwise interaction for fine-grained classification. In Proceedings of the AAAI Conference on Artificial Intelligence, New York, NY, USA, 7–12 February 2020; Volume 34, pp. 13130–13137. [Google Scholar]
- Zhang, Z.; Sabuncu, M. Generalized cross entropy loss for training deep neural networks with noisy labels. Adv. Neural Inf. Process. Syst. 2018, 31, 8792–8802. [Google Scholar]
- Dubey, A.; Gupta, O.; Guo, P.; Raskar, R.; Farrell, R.; Naik, N. Pairwise confusion for fine-grained visual classification. In Proceedings of the European Conference on Computer Vision (ECCV), Munich, Germany, 8–14 September 2018; pp. 70–86. [Google Scholar]
- He, K.; Zhang, X.; Ren, S.; Sun, J. Deep residual learning for image recognition. In Proceedings of the IEEE Conference on Computer Vision and Pattern Recognition, Las Vegas, NV, USA, 27–30 June 2016; pp. 770–778. [Google Scholar]
- Zhang, H.; Cisse, M.; Dauphin, Y.N.; Lopez-Paz, D. mixup: Beyond empirical risk minimization. arXiv 2017, arXiv:1710.09412. [Google Scholar]
- Wah, C.; Branson, S.; Welinder, P.; Perona, P.; Belongie, S. The Caltech-UCSD Birds-200-2011 Dataset. 2011. Available online: https://api.semanticscholar.org/CorpusID:16119123 (accessed on 8 September 2023).
- Krause, J.; Stark, M.; Deng, J.; Fei-Fei, L. 3d object representations for fine-grained categorization. In Proceedings of the IEEE International Conference on Computer Vision Workshops, Sydney, Australia, 1–8 December 2013; pp. 554–561. [Google Scholar]
- Maji, S.; Rahtu, E.; Kannala, J.; Blaschko, M.; Vedaldi, A. Fine-grained visual classification of aircraft. arXiv 2013, arXiv:1306.5151. [Google Scholar]
- Deng, J.; Dong, W.; Socher, R.; Li, L.J.; Li, K.; Fei-Fei, L. Imagenet: A large-scale hierarchical image database. In Proceedings of the 2009 IEEE Conference on Computer Vision and pattern Recognition, Miami, FL, USA, 20–25 June 2009; IEEE: New York, NY, USA, 2009; pp. 248–255. [Google Scholar]
- Ruder, S. An overview of gradient descent optimization algorithms. arXiv 2016, arXiv:1609.04747. [Google Scholar]
- Loshchilov, I.; Hutter, F. Sgdr: Stochastic gradient descent with warm restarts. arXiv 2016, arXiv:1608.03983. [Google Scholar]
- Paszke, A.; Gross, S.; Chintala, S.; Chanan, G.; Yang, E.; DeVito, Z.; Lin, Z.; Desmaison, A.; Antiga, L.; Lerer, A. Automatic Differentiation in Pytorch. 2017. Available online: https://openreview.net/forum?id=BJJsrmfCZ (accessed on 8 September 2023).
- Chang, D.; Ding, Y.; Xie, J.; Bhunia, A.K.; Li, X.; Ma, Z.; Wu, M.; Guo, J.; Song, Y.Z. The devil is in the channels: Mutual-channel loss for fine-grained image classification. IEEE Trans. Image Process. 2020, 29, 4683–4695. [Google Scholar] [CrossRef] [PubMed]
- Selvaraju, R.R.; Cogswell, M.; Das, A.; Vedantam, R.; Parikh, D.; Batra, D. Grad-cam: Visual explanations from deep networks via gradient-based localization. In Proceedings of the IEEE International Conference on Computer Vision, Venice, Italy, 22–29 October 2017; pp. 618–626. [Google Scholar]


Disclaimer/Publisher’s Note: The statements, opinions and data contained in all publications are solely those of the individual author(s) and contributor(s) and not of MDPI and/or the editor(s). MDPI and/or the editor(s) disclaim responsibility for any injury to people or property resulting from any ideas, methods, instructions or products referred to in the content. |
© 2023 by the authors. Licensee MDPI, Basel, Switzerland. This article is an open access article distributed under the terms and conditions of the Creative Commons Attribution (CC BY) license (https://creativecommons.org/licenses/by/4.0/).