Article

RGB Camera-Based Blood Pressure Measurement Using U-Net Basic Generative Model

1
Department of AI & Informatics, Graduate School, Sangmyung University, Seoul 03016, Republic of Korea
2
Department of Human-Centered Artificial Intelligence, Sangmyung University, Seoul 03016, Republic of Korea
*
Author to whom correspondence should be addressed.
These authors contributed equally to this work.
Electronics 2023, 12(18), 3771; https://doi.org/10.3390/electronics12183771
Submission received: 1 August 2023 / Revised: 30 August 2023 / Accepted: 5 September 2023 / Published: 6 September 2023

Abstract

:
Blood pressure is a fundamental health metric widely employed to predict cardiac diseases and monitor overall well-being. However, conventional blood pressure measurement methods, such as the cuff method, necessitate additional equipment and can be inconvenient for regular use. This study aimed to develop a novel approach to blood pressure measurement using only an RGB camera, which promises enhanced convenience and accuracy. We employed the U-Net Basic generative model to achieve our objectives. Through rigorous experimentation and data analysis, our approach demonstrated promising results, attaining BHS (British Hypertension Society) baseline performance with grade A accuracy for diastolic blood pressure (DBP) and grade C accuracy for systolic blood pressure (SBP). The mean absolute error (MAE) achieved for DBP was 4.43 mmHg, and for SBP, it was 6.9 mmHg. Our findings indicate that blood pressure measurement using an RGB camera shows significant potential and may be utilized as an alternative or supplementary method for blood pressure monitoring. The convenience of using a commonly available RGB camera without additional specialized equipment can empower individuals to track their blood pressure regularly and proactively predict potential heart-related issues.

1. Introduction

Cardiac diseases remain the leading causes of mortality in the United States in 2021, and its close association with elevated blood pressure emphasizes the importance of regular and accurate blood pressure monitoring for prevention and management [1]. However, widespread access to blood pressure monitors and the challenges associated with consistent measurement hinder effective monitoring efforts. To address this problem, numerous studies have explored alternative methods, one of which is blood pressure prediction using contactless photoplethysmography (cPPG) signals, eliminating the need for traditional cuff-based monitors [2,3,4,5,6,7,8,9]. cPPG offers a non-invasive approach to blood pressure estimation, utilizing data that can be extracted from various sources such as hospitals, wristbands, and smartwatches. Unlike cuff-based monitors, cPPG eliminates the inconvenience of external arm pressurization during measurement. However, the implementation of cPPG requires additional equipment and involves a contact situation, which may limit its widespread adoption and usability.
A promising advancement in this field is remote photoplethysmography (rPPG), which is acquired remotely from the cPPG signal. rPPG is a method of measuring blood flow changes by detecting subtle pixel variations on the skin surface observed in RGB images, often captured by cameras. Although it may not capture all the intricate changes measurable through contact-based methods, rPPG is gaining popularity due to its convenience and non-invasive nature. Motivated by the convenience and versatility of rPPG, we conducted a study aiming to predict blood pressure using rPPG signals and evaluated its performance. This study offers a novel and convenient approach to measure blood pressure, solely utilizing an RGB camera and eliminating the need for additional specialized devices. Moreover, the versatility of rPPG allows for seamless integration with various equipment, enhancing its potential for widespread application.
Through extensive research and analysis of rPPG signals, we employed signal processing techniques and machine learning algorithms to develop predictive models for blood pressure estimation. Our study utilized a diverse dataset, encompassing a wide range of individuals, to ensure the reliability and generalizability of our findings. Preliminary results indicate promising performance in predicting blood pressure through rPPG signals. This study contributes to the growing body of research on non-invasive blood pressure monitoring, highlighting the potential of rPPG as a viable alternative to traditional methods.
In this paper, we present the details of our study, including the methodology, experimental setup, results, and analysis, underscoring the convenience and applicability of rPPG for blood pressure estimation. This research contributes to the field of non-invasive monitoring and holds promise for revolutionizing the way blood pressure is measured and managed in both clinical and everyday settings.
This paper is structured in the following order to investigate the application of remote photoplethysmography (rPPG) for blood pressure estimation. The initial section of this research involved a comprehensive review of existing literature to understand the current landscape of blood pressure monitoring techniques and the advancements made in the field. This preliminary research provided valuable insights into the limitations and challenges associated with traditional blood pressure measurement methods, thereby emphasizing the need for alternative approaches like rPPG. Following the preliminary research, the paper proceeds to elucidate the specifics of the data utilized in this study. The dataset selected for analysis is described. Additionally, the variables collected, including rPPG signals and corresponding blood pressure measurements, are detailed to provide a comprehensive understanding of the data utilized for model development. Next, the paper delves into the model and methodology employed in this study. The proposed approach for blood pressure estimation using rPPG signals is explained, highlighting the signal processing techniques utilized to extract meaningful features and the machine learning algorithms employed for predictive modeling. The rationale behind the chosen model and the specific steps involved in the methodology are further elaborated to ensure clarity and reproducibility. To evaluate the performance of the proposed method, various analyses are conducted and presented. The paper showcases the accuracy, precision, and recall values obtained through statistical evaluations and provides visual representations, such as graphs and charts, to illustrate the correlation between predicted and actual blood pressure values. Additionally, comparisons with existing methods or benchmarks are made to ascertain the effectiveness and efficiency of the proposed approach. In the final sections, the paper concludes by summarizing the key findings and implications of the study. The discussion highlights the strengths, limitations, and potential applications of rPPG-based blood pressure estimation. Furthermore, the conclusion emphasizes the significance of this research in advancing the field of non-invasive blood pressure monitoring and suggests avenues for future research, such as refining the model, expanding the dataset, and exploring real-time applications.

2. Related Works

2.1. Cuffless Blood Pressure Estimation

Cuffless blood pressure estimation has been studied in several directions as shown in Table 1. Early blood pressure estimation studies were based on pulse transit time (PTT) [2]. PTT can be obtained as the difference in pulse waveform arrival time between two measurement locations in the cardiovascular system. It is usually easily obtained from an electrocardiogram (ECG) or photoplethysmography (PPG) and is used to predict blood pressure after a calibration procedure. However, there have been issues with the lack of accuracy of the cuffless method of measuring blood pressure and the need to account for factors other than blood pressure that can affect PTT. C El-Hajj et al. proposed a method to output systolic and diastolic blood pressure readings using the attention mechanism and recurrent neural network (RNN) structure [3,4]. In particular, Ref. [3] uses a gated recurrent unit (GRU) structure that is a modified form of long short-term memory (LSTM), one of the RNNs. Both studies showed good results in predicting blood pressure, but they required additional feature extraction from the signal to train the prediction model, followed by dimensionality reduction. This requires additional computation. One limitation is that this system cannot predict complete waveforms of blood pressure. Qihan Hu et al. extracted features by fusing multiple convolutional kernels of different sizes based on the attention mechanism [5]. However, this study also requires an 8-s PPG segment and additionally requires the first derivative of the PPG signal (velocity plethysmogram; VPG) and the second derivative of the PPG signal (acceleration plethysmogram; APG). Sakib Mahmud et al. studied predictions of blood pressure waveforms for continuous blood pressure monitoring [6]. They adopted the U-Net structure, which is widely used in deep-learning-based blood pressure prediction research, to train the model with PPG and ECG signals as inputs. The prediction result obtained a grade A according to British Hypertension Society standards (BHS) for both systolic and diastolic blood pressure but required additional ECG signals in addition to PPG. Hao Liang et al. proposed a method for predicting blood pressure by adopting a U-Net structure and using PPG signals as input [8]. However, this method required 10-s signal segments as input data. Solmaz Rastegar et al. proposed a method for predicting blood pressure by integrating a convolutional neural network (CNN) structure and support vector regression (SVR), using both ECG and PPG signals as input [9]. Blood pressure estimation performance was good, but this method required a second signal in addition to the PPG signal. Most studies used the Multiparameter Intelligent Monitoring in Intensive Care II (MIMIC II) online database provided by the PhysioNet organization. Additionally, Sakib Mahmud et al. [6] utilized a ballistocardiogram (BCG) dataset containing ECG, PPG, ABP, and BCG waveforms, which provides time-aligned signals [10]. Hao Liang et al. [8] employed The University of Queensland Vital Signs (UQVS) dataset to train a blood pressure prediction model [11]. This dataset includes various vital signs such as blood pressure, ECG, and pulse rate. Solmaz Rastegar et al. [9] utilized a subset of the Medical Information Mart for Intensive Care III (MIMIC-III) waveform database [12], which contains various physiological waveforms extracted with a sampling frequency of 125 Hz. Recently, longitudinal studies have been conducted to directly predict blood pressure from PPG signals based on the morphological similarities between PPG and blood pressure waveforms.

2.2. Arterial Blood Pressure Generation from Photoplethysmography

Nabil Ibtehaz et al. presented PPG2ABP, a two-stage cascaded deep-learning-based method that simultaneously preserves shape, magnitude, and phase by estimating a continuous ABP waveform from an input PPG signal with a mean absolute error of 4.604 mmHg [7]. PPG2ABP is a UNet-based model with a serial implementation of two 1D-CNN-based segmentation networks, and the MAE is 5.727 ± 9.162 mmHg and 3.449 ± 6.147 mmHg for SBP and DBP, respectively, achieving British Hypertension Society (BHS) standard class B and class A, respectively. The study predicted an ABP signal of 8.192 s in length. Rishi Vardhan K et al. presented BP-Net, a U-Net architecture to estimate systolic blood pressure (SBP), mean average pressure (MAP), and diastolic blood pressure (DBP) from mid-continuous arterial BP (ABP) waveforms using PPG waveforms, and achieved grade B for SBP and grade A for DBP, as per BHS standards [13]. They also achieved mean absolute error (MAE) of 5.16 mmHg and 2.89 mmHg for SBP and DBP, respectively. However, for this study, extreme signals such as SBP ≥ 180, SBP ≤ 80, DBP ≤ 130, and DBP ≤ 60 were excluded. Tasbiraha Athaya et al. proposed a U-net deep learning architecture to non-invasively estimated arterial BP (ABP) waveforms using fingertip PPG signals as input, and both SBP and DBP are grade A according to BHS standards. MAEs of 3.68 mmHg and 2.1 mmHg were achieved [14].

2.3. Blood Pressure Estimation from Remote Photoplethysmography

Another area of research focuses on prediction of blood pressure using rPPG, rather than cPPG. In the case of cPPG, there is still the inconvenience and hassle of wearing a new contact device, but rPPG has the advantage that it can be acquired by an RGB camera and can be applied to various devices. In a previous study on this by Fabian Schrumpf et al. [15], the existing model trained with cPPG was retrained with rPPG data. The best performance presented in the paper was 13.6 mmHg for SBP and 10.3 mmHg for DBP based on MAE, and the performance was about 12.7 mmHg and 10.5 mmHg when personalization was performed. This shows a limitation that the model itself does not show a usable level of accuracy. Another study by Bing-Fei Wu et al. [16] also predicts blood pressure from facial images. The study collected large-scale self-constructed data: 2291 data points from 1143 individuals were collected, and seven physiological metrics were extracted from rPPG and used as the signal itself and as input. In this study, no calibration was used, and an MAE of 11.54 mmHg was achieved for SBP and an MAE of 8.09 for DBP. While the performance without calibration is better than previous studies, it still does not meet standards set by the Association for the Advancement of Medical Instrumentation (AAMI) or BHS. Therefore, we designed and trained a model with better performance to meet the standard to some extent.

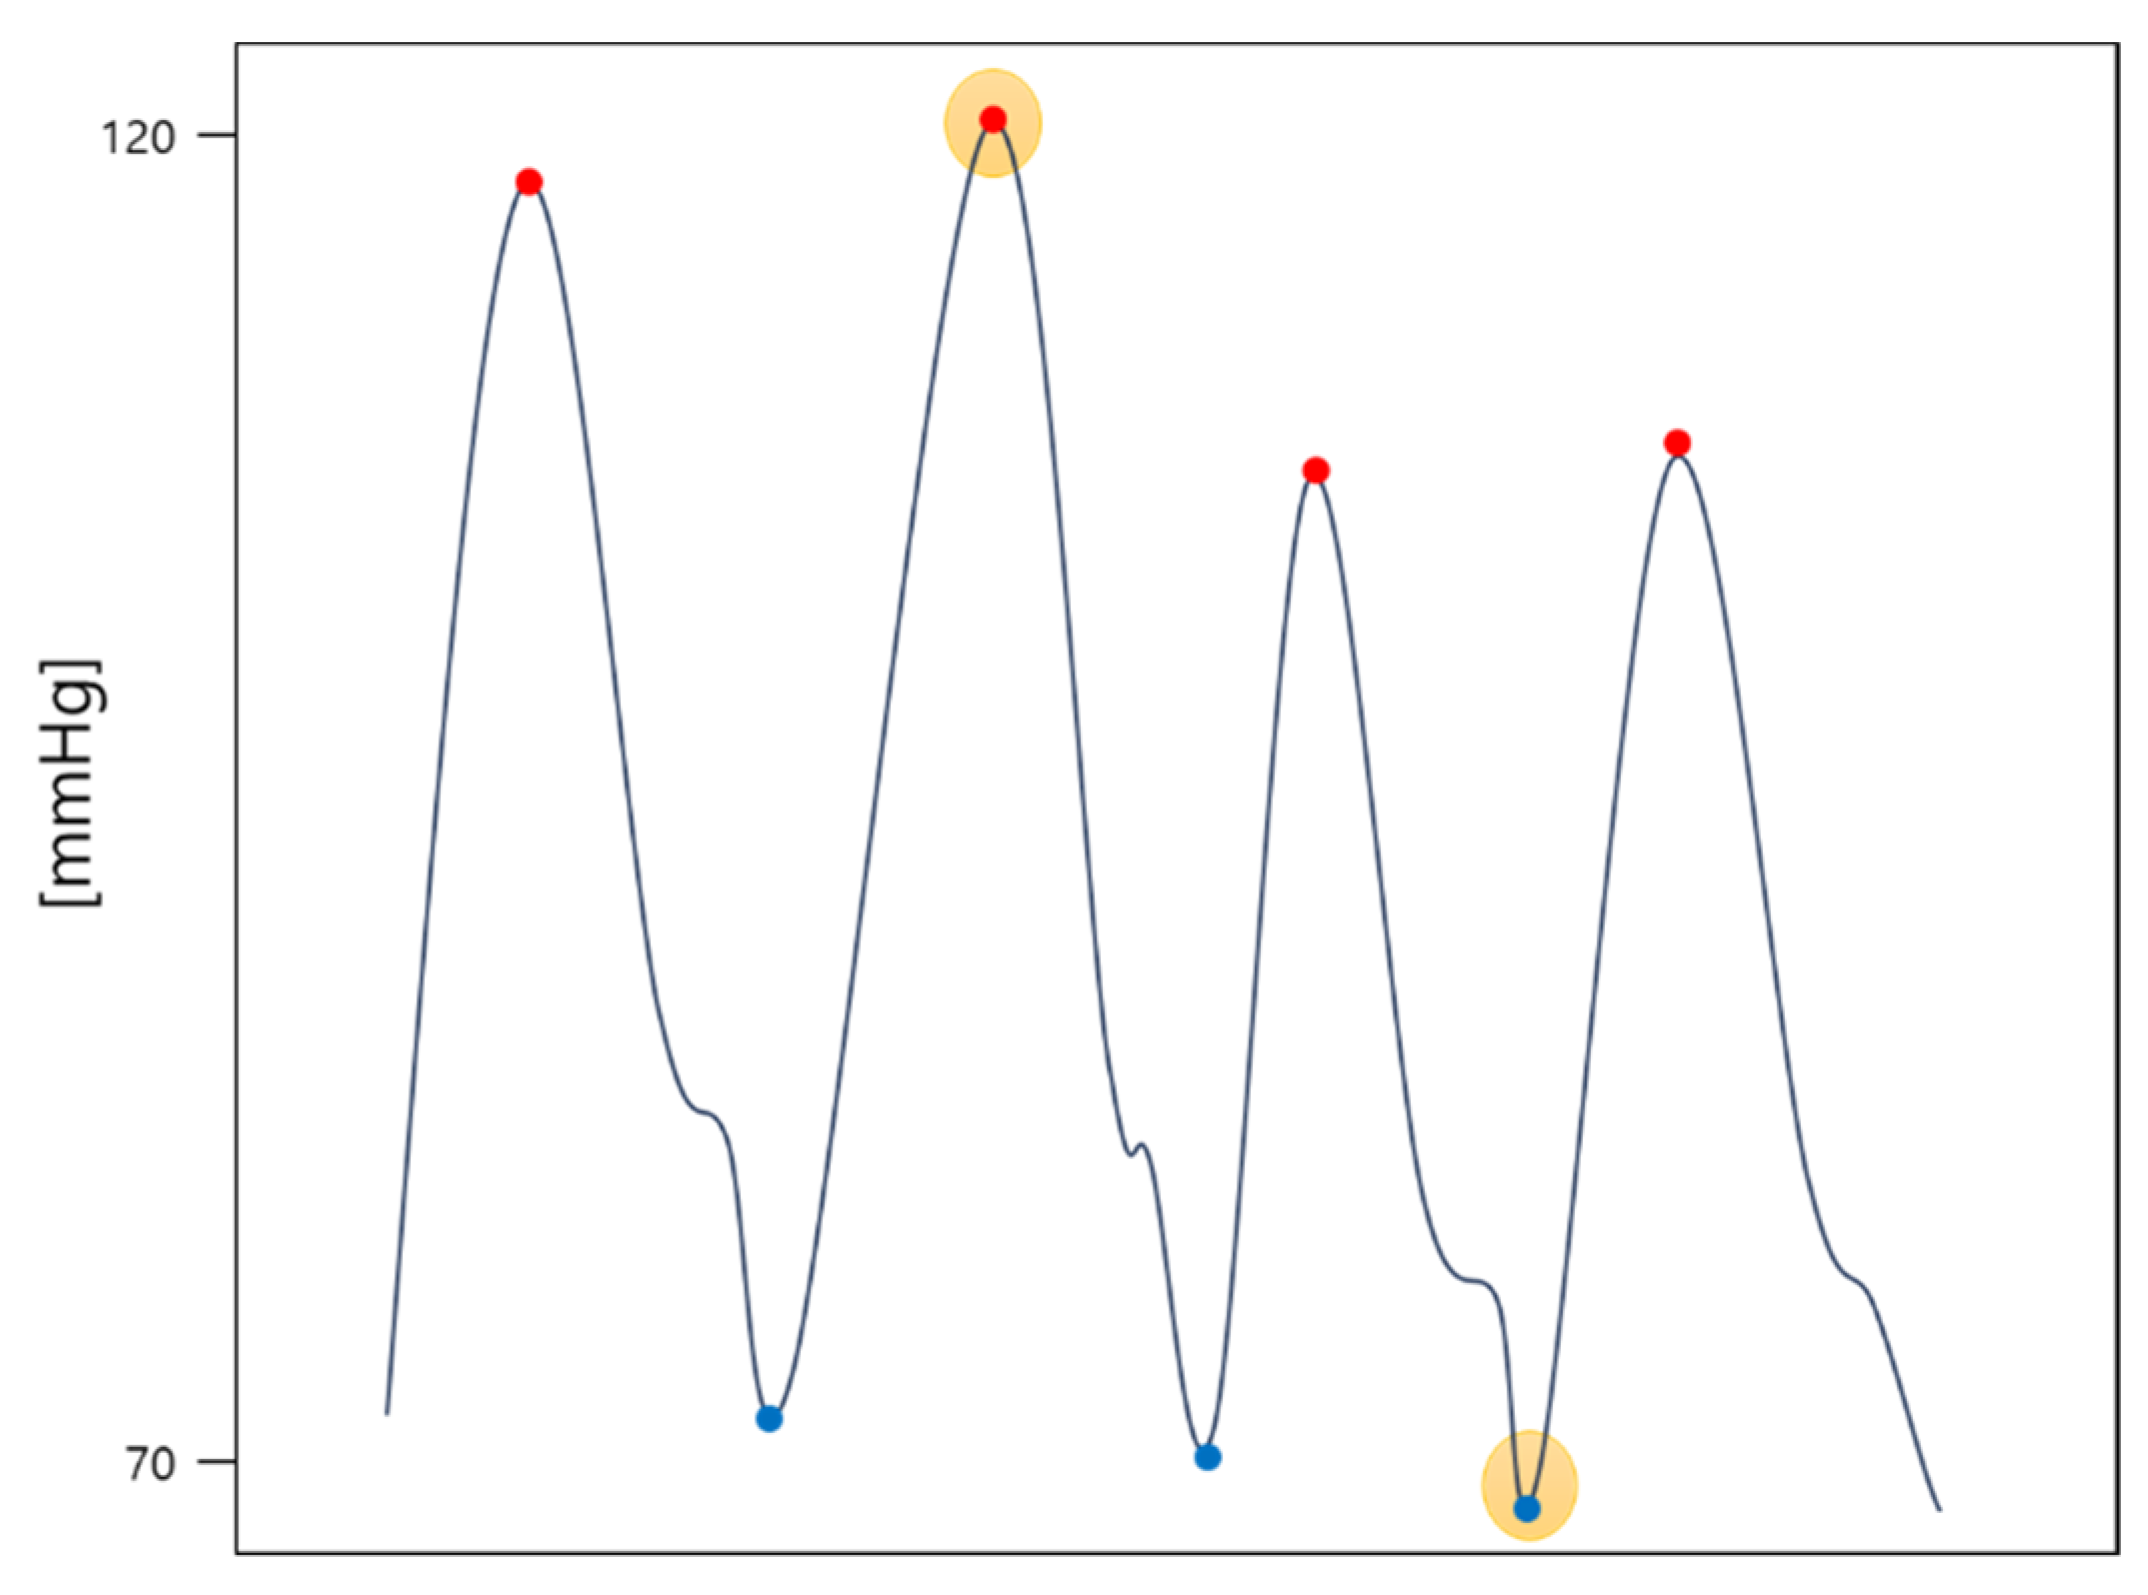
3. Material and Methods

The research designed to predict blood pressure follows a specific order to ensure accurate and reliable results. The methodology consists of several stages, with the first stage focusing on the pre-processing of the two types of data to be used in the study. This pre-processing step serves two primary purposes: removing unnecessary noise from the data and reducing mutual differences to optimize the model’s weight utilization. In both cPPG and rPPG, differences in the ranges and intervals of values are inevitable due to variations in the data acquisition methods or devices used. To overcome these differences and ensure compatibility between the two types of data, appropriate normalization techniques are employed. This brings cPPG and rPPG data to within a consistent range and to optimize the model weights. The data used in this research are meticulously described, including their sources, sample sizes, and relevant variables. The pre-processing methods applied to the data are thoroughly explained, detailing the steps taken to remove noise, normalize the values, and conduct oversampling. Transparency and reproducibility are key considerations in this process to ensure the integrity of the research. The detailed explanation of the methodology employed for blood pressure prediction is provided in subsequent sections. This includes a comprehensive description of any feature engineering techniques applied, and the specific model architecture employed. The chosen methodology is justified, highlighting its effectiveness in addressing the research objectives and overcoming challenges associated with cPPG and rPPG data. By following this structured approach, the research ensures that the data used in the study are properly pre-processed, resulting in optimized data quality for subsequent analysis. The detailed methodology description ensures clarity and reproducibility, allowing for a thorough understanding of the research process.

3.1. Dataset

The study utilized two datasets, with the the MIMIC II dataset employed for training Model 1. The MIMIC II dataset is widely recognized and extensively used in blood pressure prediction research [2,17]. It encompasses PPG, ECG, and ABP signals, each sampled at a frequency of 125 Hz. The dataset includes recordings from a total of 12,000 subjects. To facilitate the analysis, a window size of 5 s was applied to segment the signals, resulting in a total of 528,753 segmented signals. Prior to training, the segmented signals underwent data preprocessing, ultimately yielding a final dataset size of (528753, 625).
We trained Model 2 on the same dataset. However, instead of predicting the ABP signal, we added a fully connected layer at the end of the model to predict the SBP and DBP values. SBP and DBP are the minimum and maximum values of ABP. Thus, we used the smallest value of each entire 5 s bin as the DBP for that bin and labeled the largest value as the SBP. Figure 1 below shows SBP and DBP in ABP. The red dots are the points used for SBP and the blue dots are the values used for DBP.
The dataset used for training Model 3 is an rPPG dataset from a previous study [15] on predicting blood pressure using cPPG and rPPG. These camera-based prediction data were recorded at the University Hospital Leipzig and consists of signals collected from a total of 17 subjects and their facial images, measured with a USB camera connected to a PC. The sampling frequency of this dataset is 125 Hz, as is the MIMIC-II dataset, and sampling length is 7 s. Since we retrain using the weight of the previously trained model, only 5 s of data out of 7 s were used for training, and the final data size is (7852, 625). The SBP and DBP distributions of the two datasets are shown in Figure 2 and Figure 3, respectively. The mean standard deviation of systolic and diastolic blood pressure for each dataset is shown in Table 2.

3.2. Data Preprocessing

We did not perform any additional bandpass filtering. This is because blood pressure can be derived from other sources besides heart rate, so we normalized the signals as they are. We normalized each signal to the range [0, 1] to minimize the impact of inter-individual variation in PPG signals during model training. The equation used in the normalization process is shown in Equation (1):
x ^ = x       x m i n x m a x     x m i n ,
where x m i n is the minimum value and x m a x is the maximum value of one PPG signal. The normalized signal was divided into 5 s with a sliding window, and since the sampling frequency of the dataset used is 125 Hz, data with a length of 625 was extracted from the MIMIC-II dataset and used as input for Models 1 and 2. We selected a data length of 5 s, which is the size of window, as this aligns with the time the user can be immobile based on the RGB camera footage. Longer data lengths may convey more blood flow characteristics in the signal, though they may be cumbersome to utilize and susceptible to movement-related noise due to the nature of rPPG. Conversely, shorter data lengths may exclude blood flow features, leading to difficulty in predicting. Therefore, we have selected a training time of 5 s for the model using a one-dimensional signal of 625 lengths derived from 125 frames per second data. For Model 3, due to the small number of rPPG datasets, the entire data was used for training, and the input signal data of Models 1, 2, and 3 were all split into training and test sets, with a ratio of 8:2, before being input to the model. In the case of MIMIC-II, 432,002 training and 96,751 testing datasets were used from 528,753 total datasets, and for the rPPG dataset, 6281 training and 1571 testing datasets were used from 7852 total datasets. The PPG data of MIMIC-II and rPPG datasets, before and after preprocessing are shown in Figure 4 and Figure 5. After preprocessing, the distribution of signal values is transformed to signals between 0 and 1.

3.3. Models

For training, we used a model U-Net based structure. The model is specifically designed for generative tasks and incorporates skip connections to preserve and transfer the compressed values of the embedding vector from the contracting path to the expansion path, ensuring there is no loss of data during this process. The software environment utilized in this study encompassed Python 3.8.10, PyTorch 1.9.0, and CUDA 11.1 versions. For a more comprehensive understanding of the model, further details are provided below.

PPG to ABP Model

The structures used in the model, residual block, and inception residual block, are shown in Figure 6. The residual block uses a skip connection structure to minimize the loss of information inside the block and preserve the information of the input data and mitigate the problem of gradient disappearance. Inception residual block combines the advantages of ResNet and Inception models and can construct a deep network while extracting various features of the input data. It is performed by using various filter sizes and connecting them after computation.
To predict SBP and DBP values from rPPG signals, we utilized a U-Net-based model, which was trained in three separate sessions. The U-Net architecture is an end-to-end fully-convolutional network that comprises a contracting path for context information extraction, an expanding path for precise localization, and a bottleneck section that facilitates the transition between the contracting and expanding paths [18]. This model is widely employed in various generative tasks, demonstrating commendable performance across multiple domains. In our work, we adapted the U-Net model to operate on one-dimensional signal-type data, optimizing it for our specific application. During the training process, we conducted a total of three sessions, including initial training and two transfer learning sessions, with different input and output configurations. The structure of the three designed models, namely the contraction path and expansion path, exhibits similarities. In the contraction path, all three models share the same configuration, which comprises 1D convolution and batch normalization with 3-size kernels, followed by 1-size padding after a 3 × 1 max-pooling layer. The rectified linear unit (ReLU) function serves as the activation function. For the expansion path, we applied upsampling with a default scale factor of 3 and employed 1D convolution, batch normalization, and LeakyReLU as the active function. It is important to note that despite the similarities in the architecture, the training processes for the three models differed, and we will provide a detailed description of each training process in the subsequent sections. Overall, by adapting the U-Net model to one-dimensional operations and tailoring it to suit our signal-type data, we achieved promising results in predicting SBP and DBP values from rPPG signals. The subsequent sections will delve into the specific intricacies of each training process. Model 1 is designed to predict the ABP continuous signal from cPPG. The model’s structure is depicted in Figure 7. It takes a 5 s-long cPPG signal as input and generates a corresponding 5 s-long ABP signal as output. The expansion path of the model incorporates inception residual blocks after the convolution operation. In the bottleneck section of these blocks, the number of channels is set to 64. This design choice enables the model to learn at a higher speed, improving its efficiency. In training, the learning rate is set to 0.001 and the model is trained over 300 epochs.
It is not possible to apply Model 1 to rPPG data as it is because the input data, including rPPG, do not contain the ground truth ABP signal. Therefore, we applied the second step. Model 2 is a model that predicts SBP and DBP from cPPG using transfer learning in the structure of Model 1, and the model structure is shown in Figure 8. As can be seen from Figure 8, the structure is very similar to the U-Net structure of Model 1; the structure of contraction path and expansion path are the same, so we have frozen the weights of the layers; however, instead of a 5 s ABP signal as in Model 1, we added a linear layer after the expansion path to predict SBP and DBP values. These dense layers can be thought of as the layers that extract the SBP and DBP from the ABP signal. As shown in Figure 8, the process of extracting the maximum and minimum values of the signal was learned through the dense layers. To elaborate on how the model was trained, we set the learning rate to 0.0001 and the epoch to 300. This is a lower learning rate than that used when training Model 1.
Model 3 is a model that predicts SBP and DBP from rPPG, and the model structure is shown in Figure 9. As can be seen from the Figure 9, the contraction path is the same as in Model 2. However, the problem with this is that it can cause overfitting of local features. Therefore, we added an additional inception residual block to the expansion path. This is a way to improve performance without significantly increasing the weight of the model, as it is less computationally intensive and faster than the traditional residual block. We froze the existing contraction path and proceeded with learning, setting the learning rate to 0.0005 and the epoch to 300.

4. Results

For each model, we used the same rPPG data to predict blood pressure. For Model 1, we first predicted ABP using rPPG as an input and then took the smallest value as diastolic blood pressure and the largest value as systolic blood pressure. Table 3 presents the rPPG results for the average of 5 different test datasets by applying K-Fold cross-validation for each model.
We validated our results with individuals of diverse identities in both the training and testing phases, without implementing personalization for each identity. This approach was chosen as the target characteristic of the trained model is universal applicability. However, we observed that predictions of diastolic blood pressure (DBP) were comparable to the reference model when personalized, and predictions of systolic blood pressure (SBP) had significantly less error compared to when personalized. Table 4 and Table 5 below illustrate how our fine-tuned Model 3 compares to the standards set by the British Hypertension Society (BHS) [19], in which precise procedures and techniques for blood pressure measurement are defined, and suitable measurement methods are suggested based on the patient’s typical condition and measurement environment.
The results demonstrate that even with data derived from rPPG, we achieved a Grade C for SBP, comparable to the Grade B based on BHS standards, and a Grade A for DBP. This suggests that our proposed model could be integrated into a device designed to predict blood pressure using rPPG data. To further illustrate this, we presented the ground truth and predicted values of SBP and DBP via a scatter plot and Bland–Altman plot, as depicted in Figure 10. The Bland–Altman plot [20] is a statistical tool used to visually display the level of agreement between two measurement or inspection methods, and the relationship between the difference and the mean.

5. Discussion

As shown in Table 4 and Table 5, we obtained a grade A for DBP and a grade C for SBP using the BHS criterion, one of the standard metrics used internationally, even in PPG, which is acquired through an RGB camera in a remote environment. This shows much higher scalability than previous studies. In particular, grade A is an important score that is difficult to reach when evaluating blood pressure prediction methods that we aim to acquire even when using conventional contacted PPG sensors. Moreover, the input we used as a single PPG data with 5 s length, which is shorter than all existing studies that predicted not only rPPG but also cPPG. The reason is that longer data contain more information. We can see in Table 6 below that the performance of Model 1 in predicting ABP from cPPG is lower than the existing models. However, as the length of the data increases, the model becomes less convenient to use. Therefore, we tried to train our model using the shortest possible data.
Furthermore, there is inevitable degradation in performance due to the length of the data used, even if a similarly structured model is used. As mentioned earlier, if multiple applications use the RGB camera, its usability will reduce when it requires a longer duration of RGB image as input. We therefore compromised the performance in this aspect to enhance the effectiveness and efficiency of rPPG. In terms of rPPG, in Table 3, we can see that our model reduces MAE by 5.87 mmHg for DBP and 6.7 mmHg for SBP compared to the original study [16] before personalization, and reduces DBP by 6.37 mmHg and SBP by 5.8 mmHg after personalization. We can also see that our model reduces MAE by 3.66 mmHg for DBP and 4.64 mmHg for SBP compared to the later study [17] in 2022. Figure 10 provides a more detailed breakdown of each test prediction. In Figure 10a,b, scatter plots of SBP and DBP, respectively, with accurate values along the x-axes and forecasted values along the y-axes, demonstrate that points are moderately clustered around the line y = x. A more detailed illustration of this is provided using the Bland–Altman plots seen in Figure 10c,d. It can be observed that 95% of the examples fall within the interval [−10.12:14.50] for SBP and [−22.38:17.55] for DBP.

6. Conclusions

In conclusion, our research demonstrates promising results from our model, not only in predicting blood pressure from cPPG data but also when utilizing rPPG data. This underscores the potential of leveraging the existing large quantity of cPPG data to aid in rPPG-based blood pressure prediction. Importantly, our transfer learning approach, from a cPPG-based blood pressure prediction model to an rPPG-based one, exhibits satisfactory performance, illustrating the versatility and generalizability of our methodology. The results presented in Table 3 highlight the superiority of our model’s performance compared to existing studies in this domain, validating its efficacy in predicting blood pressure from rPPG signals. The near-equivalent performance between contact PPG and remote PPG, when compared to prior studies, substantiates the feasibility of employing rPPG as a non-invasive and convenient alternative. Additionally, our proposed model adheres to international standards by meeting the BHS metrics, underscoring its accuracy and reliability in predicting blood pressure. Notably, our model relies solely on RGB cameras for data acquisition, eliminating the need for specialized hardware, which potentially has practical implications for real-world applications.
In our future work, we aim to enhance performance further by utilizing larger and more diverse datasets. Additionally, we plan to explore the implementation of different models to continuously improve blood pressure prediction accuracy. While we used rPPG signals collected in a previous study as input to our model, we recognize that the method of extracting rPPG signals from RGB images can impact the model’s performance. Consequently, we plan to conduct future research focusing on directly using the images and examining how the model’s effectiveness varies with different rPPG extraction algorithms.
In summary, our study represents a significant advancement in blood pressure prediction using rPPG data, providing a valuable contribution to the field. The potential for non-contact blood pressure prediction using common RGB cameras offers promising prospects for broader adoption and usage in various settings, with potential implications for remote patient monitoring and telemedicine.

Author Contributions

Conceptualization, E.C.L.; methodology, S.K. and H.L.; software, H.L.; validation, S.K and H.L.; formal analysis, S.K.; investigation, H.L.; resources, J.B.; data curation, J.B.; writing—original draft preparation, S.K., H.L. and J.B.; writing—review and editing, E.C.L.; visualization, H.L. and J.B.; supervision, E.C.L.; project administration, E.C.L.; All authors have read and agreed to the published version of the manuscript.

Funding

This work was supported by Korea Institute of Police Technology (KIPoT; Police Lab 2.0 program) grant funded by the Korea government (MSIT) (RS-2023-00281194; Development for a remotely-operated testimony system for the children based on AI and Cloud technology).

Data Availability Statement

Since the data used in this study is a public open dataset, it can be used by contacting the data holder.

Conflicts of Interest

The authors declare no conflict of interest.

References

  1. FastStats. Available online: https://www.cdc.gov/nchs/fastats/deaths.htm (accessed on 25 July 2023).
  2. Kachuee, M.; Kiani, M.M.; Mohammadzade, H.; Shabany, M. Cuff-Less High-Accuracy Calibration-Free Blood Pressure Estimation Using Pulse Transit Time. In Proceedings of the 2015 IEEE International Symposium on Circuits and Systems (ISCAS), Lisbon, Portugal, 24–27 May 2015; pp. 1006–1009. [Google Scholar]
  3. El-Hajj, C.; Kyriacou, P. Deep Learning Models for Cuffless Blood Pressure Monitoring from PPG Signals Using Attention Mechanism. Biomed. Signal Process. Control 2021, 65, 102301. [Google Scholar] [CrossRef]
  4. El Hajj, C.; Kyriacou, P.A. Recurrent Neural Network Models for Blood Pressure Monitoring Using PPG Morphological Features. In Proceedings of the 2021 43rd Annual International Conference of the IEEE Engineering in Medicine & Biology Society (EMBC), Virtual, 1–5 November 2021; pp. 1865–1868. [Google Scholar] [CrossRef]
  5. Hu, Q.; Wang, D.; Yang, C. PPG-Based Blood Pressure Estimation Can Benefit from Scalable Multi-Scale Fusion Neural Networks and Multi-Task Learning. Biomed. Signal Process. Control 2022, 78, 103891. [Google Scholar] [CrossRef]
  6. Mahmud, S.; Ibtehaz, N.; Khandakar, A.; Tahir, A.; Rahman, T.; Islam, K.; Hossain, M.S.; Rahman, M.; Islam, M.; Chowdhury, M. A Shallow U-Net Architecture for Reliably Predicting Blood Pressure (BP) from Photoplethysmogram (PPG) and Electrocardiogram (ECG) Signals. Sensors 2022, 22, 919. [Google Scholar] [CrossRef] [PubMed]
  7. Ibtehaz, N.; Mahmud, S.; Chowdhury, M.E.H.; Khandakar, A.; Salman Khan, M.; Ayari, M.A.; Tahir, A.M.; Rahman, M.S. PPG2ABP: Translating Photoplethysmogram (PPG) Signals to Arterial Blood Pressure (ABP) Waveforms. Bioengineering 2022, 9, 692. [Google Scholar] [CrossRef] [PubMed]
  8. Liang, H.; He, W.; Xu, Z. A Deep Learning Method for Continuous Noninvasive Blood Pressure Monitoring Using Photoplethysmography. Physiol. Meas. 2023, 44, 05500. [Google Scholar] [CrossRef] [PubMed]
  9. Rastegar, S.; Gholam Hosseini, H.; Lowe, A. Hybrid CNN-SVR Blood Pressure Estimation Model Using ECG and PPG Signals. Sensors 2023, 23, 1259. [Google Scholar] [CrossRef] [PubMed]
  10. Carlson, C.; Turpin, V.-R.; Suliman, A.; Ade, C.; Warren, S.; Thompson, D.E. Bed-Based Ballistocardiography: Dataset and Ability to Track Cardiovascular Parameters. Sensors 2021, 21, 156. [Google Scholar] [CrossRef] [PubMed]
  11. Liu, D.; Görges, M.; Jenkins, S.A. University of Queensland Vital Signs Dataset: Development of an Accessible Repository of Anesthesia Patient Monitoring Data for Research. Anesth. Analg. 2012, 114, 584–589. [Google Scholar] [CrossRef] [PubMed]
  12. Johnson, A.E.W.; Pollard, T.J.; Shen, L.; Lehman, L.H.; Feng, M.; Ghassemi, M.; Moody, B.; Szolovits, P.; Anthony Celi, L.; Mark, R.G. MIMIC-III, a Freely Accessible Critical Care Database. Sci. Data 2016, 3, 160035. [Google Scholar] [CrossRef] [PubMed]
  13. Vardhan, K.R.; Vedanth, S.; Poojah, G.; Abhishek, K.; Kumar, M.N.; Vijayaraghavan, V. BP-Net: Efficient Deep Learning for Continuous Arterial Blood Pressure Estimation Using Photoplethysmogram. In Proceedings of the 2021 20th IEEE International Conference on Machine Learning and Applications (ICMLA), Pasadena, CA, USA, 13–16 December 2021. [Google Scholar]
  14. Athaya, T.; Choi, S. An Estimation Method of Continuous Non-Invasive Arterial Blood Pressure Waveform Using Photoplethysmography: A U-Net Architecture-Based Approach. Sensors 2021, 21, 1867. [Google Scholar] [CrossRef] [PubMed]
  15. Schrumpf, F.; Frenzel, P.; Aust, C.; Osterhoff, G.; Fuchs, M. Assessment of Deep Learning Based Blood Pressure Prediction from PPG and RPPG Signals. In Proceedings of the 2021 IEEE/CVF Conference on Computer Vision and Pattern Recognition Workshops (CVPRW), Nashville, TN, USA, 19–25 June 2021; IEEE: Piscataway, NJ, USA, 2021; pp. 3815–3825. [Google Scholar]
  16. Wu, B.-F.; Wu, B.-J.; Tsai, B.-R.; Hsu, C.-P. A Facial-Image-Based Blood Pressure Measurement System Without Calibration. IEEE Trans. Instrum. Meas. 2022, 71, 1–13. [Google Scholar] [CrossRef]
  17. Goldberger, A.L.; Amaral, L.A.; Glass, L.; Hausdorff, J.M.; Ivanov, P.C.; Mark, R.G.; Mietus, J.E.; Moody, G.B.; Peng, C.K.; Stanley, H.E. PhysioBank, PhysioToolkit, and PhysioNet: Components of a New Research Resource for Complex Physiologic Signals. Circulation 2000, 101, E215–E220. [Google Scholar] [CrossRef] [PubMed]
  18. Ronneberger, O.; Fischer, P.; Brox, T. U-Net: Convolutional Networks for Biomedical Image Segmentation. In Proceedings of the Medical Image Computing and Computer-Assisted Intervention—MICCAI 2015; Navab, N., Hornegger, J., Wells, W.M., Frangi, A.F., Eds.; Springer International Publishing: Cham, Switzerland, 2015; pp. 234–241. [Google Scholar]
  19. Williams, B.; Poulter, N.R.; Brown, M.J.; Davis, M.; McInnes, G.T.; Potter, J.F.; Sever, P.S.; McG Thom, S. Guidelines for Management of Hypertension: Report of the Fourth Working Party of the British Hypertension Society, 2004—BHS IV. J. Hum. Hypertens. 2004, 18, 139–185. [Google Scholar] [CrossRef] [PubMed]
  20. Giavarina, D. Understanding Bland Altman Analysis. Biochem. Med. 2015, 25, 141–151. [Google Scholar] [CrossRef] [PubMed]
Figure 1. Example of selecting SBP (red dot with yellow highlight) and DBP (blue dot with yellow highlight) in an ABP signal (solid line).
Electronics 12 03771 g001
Figure 2. Systolic (SBP), Diastolic (DBP) blood pressure distribution of the MIMIC-II dataset used.
Electronics 12 03771 g002
Figure 3. Systolic (SBP), Diastolic (DBP) blood pressure distribution of the rPPG dataset used.
Electronics 12 03771 g003
Figure 4. PPG Signals of MIMIC-II before and after preprocessing; (a) Before preprocessing; (b) after preprocessing.
Electronics 12 03771 g004
Figure 5. rPPG Signals before and after preprocessing; (a) Before preprocessing; (b) after preprocessing.
Electronics 12 03771 g005
Figure 6. Structures of Block; (a) Residual Block; (b) Inception Residual Block..
Electronics 12 03771 g006
Figure 7. Structure of Model 1.
Electronics 12 03771 g007
Figure 8. Structure of Model 2.
Electronics 12 03771 g008
Figure 9. Structure of Model 3.
Electronics 12 03771 g009
Figure 10. Graphs depicting prediction results using rPPG test data: (a) Scatter plot of actual (x-axis) versus predicted (y-axis) SBP; (b) Scatter plot of actual (x-axis) versus predicted (y-axis) DBP; (c) Bland-Altman plot for SBP; (d) Bland-Altman plot for DBP.
Electronics 12 03771 g010
Table 1. Summary of conventional cuffless blood pressure measurement methods.
YearDatasetMethodInputMAE (mmHg)BHS Grade
SBPDBPSBPDBP
Kachuee et al. [2]2015MIMIC IIPTTPPG
ECG
12.386.34BC
C El-Hajj et al. [3]2021MIMIC IIGRU
Attention
PPG2.581.26--
C El-Hajj et al. [4]2021MIMIC IIRNNPPG5.773.33--
Qihan Hu et al. [5]2022MIMIC IICNNPPG
VPG
APG
1.001.88BA
Sakib Mahmud
et al. [6]
2022MIMIC II
BCG
U-NetPPG
VPG
APG
ECG
2.330.71AA
Hao Liang et al. [8]2023MIMIC II
UQVS
U-NetPPG2.621.71AA
Solmaz Rastegar et al. [9]2023MIMIC IIICNN
SVR
PPG
ECG
1.233.08--
Table 2. Systolic (SBP) and Diastolic (DBP) Blood Pressure Mean and Standard Deviation of Each Dataset Used in Training.
SBP (mmHg)DBP (mmHg)
MIMIC II132.9 ± 22.763.4 ± 10.9
rPPG143.4 ± 15.065.7 ± 11.3
Table 3. MAE for every Models with rPPG input.
DBP [mmHg]SBP [mmHg]
[16] w/o personalization10.313.6
[16] with personalization10.812.7
[17]8.0911.54
Model 111.5438.85
Model 211.5635.84
Model 34.436.9
Table 4. The standards of the British Hypertension Society (BHS).
Error ≤ 5 mmHgError ≤ 10 mmHgError ≤ 15 mmHg
BHSGrade A60%85%95%
Grade B50%75%90%
Grade C40%65%85%
Table 5. Evaluation of Model 3 performance using BHS standards.
Error ≤ 5 mmHgError ≤ 10 mmHgError ≤ 15 mmHg
Model 3SBP49.39%79.05%89.56%
DBP68.80%90.00%95.86%
Table 6. The standards of the British Hypertension Society (BHS) for measuring and performance of Model 1 and reference model [7], with UCI dataset (cPPG to ABP prediction).
Error ≤ 5 mmHgError ≤ 10 mmHgError ≤ 15 mmHg
[7]SBP70.81%85.30%90.92%
DBP82.83%92.15%95.73%
Model 1SBP50.88%75.08%86.09%
DBP76.70%92.57%96.77%
Disclaimer/Publisher’s Note: The statements, opinions and data contained in all publications are solely those of the individual author(s) and contributor(s) and not of MDPI and/or the editor(s). MDPI and/or the editor(s) disclaim responsibility for any injury to people or property resulting from any ideas, methods, instructions or products referred to in the content.

