Article

A Passive Channel Measurement and Analysis Based on a 5G Commercial Network in V2I Communications

1
Frontiers Science Center for Smart High-speed Railway System, Beijing Jiaotong University, Beijing 100044, China
2
School of Electronic and Information Engineering, Beijing Jiaotong University, Beijing 100044, China
3
State Key Laboratory of Rail Traffic Control and Safety, Beijing Jiaotong University, Beijing 100044, China
*
Author to whom correspondence should be addressed.
Electronics 2023, 12(17), 3715; https://doi.org/10.3390/electronics12173715
Submission received: 26 July 2023 / Revised: 19 August 2023 / Accepted: 25 August 2023 / Published: 2 September 2023
(This article belongs to the Special Issue Channel Measurement, Modeling and Simulation of 6G)

Abstract

:
To acquire accurate channel characteristics for 5G New Radio (NR) vehicle-to-infrastructure (V2I) communications, in this paper, we propose a 5G passive channel measurement platform based on software defined radio devices and 5G user equipment. Different from active measurement platforms, the proposed measurement platform only requires a receiver and the channel state information reference signal (CSI-RS) periodically transmitted by the 5G commercial base stations is used as the measurement waveform. The channel impulse response can be computed based on the CSI-RS signal extracted from the received waveform and the standard CSI-RS signal generated according to the signaling information. By using the proposed 5G passive channel measurement platform, we carry out wireless channel measurement for V2I communications in typical urban scenarios. Further, based on the measurement, the small-scale channel fading characteristics including the power delay profile, the number of multipaths, the delay spread of multipaths, and the Ricean K-factor are analyzed.

1. Introduction

For improving road safety and traffic efficiency, vehicle-to-everything (V2X) has drawn great attention in both industrial and academic fields over the past decade. The Third Generation Partnership Project (3GPP) has developed the first V2X standard based on the 5G New Radio (NR) air interface in its Release 16, which refers to 5G NR V2X communication standard [1,2]. Vehicle-to-infrastructure (V2I) communications, as an important component of 5G NR V2X communications, shares massive amounts of data among base stations, mobile devices, and vehicles under the coverage of infrastructure. Since accurate channel models for V2X communications are the foundation of system design and optimization, many channel models for V2X communications have been proposed [3]. Li et al. [4] presented extensive measurements and analyses of propagation channels in V2I communications. However, the measurements were conducted by using IEEE 802.15.4-compliant devices, which was significantly different from 5G devices. A set of propagation measurements were performed in representative vehicular communication environments in [5,6]. Li et al. [7] and Yi et al. [8] utilized raytracing techniques to developed V2I communication channel models. Yang et al. [9,10,11] conducted the channel measurements at 5.9 GHz in urban and suburban scenarios and proposed a cluster-based three-dimensional channel model to better model the vehicle-to-vehicle (V2V) channel. However, the V2V channels were intensively studied in [9,10,11], while the V2I channels were not considered.
As an important method for channel modeling, channel measurement can be classified into two types, i.e., active measurement and passive measurement. For the active channel measurement, the measurement platform is composed of a transmitter and a receiver, where the transmitter transmits a determined sounding signal, then the receiver receives the signal and computes the channel impulse response (CIR) based on the known sounding signal. For the passive channel measurement platform, only a receiver is required. The receiver receives the downlink reference signal periodically transmitted by base stations (BSs) and generates the reference signal according to wireless communication specifications. Then, the CIR can be computed to accomplish the channel measurement. Currently, most of the 5G channel measurement adopts the active measurement method. For instance, Rashdan et al. [12] conducted active wideband channel sounding measurements at a carrier frequency of 5.2 GHz. Choi et al. [13] conducted channel measurements at the band of 5.86–5.91 GHz in an Intelligent Transportation System (ITS) under various railroad scenarios. In [14,15,16], active channel measurements were carried out in the millimeter-wave band.
Passive channel measurement has exhibited many advantages. Firstly, compared with active channel measurement, only a receiver needs to be designed in passive channel measurement platform since commercial BSs can be used as transmitters which are able to transmit downlink reference signals periodically. Secondly, by utilizing passive measurement platforms, the channel measurement can be carried out in various scenarios once the 5G commercial networks are deployed, especially in scenarios where the active channel measurements are not convenient to be implemented. Thirdly, as the passive measurement platform receives wireless signals from commercial BSs, the channel measurement results can characterize the actual wireless propagation environment experienced by commercial user equipment (UE). Thanks to the above-mentioned advantages, passive channel measurements have been extensively conducted based on different mobile communication networks such as Universal Mobile Terrestrial System (UMTS), Long Term Evolution (LTE), and 5G networks. Cai et al. [17] carried out channel measurement campaign for subway scenarios by utilizing passive channel measurement platform designed based on the UMTS network. Based on the LTE network, passive channel measurements were carried out for high-speed railway scenarios in [18,19]. Wu et al. [20] proposed a passive sounding system and conducted field measurements with the 5G commercial network. Nevertheless, the field measurements were conducted in stationary scenarios including industrial park and parking lot, while the dynamic scenarios were not considered.
To sum up, although much research has been conducted on the V2X channels and 5G channel measurements, there are still insufficient studies on the 5G NR V2I channels. The propagation characteristics of the 5G NR V2I channels are unique due to the joint influence of the 5G networks and V2I communication scenarios. Consequently, the 5G NR V2I channels should be investigated sufficiently. As mentioned above, passive measurement methods based on 5G commercial networks can obtain more accurate 5G channel characteristics, which is also available for the 5G NR V2I channel studies. Although passive measurement methods based on 5G commercial networks have been proposed in the existing literature [20], channel measurements for the dynamic V2I communication scenarios have not been carried out yet.
To deeply study the 5G NR V2I communication channel, in this paper, we propose a passive channel measurement platform based on the 5G commercial network and then carry out channel measurement for V2I communications in typical urban scenarios. The 5G passive channel measurement platform is designed based on software defined radio (SDR) devices and commercial UE due to the reduced cost [21]. Firstly, the 5G downlink reference signals and signaling information periodically transmitted by commercial BSs in 5G networks is collected. Then, we extract the 5G downlink reference signals and generate standard transmitted signals based on the signaling information received by the commercial UE. Finally, the CIR can be computed by utilizing the 5G downlink reference signals and the standard transmitted signals. Based on the CIR, the small-scale channel fading characteristics, including the power delay profile (PDP), the number of multipaths, the delay spread of multipaths, and the Ricean K-factor, can be analyzed. These channel characteristics can be used for wireless system simulators and performance analysis, e.g., capacity calculation and coverage prediction.
The rest of this paper is organized as follows. In Section 2, a detailed introduction to the 5G passive channel measurement platform is presented in terms of platform composition, measurement waveforms, platform algorithms, and platform validation. In Section 3, we describe the channel measurement scenarios and setup in V2I communication measurement, and provide the analysis results of the channel characteristics. Finally, the conclusion is drawn in Section 4.

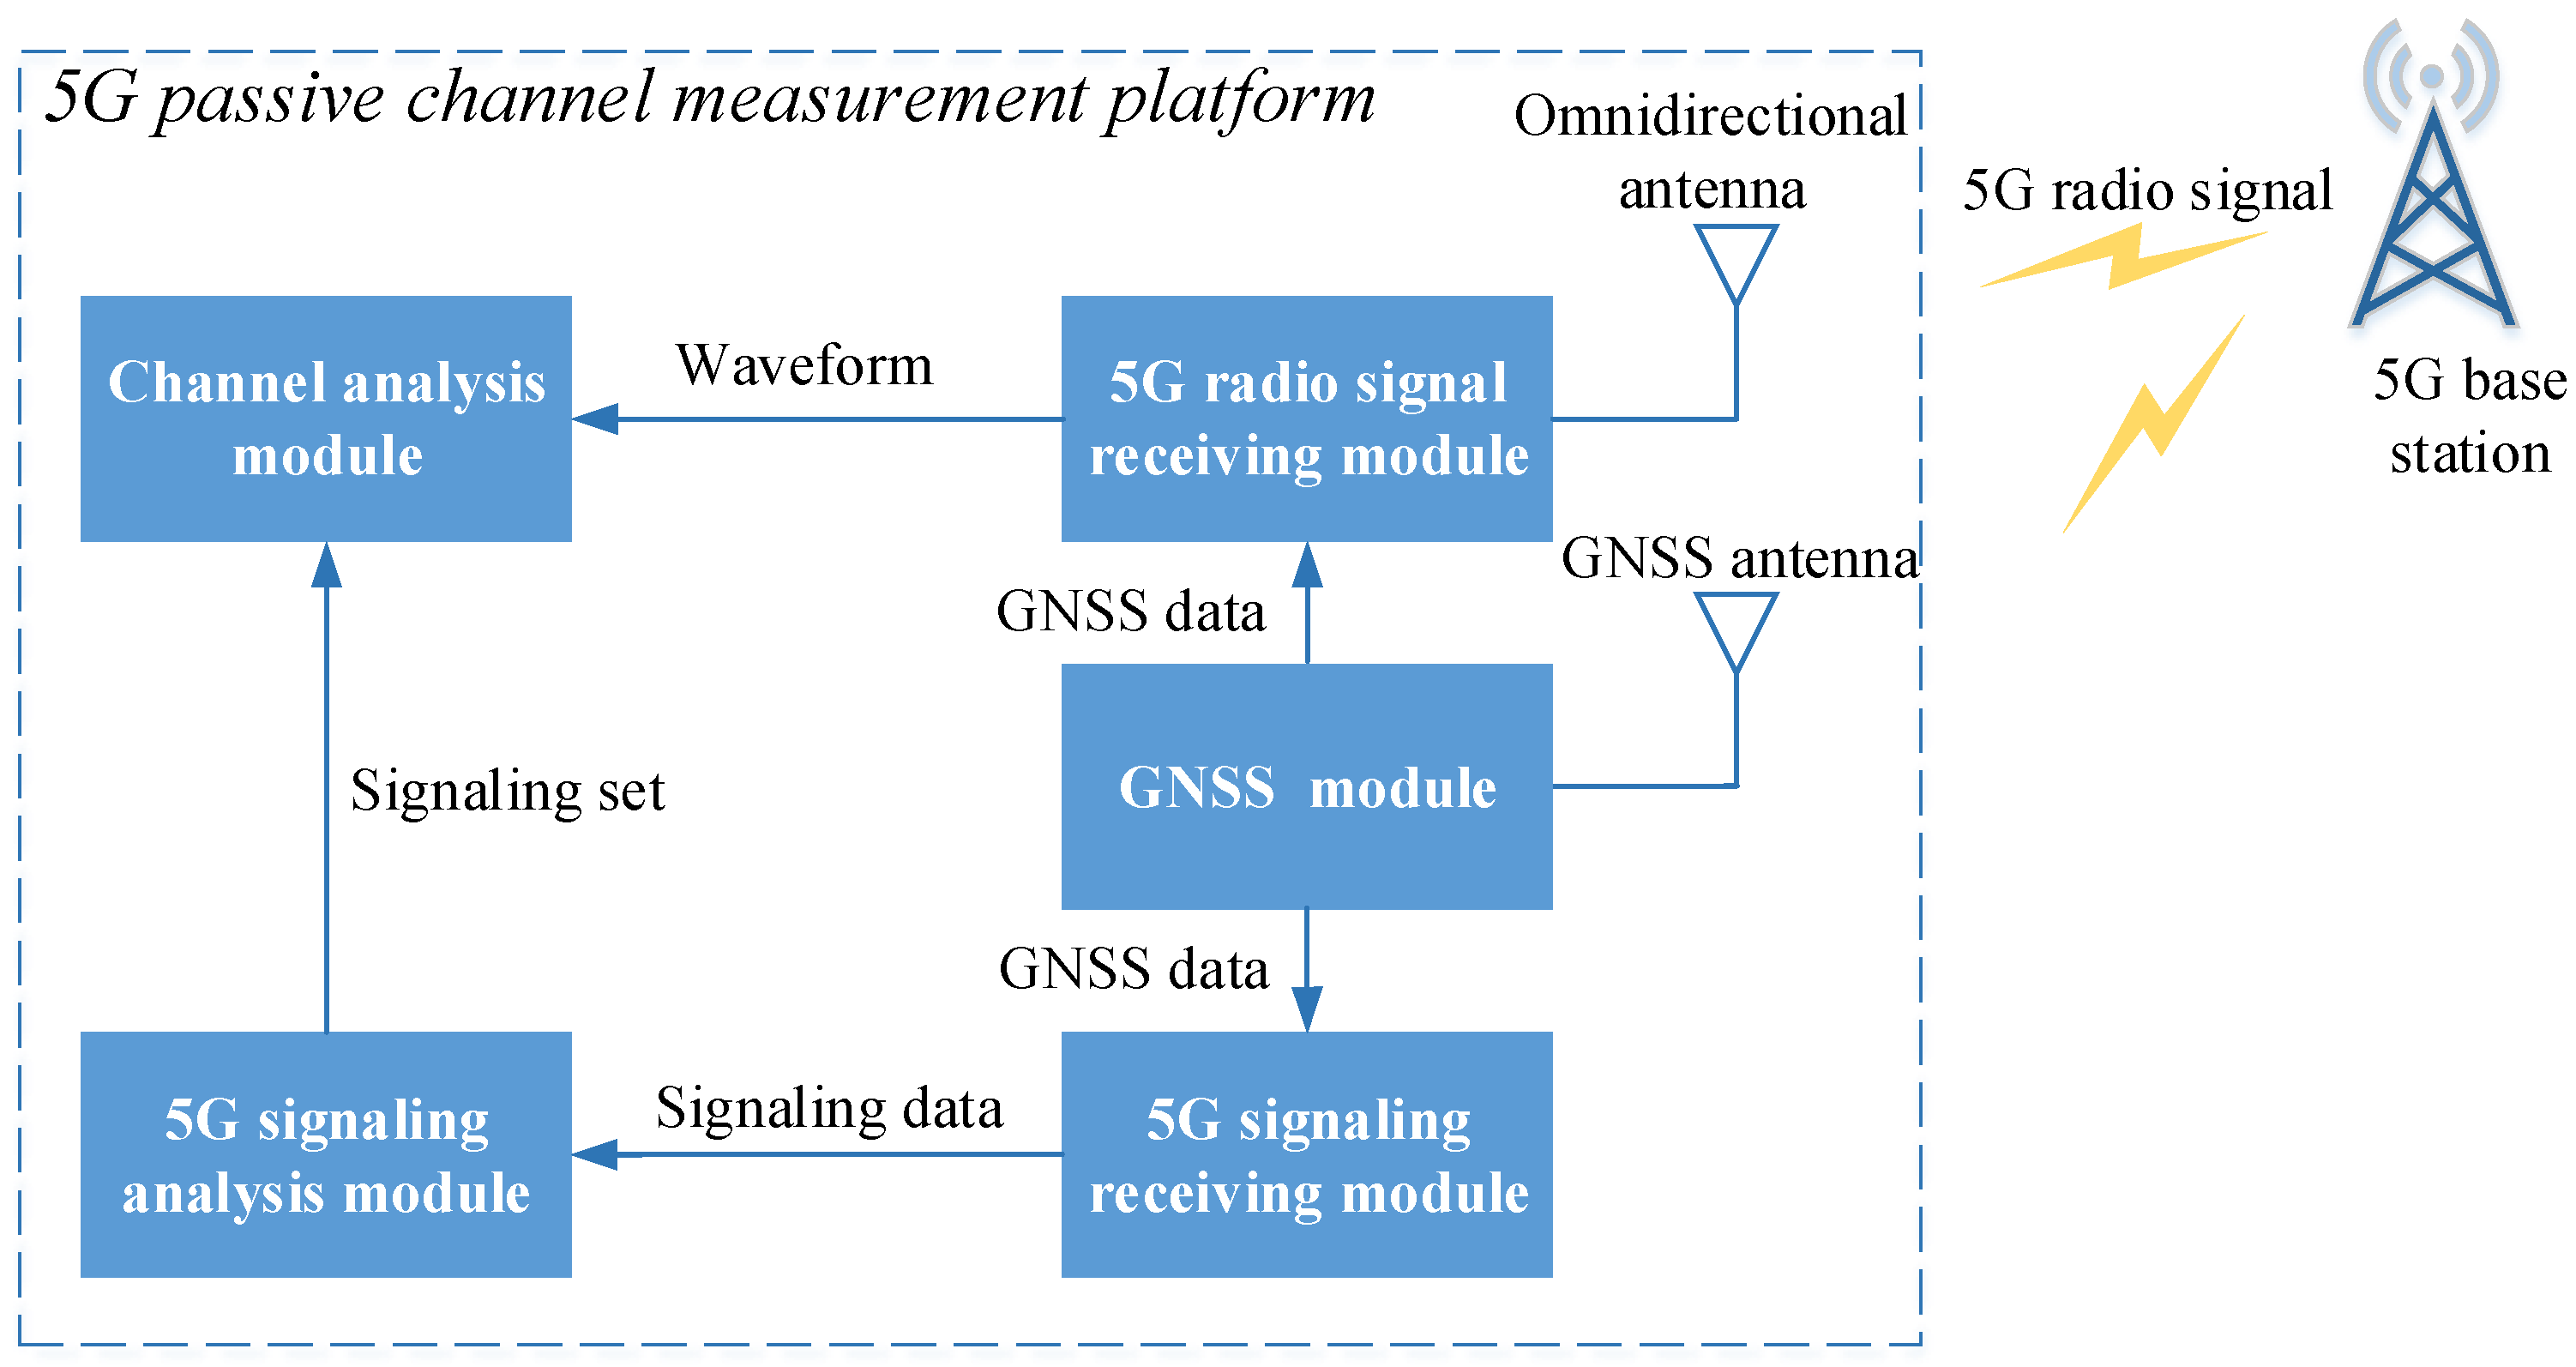
2. 5G Passive Channel Measurement Platform

Aiming to express the design process of the 5G passive channel measurement platform, in this section, we describe the platform composition, measurement waveforms, related algorithms, and platform validation in details.

2.1. Structure of Measurement Platform

As shown in Figure 1, the 5G passive channel measurement platform is mainly composed of 5G signal receiving module, channel analysis module, 5G signaling receiving module, 5G signaling analysis module, and global navigation satellite system (GNSS) module. The 5G signal receiving module captures the 5G downlink signals and transmits the corresponding baseband signals to the channel analysis module. The 5G signaling receiving module collects and saves signaling information in time. Then, the signaling information is forwarded to the 5G signaling analysis module. Based on the signaling information, the 5G signaling analysis module extracts configuration parameters and transmits to the channel analysis module. By using the previous baseband signal and the configuration information, the channel analysis module computes the CIR and analyzes the channel characteristics. Additionally, the GNSS module can obtain the geographical information and time stamp which are indispensable for the dynamic channel measurement.
The 5G signal receiving module is designed based on an SDR device which can receive the radio signal with the maximum bandwidth of 200 MHz and the frequency range from 10 MHz to 7.2 GHz. Furthermore, a 5G commercial user equipment installed with a signaling capturing software is used as the 5G signaling receiving module. The channel analysis module and the 5G signaling analysis module are designed based on high performance computing devices and installed with channel analysis software and signaling parsing software, respectively. The channel analysis software which realizes the measurement algorithm described in Section 2.3 is the most important component of the proposed 5G passive channel measurement platform. The GNSS module is equipped with a dedicated GNSS antenna, and an omnidirectional antenna is used as the radio signal receiving antenna.

2.2. Measurement Waveform

The channel state information reference signal (CSI-RS) is a type of downlink reference signal defined in 3GPP standards, which is used for time-frequency tracking, channel state information calculation, and the measurements of received reference signal power, signal-to-noise and interference ratio [22]. Due to various functions, the time-frequency domain resource occupations of the CSI-RS are different. As a type of the CSI-RS, the tracking reference signal possesses large bandwidth, small subcarrier spacing and short transmitting period. Thus, it is suitable to act as the measurement waveform. In the following, the CSI-RS refers to the tracking reference signal.
The performance of the channel measurement platform highly depends on the time-frequency resource occupation of the CSI-RS. To determine the time-frequency resource occupation of the CSI-RS in an actual 5G commercial network, we collect the signaling information transmitted from a 5G commercial BS by using the 5G signaling receiving module. Then, the major CSI-RS related signaling parameters and values are parsed and shown in Table 1. There are four sets of signaling and the main difference among them is the time domain locations. A common slot contains fourteen Orthogonal Frequency Division Multiplex (OFDM) symbols and the time domain location is defined as the number of the first OFDM symbol of the CSI-RS in one slot. The CSI-RS can be mapped to the time-frequency resource grid according to the signaling information and the CSI-RS generation rules described in [23].
By taking the CSI-RS signaling information displayed in Table 1 as an example, we study the time-frequency resource occupation of the CSI-RS and analyze the channel measurement performance. The CSI-RS layout in the time-frequency resource grid is illustrated in Figure 2. According to the 100 MHz bandwidth and 30 kHz subcarrier spacing configuration, each OFDM symbol contains a maximum of 272 resource blocks (RBs) [23]. For clarity, the subcarrier occupation of the CSI-RS in one RB is given in Figure 2, while the subcarrier occupation of the CSI-RS in the remaining RBs is the same as the first RB. In the frequency domain, since the frequency domain density is set to 3, the CSI-RS occupies one subcarrier in every four subcarriers. In other words, the subcarrier spacing of the CSI-RS is 30 kHz × 4 = 120 kHz. In the time domain, the four sets of the CSI-RS signaling are transmitted every 40 time slots, and occupy the fourth and eighth OFDM symbols in the 25th and 26th time slots, respectively. According to [23], when the subcarrier interval is 30 kHz, 40 time slots last 20 ms in total.
The major performance metrics of channel measurement include multipath resolution, multipath delay window, channel sampling rate, etc. The multipath resolution is the inverse of the measured signal bandwidth, which determines the minimum propagation delay difference or path difference of the distinguishable multipath components. Since the bandwidth of the CSI-RS is 100 MHz, the multipath resolution reaches 10 ns and the minimum distinguishable difference between two paths is 3 m. The subcarrier interval of the CSI-RS reference signal is 120 kHz, which determines the length of the multipath delay window, i.e., (1/120,000) ∗ 106 = 8.33 μs. The length of the multipath delay window should be greater than the sum of the maximum multipath delay and the transceiver propagation delay. The channel sampling rate determines the measurement ability of the maximum Doppler shift, which must be greater than twice the maximum Doppler shift. Since the channel sampling interval is 20 ms, a maximum Doppler shift of 25 Hz can be measured.

2.3. Measurement Algorithm

As the CIR can describe all characteristics of a channel, it is the basis for the channel characteristic analysis. To obtain the CIR, two processes of CSI-RS signal extraction and standard CSI-RS signal generation are necessary. In Figure 3, we illustrate these two processes designed according to the 3 GPP NR 38 series specifications [23].
The CSI-RS signal extraction process can be further divided into four steps: (1) primary synchronization signal (PSS) search and frequency offset correction; (2) secondary synchronization signal (SSS) search; (3) physical broadcast channel (PBCH) demodulation and decoding; and (4) CSI-RS signal extraction. The four steps are illustrated in detail in the following. Firstly, the primary cell ID ( N I D 2 ) and the secondary cell ID ( N I D 1 ) can be obtained by searching the primary and secondary synchronous signals, respectively. Then, we can determine the physical cell identity (PCI) based on N I D 2 and N I D 1 , i.e., N I D C e l l = 3 × N I D 1 + N I D 2 . Next, PBCH demodulation and decoding is implemented and the Master Information Block (MIB) can be obtained. By using the MIB, the full-band OFDM demodulation for the received waveform can be carried out. Finally, we can obtain the resource grid of the received waveform and extract the corresponding CSI-RS signal.
The standard CSI-RS signal generation process can also be divided into four steps: (1) radio resource control (RRC) signaling information parsing; (2) cell signaling information search; (3) CSI-RS signaling information extraction; and (4) standard CSI-RS signal generation. Due to the complexity and variability of the RRC signaling, the RRC signaling information is collected with the help of 5G UE. Once the RRC signaling information is obtained, it is first parsed and arranged based on the PCI. Therefore, the RRC signaling information for a specific cell can be extracted according to the PCI obtained from the CSI-RS signal extraction process. Finally, we can extract the responding signaling information and generate the standard CSI-RS signal.
By using the extracted CSI-RS signal and the generated standard CSI-RS signal according to the above two processes, the channel transfer function (CTF) can be computed. Then, the CIR is obtained based the CTF through inverse Fourier operation. Based on the CIR, the channel characteristics can be analyzed later.

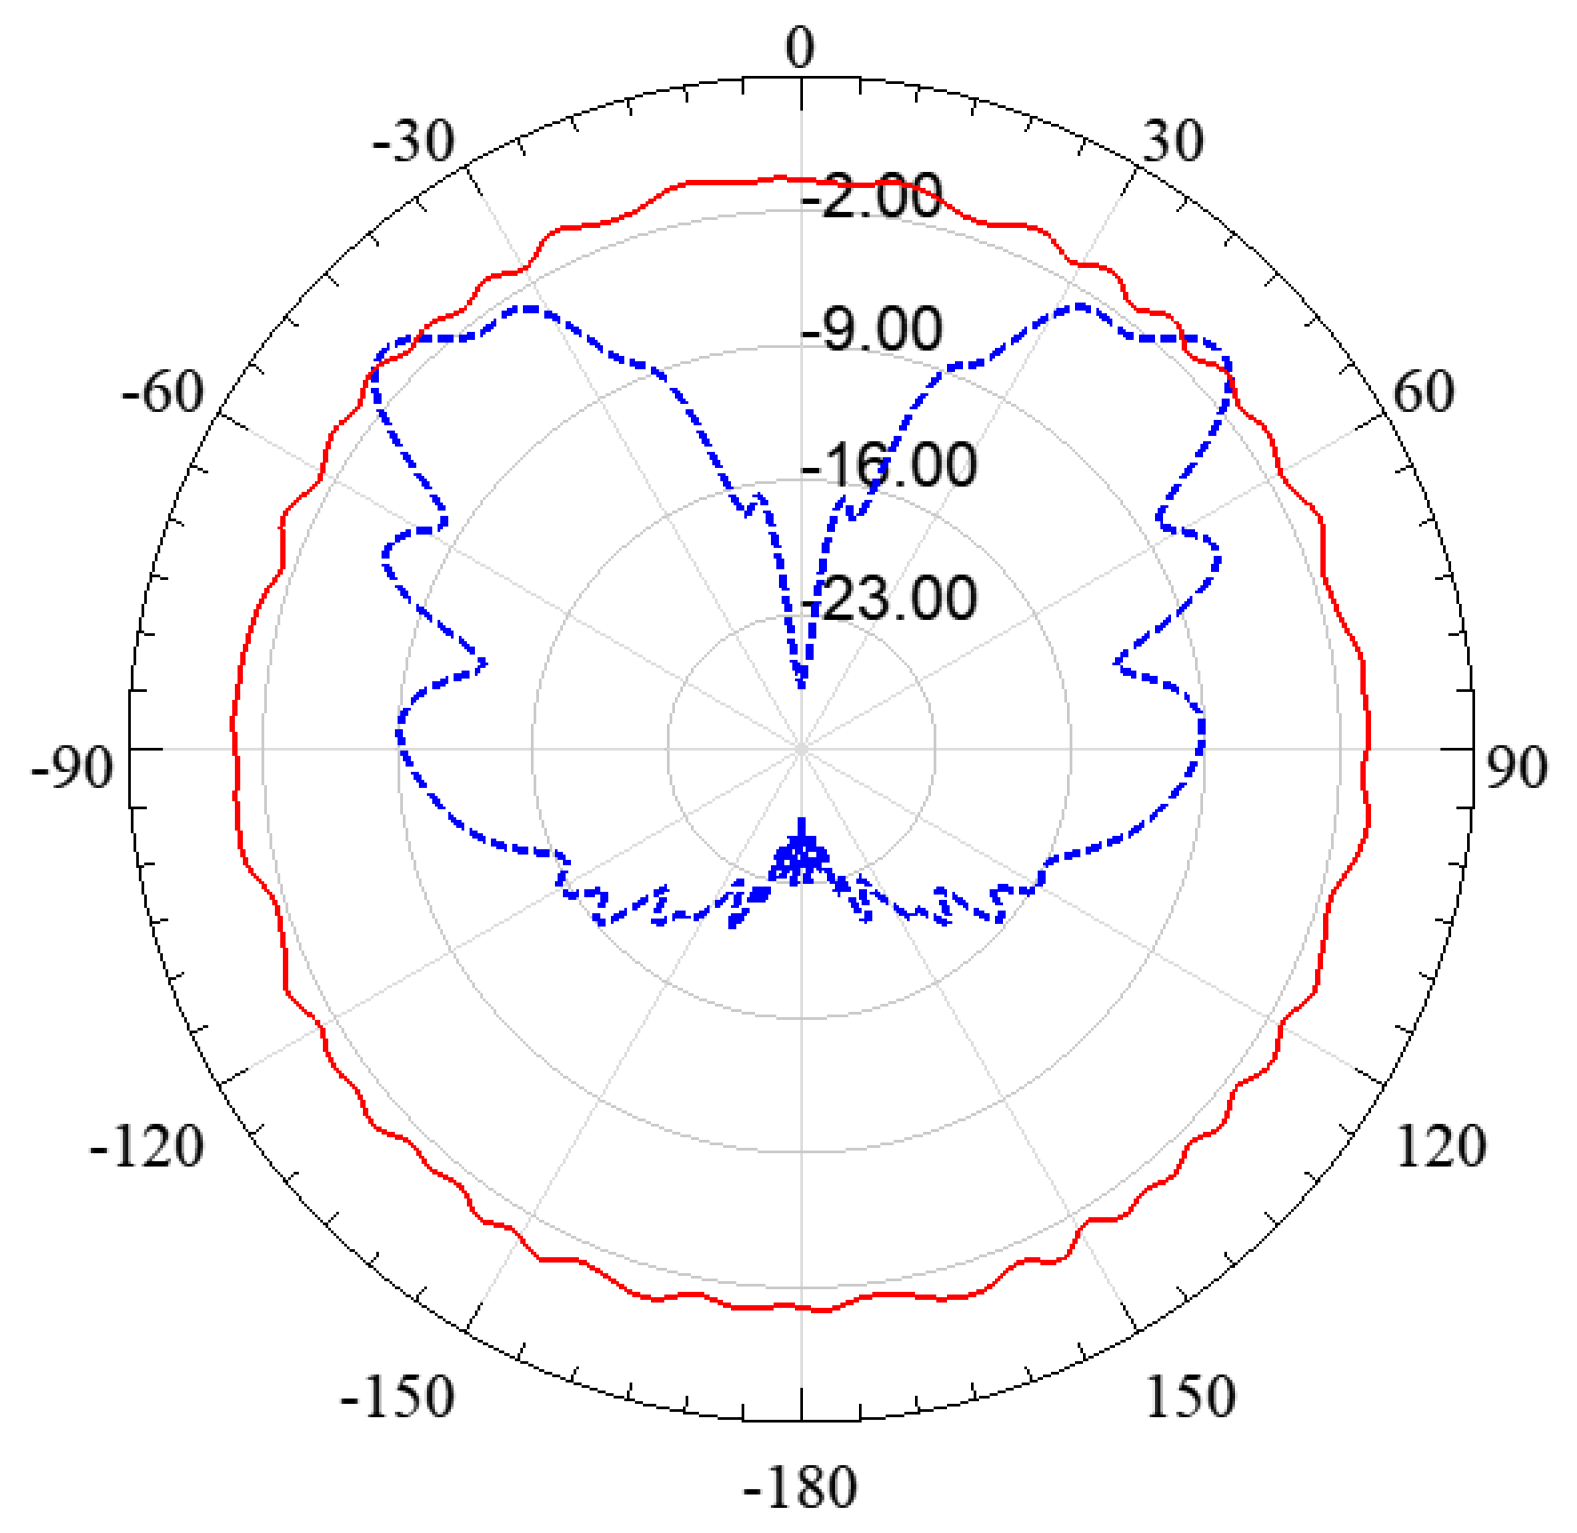
2.4. Platform Validation

For the validation of the proposed 5G passive channel measurement platform, we firstly conduct the channel measurement in a lab where the commercial 5G network is deployed. The channel measurement data is collected by using the 5G passive channel measurement platform and the CIR is computed according to the above measure algorithm. Then, the PDPs computed based on CIRs are shown in Figure 4. From Figure 4, the channel measurement ability of the proposed 5G passive channel measurement platform is verified.

3. Field Measurements

By using the 5G passive channel measurement platform, we carry out wireless channel measurement for V2I communications in typical urban scenarios where the 5G commercial networks are deployed by a Chinese internet service provider. In this section, we firstly illustrate the measurement scenarios and devices. Then, the statistic results of the channel characteristics, such as the PDP, the number of multipaths, the delay spread of multipaths, and the Ricean K-factor, are analyzed. The measurement parameters are presented in Table 2.

3.1. Measurement Scenarios and Setup

The typical urban scenario for channel measurement is shown in Figure 5. In this scenario, a complicated radio propagation environment is formed by interaction objects including higher buildings, lower buildings, urban parks, high-speed railway, train garage, and so forth. The measurement vehicle carrying the measurement devices departs from the vicinity of the transmitting BS and travels along a city road in a direction away from the transmitting BS at almost the same speed of 40 km/h, and the trajectory is plotted by using the coverage intensity of the received reference signal power in Figure 5. Because of the effects of buildings and plants, the measurement environments consist of both the line of sight (LoS) and non-line of sight (NLoS) cases. In addition to the main path, the measurement receiver may also receive other multipath components composed of different reflected scattering radio waves. The height of the antenna in the transmitting BS is 30 m. The distance between the transmitting BS and the measurement vehicle varies from 160 m to 1500 m.
In this measurement campaign, we utilize an off-road vehicle which is equipped with the measurement devices, as shown in Figure 6. An omnidirectional whip antenna is installed on the roof of the measurement vehicle with a height of 1.7 m above the ground to minimize the multipath effect produced by the vehicle. The maximum antenna gain of the measurement antenna is 8.13 dB and the normalized radiation patterns are shown in Figure 7. The red line represents the azimuth angle, and the blue line represents the zenith angle. The other measurement devices are equipped in the vehicle according to the measurement requirements, including a signal receiver, a high-performance computing equipment, a GNSS module, and 5G commercial UE. For the convenience of carrying, the signal receiver and the high-performance computing equipment are integrated in one case, as shown in Figure 6. During the measurements, we used inverters and uninterruptible power supplies (UPS) to provide power to the measurement devices. The inverter is connected to the vehicle’s 12 V DC battery and outputs 220 V AC.

3.2. Channel Characteristics Analysis

In this section, the small-scale channel fading characteristics for V2I communications in typical urban scenarios are analyzed, including the PDP, the number of multipaths, the delay spread of multipaths, and the Ricean K-factor. The channel characteristics are estimated according to the methods used in [24].

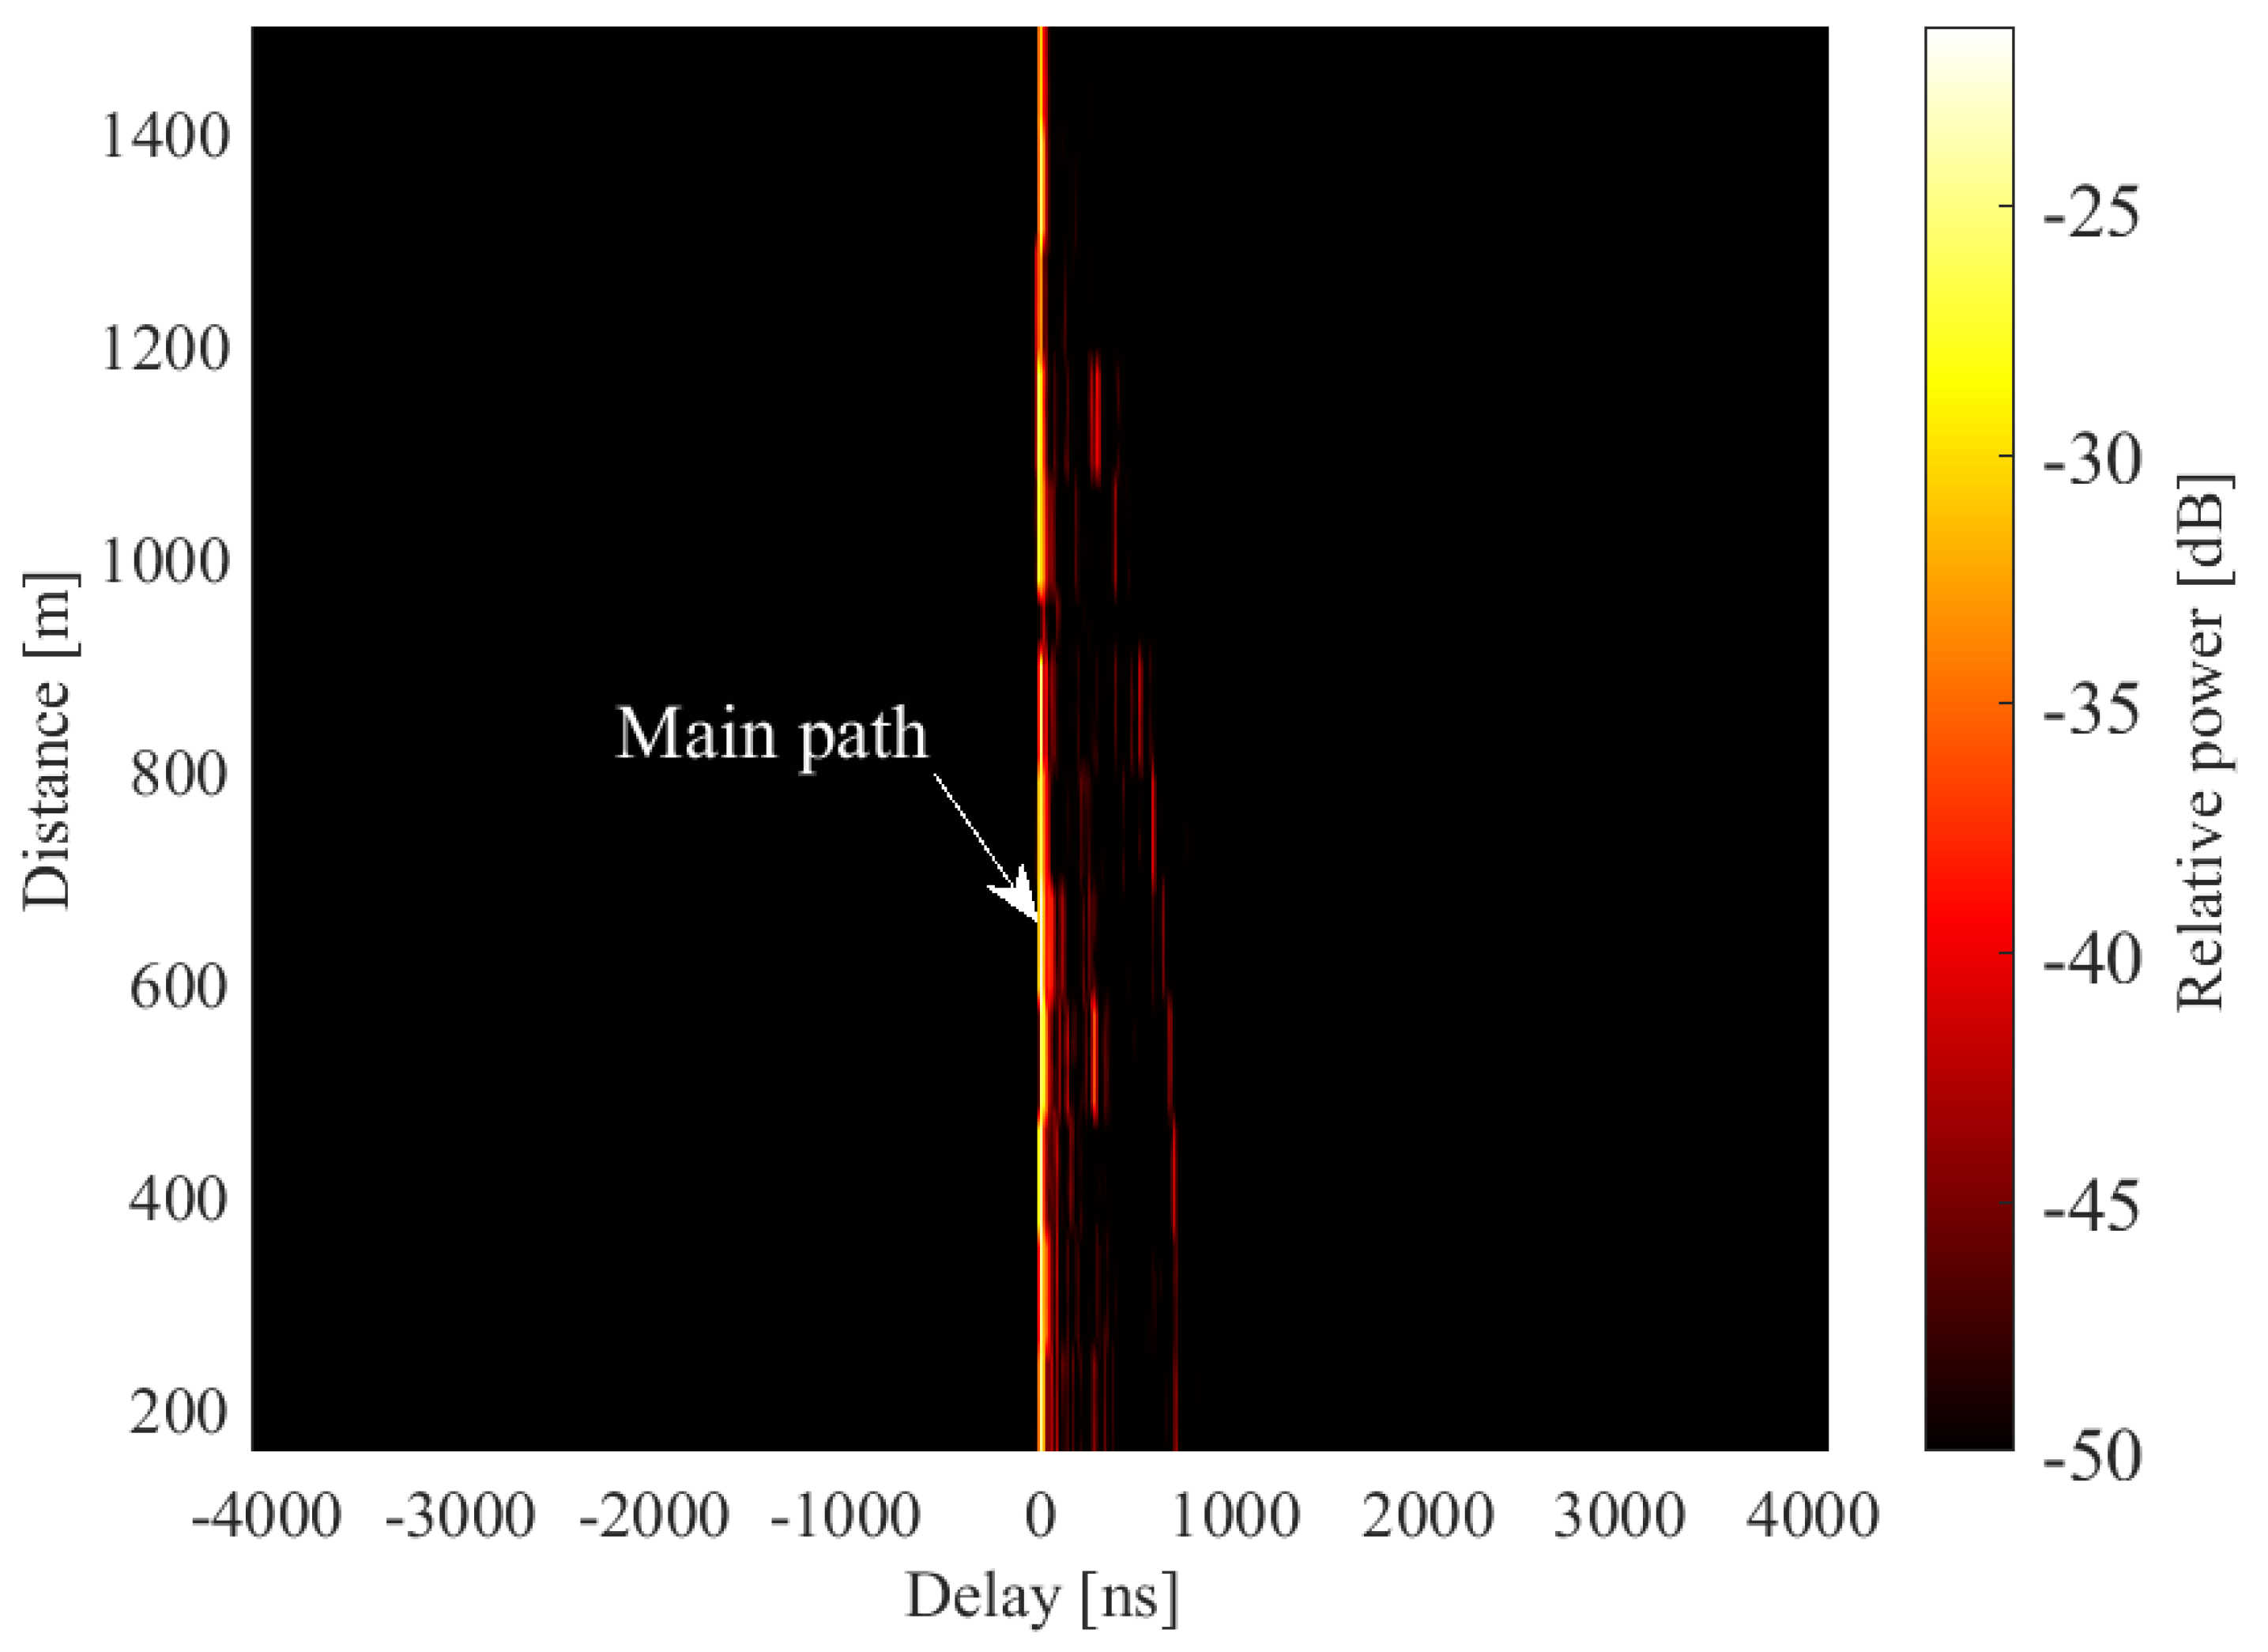
3.2.1. Power Delay Profile Analysis

The variation in the PDP with an increasing distance between the transmitter and receiver is shown in Figure 8. Since the receiving waveform is synchronized and the effects of the absolutely delay is dismissed, we focus on the relative delay analysis in this section. For the convenience of observation, the delay of the main path is normalized. As shown in Figure 8, the number of the multipath components other than the main path significantly diminishes with the increasing of the distance between the transmitter and receiver. This can be explained by the fact that there are more multipath components when the transmitter and receiver are close due to the reflection and scattering of the radio waves caused by the surrounding plants and buildings. When the receiver is away from the transmitter, the multipath components other than the main path gradually diminish since the number of the interaction objects decreases.

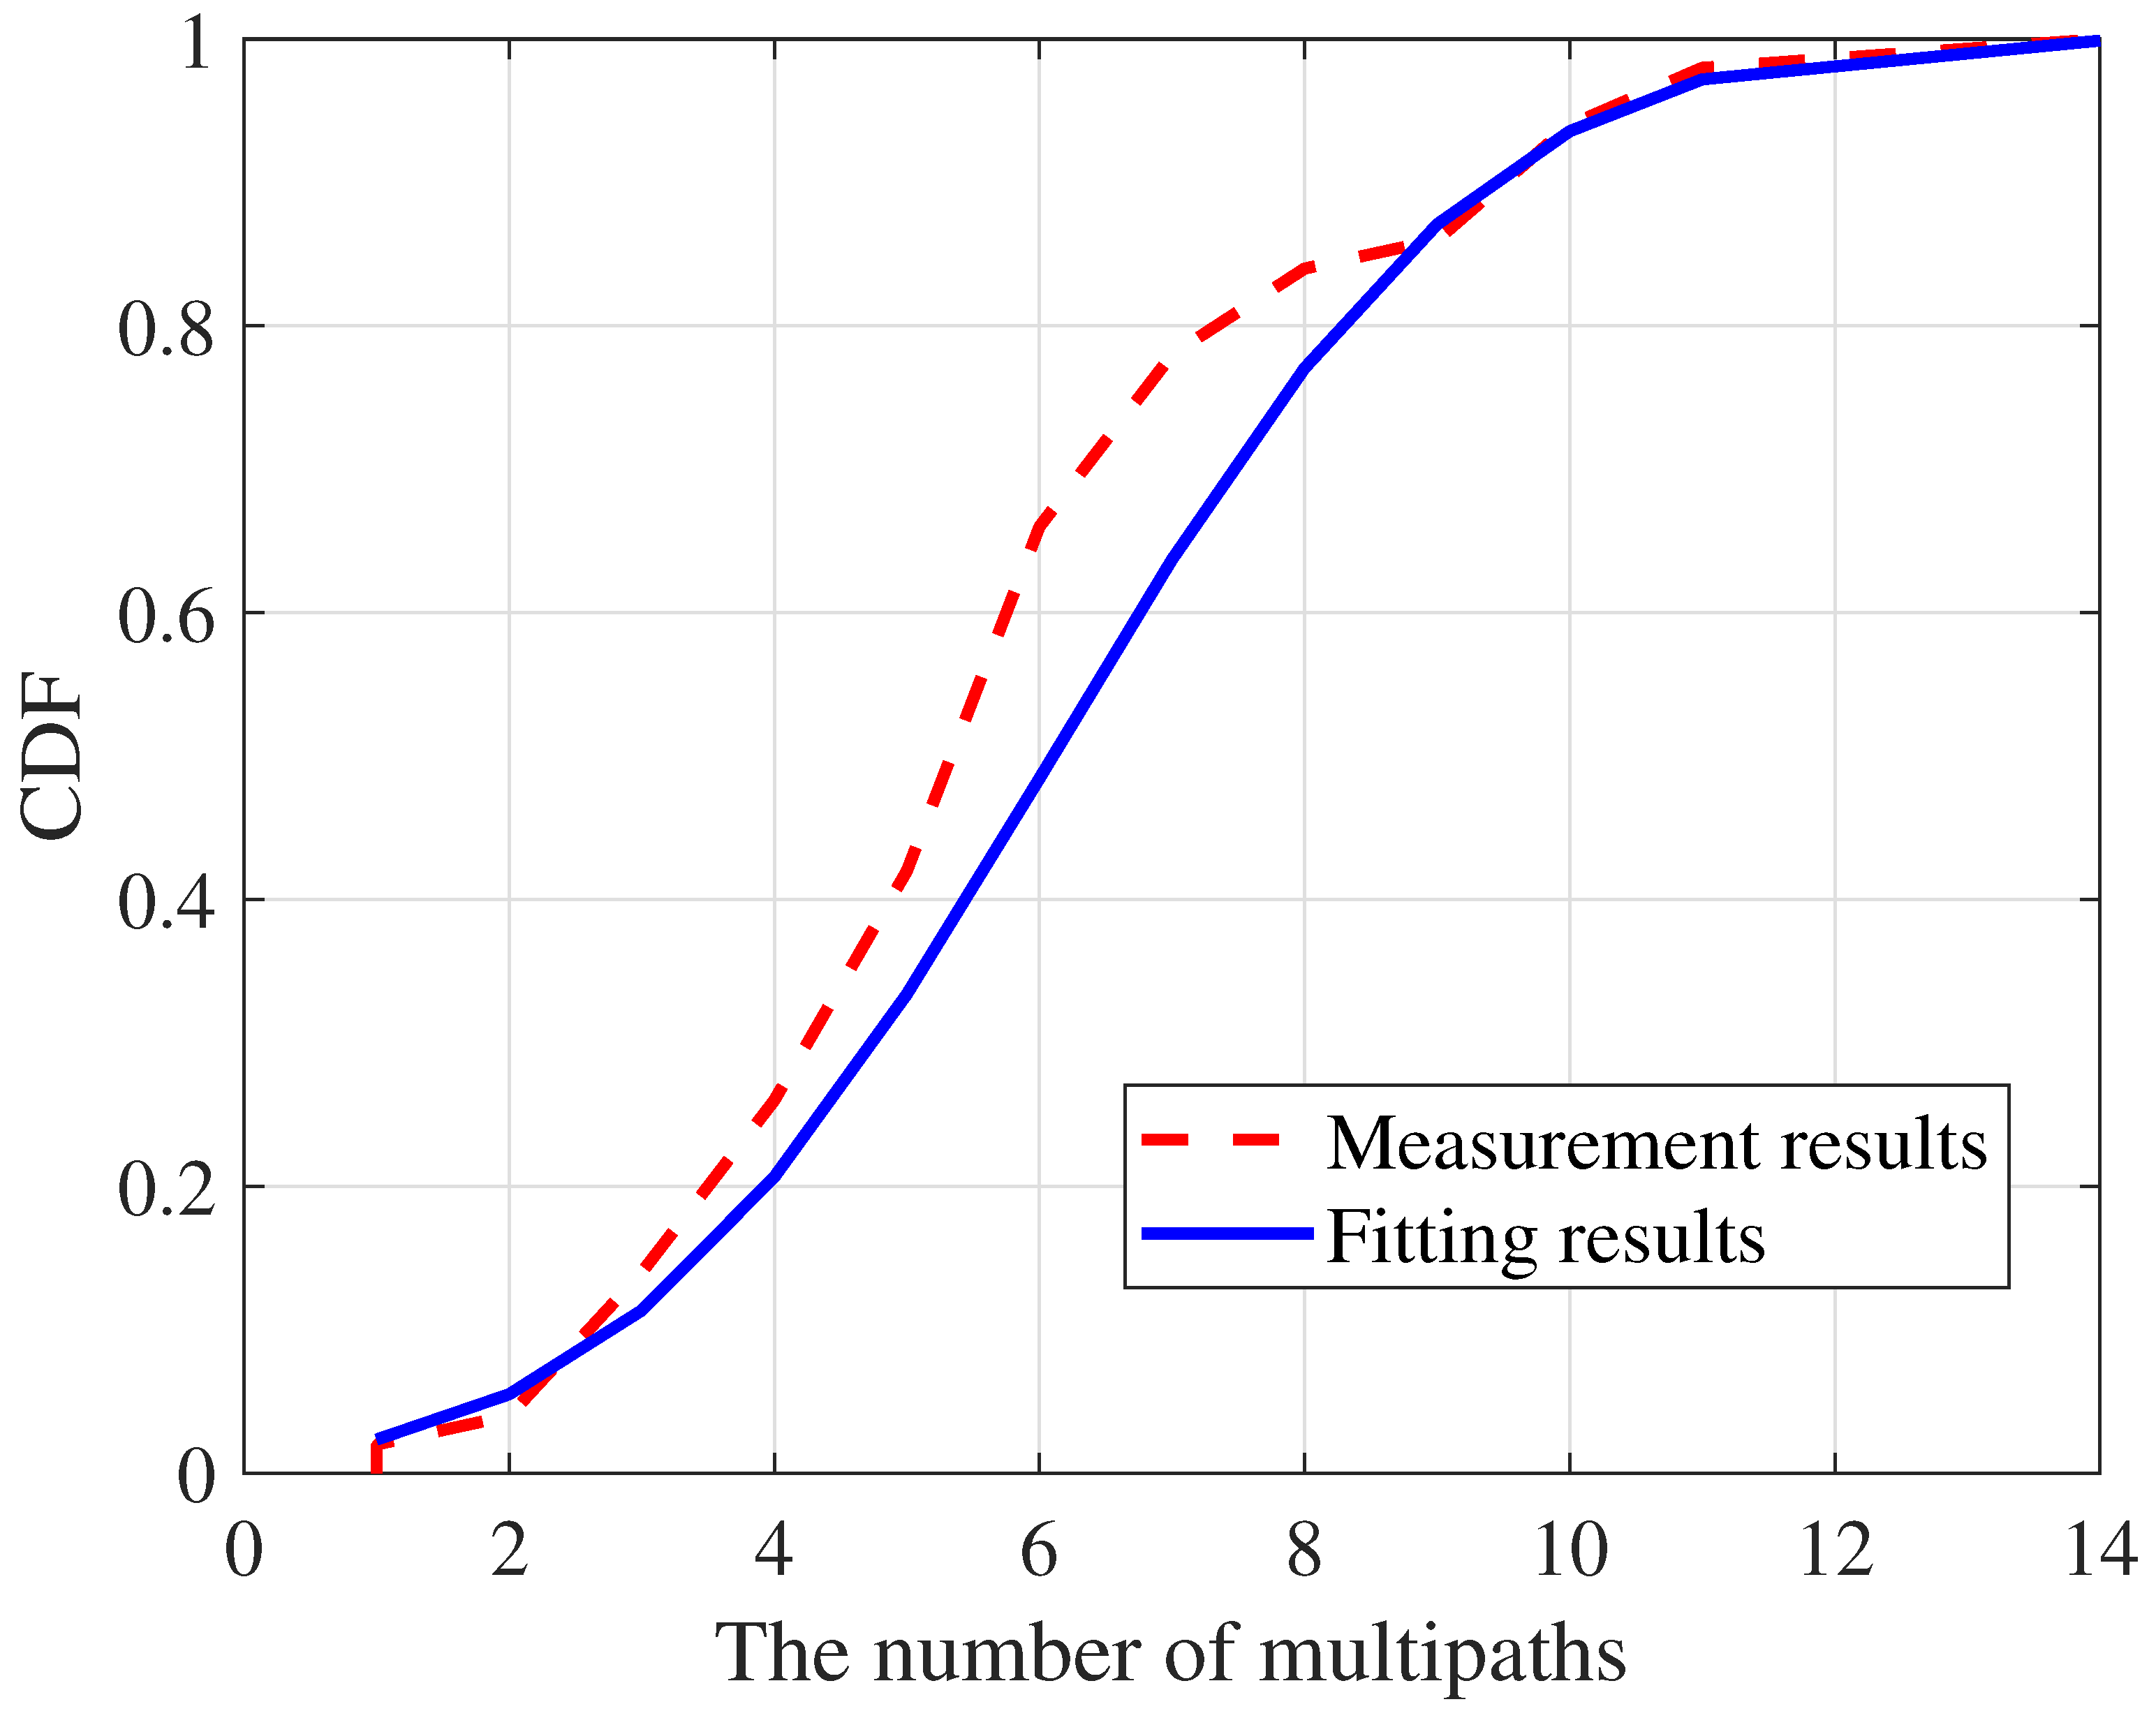
3.2.2. Analysis of the Number of Multipaths

The variations in the number of multipaths with distance and the linear fitting results are shown in Figure 9. The number of multipaths gradually decreases as the distance increases, which is consistent with the results in Figure 8. Specifically, the cumulative distribution function (CDF) of the number of multipaths is shown in Figure 10 and the statistic results are provided in Table 3. The number of multipaths follows a normal distribution with the mean of 6 and the standard deviation of 2.57. In the measurement range, the number of multipaths is less than 9, with a probability of 90%.

3.2.3. Delay Spread Analysis

The root mean square (RMS) delay spread for the urban V2I communications environment is a crucial radio channel characteristic for vehicle communication systems and considered in this investigation. The CDF of the RMS delay spread of multipaths is shown in Figure 11, and the statistical results are provided in Table 4. The RMS delay spread can be well modeled by the normal distribution. To be specific, the mean valve of the RMS delay spread is 77.6 ns and the standard deviation is 23.14 ns. In the measurement range, the RMS delay spread is less than 99.8 ns with the probability of 90%. The analysis results are consistent with the measured results presented in [24], i.e., 50.04–82.13 ns for an urban vehicle communication environment. This consistency verifies the accuracy of the proposed 5G passive channel measurement platform.

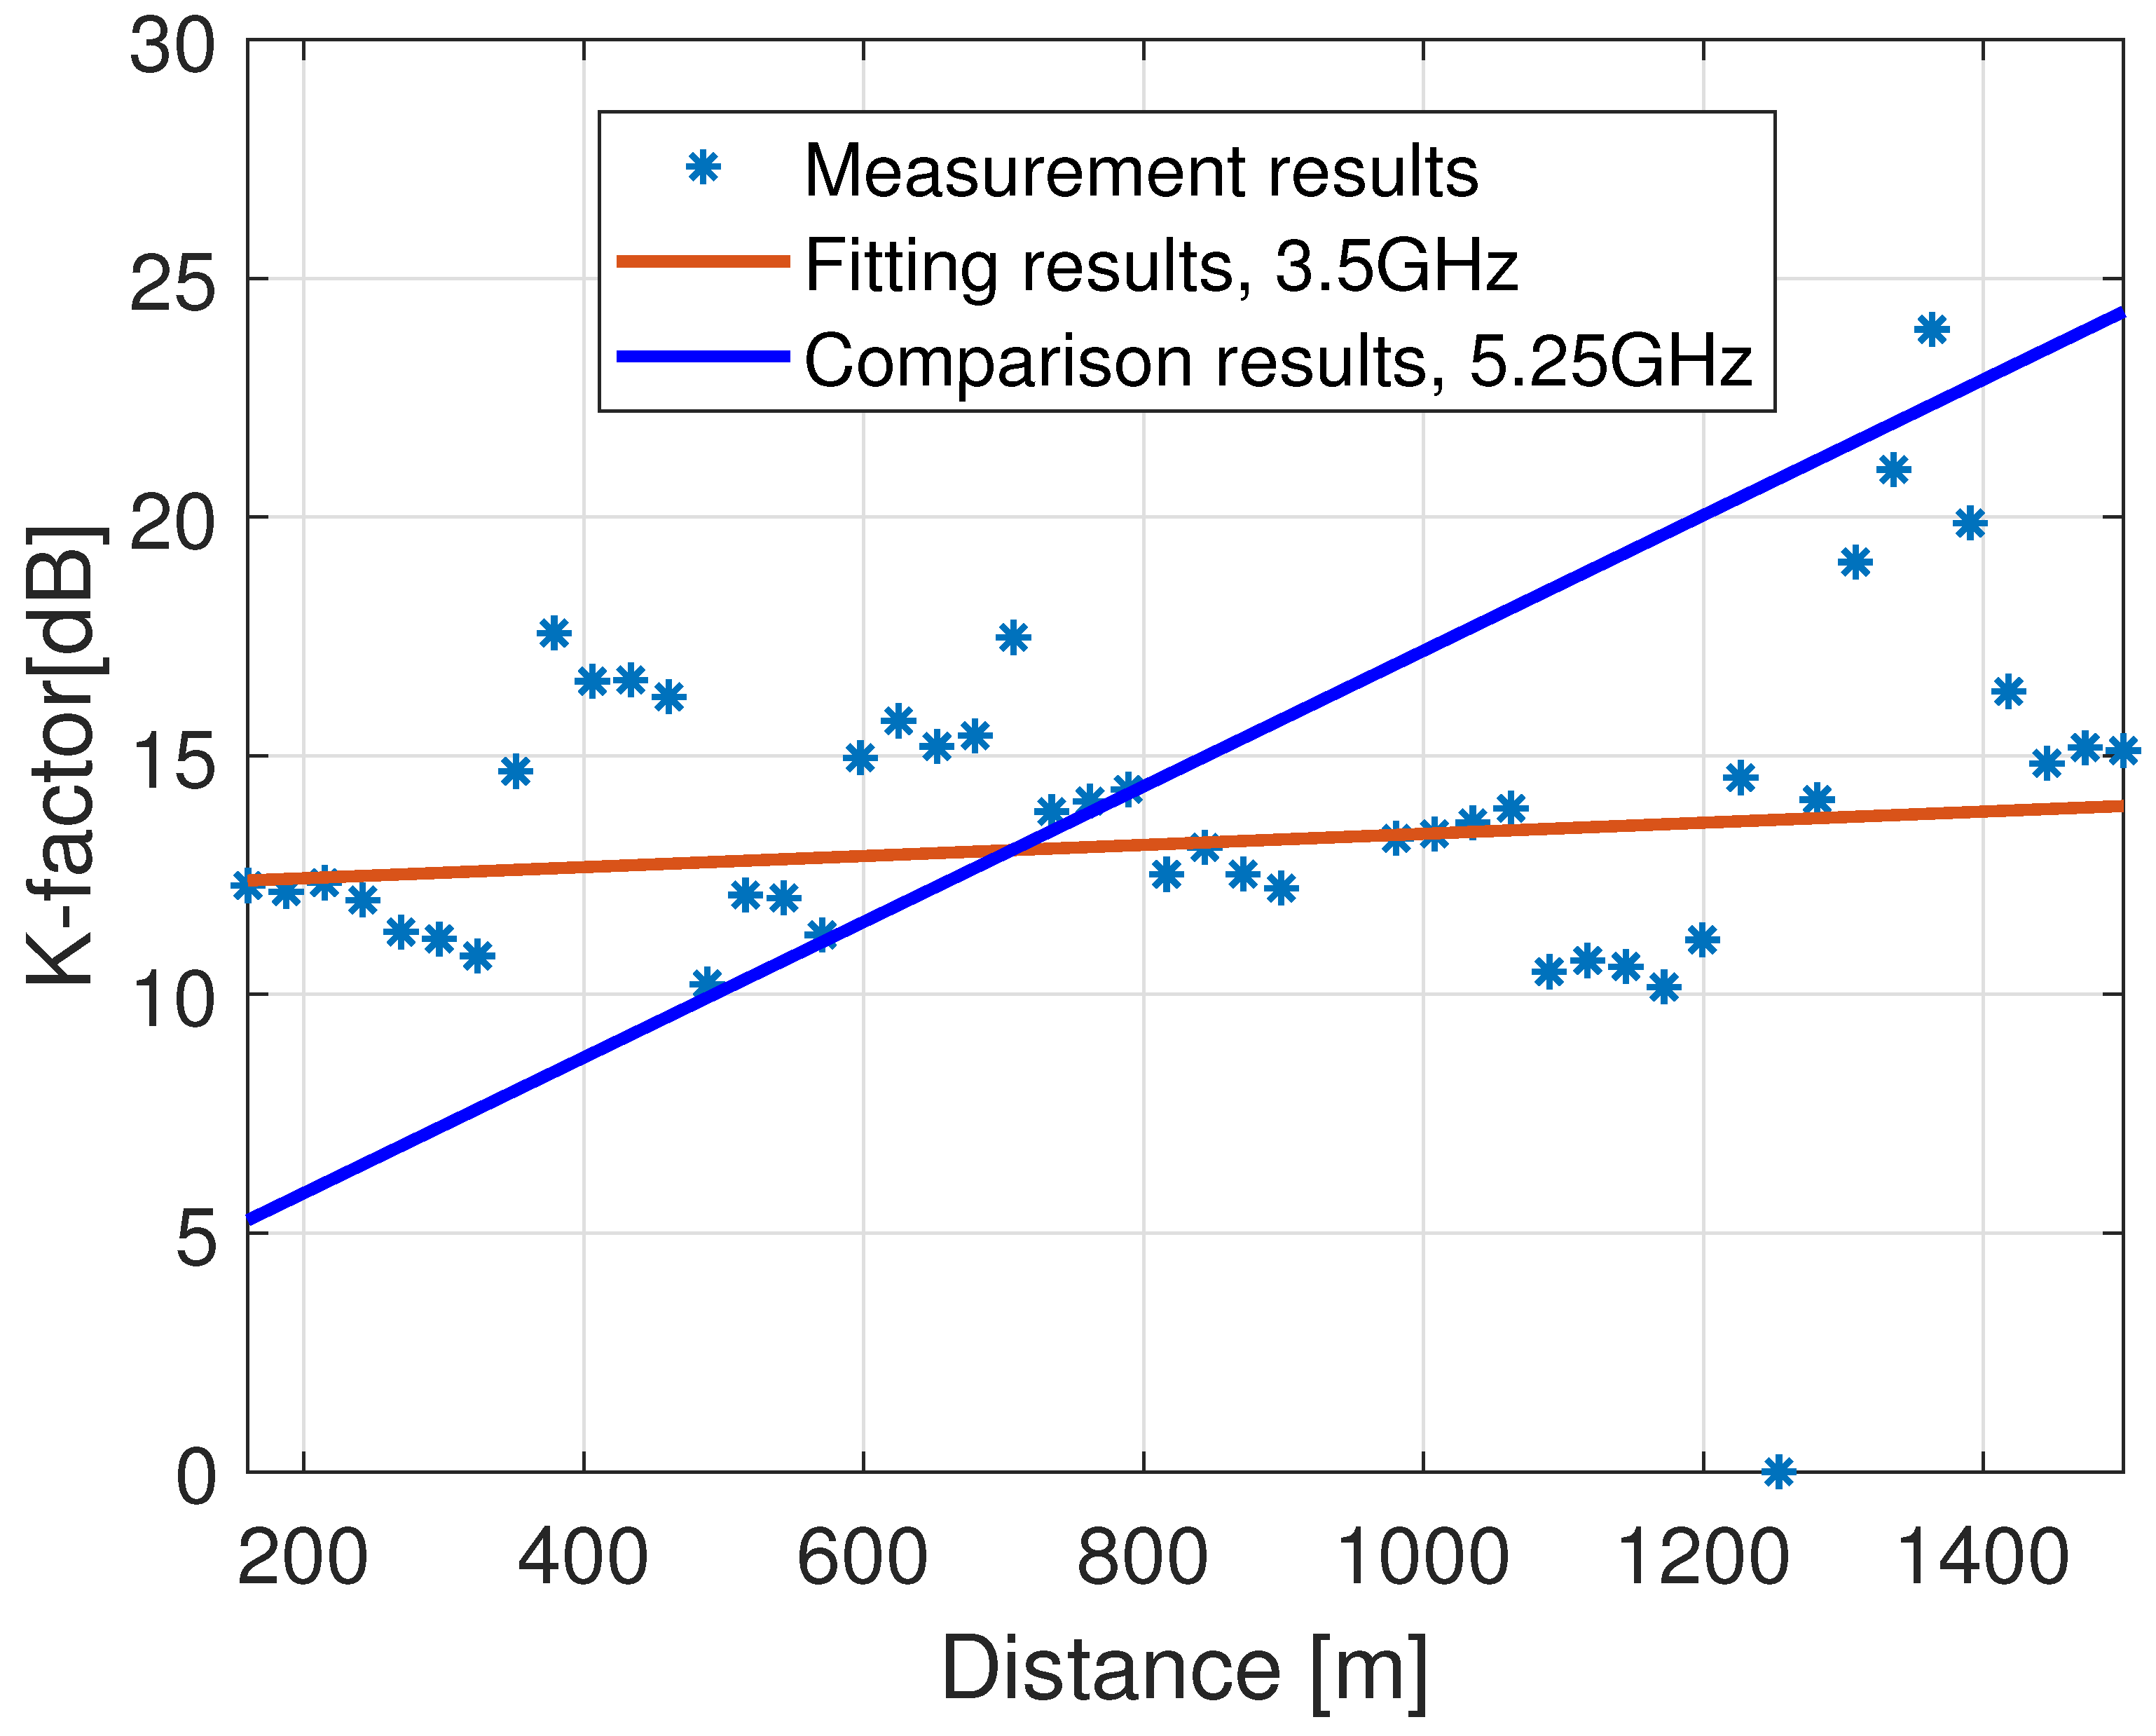
3.2.4. Ricean K-Factor Analysis

Due to the abundant LoS links in the measurement scenarios, the Ricean distribution is used to characterize the statistical variations in small-scale fading. The measurement Ricean K-factor with distance and the fitting results are shown in Figure 12. Moreover, the comparison results cited from the existing results working at the band of 5.25 GHz for urban environment [4] are also presented to validate the reasonability of the measurement results. We find that the Ricean K-factor increase with distance in both the measurement fitting results and the comparison results. The CDF of the Ricean K-factor is shown in Figure 13, and the statistic results are provided in Table 5. The Ricean K-factor follows a normal distribution with a mean value of 13.38 dB and a standard deviation of 3.31 dB. In the measurement range, the Ricean K-factor is less than 16.8 dB with the probability of 90%.

4. Conclusions

In this paper, we have proposed a passive channel measurement platform, which is designed based on commercial 5G networks. The downlink reference signals and signaling information transmitted by the 5G base station are collected first. Then, the CSI-RS signal is extracted from the receiving radio signals and the standard CSI-RS signal is generated based on the signaling information. Finally, the CIR can be obtained by using the extracted CSI-RS signal and the generated standard CSI-RS signal. The 5G passive channel measurement platform is used to carry out wireless channel measurements for V2I communications in typical urban scenarios. Then, we generate the CIR based on the channel measurement data. The channel characteristics such as the PDP, the number of multipaths, the delay spread of multipaths, and the Ricean K-factor are further analyzed and the statistical results of the channel characteristics are presented. The measurement results can be used as a reference when developing the vehicle specific channel and interference models for future vehicle communications.

Author Contributions

Conceptualization, C.C. and D.F.; Methodology, C.C. and P.Z.; Validation, C.C. and P.Z.; Formal analysis, C.C.; Investigation, C.C. and P.Z.; Writing—original draft preparation, C.C.; Writing—review and editing, C.C., D.F. and P.Z.; Supervision, B.A.; Project administration, B.A.; Funding acquisition, B.A. All authors have read and agreed to the published version of the manuscript.

Funding

This research was funded by the Fundamental Research Funds for the Central Universities, China, under grant number 2022JBQY004; in part by the Key Research and Development Program of Zhejiang Province, China, under grant number 2023C01003.

Data Availability Statement

Data are unavailable due to privacy concerns.

Conflicts of Interest

The authors declare no conflict of interest.

References

  1. Garcia, M.H.C.; Molina-Galan, A.; Boban, M.; Gozalvez, J.; Coll-Perales, B.; Sahin, T.; Kousaridas, A. A Tutorial on 5G NR V2X Communications. IEEE Commun. Surv. Tutor. 2021, 23, 1972–2026. [Google Scholar] [CrossRef]
  2. Chatzoulis, D.; Chaikalis, C.; Kosmanos, D.; Anagnostou, K.E.; Xenakis, A. 3GPP 5G V2X Error Correction Coding for Various Propagation Environments: A QoS Approach. Electronics 2023, 12, 2898. [Google Scholar] [CrossRef]
  3. Miao, H.; Zhang, J.; Tang, P.; Tian, L.; Zhao, X.; Guo, B.; Liu, G. Sub-6 GHz to mmWave for 5G-Advanced and Beyond: Channel Measurements, Characteristics and Impact on System Performance. IEEE J. Sel. Areas Commun. 2023, 41, 1945–1960. [Google Scholar] [CrossRef]
  4. Li, W.; Hu, X.; Gao, J.; Zhao, L.; Jiang, T. Measurements and Analysis of Propagation Channels in Vehicle-to-Infrastructure Scenarios. IEEE Trans. Veh. Technol. 2020, 69, 3550–3561. [Google Scholar] [CrossRef]
  5. Eckhardt, J.M.; Petrov, V.; Moltchanov, D.; Koucheryavy, Y.; Kürner, T. Channel Measurements and Modeling for Low-Terahertz Band Vehicular Communications. IEEE J. Sel. Areas Commun. 2021, 39, 1590–1603. [Google Scholar] [CrossRef]
  6. Petrov, V.; Eckhardt, J.M.; Moltchanov, D.; Koucheryavy, Y.; Kürner, T. Measurements of Reflection and Penetration Losses in Low Terahertz Band Vehicular Communications. In Proceedings of the 14th European Conference on Antennas and Propagation (EuCAP), Copenhagen, Denmark, 15–20 March 2020. [Google Scholar]
  7. Li, Y.; Chen, Y.; Yan, D.; Guan, K.; Han, C. Channel Characterization and Ray-Tracing Assisted Stochastic Modeling for Urban Vehicle-to-Infrastructure Terahertz Communications. IEEE Trans. Veh. Technol. 2023, 72, 2748–2763. [Google Scholar] [CrossRef]
  8. Yi, H.; Guan, K.; He, D.; Ai, B.; Dou, J.; Kim, J. Characterization for the Vehicle-to-Infrastructure Channel in Urban and Highway Scenarios at the Terahertz Band. IEEE Access 2019, 7, 166984–166996. [Google Scholar] [CrossRef]
  9. Yang, M.; Ai, B.; He, R.; Chen, L.; Li, X.; Li, J.; Zhang, B.; Huang, C.; Zhong, Z. A Cluster-Based Three-Dimensional Channel Model for Vehicle-to-Vehicle Communications. IEEE Trans. Veh. Technol. 2019, 68, 5208–5220. [Google Scholar] [CrossRef]
  10. Yang, M.; Ai, B.; He, R.; Chen, L.; Li, X.; Huang, C.; Ma, Z.; Zhong, Z.; Wang, J.; Li, Y.; et al. Measurements and Cluster-Based Modeling of Vehicle-to-Vehicle Channels With Large Vehicle Obstructions. IEEE Trans. Wirel. Commun. 2020, 19, 5860–5874. [Google Scholar] [CrossRef]
  11. Yang, M.; Ai, B.; He, R.; Ma, Z.; Mi, H.; Fei, D.; Zhong, Z.; Li, Y.; Li, J. Dynamic V2V Channel Measurement and Modeling at Street Intersection Scenarios. IEEE Trans. Antennas Propag. 2023, 71, 4417–4432. [Google Scholar] [CrossRef]
  12. Rashdan, I.; Müller, F.D.P.; Jost, T.; Sand, S.; Caire, G. Large-Scale Fading Characteristics and Models for Vehicle-to-Pedestrian Channel at 5-GHz. IEEE Access 2019, 7, 107648–107658. [Google Scholar] [CrossRef]
  13. Choi, J.; Ahn, S. A 5.9 GHz Channel Characterization at Railroad Crossings for Train-to-Infrastructure (T2I) Communications. Electronics 2023, 12, 2400. [Google Scholar] [CrossRef]
  14. Fei, D.; Chen, C.; Zheng, P.; Zhang, D.; Yang, J.; Chen, H.; Ai, B. A Novel Millimeter-Wave Channel Measurement Platform for 6G Intelligent Railway Scenarios. China Commun. 2022, 19, 60–73. [Google Scholar] [CrossRef]
  15. He, D.; Ai, B.; Briso-Rodríguez, C.; Zhong, Z. Train-to-Infrastructure Channel Modeling and Simulation in MmWave Band. IEEE Commun. Mag. 2019, 57, 44–49. [Google Scholar] [CrossRef]
  16. Sloane, W.; Gentile, C.; Shafi, M.; Senic, J.; Martin, P.A.; Woodward, G.K. Measurement-Based Analysis of Millimeter-Wave Channel Sparsity. IEEE Antennas Wirel. Propag. Lett. 2023, 22, 784–788. [Google Scholar] [CrossRef]
  17. Cai, X.; Yin, X.; Cheng, X.; Yuste, A.P. An Empirical Random-Cluster Model for Subway Channels Based on Passive Measurements in UMTS. IEEE Trans. Commun. 2016, 64, 3563–3575. [Google Scholar] [CrossRef]
  18. Zhou, T.; Tao, C.; Salous, S.; Liu, L.; Tan, Z. Channel Sounding for High-Speed Railway Communication Systems. IEEE Commun. Mag. 2015, 53, 70–77. [Google Scholar] [CrossRef]
  19. Zhou, T.; Tao, C.; Salous, S.; Liu, L. Measurements and Analysis of Short-Term Fading Behavior in High-Speed Railway Communication Networks. IEEE Trans. Veh. Technol. 2019, 68, 101–112. [Google Scholar] [CrossRef]
  20. Wu, T.; Yin, X.; Zhang, L.; Ning, J. Measurement-Based Channel Characterization for 5G Downlink Based on Passive Sounding in Sub-6 GHz 5G Commercial Networks. IEEE Trans. Wirel. Commun. 2021, 20, 3225–3239. [Google Scholar] [CrossRef]
  21. Sorecău, M.; Sorecău, E.; Sârbu, A.; Bechet, P. Real-Time Statistical Measurement of Wideband Signals Based on Software Defined Radio Technology. Electronics 2023, 12, 2920. [Google Scholar] [CrossRef]
  22. Standard 3GPP TS 38.214 (V17.1.0); NR; Physical Layer Procedures for Data. 3GPP Std.: Valbonne, France, 2022.
  23. Standard 3GPP TS 38.211 (V17.1.0); NR; Physical Channels and Modulation. 3GPP Std.: Valbonne, France, 2022.
  24. Yu, J.; Chen, W.; Li, F.; Li, C.; Yang, K.; Liu, Y.; Chang, F. Channel Measurement and Modeling of the Small-Scale Fading Characteristics for Urban Inland River Environment. IEEE Trans. Wirel. Commun. 2020, 19, 3376–3389. [Google Scholar] [CrossRef]
Figure 1. Structure of 5G passive channel measurement platform.
Electronics 12 03715 g001
Figure 2. Time-frequency resource occupancy of the CSI-RS.
Electronics 12 03715 g002
Figure 3. Process of CSI-RS extraction and CIR computation.
Electronics 12 03715 g003
Figure 4. PDPs for four sets of CSI-RS signaling: (a) offset is 25, the first OFDM symbol location is 4; (b) offset is 25, the first OFDM symbol location is 8; (c) offset is 26, the first OFDM symbol location is 4; (d) offset is 26, the first OFDM symbol location is 8.
Electronics 12 03715 g004
Figure 5. Measurement scenarios.
Electronics 12 03715 g005
Figure 6. Measurement setup.
Electronics 12 03715 g006
Figure 7. The normalized radiation patterns of the measurement antenna.
Electronics 12 03715 g007
Figure 8. The variation in the PDP with distance.
Electronics 12 03715 g008
Figure 9. The variations in the number of multipaths with distance.
Electronics 12 03715 g009
Figure 10. The CDF of the number of multipaths.
Electronics 12 03715 g010
Figure 11. The CDF of the RMS delay spread.
Electronics 12 03715 g011
Figure 12. The variations in the Ricean K-factor with distance.
Electronics 12 03715 g012
Figure 13. The CDF of the Ricean K-factor.
Electronics 12 03715 g013
Table 1. The major CSI-RS signaling information.
Signaling InformationSet 1Set 2Set 3Set 4
Center frequency3540 MHz3540 MHz3540 MHz3540 MHz
Subcarrier spacing30 kHz30 kHz30 kHz30 kHz
Bandwidth100 MHz100 MHz100 MHz100 MHz
RB number272272272272
Starting RB0000
Density3333
The first subcarrier location1111
Period40404040
Offset25252626
The first OFDM symbol location4848
Table 2. Measurement parameters.
Measurement ParametersValue
Measurement frequency3.5 GHz
Bandwidth100 MHz
Delay resolution10 ns
Channel sample rate50 samples/s
Channel sample points816
Table 3. Statistical results of the number of multipaths.
ParametersValue
CDF-10%3
CDF-50%5
CDF-90%9
Fitting distributionNormal
Mean value6
Standard deviation2.57
Table 4. Statistic results of the RMS delay spread.
ParametersValue
CDF-10%50.4 ns
CDF-50%77.2 ns
CDF-90%99.8 ns
Fitting distributionNormal
Mean value77.6 ns
Standard deviation23.14 ns
Table 5. Statistical results of the Ricean K-factor.
ParametersValue
CDF-10%10.34 dB
CDF-50%12.94 dB
CDF-90%16.8 dB
Fitting distributionNormal
Mean value13.38 dB
Standard deviation3.31 dB
Disclaimer/Publisher’s Note: The statements, opinions and data contained in all publications are solely those of the individual author(s) and contributor(s) and not of MDPI and/or the editor(s). MDPI and/or the editor(s) disclaim responsibility for any injury to people or property resulting from any ideas, methods, instructions or products referred to in the content.

