Article

A Visually Enhanced Neural Encoder for Synset Induction

1
School of Artificial Intelligence, Beijing University of Posts and Telecommunications, Beijing 100876, China
2
Engineering Research Center of Information Networks, Ministry of Education, Beijing 100876, China
3
School of Computer Science, Beijing University of Posts and Telecommunications, Beijing 100876, China
4
School of Computer and Communication, Lanzhou University of Technology, Lanzhou 730050, China
5
Key Laboratory of Interactive Technology and Experience System, Ministry of Culture and Tourism, Beijing 100876, China
*
Author to whom correspondence should be addressed.
Electronics 2023, 12(16), 3521; https://doi.org/10.3390/electronics12163521
Submission received: 26 June 2023 / Revised: 16 August 2023 / Accepted: 17 August 2023 / Published: 20 August 2023
(This article belongs to the Section Artificial Intelligence)

Abstract

:
The synset induction task is to automatically cluster semantically identical instances, which are often represented by texts and images. Previous works mainly consider textual parts, while ignoring the visual counterparts. However, how to effectively employ the visual information to enhance the semantic representation for the synset induction is challenging. In this paper, we propose a Visually Enhanced NeUral Encoder (i.e., VENUE) to learn a multimodal representation for the synset induction task. The key insight lies in how to construct multimodal representations through intra-modal and inter-modal interactions among images and text. Specifically, we first design the visual interaction module through the attention mechanism to capture the correlation among images. To obtain the multi-granularity textual representations, we fuse the pre-trained tags and word embeddings. Second, we design a masking module to filter out weakly relevant visual information. Third, we present a gating module to adaptively regulate the modalities’ contributions to semantics. A triplet loss is adopted to train the VENUE encoder for learning discriminative multimodal representations. Then, we perform clustering algorithms on the obtained representations to induce synsets. To verify our approach, we collect a multimodal dataset, i.e., MMAI-Synset, and conduct extensive experiments. The experimental results demonstrate that our method outperforms strong baselines on three groups of evaluation metrics.

1. Introduction

The task of synset induction is to automatically cluster semantically identical instances, which are represented by texts and images. Formally, synsets refer to sets of instances having the same meanings. The synset induction task plays an important role in the domain of multimodal machine learning [1,2,3]. Take the image captioning task [4,5,6] as an example, in which the machine algorithm attempts to generate a descriptive sentence for a given image. If the machine algorithm was equipped with a repository of massive multimodal synsets, it could probably help generate more diverse descriptions. Take another example, there exist various dishes in a restaurant’s menu. The same dish could have somewhat similar images but totally different names in different restaurants, especially for Chinese food. Thus, it would be helpful to build a system for clustering those names. With the recent explosive growth of web pages, the synset induction task has become more attractive than ever.
Traditionally, the methods of collecting synsets are manually based on public resources or websites, such as WordNet, Wikipedia, and Baidu Baike. These methods heavily depend on domain experts and crowd-sourcing. Thus, the traditional methods are too expensive for discovering synsets and lack generality. Even worse, with the massive increase in web users, thousands of novel instances of texts and images continuously emerge. Therefore, the task of automatically inducing synsets has its challenges.
Most previous studies on the synset induction task are developed from the linguistic perspective. Given a collection of tags, the synset induction algorithms aim to cluster the tags such that each cluster refers to identical semantics. These methods can roughly be grouped into two categories: corpus statistics and patterns based [7,8,9,10,11,12] and distributional representation based [13,14,15,16]. Those methods generally achieve a promising performance. However, these approaches from the textual perspective ignore the important contribution of the visual counterparts of semantics when dealing with the task of synset induction. Intuitively, the textual tags and the visual counterparts are complementary to semantics. Social web users often share interesting photos and give them some tag words at the same time. As shown in Figure 1, the scientific name ‘Helianthus Annuus’ could be understood easily with the accompanied photos. Thus, the visual counterparts could, to some extent, enhance the textual tag for semantic representation. To this end, Thomason and Mooney [17] proposed a multimodal unsupervised clustering method. This method used pre-trained visual and textual features to cluster multimodal instances, achieving a flexible clustering capability. However, those previous approaches hardly consider the problem of noise within visual counterparts for semantics. In other words, some semantically weakly-relevant images could impair the discriminative capability of semantic representation. In addition, the varying contributions of visual and textual modalities for semantics should be paid attention to.
To address the aforementioned problems, in this paper, we propose a Visually Enhanced NeUral Encoder (i.e., VENUE) to learn the multimodal representation for the task of synset induction. The VENUE encoder mainly consists of four modules: a visual interaction module, a textual multi-granularity embedding module, a masking module, and a gating module. Specifically, the visual interaction module emphasizes the intra-modal interaction, which captures the correlation among images to produce attention-weighted visual representations. The textual multi-granularity embedding module applies a word2vec training method to obtain the tag-level and word-level embeddings. Then, we use log-sum-exp pooling and stacking to generate multi-granularity representations. The masking module emphasizes the intra-modal interaction, which filters out the semantically weakly-relevant images. Furthermore, the gating module is designed to fuse visual and textual representations according to the modalities’ contributions to the semantics. We train our VENUE encoder by adopting a triplet loss. At last, we use the trained VENUE to extract the multimodal representations and then perform a clustering algorithm (e.g., k-means) to induce the synsets. Moreover, to evaluate our proposed method, we collect a large-scale multimodal dataset, MMAI-Synset, to evaluate the task of synset induction. Briefly, we use all the phrase tags in the textual synset dataset [14] (only the Wikipedia subset adopted) to crawl through the corresponding images from the Instagram website. Then, extensive experiments are conducted on our built MMAI-Synset dataset. The experimental results show that our proposed method gains significant performance.
Our major contributions are highlighted as follows.
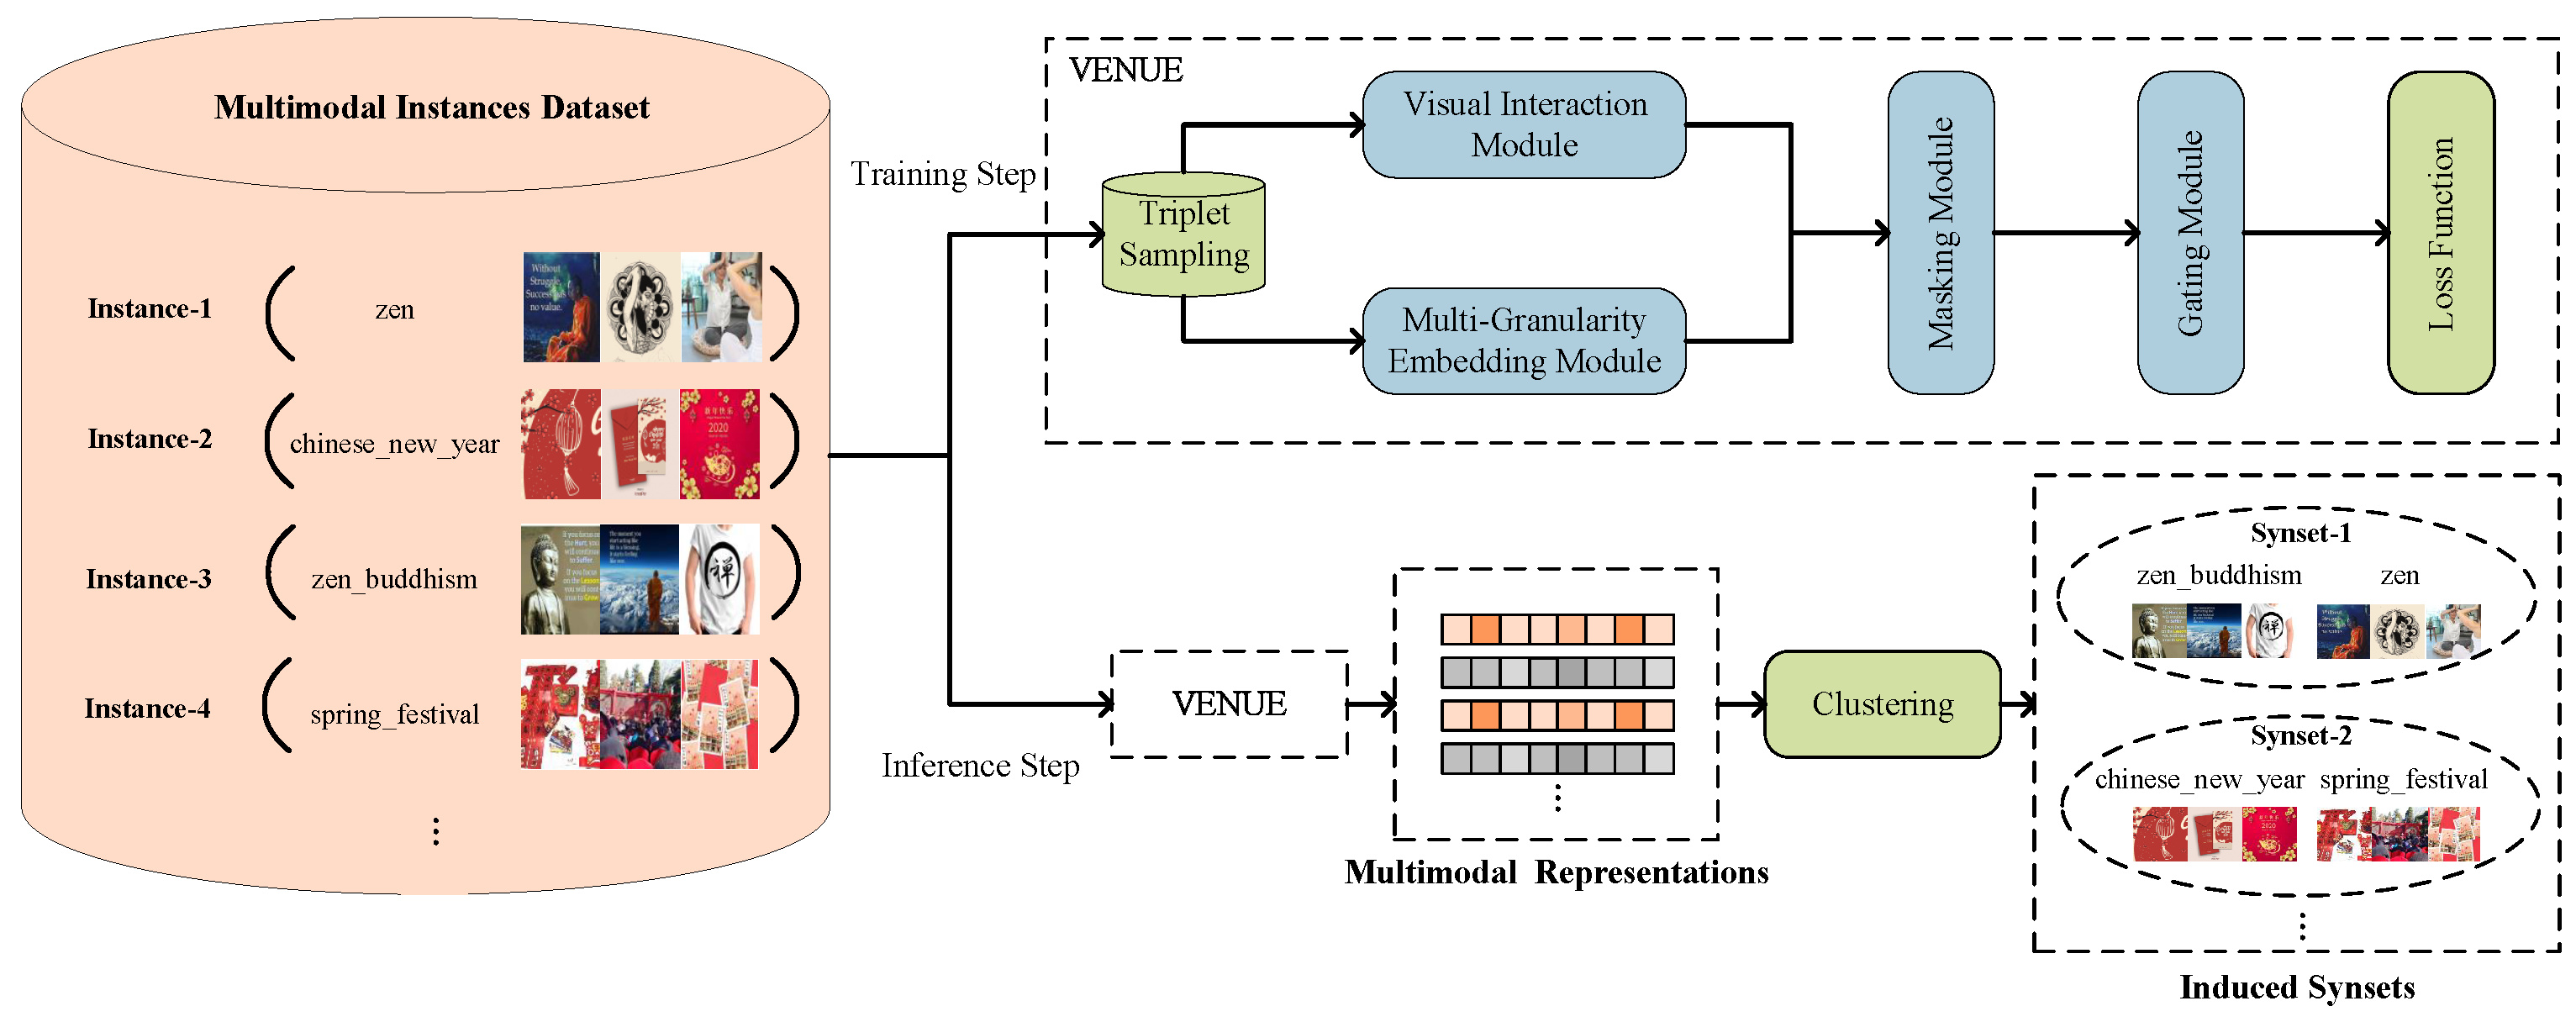
  • We propose the VENUE encoder to learn visually-enhanced multimodal representations for the task of synset induction. The entire network is trained in an end-to-end fashion with a triplet loss. The learned representations are then used for clustering to induce the synsets.
  • We design the visual interaction and the masking modules to cope with the noise in images. The former is built by capturing the inter-modal correlations among multiple images. The latter is built by the inter-modal interaction between visual and textual modalities. In addition, we design a gating module to regulate the visual and textual contributions for semantics.
  • We collect the MMAI-Synset dataset to evaluate the multimodal synset induction task. Extensive experiments are conducted to show that our VENUE encoder outperforms strong baselines on three groups of popular metrics. The MMAI-Synset dataset and the source code for our experiments are made publicly available for advancing the multimedia community (https://github.com/cgpeter96/MMAI-synset, accessed on 15 August 2023).
The remainder of this paper is organized as follows. Section 6 provides a concise review of related works. We define the synset induction task with multimodal data in Section 2. In Section 3, we formulate our visually enhanced neural encoder, VENUE. Section 4 describes our experiment settings, including our dataset, evaluation metrics, and baselines. The experimental results and detailed discussion are reported in Section 5. Finally, Section 7 gives our conclusions and suggests future directions.

2. Problem Formulation

We formulate the synset induction task. A multimodal instance consists of a tag t = { w 1 , w 2 , , w N T } containing N T words and a visual collection V = { I 1 , I 2 , , I N V } containing N V images. Thus, given a set of multimodal instances S = { ( V 1 , t 1 , ) , ( V 2 , t 2 ) , , ( V N , t N ) } , which are already illustrated in Figure 1, the task of synset induction aims to determine which instances belong to identical groups. In other words, the task of synset induction needs to induce which tags belong to the same synsets. Then, the Synset induction task could be formulated as follows,
{ c 1 , c 2 , , c M } = Φ S ; w
in which, the symbol Φ denotes the entire framework of synset induction, including the training and inference phases. The symbol w denotes the learnable model parameters. The set { c 1 , c 2 , , c M } denotes the predicted synsets and each synset c m contains a few multimodal instances.

3. Our Approach

The synset induction procedure using multimodal data consists of two steps. (1) Training the neural encoder model, VENUE. We feed the sampled triplet instances into our VENUE to obtain the multimodal representation model. (2) Inducing the synsets. We use the trained VENUE model to obtain multimodal representations and then induce synsets through a clustering algorithm. Our visually enhanced neural encoder VENUE is shown in Figure 2, in which the top diagram illustrates the training step of VENUE and the bottom diagram illustrates the inference step of VENUE for synset induction. The VENUE model consists of a visual interaction module, a multi-granularity embedding module, a masking module, and a gating module. Next, we explain the details.

3.1. Visual Interaction Module

We design the visual interaction module to deal with the noise in images by modeling the potential associations between images. The visual interaction module consists of a representation extractor and an attention mechanism. First, we use a pre-trained CNN network to obtain the image representation v = { v 1 , v 2 , , v N V } . The process is formulated as follows,
v = ResNet I 1 , I 2 , , I N V
where N V N + denotes the total number of images within an instance, v R N V × D V .
After obtaining the primary visual representation of the image collection, we incorporate the attention mechanism to capture the associations between images and generate visually enhanced representations inspired by [18]. The attention score for the n-th image is formulated as follows,
a n = exp W q v n W k T v n T m = 1 N V exp W q v m W k T v m T
in which, W q and W k are learnable parameters for the attention network. Through this attention operation, we can obtain the attention distribution a n over images. Then, we apply the attention distribution a n to visually represent v , obtaining a weighted visual representation v att . In other words, we use the attention module to distinguish the importance of images within a multimodal instance. Thus, we could improve the discriminative power of image representations. The process is formulated as follows,
v att = n = 1 N V a n W v v n
where W v is the learnable parameter and a n denotes the attention score for the n-th image. This operation is also called self-attention, which computes the response at a position in a set of images by attending to all elements and taking their weighted average in an embedding space.
Then, we apply the residual connection between the weighted visual representation v att and the initial visual representation v . The final attention representation v fatt is obtained. The details are formulated as follows,
v fatt = v att v
in which, the visual representation v fatt R N V × D V , and the symbol ⊕ denotes the residual connection. This operation can effectively alleviate the gradient vanishing problem during training and help the model converge more stably. Thus, we obtain the visually enhanced representation v fatt through the aforementioned operations.

3.2. Multi-Granularity Embedding Module

In the task of synset induction, the tag is composed of only a few words. For example, the tags of all four instances in Figure 1 only have one or two words, including Automotive, Car, Helianthus Annuus, and Sunflowers. To sufficiently utilize the information in the tag of each instance, we propose the multi-granularity embedding module. This module obtains the tag-level embedding E l and word-level tag embedding E w through embedding training methods with different granularity.
Specifically, for the word-level embedding, we adopt the word2vec [19] to train on an external corpus obtaining the word vector. We first consider the entire tag and then train the word2vec model in the same way to obtain the tag-level embedding t t l e . The process of obtaining tag-level embedding is formulated as follows,
t t l e = E l t
where the symbol E l denotes the embedding layer, which is initialized by a pre-trained tag-level word2vec, and the embedding t t l e R D T .
For the word-level tag embedding, we apply E w to generate the corresponding word vectors { t 1 w , t 2 w , , t N T w } . The details are given as follows,
t 1 w , t 2 w , , t N T w = E w t = E l w 1 , w 2 , , w N T
in which, the embedding t n w R D T .
Furthermore, for the tags, we note that the pooling scheme would affect their embeddings. For one thing, the average pooling treats each dimensionality of the embedding equally. This would result in a lack of semantic discrimination. In contrast, max pooling pays more attention to the local signal but cannot represent the comprehensive semantics. To address this problem, inspired by Pinherio et al. [20], we incorporate the log-sum-exp pooling (i.e., LSE) to balance the local attention and the global attention. LSE is a smooth version and convex approximation of the max function. The definition of LSE is given as follows,
t w l e = LSE t 1 w , t 2 w , , t N T w = log i = 1 N V exp r × t w i 1 r
where the representation t w l e R D T and the factor r is an adjustment parameter that balances the average pooling and max pooling. The smaller r is, the closer it is to the average pooling, and the larger r is, the closer it is to the max pooling.
Afterward, we adopt the concatenation operation to fuse tag-level embeddings and word-level tag embeddings, i.e,
t m g e = t t l e ; t w l e
where the symbol [ ; ] denotes the concatenation operation, and the concatenated textual representation t m g e R 2 D T .

3.3. Masking Module

For the multimodal instances, the noise in the images could decrease the effectiveness of the multimodal representation. In the previous section, we consider intra-modal attention to improve the visual representation. Here, we consider the inter-modal attention by designing the masking module to further improve the visual representation.
The masking module takes the output ( v f a t t , t m g e ) of the visual interaction module and multi-granularity embedding module as input. We aim to generate strongly-relevant visual representation v m s k . Specifically, we first perform the dimensionality reduction operation to obtain compact visual and textual representations v c and t c , respectively. The formulation of the visual modality is given as follows,
v c = tanh W 2 I W 1 I v f a t t + b 1 I + b 2 I
where the symbols W 1 I and W 2 I are learnable parameters, and the symbols b 2 I and b 2 I are bias parameters. The visual representation v c R D c , in which the symbol D c denotes the dimensionality of the compact representation.
Identically, the textual compact representation t c R D c is formulated as follows,
t c = tanh W 2 T W 1 T t m g e + b 1 T + b 2 T
where the symbols W 1 T and W 2 T are learnable parameters, the symbols b 1 T and b 2 T are bias parameters.
After obtaining these compact representations, we perform the intra-modal interaction between modalities to generate the masking vector,
σ v c , t c = 1 1 + e v c t c
where the output vector has the dimensionality of N V , and the symbol ⊙ denotes the element-wise product. The function of the masking vector takes the form of the Sigmoid activation function.
Then, we apply the masking vector on the visual representation v f a t t to filter out the noise as follows,
v m s k = v f a t t σ v c , t c .
To obtain the global masked visual representation v g m s k , we aggregate all of N V visual representations v m s k . The process is formulated as follows,
v g m s k = 1 N V j = 1 N W p v j m s k
where the symbol W p is the learnable parameter, and the symbol v j m s k denotes the j-th row vector in the visual representation v m s k . Through the masking module, we filter out the noise in the images and further enhance the visual representations for learning semantics in multimodal instances.

3.4. Gating Module

To further regulate the contributions between visual and textual modalities, we design a gating module. First, due to the dimensional inconsistency of the multi-granularity embedding t m g e and the other representations, we apply a transform layer to generate the compact textual representation. This formulation is given as follows,
t p j t = Dropout W 2 P W 1 P t mge + b 1 P + b 2 P
where the symbols W 1 P and W 2 P are learnable parameters, and the symbols b 1 P and b 2 P are the bias parameters. The Dropout denotes the dropout layer, which can forget some neural units randomly.
Then, we apply a gating operation on the global masked visual representation v g m s k and the compact textual representation t p j t . Specifically, the gating operation consists of two parallel fully-connected layers and a Sigmoid activation function. The process is given as follows,
g = σ W 1 G v g m s k + W 2 G t p j t
where the symbols W 1 G and W 2 G are learnable parameters, and the symbol σ denotes the Sigmoid function σ ( x ) = 1 / ( 1 + e x ) . The gating vector g is activated by the Sigmoid function. Its value falls within the interval [ 0 , 1 ] . We apply the obtained gating vector g onto the visual representation v g m s k and the textual representation t p j t . The detailed process is formulated as follows,
v g a t e = g W 3 G v g m s k ,
and
t g a t e = 1 g W 4 G t p j t ,
where the symbols W 3 G and W 4 G are learnable parameters.
Through this process, we regulate the contributions between visual and textual modalities. Thus, we obtain the gated visual representation v g a t e R D g and the gated textual representation t g a t e R D g . Finally, we concatenate these two representations v g a t e and t g a t e to produce the final representation o , i.e.,
o = v g a t e ; t g a t e
in which o R D o . The dimensionality of the final representation equals two times that of the visual representation, i.e., D o = 2 D g . The symbol [ ; ] denotes the vector concatenation operation. The final representation is also called multimodal semantic embedding.

3.5. Loss Function and Training Algorithm

In order to train our VENUE encoder, we apply the triplet loss function [21,22] with multimodal instances as follows,
L = i = 1 N max 0 , d i + d i + m .
In this equation, the symbol d + denotes the distance between an anchor and a positive, and the symbol d denotes the distance between an anchor and a negative. The symbol m denotes the margin. The distance metric d is typically defined as a cos distance, i.e.,
cos ( x , y ) = 1 x · y x y .
where x and y are the multimodal representations and the value cos ( x , y ) [ 0 , 2 ] . Note that the cosine distance here differs a little from the commonly used one, which has a non-negative value. Specifically, we perform a translation of the common cosine function to make it fit for the margin in the triplet loss. Thus, we can calculate the distances among triplet instances.
We then collect all aforementioned procedures and the corresponding equations to build our training algorithm. Specifically, we initialize the model parameters with a Gaussian distribution, then we proceed as follows. We compute the visually enhanced representation and textual multi-granularity embedding from multimodal instances. Then we compute the visually masked representation with mutlimodal instances interaction. We compute gated multimodal representations for anchor, positive, and negative samples. Thus, we calculate the loss and perform gradient descent to update the model parameters. To make the training process more clear, we show the training procedure in Algorithm 1.
Algorithm 1 Training Algorithm of Our VENUE Model.
Require: 
multimodal instances S = { ( V 1 , t 1 , ) , , ( V n , t n ) } , learning rate η , iteration EPOCHS, weights θ , margin m, batch size N B
Ensure: 
weights θ
1:
Initialize weights θ with Gaussian distribution N ( 0 , 1 )
2:
for epoch 1 to EPOCHS do
3:
   mini_batch ← batch_generator( S )
4:
   for idx 1 to N B  do
5:
      ( V a , t a ) , ( V p , t p ) , ( V n , t n ) ← mini_batch[idx];
6:
     Compute visual enhanced representation v f a t t for all instances in a mini-batch with Equations (2)–(5);
7:
     Compute textual multi-granularity embedding t m g e for all instances in a mini-batch with Equations (6)–(9);
8:
     Compute visual masked representation v g m s k for all instances in a mini-batch with Equations (10)–(14);
9:
     Compute gated multimodal representation o for all instances in a mini-batch, including those of anchor, positive and negative samples, o a , o p , and o n with Equations (15)–(19);
10:
     Compute the loss with Equations (20) and (21),
      L ( θ ) a N B max 0 , cos ( o a , o p ) cos ( o a , o n ) + m
11:
     Update weights with gradient decent, i.e., θ θ η δ δ θ L ( θ )
12:
   end for
13:
end for

3.6. Inference

With the loss function given by Equation (20), we train our proposed VENUE model. Then, we use the trained VENUE model to perform inference. This process is illustrated at the bottom of Figure 2. Specifically, we first utilize the trained VENUE encoder to extract multimodal representations for a given testing set. The multimodal representations M R n × D o of all testing instances can be obtained, where n is the number of instances and D o is the dimensionality of multimodal representations. Specifically, we first utilize the trained VENUE model to extract multimodal representations from the given testing instance set.
Then, we perform a clustering process on multimodal representations M of all testing instances, using k-means and hierarchical agglomerative clustering (i.e., HAC). For the k-means, we choose k rows from multimodal representations M as initialization of clustering centers and compute the distance between clustering centers and instances to iteratively-grouped clusters. For the HAC algorithm, we compute the distance matrix between instances and merge instances one by one with a distance threshold. Finally, the instances that belong to identical semantics will be grouped into the same clusters, i.e., synsets.

4. Experimental Settings

In this section, we describe our experimental setting. First, we introduce our multimodal dataset for synset induction in Section 1 and the three groups of evaluation metrics in Section 4.2. Second, we report the implementation details of our method in Section 4.3 and describe strong baseline methods to be compared in Section 4.4.

4.1. Dataset

To evaluate our proposed model, we collect a new multimodal dataset for synset induction. We describe the details of collecting our MMAI-Synset dataset for evaluation. Basically, we adopt the Wikipedia text subset of the synset dataset [14] collected by the University of Illinois at Urbana-Champaign. Note that the other two subsets, NYT (New York Times) and PubMed (Biomedical Literature) were not used because they are more or less involved in professional domains and are not suitable for data sources. The details about this dataset are available on the website https://github.com/jmshen1994/SynSetMine-pytorch/tree/master/data, accessed on 15 August 2023.
To be brief, we used all of the noun phrases in the Wikipedia dataset to crawl their corresponding images from the Instagram social media website. A few noun phrases, such as “16_mm_film”, “wt”, and “ph.d.”, were removed because of the insufficient quantity of corresponding images. Thus, 8509 noun phrases and their corresponding 425,450 images were obtained. An instance in this dataset is composed of one noun phrase tag and its corresponding 50 images. Here, we note that the number of images and the textual tags are imbalanced, which is challenging in our multimodal synset induction. Based on the division of the noun phrases in the aforementioned work, we divide the entire dataset into two subsets for training and testing. The training set contains 7833 instances and the testing set contains 676 instances. Synonyms are the same as the Wikipedia text synset dataset, which contains 3911 synsets for training and 209 synsets for testing. The statistics of our collected MMAI-Synset are shown in Table 1. Furthermore, we count the tag length distribution over the entire dataset. The tag lengths in both the training set and the testing set are almost the same. The statistics are reported in Table 2.

4.2. Metrics

In order to evaluate the performance of our methods, we adopted three groups of popular evaluation metrics. These metrics are briefly described as follows.
(1) The first group metric (h, c, v) involves entropy [23]. Specifically, the class entropy of ground-truth C * and the predicted synsets C are defined. In addition, their conditional entropy H ( C | C * ) and H ( C * | C ) are defined. The homogeneity (i.e., h) represents the degree that each cluster consists of data points belonging to a single ground-truth class. h is calculated as follows,
h = 1 H ( C * | C ) H ( C * ) if H ( C * ) > 0 1 otherwise
In contrast, the completeness (i.e., c) refers to the degree that each ground-truth class consists of instances assigned to a single cluster. c is calculated as follows,
c = 1 H ( C | C * ) H ( C ) if H ( C ) > 0 1 otherwise
Furthermore, the v-measure (i.e., v) is defined as the harmonic mean of the above metrics, i.e., v = 2 ( h × c ) / ( h + c ) .
(2) The second group metric (p, r, f) is based on comparing the membership overlap between clusters. Specifically, for each cluster C i in predicted clusters we generate | C i | 2 , where the cluster | C i | is the number of instances in the cluster C i C . Similarly, for the ground-truth clusters, we generate | C i * | 2 instances for the cluster C i * C * . Next, precision (i.e., p) can be defined as the number of common instance pairs between two sets to total up to the number of pairs in the clusters,
p = | U ( C ) U ( C * ) | | U ( C ) |
where the symbol ∩ denotes the intersection and U ( · ) denotes the counting operation. Meanwhile, recall (i.e., r) can be defined as the number of common instance pairs between the two sets to the total number of pairs in the groundtruth,
r = | U ( C ) U ( C * ) | | U ( C * ) |
Furthermore, the f1-score is also defined as the harmonic mean of these above metrics, i.e., f = 2 ( p × r ) / ( p + r ) .
(3) The third group of metrics, FMI, ARI, and NMI are described as follows. Fowlkes–Mallows Index (i.e., F M I ) [24] is an external evaluation method that is used to determine the similarity between predicted clusters C and ground-truth clusters C * . We calculate the F M I as follows,
F M I = T P T P + F P × T P T P + F N
where the T P denotes the number of pairs of synonym words present in the same cluster in both C and C * , F P denotes the number of pairs of synonym words present in the same cluster in C but not in C * . F N denotes the number of pairs of synonym words present in the same cluster in C * but not in C. T N denotes the number of pairs which are different clusters in both C and C * clusters.
Adjusted Rand Index (i.e., ARI) [25] computes a similarity measure between two clusters. This metric considers all pairs of instances and counting that are assigned in the same or different clusters in the predicted clusters C and ground-truth clusters C * . The A R I is computed as follows,
A R I = R I E ( R I ) max ( R I ) E ( R I )
in which, R I = ( T P + T N ) / N and N is the number of an instance. The max denotes the maximum function and the symbol E denotes the expectation operator.
Normalized Mutual Information (i.e., NMI) [25] calculates the normalized mutual information between two cluster assignments, which is used for measuring the degree of fitness of the two cluster distributions, i.e.,
N M I Ω , C = 2 × I ( Ω ; C ) H ( Ω ) + H ( C )
in which, H ( · ) denotes the entropy of clusters. The symbol I ( Ω ; C ) denotes the mutual information between predicted clusters and the groundtruth.

4.3. Implementation Details

In our experiments, we verify our model with three successive steps, including data pre-processing, model training, and model inference. In our MMAI-Synset dataset, each multimodal instance consists of 50 images and a textual tag containing a few words. This results in a huge consumption of computing resources that we cannot afford. To balance the model implementation requirements with limited computing resources, we adopt the ResNet for the visual interaction module in VENUE separately. Specifically, we apply the weakly supervised ResNet101 [26] as the visual backbone, which has been pre-trained in 3.5 billion public Instagram images to extract the primary image representations for images in the multimodal instance. The dimensionality of image representation D I is set to 2048. Then, we save the representation as an NPY file. Thus, we build the visual interaction module under limited computing resources.
In the multi-granularity embedding module, the dimensionality of multi-granularity embedding D T is set to be 200 and the adjustment factor r in Equation (8) is set to 1.6 empirically. Specifically, we apply the Gensim [27] to obtain the tag-level representations and the word-level representations. Here, the dimensionality for both of them is 100. In the masking module, the dimensionality of the compact visual and textual representations D c is set to 512. In the gating module, the dimensionalities of the gated visual representation and the gated textual representation are 512. Thus, the dimensionality of the multimodal semantic embedding D o is set to 1024.
During the training stage, we build our VENUE model by the PyTorch Framework [28]. We use the RAdam optimizer [29] to optimize the VENUE model with the learning rate 1 × 10 4 . We apply a more effective technique called the online triplet mining strategy [21] to accelerate the convergence rate of the model and reduce the training time. Specifically, we first construct a mini-batch generator that generates at least two instances with identical labels in each mini-batch. In addition, we use instances of the same labels as anchor instances and positive instances and randomly select other instances of different labels as negative instances. In the code implementation, we use matrix operation and mask technology to quickly implement the online triplet mining strategy. More details are shown in our code. Our model training environment is an NVIDIA RTX2080Ti installed with 64 GB memory.
During the inference, we apply the VENUE model to extract the multimodal representation of each instance in the testing set and then apply the clustering algorithm to induce synsets. In all our experiments, we choose two popular algorithms, k-means and HAC, for our task. The k-means initializes k different clusters, and the center of each cluster is calculated using the average of the tag representation contained in the cluster, and the cluster center is updated until it is stable to generate k clusters. The HAC algorithm treats each instance as a singleton cluster at the outset. Then, HAC successively merges pairs of clusters until all clusters have been merged into a single cluster that contains all instances.

4.4. Baseline

We compare our proposed approach with strong baseline methods. These methods are briefly described as follows.
(1)
word2vec + k-means/HAC. This approach takes the pretrained word2vec as the tag representation and induces synset by the k-means or the HAC algorithm.
(2)
CNN + k-means/HAC. This method takes the visual features extracted from the convolutional neural network (i.e., CNN) and induces synset by the k-means or HAC algorithms.
(3)
[ word 2 vec ; CNN ] + k-means/HAC. This approach takes the concatenated feature of the pre-trained word2vec and visual features as input, then induces synset by the k-means or HAC algorithm.
(4)
SynsetMine [14] is a text-based method. In our experiments, we keep only the textual parts of multimodal instances, leaving out the visual parts. This method takes the pre-trained word2vec as a tag representation and then induces synset through a proposed SynsetMine framework. It builds a classifier to determine whether to merge a new instance into the current set and then efficiently generates entity synonym sets from a given tag set. In our experiments, we follow the experimental setting of SynsetMine and use the pre-trained word2vec provided by the authors to initialize the embedding layer. Then, we use the textual data to train the SynsetMine model with the supervised signal. After the training, according to the semantics of words, SynsetMine performs greedy clustering to induce synset by merging tags one by one.
(5)
Infomap [30] is originally proposed for a community detection algorithm https://www.mapequation.org/infomap/ (accessed on 15 August 2023) based on the graph structure and information theoretic approach. This method is widely used in community detection and synset induction. The basic idea of Infomap is first to generate a sequence by constructing transition probabilities, random walk on the graph, and then hierarchically encode the sequence to minimize the objective function. Finally, Infomap achieves a clustering goal. In our experiment, we first use the pre-trained word2vec to represent the tag. Then, we construct a graph based on the Euclidean distance between words and apply the Infomap algorithm to synset induction.
(6)
MWSI [17] proposes a multimodal unsupervised clustering method that uses pre-trained visual and textual features to cluster multimodal instances. To fit our settings, we use a variant of MWSI without performing synonymy detection. The reason is that there is no ambiguity problem with our built MMAI-Synset dataset. In particular, we use the visual and textual features with an early fusion, which is proposed in MWSI [17]. Then, we obtain the multimodal representations. Finally, we use the hierarchical clustering algorithm to group the image sets which have identical meanings.
(7)
CLIP (Contrastive Language-Image Pretraining) [31] is a multimodal neural network pre-trained model. This model is trained on a super large-scale dataset having 400 million image-text pairs collected from the Internet. CLIP directly learns the multimodal semantic correlations from the raw text of images, which leverages a much broader source of supervision. This pre-trained model can enable the zero-cost transfer of the model to downstream tasks non-trivially without the need for any dataset-specific training. With this idea, in our experiments, we directly apply the CLIP model as an encoder to extract multimodal representations without any modification or training. We adopt the official version of CLIP https://github.com/openai/CLIP (accessed on 15 August 2023) with the vision transformer image encoder and prompt engineering such as “a photo of #tag” for text encoding. Then, we perform the HAC algorithm among the multimodal representations to cluster the target synsets.

5. Results and Analysis

In this section, we report our experimental results. First, we report and analyze the performance of the proposed VENUE model compared with baseline methods in Section 5.1. Second, we conduct ablation studies on the modules of the VENUE in Section 5.2. Third, we report the effect of different parameter configurations in Section 5.3. Finally, we show some qualitative results of our proposed method in Section 5.4.

5.1. Performance of Synset Induction

We report the experimental results of our VENUE model and the other baselines in Table 3. First, we note that whether the k-means clustering algorithm or the HAC algorithm were used, the vision-based methods (i.e., CNN + k-means/HAC) gave the worst results among all methods. The CNN + k-means method merely obtained 80.38, 85.31, and 82.77 for homogeneity, completeness, and v-measure score, respectively; achieved 16.37, 33.91, and 22.08 for precision, recall, and f1-score respectively; and achieved 27.71, 23.56, and 82.81 for ARI, FMI, and NMI score, respectively. The vision-based methods only rely on a pre-trained CNN or a manual visual descriptor, which is difficult to accurately capture the semantics represented simply based on the visual collection. Moreover, the decrease in discriminative ability resulted in low performance for vision-based methods.
The text-based methods (i.e., word2vec + k-means /HAC, InfoMap, and SynsetMine) achieved better performance than the vision-based methods. The word2vec + k-means achieved 89.19, 91.22, 90.19 for homogeneity, completeness, and v-measure score, respectively; achieved 39.89, 54.70, and 46.13 for precision, recall, and f1-score, respectively; and achieved 45.91, 46.71, 90.2 for ARI, FMI, and NMI score, respectively. For the synset induction task, the textual information is more semantically discriminative than that of the visual information. Therefore, with an identical clustering algorithm, the performance of the word2vec + k-means outperformed that of the CNN + k-means. In addition, the InfoMap outperformed word2vec + k-means with 9.44 on the homogeneity score and 2.47 on the NMI score. The performance benefits from the construction of the word similarity graph. Moreover, compared with word2vec + k-means, SynsetMine improved the ARI score by 11.30, the FMI score by 10.57, and the NMI by 2.77. Through modeling the contextual relations of tags, word2vec learns more synonymous relations than these vision-based methods. In addition, the use of word2vec and supervision signal in the SynsetMine increased the representative capability for better performance.
Furthermore, we observed that multimodal methods (i.e., (word2vec; CNN) + k-means/HAC, MWSI, CLIP, and VENUE) achieved better performance than unimodal (text or image) methods. For example, the MWSI method achieved 94.11, 93.49, and 93.80 for homogeneity, completeness, and v-measure scores, respectively; achieved 53.19, 66.09, and 58.94 for precision, recall, and f1 scores, respectively; and achieved 58.78, 59.29, and 93.80 for ARI, FMI, and NMI scores, respectively. It is worth mentioning that the recently proposed CLIP, a multimodal pre-trained encoder, achieved very comparable performance and gave the best score for the recall metric. This demonstrates that multimodal pre-trained encoders, such as CLIP, can be utilized for large-scale correlations between text and images. However, due to the lack of a supervised signal, the previous multimodal representations are “rough”, leaving room for improvement.
Next, our VENUE + HAC multimodal method outperformed the MWSI method on all three groups of evaluated metrics. The VENUE + HAC method achieved 96.41, 93.79, and 95.08 for homogeneity, completeness, and v-measure scores, respectively; achieved 62.81, 67.95, and 65.28 for precision, recall, and f1 scores, respectively; and achieved 65.15, 65.33, and 95.08 for ARI, FMI, and NMI scores, respectively. Compared with the CLIP-based multimodal method, our VENUE + HAC still gained significant improvement. This shows that our method has a more powerful representation learning capability. For the multimodal representation based on our VENUE encoder, the HAC clustering outperformed the k-means. In the collection of synsets, each semantic usually corresponds to only a small number of instances, as previously shown in Figure 1. For the k-means algorithm, the small number of instances would decrease the discriminative capability of the cluster centers. In contrast, the HAC algorithm treats each instance as a singleton cluster and then successively merges the most similar pairs of clusters. In other words, the HAC algorithm works more stable for a small number of instances.
To summarize, in general, our VENUE method with k-means and HAC achieves better performance compared with these strong baselines. To further verify the effectiveness of the modules in our VENUE encoder, we next conduct thorough ablation studies in the following section.

5.2. Ablation Studies

In order to show the effectiveness of all modules, we conduct ablation studies on our proposed VENUE encoder. Specifically, we construct VEVE variants by removing all combinations of modules to evaluate their performance. All of the experimental results are reported in Table 4.
Firstly, we notice that the visual interaction module VENUE (w/o att) and the multi-granularity embedding module VENUE (w/o mge) had a big impact on the performance of our VENUE model. The scores of these two encoders for all nice metrics decreased when using both k-means and HAC clustering methods. The visual interaction module determines the semantic discriminative ability of visual representation, and the multi-granularity embedding module determines the semantic discriminative ability of the text representation.
Furthermore, we notice that the masking module VENUE (w/o mask) and the gating module VENUE (w/o gate) also had an impact on the performance of our VENUE method. Compared with the VENUE+HAC method, the VENUE (w/o mask) + HAC method had a drop of 8.30 on precision, 3.87 on f1-score, 3.90 on ARI score, 3.43 on FMI score, and 0.50 on NMI score, respectively. However, the VENUE (w/o mask) + HAC method improved by 2.35 for the recall score. The masking module was responsible for those semantically weakly relevant images. Once some images were masked, the semantically relevant text would be improved. Thus, the representations obtained using the VENUE model without the masking module would lead to a lower precision but a higher score. To further verify the effectiveness of the masking module, we present some examples in Figure 3. For example, in the first line, the three images intuitively have weak relevance to the tag “pet”. Thus, these images evaluated with low scores are filtered out. In other words, our designed masking module indeed filtered out semantically weakly relevant images.
For the VENUE (w/o gate), removing the gating module of the precision score had a larger effect than on the recall score. The VENUE (w/o gate) + HAC had a drop of 9.08 on the precision score and 4.58 on the recall. This is because the gating module is responsible for regulating the modalities’ contributions. Thus, the VENUE model without the gating module would produce a confusing representation, which would lead to a lower performance.
In addition, we notice that, in general, the HAC algorithm achieves better performance compared with the k-means algorithm on multiple metrics (i.e., f1-score, ARI, FMI, and NMI) with identical encoders. The k-means algorithm needs to obtain the global representations of the clustering centers by averaging pooled instances, so it has better robustness. The VENUE + k-means achieved 73.64 for the recall score. The HAC clustering merges instances with identical semantics iteratively, which is more concerned with the relationship among instances. Thus, the VENUE + HAC achieved a higher precision score, i.e., 62.81 for the precision score, 67.95 for the recall score, and 65.28 for the f1-score. To summarize, the modules we designed have different contributions to the full VENUE encoder. In our synset induction task, the VENUE + HAC achieved the best performance for mostly all metrics.

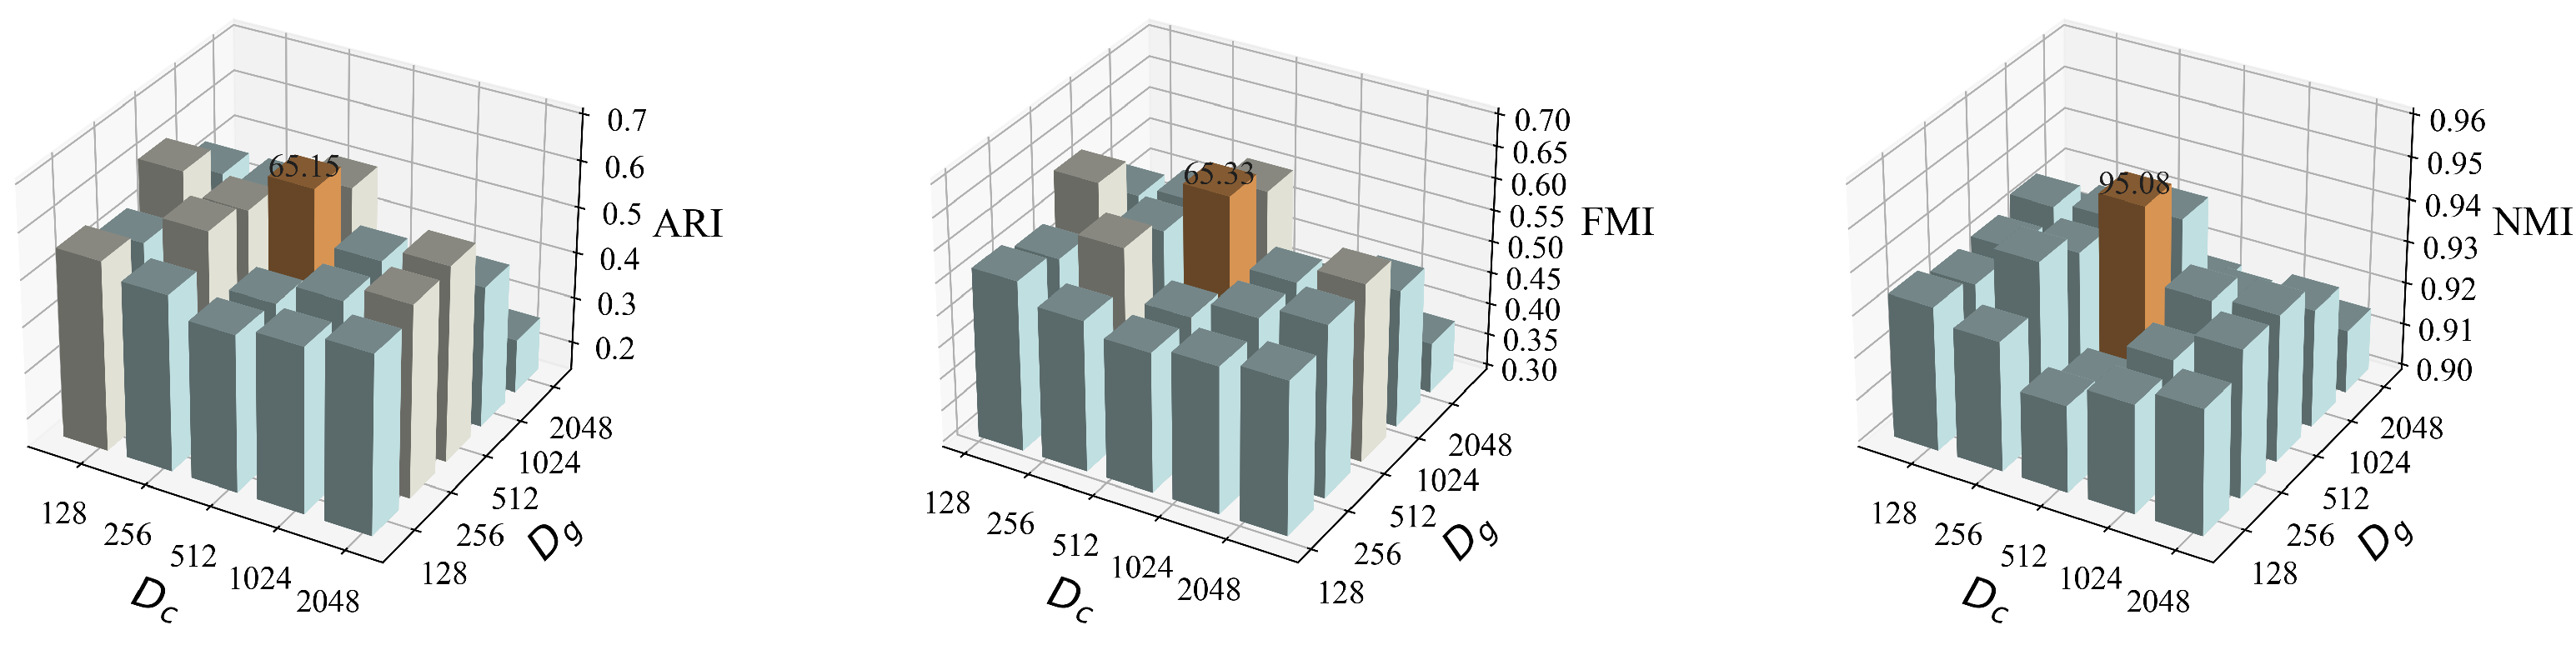
5.3. Model Parameters

The configuration of hidden neural units D c in the masking module and the number of output neural units D g in the gating module plays an important role in the performance of our VENUE model. In our experiments, we explore the configurations of these two parameters. We choose the VENUE + HAC method under investigation. The popular three ARI, FMI, and NMI evaluation metrics are used. We change different configurations of hidden and output neural units, keeping the other parameters fixed. The number of hidden neural units was selected from the set { 128 , 256 , 512 , 1024 , 2048 } . The number of output neural units was selected in the same manner as that of hidden neural units.
The experimental results of various configurations are shown in Figure 4. The NMI metric varied slightly with the number of hidden neural units and that of the output neural units. The other two metrics, FMI and NMI, changed similarly with these two parameters. When the number of the two parameters is less than 512, the model would fail in overfitting and decrease the model’s generalization ability. When the number of the two parameters is greater than 512, the model will easily underfit due to the increased parameters. This leads to the performance decrease of the model in the testing set. When the number of the two parameters is set to 512, the model achieved the best performance among all configurations. Thus, we chose this configuration of the two parameters to achieve the best performance.

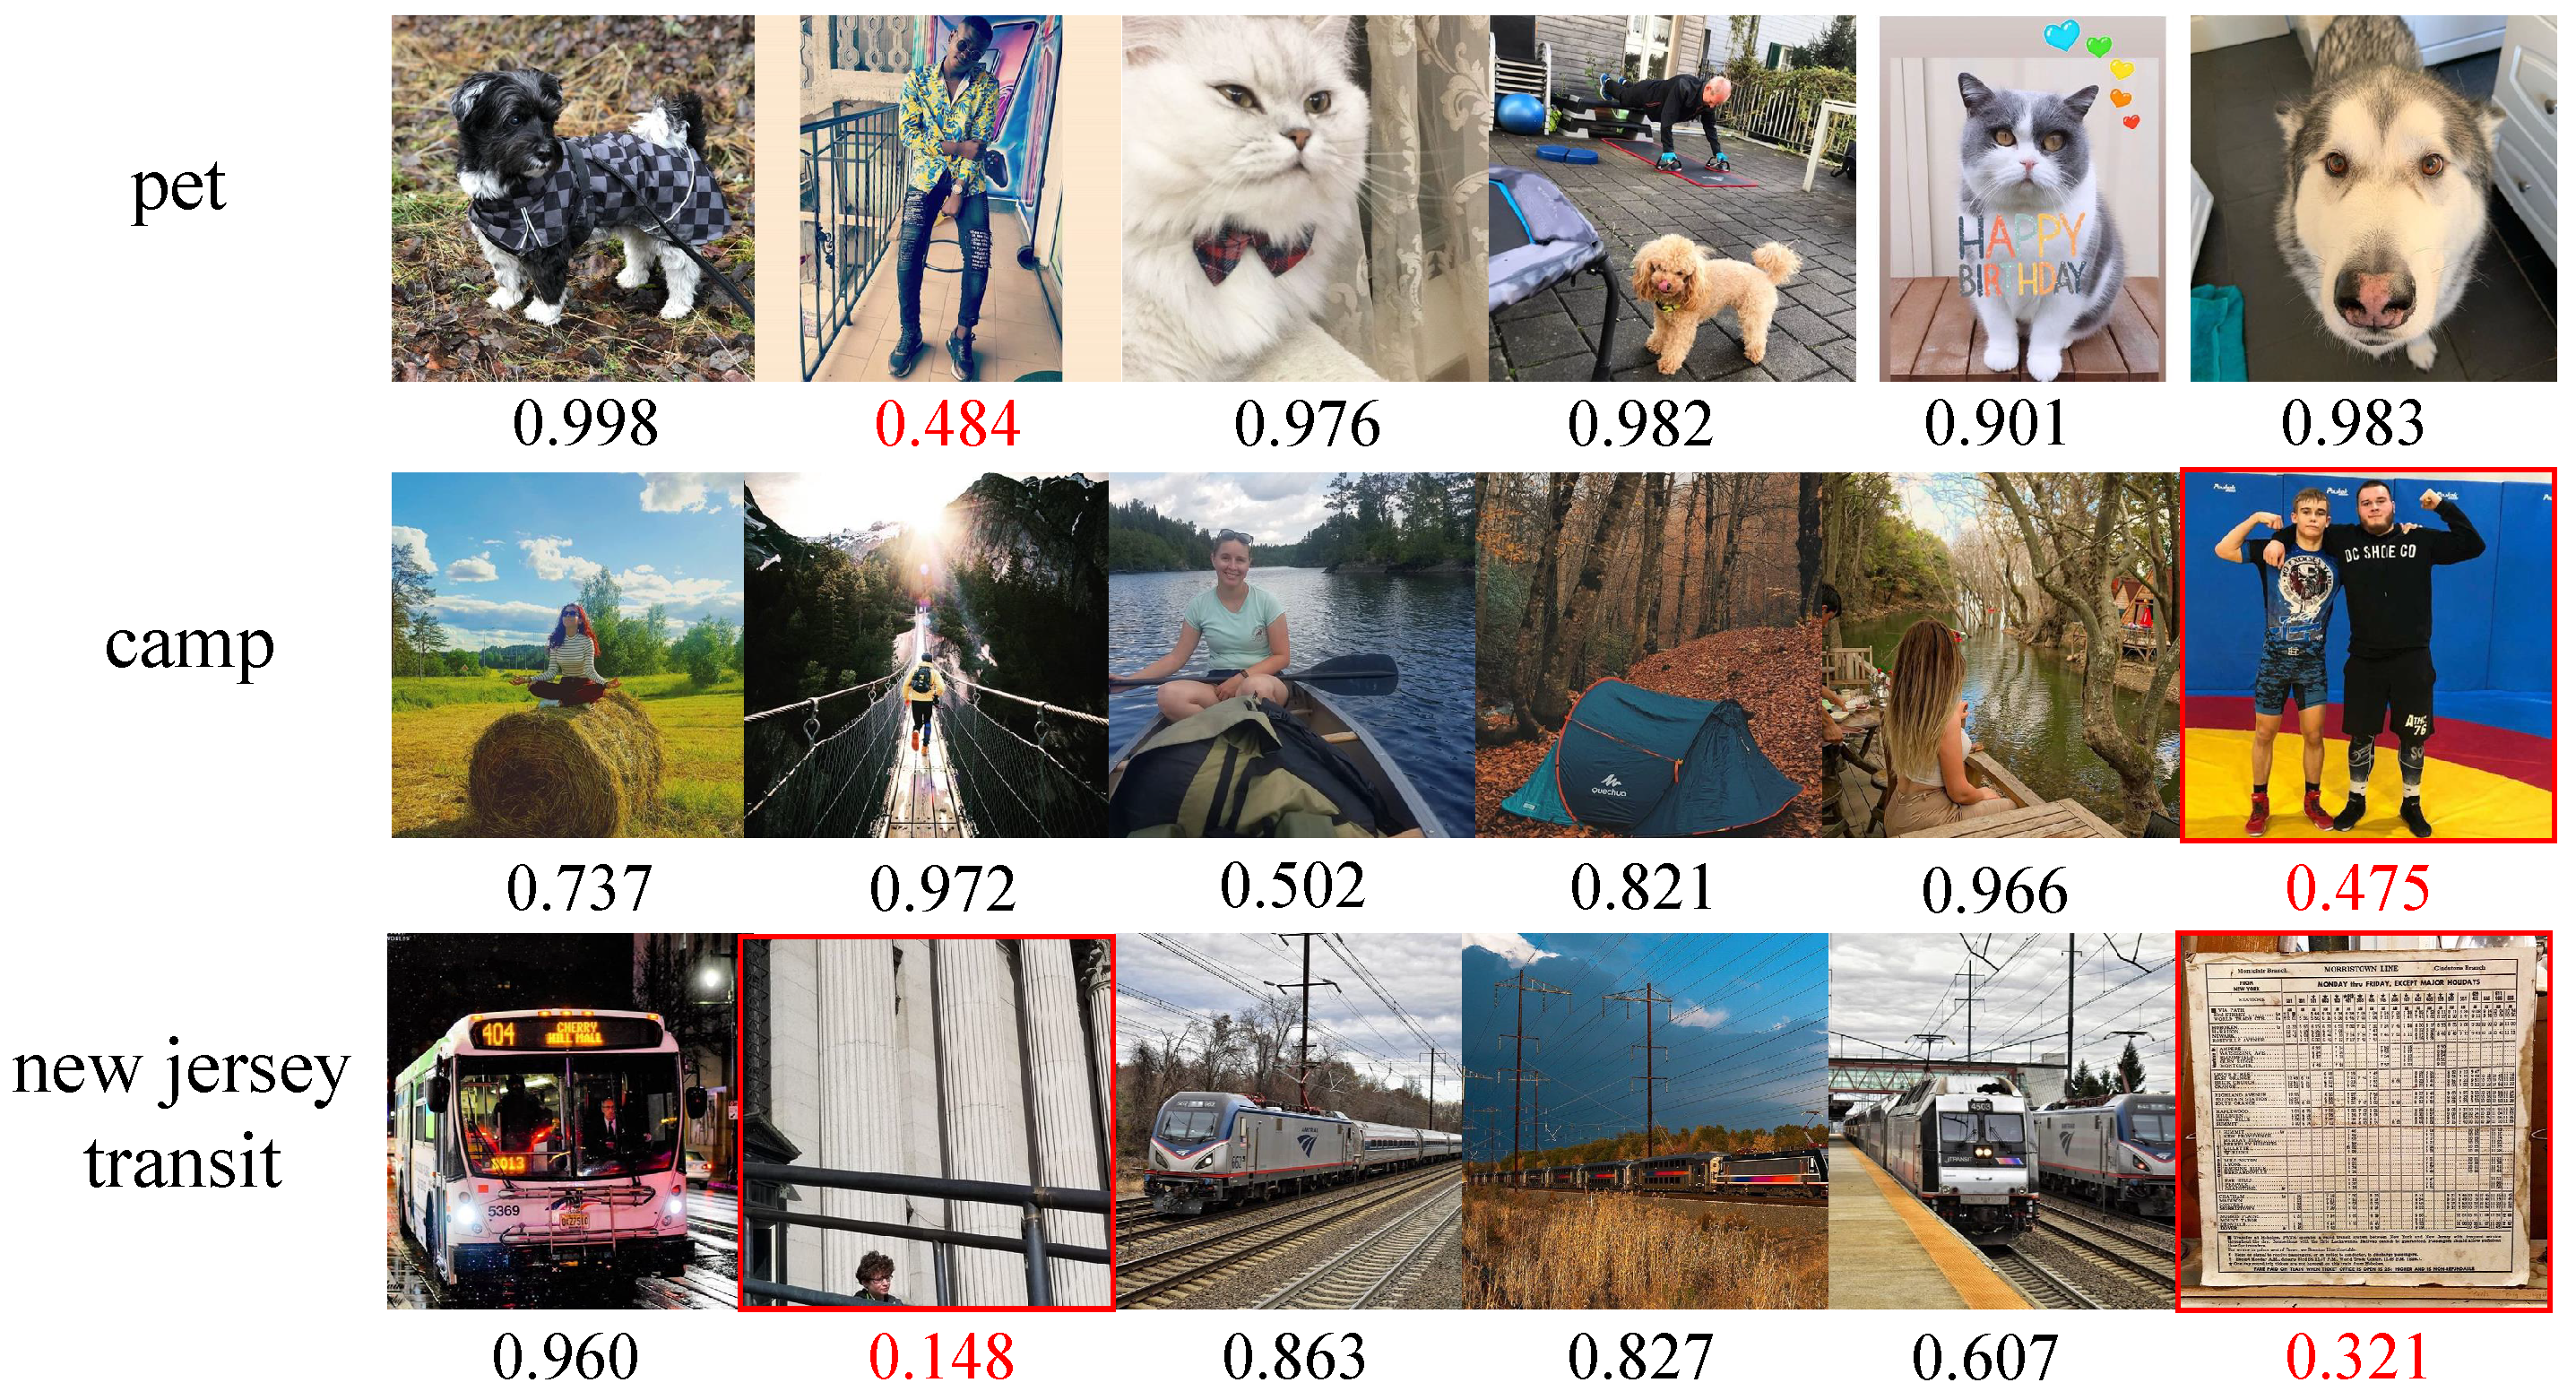
5.4. Qualitative Analysis

In this section, we present some examples of induced synsets using our VENUE model and the word2vec-based approach with the HAC clustering method in Table 5. In the table, each row denotes the predicted synsets. Note that the italic examples are the wrong predictions. The corresponding images for text are omitted for simplicity.
For the first row, the word2vec+HAC method predicts “oil_paints”, “oil_paint”, and “the_stone” belonging to the same synset. The “the_stone” denotes the music band, and the “oil_paints” denotes painting with paint. They both refer to the meaning of the art. Therefore, this confuses the word2vec + HAC method. But, the VENUE + HAC method accurately predicts the results. Compared with the word2vec-based method, our method leverages more multimodal information to help the model distinguish which one is correct. For the second row, the word2vec + HAC method has a wrong prediction “helana” and a missing “monarch”. However, the VENUE-based method can correctly make predictions. For the fourth row, however, the VENUE + HAC method also makes some wrong predictions, such as “trolley_car” and “njt”. In our data, “trolley_car” denotes trains with tracks, and “njt” denotes a new jersey transit. Thus, “trolley_car” and “njt” have partial similarity in visual content and text content, which causes confusion for the VENUE model.

6. Related Work

In this section, we review previous works from two categories, the synset induction and the multimodal representation for multimodal instances.

6.1. Synset Induction

The task of synset induction is to automatically cluster semantically identical instances. Most previous works on the synset induction task have been developed from the linguistic perspective. In other words, only a collection of tags is given for clustering identical semantics. To this end, these methods can roughly be grouped into two categories: corpus statistics and pattern-based methods [7,8,9,10,11] and distributional representation-based methods [13,14,15,16].
As a pioneer work, Turney et al. [7] proposed an unsupervised learning algorithm with statistical information to recognize synonyms. To address the large-scale data, Nakashole et al. [8] proposed a pattern-based algorithm to capture the synonyms explicitly and construct a taxonomy using these synonyms. However, these methods lack semantic understanding for effectively mining the synsets. Subsequently, Shen et al. [9] proposed a ranking-based unsupervised ensemble method to expand the synsets, which selected context features for calculating distributional similarity. Qu et al. [10] proposed a framework that combined distributional features and textual patterns to predict synonym relation. Zhang et al. [11] built a neural classifier using multiple contexts to determine whether two entities had a synonym relationship and then discovered synonyms from a free-text corpus without structured annotations. However, previous methods focus on the patterns, which cannot effectively capture the semantics of tag words. In order to alleviate the problem, inspired by the word2vec methods [19,32], the distributional representations have been incorporated for the synset induction task [13,14,15]. Mamou et al. [13] presented an end-to-end workflow to induce synsets, which were based on multi-context word embedding. Furthermore, Shen et al. [14] proposed a SynsetMine method to learn the holistic semantics of synset. The learned semantics were then used to mine entity synsets. Wang et al. [15] proposed a SurfCon method to compute the semantic similarity between words, in which the surface form, and global context information was used.
The aforementioned linguistic-based methods ignore the contributions of visual information for the synset induction task. Fortunately, a few researchers started to notice this point and use visual information. Yin et al. [33] proposed a framework for clustering the visual instances by using the latent representation and the sparse coding. Chang et al. [34] formulated the clustering problem into a pairwise binary classification framework to determine whether an image pair belongs to the same cluster. Then, they proposed an adaptive clustering method based on convolutional networks. Furthermore, Thomason and Mooney [17] proposed a multimodal unsupervised clustering method, which used pre-trained visual and textual features to cluster multimodal instances. Yao et al. [35] presented a framework which used images and the accompanying text from the web pages to mine the same sense in images. Li et al. [36] proposed a single-stage contrastive clustering method that simultaneously performed instance-level and cluster-level clustering, and used different levels of contrastive loss guidance models to perform a joint representation learning in an end-to-end fashion. However, these methods have not explicitly considered the noise problem in images for semantics, which would impair the discriminative capability of the learned representations.

6.2. Learning Multimodal Semantic Representation

The key problem of synset induction with multimodal data is how to learn the discriminative multimodal representation. Most previous methods have mainly focused on the image-text balanced data, such as an image with a descriptive caption. Kiros et al. [37] proposed a unifying visual-semantic embedding to learn the multimodal representation, which used the vanilla CNN and Long Short-Term Memory (i.e., LSTM) to learn visual feature and textual feature, respectively. Furthermore, considering the partial order between images and language, Vendrov et al. [38] proposed an order multimodal embedding by constructing a visual semantic hierarchy mapping. Mao et al. [39] applied the encoder–decoder framework to learn semantic relationships by using a language model. Inspired by the Faster R-CNN model [40], Anderson et al. [41] proposed a bottom-up and top-down combined attention mechanism for a deep understanding of the image-text multimodal information. Furthermore, very few works have considered image–text unbalanced data, such as an instance composed of a tag and a collection of images. Kiela et al. [42] proposed a combination of a pre-trained CNN and a skip-gram language model, which designed CNN-Max and CNN-Mean to improve the semantic representations of the collection of images. However, CNN-max and CNN-mean will introduce additional noise in the representation dimension and impair the semantic representation.
In addition, previous works have implicitly considered the contributions of different modalities. Thoma et al. [43] proposed a method for cross-modal knowledge fusion, which verified that the fusion of modalities in a shared concept space can produce a more comprehensive representation. Wang et al. [44] built a multimodal model to dynamically fuse the semantic representations from different modalities according to different types of words and proposed a dynamic fusion method to assign importance weights to each modality. Furthermore, Wang et al. [45] designed associative multi-channel autoencoders to learn the associations between textual and perceptual modalities and fuse these representations. Berger et al. [46] proposed a novel computational model of child language acquisition, which primarily simulates the multimodal manner of children learning multimodal word categorization. To summarize, unbalanced text–image data have seldom been considered for learning semantic representation. In addition, the difference between visual and linguistic contributions has insufficiently been addressed for learning semantic representation. Our work leverages intra-modal and inter-modal interactions to effectively learn multimodal semantic representations.

7. Conclusions and Future Work

In this paper, we propose a neural encoder named VENUE to learn a visually enhanced multimodal neural representation for the synset induction. The key insight lies with multimodal representations through the intra-modal and inter-modal interactions. For the intra-modal interaction, we use the attention mechanism to capture the correlation among images. To obtain the multi-granularity textual representations, we fuse pre-trained tags and word embedding. For the inter-modal interaction, we design a masking module to filter out the weakly relevant visual information. Furthermore, we present a gating module to adaptively regulate the modalities’ contributions to semantics. To train the VENUE encoder, we adopt a triplet loss in an end-to-end fashion. Finally, clustering algorithms, such as k-means and HAC, are used to induce synsets. Extensive experiments are conducted on our collected MMAI-Synset. The results show that our proposed method outperforms strong baselines on three groups of popular metrics.
Nevertheless, there is some interesting work to be investigated in the future. We notice that existing multimodal synset induction methods pay less attention to very fine-grained multimodal representation. Therefore, one line of work is to introduce a regional-level masking mechanism to generate fine-grained multimodal representation. Another line is to introduce reinforcement learning to narrow the gap between the training objective and evaluation metrics in the synset induction task. We hope that these two directions could improve the performance of the multimodal synset induction. Moreover, Multimodal Large Language Models (MLLMs) [47]—as a rising research topic—have attracted various applications. How to apply the MLLMs on our targeted multimodal task is an interesting problem.

Author Contributions

Conceptualization, F.F. and R.L.; methodology, G.C.; software, G.C.; validation, F.F., G.Z. and X.L.; formal analysis, G.C.; investigation, G.Z.; resources, R.L.; data curation, G.C.; writing—original draft preparation, G.C.; writing—review and editing, R.L.; visualization, X.L.; supervision, R.L.; project administration, F.F.; funding acquisition, R.L. All authors have read and agreed to the published version of the manuscript.

Funding

This work was supported in part by the National Natural Science Foundation of China under Grant 62076032.

Data Availability Statement

Publicly available datasets were analyzed in this study. This data can be found here: (https://github.com/cgpeter96/MMAI-synset).

Acknowledgments

The authors would also like to thank the editor and anonymous reviewers for their valuable comments to improve the final version of this article.

Conflicts of Interest

The authors declare that they have no conflict of interest.

References

  1. Baltrušaitis, T.; Ahuja, C.; Morency, L.-P. Multimodal machine learning: A survey and taxonomy. IEEE Trans. Pattern Anal. Mach. 2019, 41, 423–443. [Google Scholar] [CrossRef] [PubMed]
  2. Zhang, W.; Yao, T.; Zhu, S.; Saddik, A.E. Deep learning–based multimedia analytics: A review. ACM Trans. Multimedia Comput. Commun. Appl. 2019, 15, 1–26. [Google Scholar] [CrossRef]
  3. Zhu, W.; Wang, X.; Li, H. Multi-modal deep analysis for multimedia. IEEE Trans. Circuits Syst. Video Technol. 2020, 30, 3740–3764. [Google Scholar] [CrossRef]
  4. Vinyals, O.; Toshev, A.; Bengio, S.; Erhan, D. Show and tell: A neural image caption generator. In Proceedings of the 2015 IEEE Conference on Computer Vision and Pattern Recognition (CVPR), Boston, MA, USA, 7 June 2015; pp. 3156–3164. [Google Scholar] [CrossRef]
  5. Wei, H.; Li, Z.; Huang, F.; Zhang, C.; Ma, H.; Shi, Z. Integrating scene semantic knowledge into image captioning. ACM Trans. Multimed. Comput. Commun. Appl. 2021, 17, 1–22. [Google Scholar] [CrossRef]
  6. Zha, Z.-J.; Liu, D.; Zhang, H.; Zhang, Y.; Wu, F. Context-aware visual policy network for fine-grained image captioning. IEEE Trans. Pattern Analysis Mach. Intell. 2022, 44, 710–722. [Google Scholar] [CrossRef] [PubMed]
  7. Turney, P.D. Mining the web for synonyms: PMI-IR versus LSA on TOEFL. In Proceedings of the 12th European Conference on Machine Learning (ECML), Freiburg, Germany, 5 September 2001; pp. 491–502. [Google Scholar]
  8. Nakashole, N.; Weikum, G.; Suchanek, F. PATTY: A taxonomy of relational patterns with semantic types. In Proceedings of the 2012 Joint Conference on Empirical Methods in Natural Language Processing and Computational Natural Language Learning (EMNLP-CCL), Abu Dhabi, United Arab Emirates, 7 September 2012; pp. 1135–1145. [Google Scholar]
  9. Shen, J.; Wu, Z.; Lei, D.; Shang, J.; Ren, X.; Han, J. SetExpan: Corpus-based set expansion via context feature selection and rank ensemble. In Machine Learning and Knowledge Discovery in Databases; Ceci, M., Hollmén, J., Todorovski, L., Vens, C., Džeroski, S., Eds.; Springer International Publishing: Cham, Switzerland, 2017; pp. 288–304. [Google Scholar]
  10. Qu, M.; Ren, X.; Han, J. Automatic synonym discovery with knowledge bases. In Proceedings of the 23rd ACM SIGKDD International Conference on Knowledge Discovery and Data Mining, Halifax, NS, Canada, 13 August 2017; pp. 997–1005. [Google Scholar]
  11. Zhang, C.; Li, Y.; Du, N.; Fan, W.; Yu, P.S. Entity synonym discovery via multipiece bilateral context matching. In Proceedings of the Twenty-Ninth International Joint Conference on Artificial Intelligence (IJCAI), International Joint Conferences on Artificial Intelligence Organization, Yokohama, Japan, 7 January 2020; pp. 1431–1437. [Google Scholar] [CrossRef]
  12. Lossio-Ventura, J.; Bian, J.; Jonquet, C.; Roche, M.; Teisseire, M. A novel framework for biomedical entity sense induction. J. Biomed. 2018, 84, 31–41. [Google Scholar] [CrossRef] [PubMed]
  13. Mamou, J.; Pereg, O.; Wasserblat, M.; Dagan, I.; Goldberg, Y.; Eirew, A.; Green, Y.; Guskin, S.; Izsak, P.; Korat, D. Term set expansion based on multi-context term embeddings: An end-to-end workflow. In Proceedings of the The 27th International Conference on Computational Linguistics (COLING), Santa Fe, NM, USA, 20 August 2018. [Google Scholar]
  14. Shen, J.; Lyu, R.; Ren, X.; Vanni, M.; Sadler, B.; Han, J. Mining entity synonyms with efficient neural set generation. In Proceedings of the AAAI Conference on Artificial Intelligence (AAAI), Washington, DC, USA, 7 February 2019; Volume 33, pp. 249–256. [Google Scholar] [CrossRef]
  15. Wang, Z.; Yue, X.; Moosavinasab, S.; Huang, Y.; Lin, S.; Sun, H. Surfcon: Synonym discovery on privacy-aware clinical data. In Proceedings of the 25th ACM SIGKDD International Conference on Knowledge Discovery & Data Mining, Anchorage, AK, USA, 4 August 2019; pp. 1578–1586. [Google Scholar]
  16. Pei, S.; Yu, L.; Zhang, X. Set-aware entity synonym discovery with flexible receptive fields. IEEE Trans. Knowl. Data Eng. 2023, 35, 891–904. [Google Scholar] [CrossRef]
  17. Tomason, J.; Mooney, R.J. Multi-modal word synset induction. In Proceedings of the 26th International Joint Conference on Artificial Intelligence (IJCAI), Melbourne, Australia, 19–25 August 2017. [Google Scholar]
  18. Wang, X.; Girshick, R.; Gupta, A.; He, K. Non-local neural networks. In Proceedings of the IEEE Conference on Computer Vision and Pattern Recognition (CVPR), Salt Lake City, UT, USA, 18 June 2018; pp. 7794–7803. [Google Scholar]
  19. Mikolov, T.; Sutskever, I.; Chen, K.; Corrado, G.S.; Dean, J. Distributed representations of words and phrases and their compositionality. In Advances in Neural Information Processing Systems (NIPS); The MIT Press: Cambridge, MA, USA, 2013; pp. 3111–3119. [Google Scholar]
  20. Pinheiro, P.O.; Collobert, R. From image-level to pixel-level labeling with convolutional networks. In Proceedings of the 2015 IEEE Conference on Computer Vision and Pattern Recognition (CVPR), Boston, MA, USA, 7 June 2015; pp. 1713–1721. [Google Scholar] [CrossRef]
  21. Schroff, F.; Kalenichenko, D.; Philbin, J. Facenet: A unified embedding for face recognition and clustering. In Proceedings of the IEEE Conference on Computer Vision and Pattern Recognition (CVPR), Boston, MA, USA, 7 June 2015; pp. 815–823. [Google Scholar]
  22. Tang, Z.; Huang, J. Harmonious multi-branch network for person re-identification with harder triplet loss. ACM Trans. Multimed. Comput. Commun. Appl. 2022, 18, 1–21. [Google Scholar] [CrossRef]
  23. Rosenberg, A.; Hirschberg, J. V-measure: A conditional entropy-based external cluster evaluation measure. In Proceedings of the 2007 Joint Conference on Empirical Methods in Natural Language Processing and Computational Natural Language Learning (EMNLP-CoNLL), Prague, Czech Republic, 28–30 June 2007; pp. 410–420. [Google Scholar]
  24. Halkidi, M.; Batistakis, Y.; Vazirgiannis, M. On clustering validation techniques. J. Intell. Inf. Syst. 2001, 17, 107–145. [Google Scholar] [CrossRef]
  25. Vinh, N.X.; Epps, J.; Bailey, J. Information theoretic measures for clusterings comparison: Variants, properties, normalization and correction for chance. J. Mach. Learn. Res. 2010, 11, 2837–2854. [Google Scholar]
  26. Mahajan, D.; Girshick, R.; Ramanathan, V.; He, K.; Paluri, M.; Li, Y.; Bharambe, A.; Maaten, L.V. Exploring the limits of weakly supervised pretraining. In Computer Vision—ECCV 2018; Ferrari, V., Hebert, M., Sminchisescu, C., Weiss, Y., Eds.; Springer International Publishing: Cham, Switzerland, 2018; pp. 185–201. [Google Scholar]
  27. Řehůřek, R.; Sojka, P. Software Framework for Topic Modelling with Large Corpora. In Proceedings of the LREC 2010 Workshop on New Challenges for NLP Frameworks, ELRA, Valletta, Malta, 22 May 2010; pp. 45–50. [Google Scholar]
  28. Paszke, A.; Gross, S.; Massa, F.; Lerer, A.; Bradbury, J.; Chanan, G.; Killeen, T.; Lin, Z.; Gimelshein, N.; Antiga, L.; et al. Pytorch: An imperative style, high-performance deep learning library. In Proceedings of the Advances in Neural Information Processing Systems (NeurIPS), Vancouver, BC, Canada, 8–14 December 2019; pp. 8024–8035. [Google Scholar]
  29. Liu, L.; Jiang, H.; He, P.; Chen, W.; Liu, X.; Gao, J.; Han, J. On the variance of the adaptive learning rate and beyond. In Proceedings of the International Conference on Learning Representations (ICLR), Addis Ababa, Ethiopia, 26–30 April 2020. [Google Scholar]
  30. Rosvall, M.; Bergstrom, C.T. Maps of random walks on complex networks reveal community structure. Proc. Natl. Acad. Sci. USA 2008, 105, 1118–1123. [Google Scholar] [CrossRef] [PubMed]
  31. Radford, A.; Kim, J.W.; Hallacy, C.; Ramesh, A.; Goh, G.; Agarwal, S.; Sastry, G.; Askell, A.; Mishkin, P.; Clark, J.; et al. Learning transferable visual models from natural language supervision. In Proceedings of the 38th International Conference on Machine Learning (ICML), Virtual Event, 24 July 2021; Volume 139, pp. 8748–8763. [Google Scholar]
  32. Pennington, J.; Socher, R.; Manning, C.D. Glove: Global vectors for word representation. In Proceedings of the 2014 Conference on Empirical Methods in Natural Language Processing (EMNLP), Doha, Qatar, 25 October 2014; pp. 1532–1543. [Google Scholar]
  33. Yin, Q.; Wu, S.; Wang, L. Partially tagged image clustering. In Proceedings of the 2015 IEEE International Conference on Image Processing (ICIP), Quebec City, QC, Canada, 30 September 2015; pp. 4012–4016. [Google Scholar]
  34. Chang, J.; Wang, L.; Meng, G.; Xiang, S.; Pan, C. Deep adaptive image clustering. In Proceedings of the IEEE International Conference on Computer Vision (ICCV), Venice, Italy, 22 October 2017; pp. 5879–5887. [Google Scholar]
  35. Yao, Y.; Shen, F.; Zhang, J.; Liu, L.; Tang, Z.; Shao, L. Extracting multiple visual senses for web learning. IEEE Trans. Multimed. 2018, 21, 184–196. [Google Scholar] [CrossRef]
  36. Li, Y.; Hu, P.; Liu, Z.; Peng, D.; Zhou, J.T.; Peng, X. Contrastive clustering. In Proceedings of the Thirty-Fourth AAAI Conference on Artificial Intelligence (AAAI), New York, NY, USA, 7 February 2021. [Google Scholar]
  37. Kiros, R.; Salakhutdinov, R.; Zemel, R.S. Unifying visual-semantic embeddings with multimodal neural language models. In Proceedings of the Neural Information Processing Systems (NIPS), Deep Learning Workshop, Montreal, QC, Canada, 8 December 2014. [Google Scholar]
  38. Vendrov, I.; Kiros, R.; Fidler, S.; Urtasun, R. Order-embeddings of images and language. In Proceedings of the International Conference on Learning Representations (ICLR), Vancouver, BC, Canada, 30 April 2016. [Google Scholar]
  39. Mao, J.; Xu, J.; Jing, K.; Yuille, A.L. Training and evaluating multimodal word embeddings with large-scale web annotated images. In Proceedings of the Advances in Neural Information Processing Systems (NeurIPS), Barcelona, Spain, 5 December 2016; pp. 442–450. [Google Scholar]
  40. Ren, S.; He, K.; Girshick, R.; Sun, J. Faster r-cnn: Towards real-time object detection with region proposal networks. In Proceedings of the Advances in Neural Information Processing Systems (NeurIPS), Montreal, QC, Canada, 7 December 2015; pp. 91–99. [Google Scholar]
  41. Anderson, P.; He, X.; Buehler, C.; Teney, D.; Johnson, M.; Gould, S.; Zhang, L. Bottom-up and top-down attention for image captioning and visual question answering. In Proceedings of the IEEE Conference on Computer Vision and Pattern Recognition (CVPR), Salt Lake City, UT, USA, 18 June 2018; pp. 6077–6086. [Google Scholar]
  42. Kiela, D.; Bottou, L. Learning image embeddings using convolutional neural networks for improved multi-modal semantics. In Proceedings of the 2014 Conference on Empirical Methods in Natural Language Processing (EMNLP), Doha, Qatar, 25 October 2014; pp. 36–45. [Google Scholar]
  43. Thoma, S.; Rettinger, A.; Both, F. Knowledge fusion via embeddings from text, knowledge graphs, and images. arXiv 2017, arXiv:1704.06084. [Google Scholar]
  44. Wang, S.; Zhang, J.; Zong, C. Learning multimodal word representation via dynamic fusion methods. In Proceedings of the 32nd AAAI Conference on Artificial Intelligence (AAAI), New Orleans, LO, USA, 7 February 2018; pp. 5973–5980. [Google Scholar]
  45. Wang, S.; Zhang, J.; Zong, C. Associative multichannel autoencoder for multimodal word representation. In Proceedings of the 2018 Conference on Empirical Methods in Natural Language Processing (EMNLP), Association for Computational Linguistics, Brussels, Belgium, 31 October 2018; pp. 115–124. [Google Scholar] [CrossRef]
  46. Berger, U.; Stanovsky, G.; Abend, O.; Frermann, L. A Computational Acquisition Model for Multimodal Word Categorization. In Proceedings of the 2022 Conference of the North American Chapter of the Association for Computational Linguistics: Human Language Technologies, Seattle, WA, USA, 10–15 July 2022; pp. 3819–3835. [Google Scholar]
  47. Yin, S.; Fu, C.; Zhao, S.; Li, K.; Sun, X.; Xu, T.; Chen, E. A Survey on Multimodal Large Language Models. arXiv 2023, arXiv:2306.13549v1. [Google Scholar]
Figure 1. An illustration of multimodal instances. Two synsets, each composed of two instances, are presented. The top synset is a collection of “four-wheel vehicles”, and the bottom is a collection of “Turnsole Flowers”. Note that each tag is accompanied by multiple images, for example, the tag “Car” is accompanied by fifty images in our setting.
Electronics 12 03521 g001
Figure 2. The overview of our proposed VENUE. The top right shows the modules of VENUE. Our method comprises two steps. First, we train our VENUE on the multimodal instances to learn multimodal representations during the training phase. Then, we perform a clustering process on multimodal representations extracted by the proposed VENUE to induce synsets.
Electronics 12 03521 g002
Figure 3. The visualization of masking module’s effectiveness. Three tags and their accompanying six images are given. The red rectangles denote that the images need to be masked. The corresponding scores below all the images indicate the degree of relevance to their tags.
Electronics 12 03521 g003
Figure 4. The model performance with different parameter configurations using the bar chart. The X-label and Y-label denote the dimensionality of hidden and output neural units, i.e., D c and D g , respectively. The results of the Z-label denote the evaluation index. The three sub-figures from the left to the right are for ARI, FMI, and NMI indices, respectively. For clarity, the highest scores are accordingly annotated.
Electronics 12 03521 g004
Table 1. The basic statistics of our MMAI-Synset dataset.
No.CharacteristicsQuantity
1# Noun Phrases8509
2# Images425,450
3# Instances for Training7833
4# Instances for Testing676
5# Synonyms for Training3911
6# Synonyms for Testing209
Table 2. The tag length distributions in our MMAI-Synset.
Tag LengthTraining Set (%)Testing Set (%)
149.6046.62
237.6038.80
310.5011.50
40.220.74
Table 3. The experimental results of comparison with baseline methods on three groups of evaluation metrics. The encoders were combined with k-means or HAC clustering algorithms. The scores for all metrics are shown in percentage (%). The score in boldface means the highest and that of underline is second place.
EncoderClusteringhcvprfARIFMINMI
word2veck-means89.1991.2290.1939.8954.7046.1345.9146.7190.20
CNN80.3885.3182.7716.3733.9122.0827.7123.5682.81
[ word 2 vec ; CNN ] 83.0787.1885.0722.6241.5829.3028.9830.6785.10
word2vecHAC90.0994.6592.3136.8573.1449.0048.7651.9692.35
CNN72.5085.9178.644.4443.448.057.4613.8978.92
[ word 2 vec ; CNN ] 85.3192.0988.5722.2662.9932.9032.5437.4588.64
SynsetMine [14]-94.2691.6992.9658.8055.8157.2657.1257.2892.97
InfoMap [30]-98.6387.0792.4969.9730.5642.5442.4246.2492.67
MWSI [17]HAC94.1193.4993.8053.1966.0958.9458.7859.2993.80
CLIP [31]HAC91.4895.7393.5640.8679.9554.0853.8657.1693.56
VENUEk-means92.5394.7293.6153.6073.6462.0461.8962.8393.61
HAC96.4193.7995.0862.8167.9565.2865.1565.3395.08
Table 4. Ablation studies on the VENUE model. Four variants with k-means and HAC clustering algorithms are evaluated. The “w/o att” denotes that the visual interaction module is removed from the VENUE. The “w/o mge” denotes that the multi-granularity embedding module is removed from the VENUE. The “w/o mask” denotes the masking module is removed from the VENUE. The “w/o gate” denotes the gating module is removed from the VENUE. The scores in boldface mean the highest in the corresponding columns.
EncoderClusteringhcvprfARIFMINMI
VENUE (w/o att)k-means89.5590.9790.2644.3154.4648.8648.8549.1290.26
VENUE (w/o mge)87.6489.4088.5236.1947.5241.0940.8541.4788.52
VENUE (w/o mask)92.2993.3792.8355.6164.9859.9359.7860.1192.83
VENUE (w/o gate)91.6593.1492.3952.7665.1058.2858.1258.6092.39
VENUE92.5394.7293.6153.6073.6462.0461.8962.8393.61
VENUE (w/o att)HAC91.3395.7193.4740.7079.3353.8053.5856.8293.47
VENUE (w/o mge)93.1692.3892.7750.2561.5155.3155.1455.6092.77
VENUE (w/o mask)94.9694.2094.5854.5170.3061.4161.2561.9094.58
VENUE (w/o gate)95.1392.8793.9953.7363.3758.1557.9958.3593.99
VENUE96.4193.7995.0862.8167.9565.2865.1565.3395.08
Table 5. Exemplar results given by the synset induction methods, word2vec and VENUE. A pair of brackets {} denotes a synset. The italic tags are the predicted tags, which are out of the ground truth. For example, the predicted tag “the_stones” is not in the ground truth synset, oil_paints, old_paint, oil. The corresponding images are all omitted for clarity.
# SynsetGround TruthWord2VecVENUE
1{oil_paints, old_paint, oil}{oil_paints, oil_paint, oil, the_stones}{oil_paints, oil_paint, oil}
2{king, monarch, queue}{helena, king, queue}{king, monarch, queue}
{monarch}
3{streetcar, tram, trolley_car, trolley}{trolley_car, trolley, njt}{streetcar, tram, trolley}
{streetcar, cp_rail, cpr, canadian_pacific_railway}{trolley_car, njt}
Disclaimer/Publisher’s Note: The statements, opinions and data contained in all publications are solely those of the individual author(s) and contributor(s) and not of MDPI and/or the editor(s). MDPI and/or the editor(s) disclaim responsibility for any injury to people or property resulting from any ideas, methods, instructions or products referred to in the content.

