Abstract
In this study, a novel pattern shaping technique is presented and applied to the uniquely designed multiple-input multiple-output (MIMO) radio altimeter antenna, acquiring area gain. Inspired by the behavior of the perfect electric conductor, the tendency to gather a diffuse pattern is exploited to create pattern shaping. A surface with a phase response of 0° at 3.824 GHz was designed to ensure that the target radio altimeter frequency of 4.3 GHz is in the immediate vicinity of the outer phase region, where the impedance is around 166.84 Ω, transforming the diffuse pattern of the top antenna into the target conical shape. Antenna reflection values are measured as −20.072 dB at 4.344 GHz (port 1) and −27.44 dB at 4.32 GHz (port 2), while there is 6 mm between the top antenna and its reflector. At 4.32 GHz, the envelope correlation coefficient is 0.0043, the diversity gain is 9.999, and the transmission value between the opposing ports is −29.08 dB, which indicates a low mutual coupling. A MIMO antenna with a measured gain of 10.1497 dBi for port 1 and 10.5617 dBi for port 2 conforming to the design criteria of the radio altimeter is achieved.
1. Introduction
The radio altimeter execution, which dates back to 1924–1925, is based on calculating the altitude of the aircraft from the ground with the principle of distance calculated according to the traveling time of electromagnetic waves sent in the radio band after hitting the surface and returning, as in the radar [1,2,3,4,5,6,7,8,9]. Calculating the ground clearance for aircraft is a primary requirement for flight safety. After the Second World War, when blind landing became widely used, the need for an altimeter system arose [10]. The design criteria of the antennas to be used for the radio altimeter have been determined by the International Telecommunication Union (ITU). Accordingly, the altimeter antenna’s gain should be between 8 and 13 dBi, and the half-power beamwidth (3 dB) is recommended to be between 35° and 60°. In the recommendation, the operating band is determined to be between 4200 and 4400 MHz, and the antenna should operate in horizontal mode. Although the center frequency is specified as 4300 MHz, there is a frequency shift tolerance for systems consisting of multiple antennas. In the proposed structure, it is aimed that both antennas operate at different center frequencies. Thus, the proposed structure can be evaluated as two different radio altimeter antennas, or as a single antenna consisting of a receiver and a transmitter. In commercial use, the two radio altimeter antennas are placed separately from each other to avoid interference. In MIMO structures, multiple antennas can radiate independently in a compact area. Since more than one antenna is ensured to work in a small area, it stands out with its space-saving feature. The proposed structure is designed as a multiple-input multiple-output (MIMO) system to provide space on the aircraft surface and indirectly reduce weight. Space saving and weight reduction are one of the most important design criteria in mobile vehicles, especially in aircraft, which is the subject of this study. Therefore, in aircraft such as airplanes and unmanned aerial vehicles, the MIMO structure comes to the fore for the design of antennas to occupy the least space. However, because the antennas are placed close to each other, this situation brings about a mutual coupling problem [11] and the coupling coefficient can be high [12]. Since low insulation will lead to an increase in interference, communication quality is compromised, so this issue should also be considered in MIMO designs [13,14]. Obtaining separate patterns through feeding from different ports can be accomplished by the beam forming method, which is used in aviation applications and satellite communications as well [15,16,17]. In this paper, a MIMO radio altimeter antenna is proposed with enhanced radiation properties owing to its reflective surface. The reflective surface is designed so that it organizes the diffuse pattern of the antenna while reaching radio altimeter targets at the same time. The design has been conducted with the unique top MIMO antenna, which has a pattern that will work with the reflective properties of this surface. To create such a reflective surface, the electromagnetic band gap (EBG) features were evaluated with a different interpretation. EBG, which is considered as a sub-branch of metamaterials, creates surface wave suppression by stopping the advancement of surface waves on its surface and forms stop bands in the intended frequency band. The basic logic established for the formation of these band gaps is the resonance formed by capacitance created by the gaps between the unit cells, and the inductance taking place by the connection of the upper conductor and the ground plane. Studies on photonic band gap (PBG) structures, which can be considered the pioneer of electromagnetic band gap structures, were published by E. Yablonovitch in 1993 [18] and studies on this subject gained momentum [19,20]. In 1999, high-impedance surfaces which created bandgaps were defined by Dan Sievenpiper et al. [21]. After these developments, studies followed, in which these surfaces were used as the ground plane along with other metamaterials for antennas, improving the antenna properties [21,22,23,24,25,26,27]. EBG structures are used for mutual coupling reduction [28,29], isolation from other environments [30,31], gain enhancement [32,33], or unique designs [34] in the antenna engineering field.
In this study, the phase response of EBG surfaces was evaluated from a different perspective, inspired by the reflective behavior of perfect electric conductor (PEC) and perfect magnetic conductor (PMC) structures. Here, it is foreseen based on the observations of the authors that being in the outside vicinity of the EBG phase region helps to regularize a scattered radiation pattern. While PEC surfaces have a tendency to gather the diffused pattern of an antenna when they are close, PMC surfaces tend to protect the pattern as it is. From here, the low-impedance region in the outside vicinity of EBG structures was associated with PEC.
The proposed technique consists of a surface design with a resonant band in a range lower than the final target frequency, a top antenna design with its frequency at the upper end of the surface’s resonance band, and keeping the final target frequency in the low-impedance region directly outside the resonance region. With this foresight, starting with the diffuse pattern antenna, the technique that enables the design of a conical pattern radio altimeter antenna with the high radiation characteristics demanded by ITU has been successfully applied, and space savings have been achieved in the aircraft.
2. Materials and Methods
Antenna Design and Its Operational Principle
The main motivation for the authors to work outside the EBG phase region for pattern shaping is that PEC surface reflection tends to make a diffuse pattern more compact when the antenna is near the surface, while PMC-type surface reflection tends to preserve or further disperse the diffuse pattern.
An example of this foresight is shown in Figure 1. Figure 1a shows an antenna, whose pattern is diffused, operating at 4.3 GHz. In Figure 1b, this antenna is placed over an EBG structure with zero phase response at 4.3 GHz, which can be considered a PMC, and in Figure 1c, it is placed over a copper plate, which can be considered a PEC.

Figure 1.
An example of the effect of PEC and PMC surfaces on the pattern. The antenna (a), antenna and bottom EBG plate (b), antenna and bottom copper plate (c).
The distance between the antenna–copper and antenna–EBG is the same. As can be seen from the figure, in the PEC simulation, the pattern is concentrated in a single lobe, and in the PMC simulation, the pattern is divided into three parts.
The proposed MIMO structure consists of two opposing planar antennas and a reflective surface placed below them. While creating the structure of the antenna, the priority was to make it radiate both above and below the plane, thus creating a remarkable power reflection when the reflective surface was placed underneath. Namely, to utilize the EBG surface, the top planar antenna had to radiate on both surfaces of the plate so that the wave hitting the reflective surface could be collected and propagated at the top of the structure. This was made possible by adjusting the size of the planar antenna greater than 1.5 wavelengths. This step caused the top antenna pattern to split to be visible on both plate surfaces.
Radio altimeter antennas are required to radiate horizontally polarized Hence, firstly, the top antenna is meant to be designed as a planar type. Secondly, the goal was to achieve area gain with a MIMO setup. For the radio altimeter’s conical pattern, it was better to place the radiating parts on MIMO face-to-face, working as directors for each other to obtain a better conical shape.
The MIMO antenna seen in Figure 2 has a width of 109.74 mm and a length of 146.5 mm (see Table 1). The thickness of the dielectric substrate layer is 1.524 mm. The permittivity value of the Isola dielectric material is εr = 3.
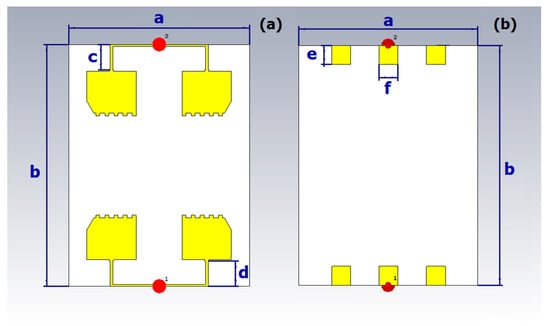
Figure 2.
Dimensions of antenna front face (a), and the backside (b).

Table 1.
Dimensions of the antenna (mm).
The copper patch structures placed at the backside of the plate can be called ground planes, which the antenna arm would take as a reference surface, and are squares with a side length of 11.57 mm. The entire surface on the backside was not chosen as the ground plane. Instead, partial support was provided on the ground plane with parasitic patch structures located next to the middle piece.
When these parasitic patches are removed, the targeted antenna properties cannot be obtained. Although the structure in the upper copper layer presents the appearance of a dual structure, it forms a single arm of the antenna. Here, the enlargement and the square cuts placed at the extreme edges of those antenna arms are intended to increase the antenna gain. In addition, the outermost points of these arms were trimmed with the slanting cut; hence, the antenna beamwidth was narrowed in accordance with the design criteria of the radio altimeter antenna. The feed line given in Figure 3 with a close-up view was started directly from the laminate edge in order to not disturb the wave that will be reflected from the reflective surface, and it was designed with a thickness of 1.13 mm based on the t-shape divider. The arms and the supply line are combined together. Thus, the thickness of this line was gradually increased from 1.69 mm to 2.56 mm and finally reached its maximum size to increase the effective antenna aperture at the very far end. There is a slight difference between the length of the two opposite arms to make their resonance frequencies different from each other. In addition, when the same dimensions of both antennas were selected, both antennas can radiate at 4.3 GHz. This situation was also simulated, and anticipated results were obtained. The reflective surface consisting of 24 unit elements was designed according to the requirements of the phase–frequency relationship between the surface and the antennas at the upper layer (the top antenna). Its substrate material is FR4 with a dielectric constant of εr = 4.3 with a thickness of 1.6 mm. It is 109.74 mm wide and 164.62 mm long, as seen in Figure 4. The dimensions are given in Table 2. At the very beginning of the reflective surface design, the basic square-unit cell dimensions were obtained by using the EBG fundamentals, whose equivalent circuit diagram can be seen in Figure 5.
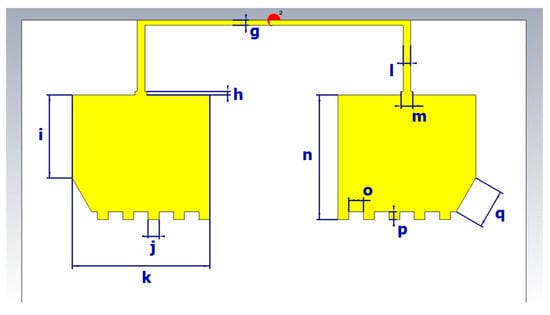
Figure 3.
Dimensions of antenna front face with a close-up view.
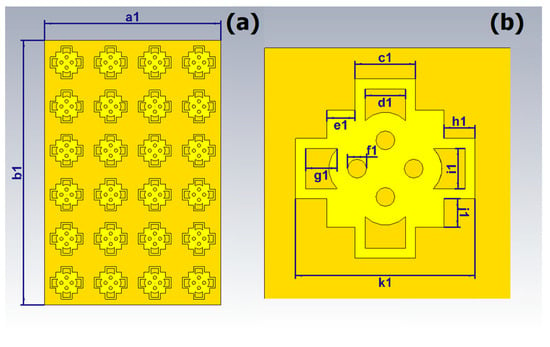
Figure 4.
Dimensions of reflective surface (a) and its unit element (b).

Table 2.
Dimensions of the reflector surface, and its unit cell (mm).
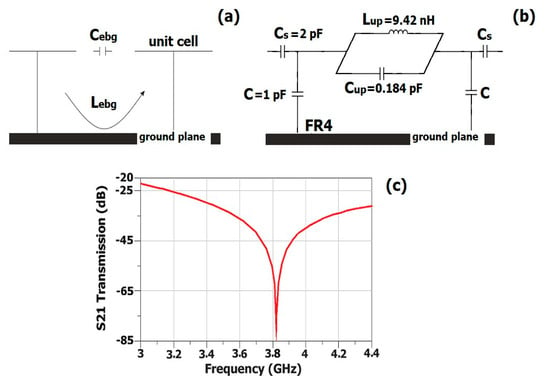
Figure 5.
Equivalent circuit diagram of EBG unit cell (a) [18], the approximate equivalent circuit diagram of the proposed surface (b), tangential surface wave transmission behavior derived from the equivalent circuit of the proposed surface (c).
The proposed unit cell was designed with the changes made in the continuation of the study, resulting the response given in Figure 5b,c [35,36].
Here, Cebg is the capacitance, Lebg is the inductance, and febg is the resonance frequency. The EBG width, dielectric height, and the distance between two unit cells are denoted by webg, hebg, and gebg, respectively. The approximate equivalent circuit of the proposed surface is given when looking at the cross-sectional area along with its tangential surface wave transmission behavior in Figure 5, which approves the simulation results of the surface. The capacitance C occurs in the gaps formed by the absence of vias in the unit cells. Capacitance (Cup) is created by cuts on the surface that increase the total capacitance, causing a drop in frequency. Cs symbolizes the capacity caused by the separation of unit cells. The engraved parts from the surface edges reduce the inductance and hence increase the resonance frequency. In the figure, Lup represents the inductance of the surface. While applying these instruments, it was considered that the total unit cell size remains almost the same. While trying to reach the desired resonance frequency, if the inductance was reduced by clipping the edges of the unit cell more and more without opening the gaps on the surface, there would be a dramatic increase in the resonance frequency. With the gaps opened on the surface, smoother transitions in frequency could be obtained. For a visual explanation, the frequency responses are shown in Figure 6 for a square unit cell of the same dimensions, a unit cell with no slots on it, and the proposed unit cell. The frequencies at which the zero-degree phase response of the unit cell occurs are shown in Figure 6. While designing the reflective surface, a unit cell simulation was run by locating the source λ/2 far from the unit cell surface (Figure 6). Although unit cells of various sizes can be designed to achieve a similar response, the dimensions of the proposed structure have been kept at a level suitable for production in the laboratory.
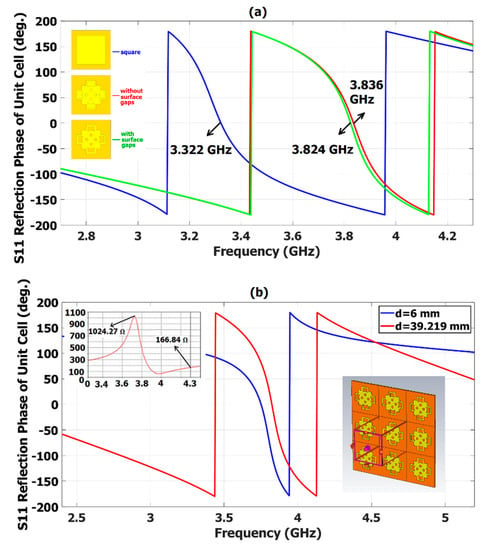
Figure 6.
Reflection phase response for the design stages of the unit cell (a). Phase angle variation of the reflective surface with respect to frequency and the unit cell boundary condition. The distance between the feed port and the surface is given with d. The surface impedance change is given in the upper left corner while the distance between the feed and the surface is 6 mm (b).
During measurements, small pieces of silicon 5 mm, 6 mm, and 7 mm in length were placed between the antenna and the reflective surface to keep them apart. It was observed that the measurements with and without silicon were the same. After similar calibration procedures, pattern measurements were performed using a reference antenna (Figure 7).
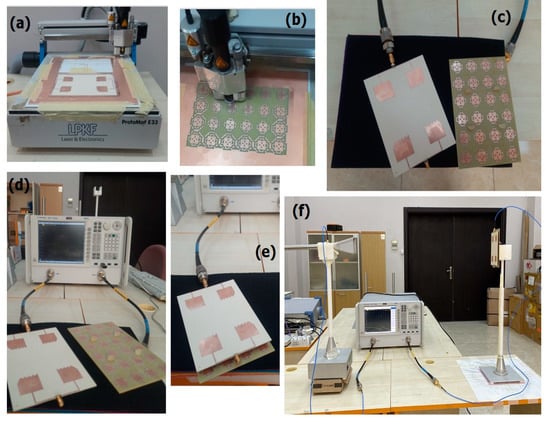
Figure 7.
Manufacturing of the antenna (a), and the reflective surface (b) by engraving. Top view of the whole structure (c). Measurement of the antenna without the reflector (d), and with the reflector (e). Pattern measurement setup (f).
3. Results and Discussion
Since the antennas are placed opposingly, they will affect each other like a director and change the pattern during the operation. Looking at the pattern of the top antenna given in Figure 14c, it is seen that the pattern is separated outward from both surfaces of the plate. This is because it was aimed to put a reflective surface at the backside of the antenna from the very beginning. It is desired to collect the energy on the upper side by reflecting the part of the pattern facing the reflective surface. The reflected energy merges with the energy that is already at the top.
The radio altimeter antenna requires wide beamwidth, high gain, and a conical pattern as defined in aviation standards. The effective aperture should increase to achieve these goals by increasing the antenna dimensions. However, the growth of sizes has an effect on the pattern. When the antenna length reaches more than one and a half wavelengths, the pattern ceases to split more than two parts. Thus, an antenna with a diffuse pattern emerges. Therefore, the need to gather the messy radiation pattern of the antenna occurs. To reach both of these goals at the same time, a couple of technical tricks were developed. These steps were taken with the foresight that a PMC reflector, which is defined as the ideal artificial magnetic conductor with its zero-degree reflection phase, preserves the antenna pattern. Accordingly, the whole resonance region of the reflective surface is avoided to prevent the messy pattern from being preserved. The first step is to set the operating frequency of the stand-alone top antenna (top section of the whole structure) lower than the final target frequency, 4.3 GHz. These frequencies (4.088 GHz and 4.116 GHz) will be referred to as the starting frequencies of the antenna in the rest of the manuscript. This step also results in a slight increase in antenna gain.
Because the frequency increases as the distance to the surface decreases, the radio altimeter band is reached. We propose that at the beginning, the starting frequencies of the top antenna should be chosen away from the zero-degree EBG reflection region and be close to the ends. We recommend performing this so that the target frequency, 4.3 GHz, remains outside of the phase curve but in the immediate vicinity after the top antenna and the surface are brought closer together and the frequency of the entire structure increased to the target frequency. At this stage, we want to be as close to the response curve as possible, as the phase values will decrease as we move away from the phase curve.
Thus, the second step is to design a unit cell so that its chosen frequency, in which the reflection phase angle of the surface is adjusted to 0°, is smaller than the operating frequencies of the top antenna to ensure that the starting frequencies are away from the zero-degree reflection region. Hence, the designed surface provides a reflection phase response of −170.47° and −176.77° at a half-wave distance to the feed, at the operating frequencies of the top antenna, 4.088 GHz and 4.116 GHz, respectively. In order to ensure the starting top antenna frequencies to be very close to the end of the response graph, gaps were opened on the unit cell and the phase response graph was slightly shifted to the left (see Figure 6). With the proposed solution, the need to change the unit cell and initial antenna dimensions is eliminated. Reducing the size of the top antenna and increasing the starting frequencies could be another solution here, but it would cause the antenna gain to decrease.
After these designs, in the first step, the distance between the top antenna and the reflective surface was kept at half a wavelength. At this altitude, the starting frequencies of the top antenna remain in the resonance phase region and the pattern of the whole structure is diffused, similarly to the pattern of the top antenna (see Figure 8).
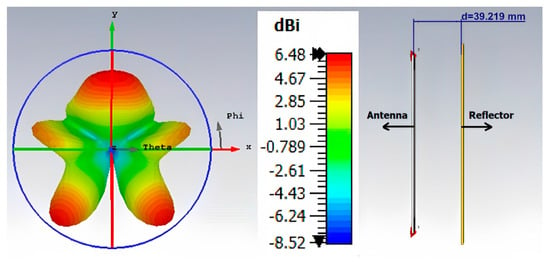
Figure 8.
The radiation pattern with its directivity scale, while the distance between the antenna and the reflective surface is 39.219 mm. The distance between the antenna and the surface is given with d.
The aforementioned half wavelength is 39.219 mm and belongs to the 3.822 GHz simulating frequency of the unit cell to acquire a 0° phase point for the reflective surface. In such a study, the 0° phase point is observed at 3.824 GHz. This can be seen in Figure 6. At a distance of 6 mm, the resonance region of the surface is on the left-hand side compared to the half wavelength response and occurs at lower frequencies. Thus, when the distance is 6 mm, both the two starting frequencies and the final frequency, 4.3 GHz, are out of the EBG resonance region (Figure 6). The final distance is 6 mm. Consequently, the necessary conditions for pattern editing are provided by paying attention to all these factors.
The surface impedance variation embedded in Figure 6 occurs when the feed point is 6 mm away from the surface. It is seen that the impedance is greater than a thousand ohms at the resonance frequency, and around 166 ohms at the 4.3 GHz frequency. Such an impedance indicates that the 4.3 GHz region is neither like a PEC nor PMC, but much more like PEC.
In Figure 9a, the distance between the unit cell and the feed is 39.219 mm, which is the half wavelength of the reflector’s 0° phase resonance frequency, while in Figure 9b, the distance is 6 mm. In Figure 9a, the surface current is negligible due to surface wave suppression. With the last distance of 6 mm between the unit cell and the feed as seen in Figure 9b, surface currents at 4.3 GHz are also observed since the surface impedance is lower. Figure 9c,d show the surface currents that occur when the whole structure is in operation. This figure is also another indication of the good isolation of the MIMO antenna.
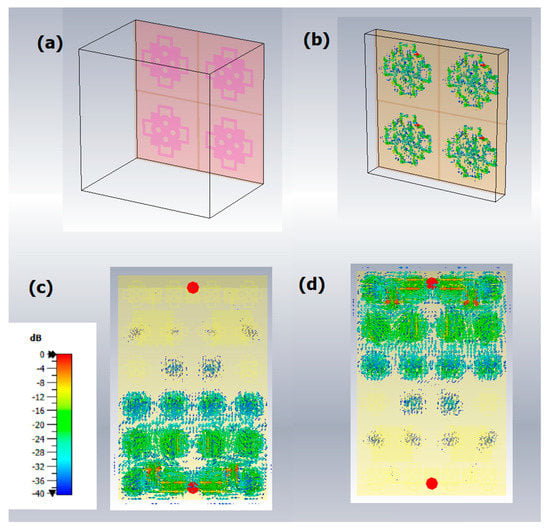
Figure 9.
Surface current representation. Surface current while the distance between the unit cell and the feed is 39.219 mm (a) and 6 mm (b). The surface current of the whole structure operating when port 1 is excited (c), and port 2 is excited (d).
The stand-alone top antenna, which consists of two antennas facing each other, is given in Figure 2. The antennas operate at 4.088 GHz and 4.116 GHz frequencies according to the simulation results. In Figure 10, the simulation results of the antenna, when there is no bottom surface, can be seen. The simulated resonance frequencies are 4.116 GHz and 4.088 GHz for port 1 and port 2, respectively. Their S11 and S22 values are −20.381 dB and −19.045 dB. Also, the graphics of S12 and S21 for both antennas are the same. These are simulated as −27.16 dB at 4.088 GHz and −27.23 dB at 4.116 GHz.
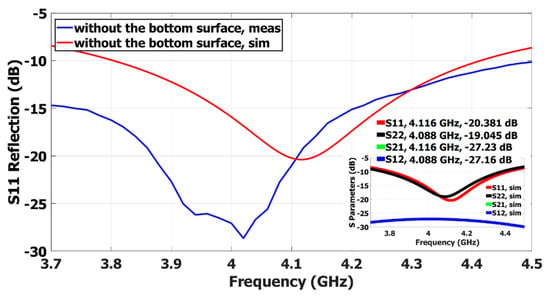
Figure 10.
S11 simulation and measurement results of the antenna without the reflector. S parameter simulation results of the antenna without the reflector are given on the right bottom corner.
In Figure 10, S11 simulation and measurement results are compared when there is no reflective surface under the antenna. According to the measurement results, the antenna of the first port of this structure resonates at a frequency of 4.02 GHz with a −28.645 dB S11 value. The simulation result of the same port occurs at 4.116 GHz with its S11 value as −20.381 dB, as stated earlier.
The operating frequency difference is observed between the simulation and measurement as 96 MHz that does not affect the design process.
In Figure 11, the S11 simulation and measurement phase results of the whole structure are given. There is a gap of 6 mm between the antenna and the surface, while the simulation and measurement results of the S11 phase angle are drawn together.
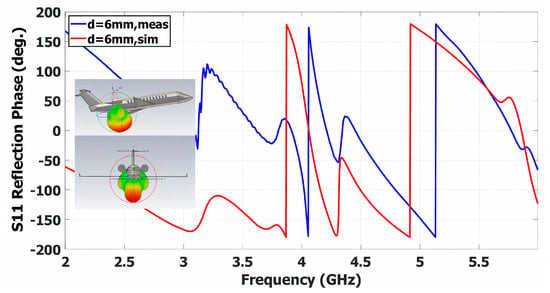
Figure 11.
A comparison of measurement and simulation results of S11 phase angle values with the reflective surface underneath. Side view and front view of the antenna with its reflector on a simulated life-size aircraft [37].
Since the antenna, that stands without the reflective bottom surface, does not have the same phase angles in simulation and measurement, it is not expected that the resultant phase graph, which is drawn for the results derived with the reflective surface, would be exactly the same. As can be seen in the figure, the phase characteristics are similar for simulation and measurement utilizing a 6 mm surface away from the antenna.
It is explained in the ITU recommendation that the receiver unit has a bandpass filter and rejects to collect power from other sources outside the operating band [38]. At the transmitter, the signal is generated and transmitted by the voltage-controlled oscillator (VCO) between 4.2 GHz and 4.4 GHz. It is also stated in the recommendation that the radio altimeter system will not be affected unless the signal is at the edge of the band. When the reflective surface is under the antenna, the transmission value is −29.84 dB at 4.3 GHz (Figure 12). The transmission value is measured as −29.41 dB at 4.344 GHz, which is the operating frequency of the first port, and −29.08 dB at 4.32 GHz, which is the operating frequency of the second port. These results indicate a low interference value for the two antennas on the MIMO.
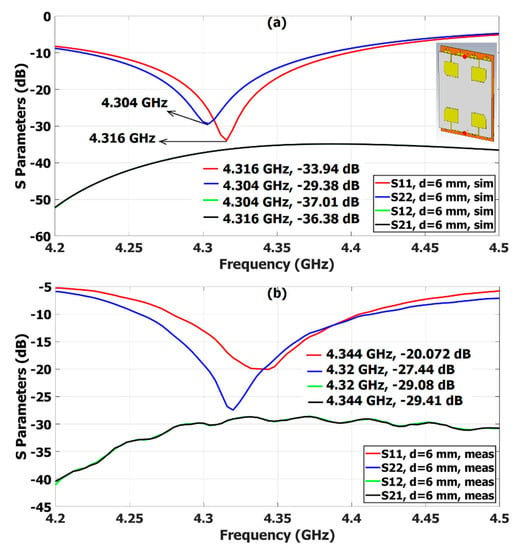
Figure 12.
S parameter simulation (a) and measurement (b) results when the distance between the antenna and the surface is 6 mm.
Low transmission values between the two antennas result in a high ability to operate independently and indicate a low interference for the two antennas on the MIMO. Again, S21 and S12 simulation values seen in Figure 12 are −35.37 dB at 4.344 GHz and −36.19 dB at 4.32 GHz in accordance with the reading, which was made at the operating frequencies of the measurement results. At the resonance frequencies obtained in the simulation, the transmission values can be given as −37.02 dB for 4.304 GHz and −36.38 dB for 4.316 GHz for a better comparison of the simulation and measurement results. It is understood that there is no significant difference between measurement and simulation results in terms of transmission results. In the simulation results, the antenna connected to the first port operates with −33.94 dB S11 at 4.316 GHz, and the antenna connected to the second port with −29.38 dB S11 at 4.304 GHz (see Figure 12). It is a preliminary indication that it can be used as a radio altimeter antenna before seeing the measurement result.
The S parameter results obtained from the measurements of the whole structure are collected in Figure 12. According to the S11 and S22 reflection measurement results of the antenna and the surface, which are on top of each other with a 6 mm gap as seen in Figure 12, the antenna connected to port 1 has a −20.072 dB value at 4.344 GHz, and the antenna connected to port 2 has a −27.44 dB at 4.32 GHz.
Considering the limits of the frequency band restricted with a −10 dB reflection value, the measurement bandwidth seems suitable for the 4.2 GHz–4.4 GHz band region applicable to the radio altimeter. In Figure 13, the simulation values of S11 are compared with respect to the distance between the antenna and the surface varying as 5 mm, 6 mm, and 7 mm. The operating frequencies are 4.348 GHz, 4.316 GHz, and 4.284 GHz, respectively. It is seen that the operating frequency decreases as the distance increases. Similarly, for these distances, the operating frequencies are 4.36 GHz, 4.344 GHz, and 4.28 GHz in the measurement (see Figure 13). S11 values are measured as −22.87 dB, −20.072 dB, and −18.53 dB, in the same frequency order.
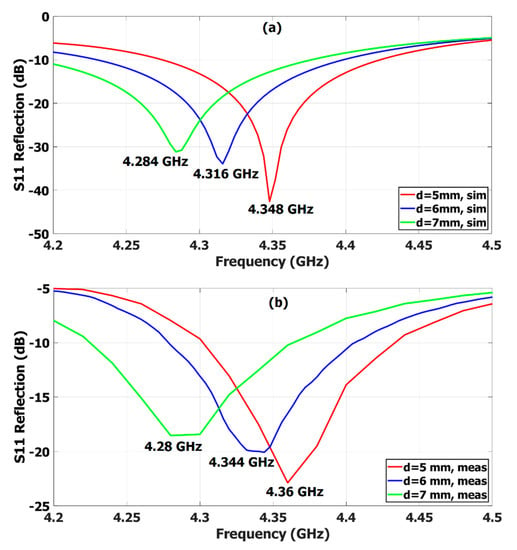
Figure 13.
S11 simulation (a) and measurement (b) results when the distance between the antenna and the surface is 5 mm, 6 mm, and 7 mm.
This means that this structure behaves in such a way that the operating frequency decreases as the distance between them increases according to the measurement results as well.
It is concluded that to operate precisely at the center frequency of 4.3 GHz, the distance between the antenna and the surface must be adjusted to a value between 6 mm and 7 mm. It can be easily said from the measurement experiences of the authors on this antenna that the entire surface must be separated by the mentioned distances from the antenna for these changes to occur. This means that the antenna radiation capabilities will not change unless the bonders between the antenna and the surface flex in the vertical plane dramatically. Finding such bonders like locks to keep them at the desired distance may be covered in a separate study.
Figure 14 shows the radiation pattern with the reflective surface at the bottom when port 1 is fed. This pattern is proper for the radio altimeter pattern recommended to be conical. Also, this planar structure radiates with horizontal polarization, which is defined by ITU for radio altimeter [38]. A one-dimensional simulation pattern for each port of the antenna of the MIMO can be seen in Figure 15 when the cut angle is chosen as φ = 90° and φ = 0°.
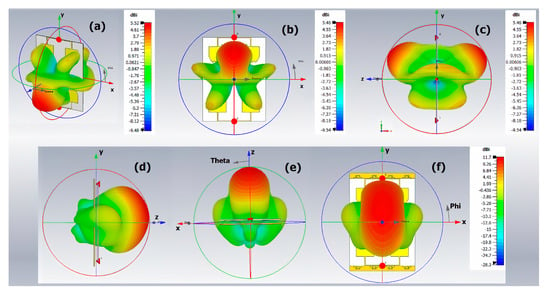
Figure 14.
Simulation pattern without a reflector on the scale of directivity. Perspective view (a) with the operating frequency of f = 4.088 GHz while port 2 is fed, front view (b) and side view (c) with the operating frequency of f = 4.116 GHz while port 1 is fed. Side view (d), front view (e), and top view (f) of the antenna pattern simulated with the reflector on the scale of directivity while port 1 is fed.
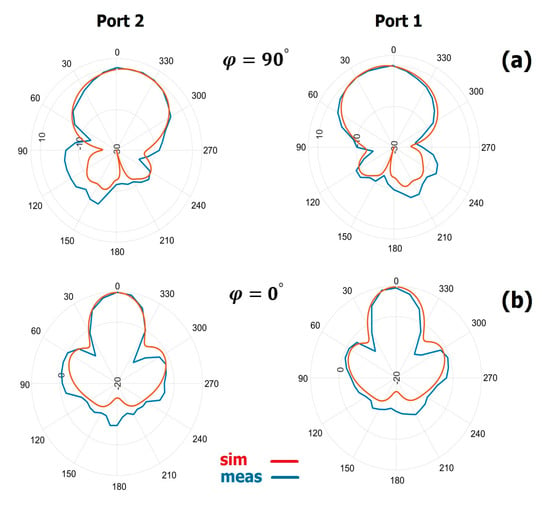
Figure 15.
One-dimensional measurement and simulation results of the pattern for the cut angles of φ = 90° (a), and φ = 0° (b) derived with the reflector.
The measurement studies were conducted at 4.344 GHz for port 1 and 4.32 GHz for port 2. Note that the opposing antennas act like a director to each other and affect the propagation angle. The radiation properties of the antennas are gathered in Table 3 and Table 4 according to φ = 90° cut angle. The radio altimeter features were obtained at φ = 90°, hence the antenna was evaluated in this aspect. This is the same as turning the antenna φ = 90° while viewing it from the perspective of φ = 0°. The simulated value of −19.1 dB side lobe level (SLL) is noteworthy and evidence of the successful focus of power, as intended, although the least measured result of −12.6057 dB appears to have been due to the laboratory conditions. Another result to pay attention to is angular width. The recommended width for the radio altimeter is between 35° and 60°, and the proposed antenna creates a half-power beamwidth (HPBW) very close to this value. The measured HPBW values are 60° and 70°. As the measurements are performed at every 10°, the coding performed by the authors caught these values. It can easily be seen that if the measurement angle hops were narrower, the code would also have caught an HPBW value close to 60° for port 1. According to simulation results, the gain increases from 5.34 dBi to 10.3 dBi for port 1 when the reflective surface is placed under these antennas. The measurements support this case with a measured gain of 10.1497 dBi achieved for port 1. There is a similar result for the other port. The measured gain can be evaluated as realized gain because it includes the losses. When the antenna operates without the reflector, its directivity is not very high due to having a pattern close to the omnidirectional pattern rather than directional, as was desired from the very beginning. This antenna has a minimum directivity of 5.46 dBi without the reflector. In our measurements, which were carried out with the surface at a distance of 6 mm, it is observed that the directivity value exceeded 11.5 dBi (see Table 4). The main purpose of the design with the reflective surface is clearly seen in these results. To obey the design criteria determined for the radio altimeter by ITU, the gain should be between 8 and 13 dBi [38].

Table 3.
Radiation properties of the antenna without a reflector.

Table 4.
Simulated and measured radiation properties of the antenna with its reflector.
Due to the complexity of MIMO systems, their performance must be tested through some indicator data [39,40,41,42]. The measure of how much the transmission power can be reduced while using two ports is given with the diversity gain (DG). According to Figure 16, the DG is around 9.999 in the vicinity of 4.3 GHz and across the radio altimeter band. The envelope correlation coefficient (ECC), which is a measure of how much two antennas affect each other’s pattern, is practically waited to be less than 0.5 for MIMO [43].
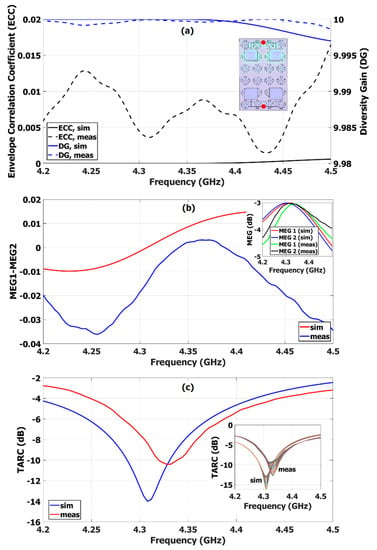
Figure 16.
Diversity gain (DG) and envelope correlation coefficient (ECC) simulation and measurement results of the MIMO antenna with its reflector surface with the representation of the surface current while one port of the antenna is fed (a). Mean effective gain (b). Total active reflection coefficient (c).
Figure 16 also includes the ECC graph [44]. At 4.3 GHz, the ECC value is obtained as 0.0045, which is considerably less than 0.5.
The contour representation of the surface current of the MIMO structure is also given in Figure 16. When any port is active, it is clearly seen that the surface current does not affect the other port.
Mean effective gain (MEG) is the ratio of the average received power of the related port to the average power received by a reference antenna [45,46]. MEG for the first and second ports were calculated and the results are given in Figure 16. The difference is in a linear scale, whose results correspond to less than −3 in dB, and the dB variations of both of the ports are imposed into the figure. The total active reflection coefficient (TARC) was calculated over the average of the angle values from 0° to 180° with a 10° range (Figure 16) [47]. The measurement results show that the TARC is less than −10 dB. The antenna was simulated by placing it on a life-size airplane’s proper part, which is important to achieve the aim to send the waves to the ground properly [48], as seen in Figure 11. PEC was chosen as aircraft fuselage material in order to create the ideal environment. The length of the aircraft is greater than 70 m. A frequency of 4.304 GHz, which is the resonant frequency of the antenna connected to port 2, was chosen as the operating frequency in the simulation carried out with an integral solver. According to the simulation results studied on the aircraft, the directivity is 11.6 dBi, the gain is 10.3 dBi, realized gain is 10.3 dBi, angular width is 61.6°, sidelobe level is −19.3 dB, and radiation efficiency is −1.343 dB.
Radio altimeter antenna designs, whose results are confirmable from their own manuscripts, are listed in Table 5. Obviously, the size of the proposed structure could be reduced by reducing the distance between the opposing antennas. In doing so, care could be taken to keep the antenna characteristics within the radio altimeter requirements. For example, the separation could be reduced until the gain drops to 8 dBi. The choice of size reduction for such an antenna structure is in the hands of the designer. The proposed antenna stands out for airborne altimeter applications in terms of the features such as the conformity between simulation measurement results and providing the radio altimeter prerequisites. Considering that the largest size of commercial radio altimeter antennas per port is between 10 and 17 cm, it is also seen that the purpose of the proposed antenna in terms of space saving has been realized.

Table 5.
Comparison with the previous radio altimeter studies in the literature.
4. Conclusions
In this paper, a new technique to perform pattern shaping by evaluating the vicinity of the EBG phase region is proposed. The whole structure consists of a top antenna and a reflector surface. The reflective surface was designed to resonate at a close but lower frequency than the radio altimeter frequency. The top antenna’s operating frequency was selected to be lower than the target radio altimeter frequency and around the highest end of the resonance band of the reflector surface. Then, the top antenna was put over the surface and brought closer to increase the frequency of the whole structure. This approximation process continued until the target radio altimeter frequency was found. During the design, it was aimed that, at the new height of the antenna, the final operation frequency remains outside the resonance region, but is not far away from the reflector’s low-surface-impedance region to have impedance low enough for imitating the PEC reflector characteristics, ensuring that the antenna’s diffuse pattern is gathered up.
With the proposed technique, a space-saving MIMO antenna is designed by gathering the pattern of a diffused pattern antenna. The lowest gain of the resultant structure, whose top antenna–reflector distance is 6 mm, is 10.1497 dBi and the directivity is 11.5165 dBi. The half-power beamwidth angle is around 60°. When the distance is precisely adjusted between 6 mm and 7 mm, the exact 4.3 GHz value is reached. It should be noted that the distance between the top antenna and the reflector, which is 6 mm, is 8.6% of 69.72 mm, which is the wavelength of a 4.3 GHz target frequency, ensuring the compactness. It can be concluded that a MIMO radio altimeter antenna meeting the ITU criteria has been designed following the proposed technique, successfully.
Author Contributions
Conceptualization, S.K. and M.K.; Methodology, S.K.; Software, S.K.; Validation, S.K. and F.Ö.A.; Formal analysis, S.K. and M.K.; Investigation, S.K.; Resources, S.K. and M.K.; Data curation, S.K. and F.Ö.A.; Writing—original draft preparation, S.K.; Writing—review and editing, S.K. and M.K.; Visualization, S.K.; Supervision, M.K.; Project administration, M.K. All authors have read and agreed to the published version of the manuscript.
Funding
This research received no external funding.
Data Availability Statement
Not applicable.
Conflicts of Interest
The authors declare no conflict of interest.
References
- Griffiths, H. Oliver Heaviside and the Heaviside Layer. Philos. Trans. R. Soc. A Math. Phys. Eng. Sci. 2018, 376, 20170459. [Google Scholar] [CrossRef]
- Gray, D.; Xin, X.; Zhu, Y.; Le Kernec, J. Structural Slotted Waveguide Antennas for Multirotor UAV Radio Altimeter. In Proceedings of the 2014 IEEE International Conference on Signal Processing, Communications and Computing, ICSPCC, Guilin, China, 5–8 August 2014; IEEE: New York, NY, USA, 2014; pp. 819–824. [Google Scholar] [CrossRef]
- Ferreira, R.S.; Marinho, M.A.M.; Liu, K.; Da Costa, J.P.C.L.; Amaral, A.V.; So, H.C. Improved Landing Radio Altimeter for Unmanned Aerial Vehicles Based on an Antenna Array. In Proceedings of the 2012 IV International Congress on Ultra Modern Telecommunications and Control Systems and Workshops, St. Petersburg, Russia, 3–5 October 2012; IEEE: New York, NY, USA, 2012; pp. 105–113. [Google Scholar] [CrossRef]
- Chen, A.; Ying, X.; Ding, K. A Novel Compact Antenna of Radio Altimeters Based on Bi-Layer Substrate Technology. In Proceedings of the 2013 5th IEEE International Symposium on Microwave, Antenna, Propagation and EMC Technologies for Wireless Communications, MAPE, Chengdu, China, 29–31 October 2013; IEEE: New York, NY, USA, 2013; pp. 402–405. [Google Scholar] [CrossRef]
- Pokazeev, K.V.; Zapevalov, A.S.; Pustovoytenko, V.V. The Simulation of a Radar Altimeter Return Waveform. Mosc. Univ. Phys. Bull. 2013, 68, 420–425. [Google Scholar] [CrossRef]
- Ramadevi, K.; Prasad, A.M.; Rani, A.J. Design of A Pentagon Microstrip Antenna for Radar Altimeter Application. Int. J. Web Semant. Technol. (IJWesT) 2012, 3, 31–42. [Google Scholar] [CrossRef]
- Zähringer, M.L.; Griebel, H.S. A Low Powered Radio Altimeter for the Archimedes Balloon Mission to Mars. In Proceedings of the ECIT 2008, Iasi, Romania, 10–12 July 2008. [Google Scholar]
- Futatsumori, S.; Morioka, K.; Kohmura, A.; Yonemoto, N.; Hikage, T.; Sekiguchi, T.; Yamamoto, M.; Nojima, T. Analysis of Radar Altimeter Interference Due to Wireless Avionics Intra-Communication Systems by Using Large-Scale FDTD Method—Investigation on Airbus A320 Class Passenger Aircraft. In Proceedings of the 2018 International Applied Computational Electromagnetics Society Symposium in Denver, ACES-Denver, Denver, CO, USA, 24–29 March 2018; IEEE: New York, NY, USA, 2018; pp. 3–4. [Google Scholar] [CrossRef]
- Parkin, R.M.; Tao, B.; Jackson, M.R. The Use of Low Cost FM-CW Radar Sensors in Navigation. Microprocess. Microsyst. 1998, 21, 377–382. [Google Scholar] [CrossRef]
- Cantamessa, M. Design Best Practices, Capabilities and Performance. J. Eng. Des. 1999, 10, 305–328. [Google Scholar] [CrossRef]
- Iqbal, A.; Saraereh, O.A.; Bouazizi, A.; Basir, A. Metamaterial-Based Highly Isolated MIMO Antenna for Portable Wireless Applications. Electronics 2018, 7, 267. [Google Scholar] [CrossRef]
- Ullah, S.; Yeo, W.H.; Kim, H.; Yoo, H. Development of 60-GHz Millimeter Wave, Electromagnetic Bandgap Ground Planes for Multiple-Input Multiple-Output Antenna Applications. Sci. Rep. 2020, 10, 8541. [Google Scholar] [CrossRef]
- Khalid, M.; Naqvi, S.I.; Hussain, N.; Rahman, M.U.; Fawad; Mirjavadi, S.S.; Khan, M.J.; Amin, Y. 4-Port MIMO Antenna with Defected Ground Structure for 5G Millimeter Wave Applications. Electronics 2020, 9, 71. [Google Scholar] [CrossRef]
- Ma, R.; Yang, W.; Shi, H.; Lu, X.; Liu, J. Covert Communication with a Spectrum Sharing Relay in the Finite Blocklength Regime. China Commun. 2023, 20, 195–211. [Google Scholar] [CrossRef]
- Lin, Z.; Lin, M.; Champagne, B.; Zhu, W.P.; Al-Dhahir, N. Secrecy-Energy Efficient Hybrid Beamforming for Satellite-Terrestrial Integrated Networks. IEEE Trans. Commun. 2021, 69, 6345–6360. [Google Scholar] [CrossRef]
- Lin, Z.; An, K.; Niu, H.; Hu, Y.; Chatzinotas, S.; Zheng, G.; Wang, J. SLNR-Based Secure Energy Efficient Beamforming in Multibeam Satellite Systems. IEEE Trans. Aerosp. Electron. Syst. 2023, 59, 2085–2088. [Google Scholar] [CrossRef]
- An, K.; Lin, M.; Ouyang, J.; Zhu, W.P. Secure Transmission in Cognitive Satellite Terrestrial Networks. IEEE J. Sel. Areas Commun. 2016, 34, 3025–3037. [Google Scholar] [CrossRef]
- Yablonovitch, E. Photonic Band-Gap Structures. J. Opt. Soc. Am. B 1993, 10, 283–295. [Google Scholar] [CrossRef]
- Li, Z.-Y.; Ho, K.-M. Waveguides in Three-Dimensional Layer-by-Layer Photonic Crystals. J. Opt. Soc. Am. B 2003, 20, 801–809. [Google Scholar] [CrossRef]
- Kelly, P.K.; Maloney, J.G.; Shirley, B.L.; Moore, R.L. Photonic Band Structures of Finite Thickness: Theory and Experiment. In Proceedings of the IEEE Antennas and Propagation Society, AP-S International Symposium (Digest), Seattle, WA, USA, 20–24 June 1994; IEEE: New York, NY, USA, 1994; Volume 2, pp. 718–721. [Google Scholar] [CrossRef]
- Sievenpiper, D.; Zhang, L.; Broas, R.F.; Alexopolous, N.G.; Yablonovitch, E. High-Impedance Electromagnetic Surfaces with a Forbidden Frequency Band. IEEE Trans. Microw. Theory Tech. 1999, 47, 2059–2074. [Google Scholar] [CrossRef]
- Yang, F.R.; Ma, K.P.; Qian, Y.; Itoh, T. A Uniplanar Compact Photonic-Bandgap (UC-PBG) Structure and Its Applications for Microwave Circuits. IEEE Trans. Microw. Theory Tech. 1999, 47, 1509–1514. [Google Scholar] [CrossRef]
- Aminian, A.; Yang, F.; Rahmat-Samii, Y. In-Phase Reflection and EM Wave Suppression Characteristics of Electromagnetic Band Gap Ground Planes. In Proceedings of the IEEE Antennas and Propagation Society International Symposium. Digest, Held in Conjunction with: USNC/CNC/URSI North American Radio Sci. Meeting (Cat. No. 03CH37450), Columbus, OH, USA, 22–27 June 2003; IEEE: New York, NY, USA, 2003; Volume 4, pp. 430–433. [Google Scholar] [CrossRef]
- Coccioli, R.; Yang, F.R.; Ma, K.P.; Itoh, T. Aperture-Coupled Patch Antenna on Uc-Pbg Substrate. IEEE Trans. Microw. Theory Tech. 1999, 47, 2123–2130. [Google Scholar] [CrossRef]
- Adas, E.; De Flaviis, F.; Alexopoulos, N.G. Integrated Microstrip Antennas and Phased Arrays with Mode-Free Electromagnetic Bandgap Materials for Scan Blindness Elimination. Electromagnetics 2017, 37, 1–16. [Google Scholar] [CrossRef]
- Tiwari, R.; Bagwari, A.; Kushwah, V.S. Multi-Band Frequency Reconfigurable Antenna Using EBG and Parasitic Patches. Electromagnetics 2022, 42, 448–461. [Google Scholar] [CrossRef]
- Teodorani, L.; Vernì, F.; Giordanengo, G.; Gaffoglio, R.; Vecchi, G. Experimental Demonstration of Beam Scanning of Dual-Metasurface Antenna. Electronics 2023, 12, 1833. [Google Scholar] [CrossRef]
- Fadehan, G.A.; Olasoji, Y.O.; Adedeji, K.B. Mutual Coupling Effect and Reduction Method with Modified Electromagnetic Band Gap in UWB MIMO Antenna. Appl. Sci. 2022, 12, 12358. [Google Scholar] [CrossRef]
- Zhao, L.; He, Y.; Zhao, G.; Chen, X.; Huang, G.L.; Lin, W. Scanning Angle Extension of a Millimeter Wave Antenna Array Using Electromagnetic Band Gap Ground. IEEE Trans. Antennas Propag. 2022, 70, 7264–7269. [Google Scholar] [CrossRef]
- Govindan, T.; Palaniswamy, S.K.; Kanagasabai, M.; Velan, S.; Kumar, S.; Rao, T.R. Quad-Port Electromagnetic Band Gap (EBG)—Backed Non-Isomorphic Multiple-Input-Multiple-Output (MIMO) Antenna for Wearable Applications. Flex. Print. Electron. 2022, 7, 035020. [Google Scholar] [CrossRef]
- Ashyap, A.Y.I.; Dahlan, S.H.B.; Zainal Abidin, Z.; Abbasi, M.I.; Kamarudin, M.R.; Majid, H.A.; Dahri, M.H.; Jamaluddin, M.H.; Alomainy, A. An Overview of Electromagnetic Band-Gap Integrated Wearable Antennas. IEEE Access 2020, 8, 7641–7658. [Google Scholar] [CrossRef]
- Dey, S.; Dey, S. Broadband High Gain Cavity Resonator Antenna Using Planar Electromagnetic Bandgap (EBG) Superstrate. Int. J. Microw. Wirel. Technol. 2023, 15, 90–101. [Google Scholar] [CrossRef]
- Smida, A. Gain Enhancement of Dielectric Resonator Antenna Using Electromagnetic Bandgap Structure. Comput. Mater. Contin. 2022, 71, 1613–1623. [Google Scholar] [CrossRef]
- Babu, N.S.; Ansari, A.Q.; Gangwar, D.; Kanaujia, B.K.; Kumar, S.; Gupta, S.K. Dual-Band Circularly-Polarized EBG-Based Antenna for Wi-MAX/WLAN/ISM Band Applications. Wirel. Pers. Commun. 2023, 128, 231–248. [Google Scholar] [CrossRef]
- Sievenpiper, D.F. High-Impedance Electromagnetic Surfaces; University of California: Los Angeles, CA, USA, 1999. [Google Scholar]
- Malekpoor, H.; Abolmasoumi, A. Gain and Isolation Improvement of Compact MIMO Printed Dipole Arrays Realized by Second Iteration Giuseppe Peano AMC for 4G/5G Wireless Networks. Wirel. Netw. 2022, 28, 1949–1962. [Google Scholar] [CrossRef]
- Airplane. Available online: https://grabcad.com/library/airplane-131 (accessed on 2 January 2022).
- M.2059: Operational and Technical Characteristics and Protection Criteria of Radio Altimeters Utilizing the Band 4 200-4 400 MHz, Recommendation ITU-R M.2059-0. Available online: https://www.itu.int/rec/R-REC-M.2059-0-201312-P/en (accessed on 1 March 2022).
- Taştan, M.C.; İlhan, H. Performance Analysis of SSK Modulation for UAVs Communication. Veh. Commun. 2021, 31, 100375. [Google Scholar] [CrossRef]
- Nair, I.; Deepa, P. Isolation Enhanced MIMO Antenna for Software Defined Networking (SDN) Adapted Ultrawide Band (UBW) Radio Tech Applications. Microprocess. Microsyst. 2020, 73, 102965. [Google Scholar] [CrossRef]
- Sanghmitra; Rajput, A.; Mukherjee, B.; Patel, P. Y-Shaped Dielectric Resonator MIMO Antenna for Omnidirection Radiation Pattern. Electromagnetics 2022, 42, 157–167. [Google Scholar] [CrossRef]
- Tran, H.H.; Nguyen, T.T.L.; Pham, T.D. Circularly Polarized MIMO Antenna Based on Microstrip Patch and Metasurface Structures. Electronics 2023, 12, 384. [Google Scholar] [CrossRef]
- Jaiverdhan; Sharma, M.M.; Yadav, R.P. Broadband Circularly Polarized Compact MIMO Slot Antenna Based on Strip and Stubs for UWB Applications. Electromagnetics 2021, 41, 292–302. [Google Scholar] [CrossRef]
- Dkiouak, A.; Zakriti, A.; Elftouh, H.; Mchbal, A. Design of CPW-Fed MIMO Antenna for Ultra-Wideband Communications. Procedia Manuf. 2020, 46, 782–787. [Google Scholar] [CrossRef]
- Alayón Glazunov, A.; Molisch, A.F.; Tufvesson, F. Mean Effective Gain of Antennas in a Wireless Channel. IET Microw. Antennas Propag. 2009, 3, 214–227. [Google Scholar] [CrossRef]
- Krishnamoorthy, R.; Desai, A.; Patel, R.; Grover, A. 4 Element Compact Triple Band MIMO Antenna for Sub-6 GHz 5G Wireless Applications. Wirel. Netw. 2021, 27, 3747–3759. [Google Scholar] [CrossRef]
- Ahmad, S.; Khan, S.; Manzoor, B.; Soruri, M.; Alibakhshikenari, M.; Dalarsson, M.; Falcone, F. A Compact CPW-Fed Ultra-Wideband Multi-Input-Multi-Output (MIMO) Antenna for Wireless Communication Networks. IEEE Access 2022, 10, 25278–25289. [Google Scholar] [CrossRef]
- Ballesteros, C.; Montero, L.; Ramírez, G.A.; Jofre-Roca, L. Multi-Antenna 3D Pattern Design for Millimeter-Wave Vehicular Communications. Veh. Commun. 2022, 35, 100473. [Google Scholar] [CrossRef]
- Abbas, A.; Elsaid, M.; Mahmoud, S.F.; Abdallah, E.A.; El-Hennawy, H.M. Decoupling of Closely Stacked Patch Antennas for Airborne Radio Altimeter Applications. AEU-Int. J. Electron. Commun. 2021, 128, 153506. [Google Scholar] [CrossRef]
- Kiani, S.H.; Mahmood, K.; Altaf, A.; Cole, A.J. Mutual Coupling Reduction of MIMO Antenna for Satellite Services and Radio Altimeter Applications. Int. J. Adv. Comput. Sci. Appl. 2018, 9, 23–26. [Google Scholar] [CrossRef]
Disclaimer/Publisher’s Note: The statements, opinions and data contained in all publications are solely those of the individual author(s) and contributor(s) and not of MDPI and/or the editor(s). MDPI and/or the editor(s) disclaim responsibility for any injury to people or property resulting from any ideas, methods, instructions or products referred to in the content. |
© 2023 by the authors. Licensee MDPI, Basel, Switzerland. This article is an open access article distributed under the terms and conditions of the Creative Commons Attribution (CC BY) license (https://creativecommons.org/licenses/by/4.0/).