Article

An Effective YOLO-Based Proactive Blind Spot Warning System for Motorcycles

1
Department of Computer Science and Information Engineering, National Changhua University of Education, Changhua City 50007, Taiwan
2
Department of Early Childhood Development and Education, Chaoyang University of Technology, Taichung 413310, Taiwan
3
Digital Printing and Services Division, Eastman Kodak Company, Rochester, NY 14650, USA
4
Department of Information and Communication Engineering, Chaoyang University of Technology, Taichung 413310, Taiwan
*
Author to whom correspondence should be addressed.
Electronics 2023, 12(15), 3310; https://doi.org/10.3390/electronics12153310
Submission received: 28 June 2023 / Revised: 24 July 2023 / Accepted: 31 July 2023 / Published: 2 August 2023
(This article belongs to the Special Issue Advances and Challenges in Future Networks)

Abstract

:
Interest in advanced driver assistance systems (ADAS) is booming in recent years. One of the most effervescent ADAS features is blind spot detection (BSD), which uses radar sensors or cameras to detect vehicles in the blind spot area and alerts the driver to avoid a collision when changing lanes. However, this kind of BSD system fails to notify nearby vehicle drivers in this blind spot of the possible collision. The goal of this research is to design a proactive bus blind spot warning (PBSW) system that will immediately notify motorcyclists when they enter the blind spot or the area of the inner wheel difference of a target vehicle, i.e., a bus. This will increase the real-time functionality of BSD and can have a significant impact on enhancing motorcyclist safety. The proposed hardware is placed on the motorcycle and consists of a Raspberry Pi 3B+ and a dual-lens stereo camera. We use dual-lens cameras to capture and create stereoscopic images then transmit the images from the Raspberry Pi 3B+ to an Android phone via Wi-Fi and to a cloud server using a cellular network. At the cloud server, we use the YOLOv4 image recognition model to identify the position of the rear-view mirror of the bus and use the lens imaging principle to estimate the distance between the bus and the motorcyclist. Finally, the cloud server returns the estimated distance to the PBSW app on the Android phone. According to the received distance value, the app will display the visible area/blind spot, the area of the inner wheel difference of the bus, the position of the motorcyclist, and the estimated distance between the motorcycle and the bus. Hence, as soon as the motorcyclist enters the blind spot of the bus or the area of the inner wheel difference, the app will alert the motorcyclist immediately to enhance their real-time safety. We have evaluated this PBSW system implemented in real life. The results show that the average position accuracy of the rear-view mirror is 92.82%, the error rate of the estimated distance between the rear-view mirror and the dual-lens camera is lower than 0.2%, and the average round trip delay between the Android phone and the cloud server is about 0.5 s. To the best of our knowledge, this proposed system is one of few PBSW systems which can be applied in the real world to protect motorcyclists from the danger of entering the blind spot and the area of the inner wheel difference of the target vehicle in real time.

1. Introduction

With the rapid development of vehicle electronic technology and increasing attention to driving safety, advanced driver assistance systems (ADASs) [1,2,3] have become more and more important. Advanced ADAS functionalities are designed to reduce road accidents by continuously monitoring inside and outside activities through multiple sensor arrangements. ADAS functionalities can minimize risks by reducing driver error, predicting trajectories, continuously alerting drivers, and taking control of a vehicle when the driver is incapacitated [3]. Due to the frequent occurrence of traffic accidents, safe driving assistance systems have become the most popular and critical technology on the market. In the future, safe driving assistance systems will play an important role in protecting the safety of drivers and passengers and preventing traffic accidents.
Due to the high driver’s seat or the long body of the vehicle, it is difficult for the driver of a huge vehicle to notice a motorcycle driving close to it, which leads to many traffic accidents, and this area is referred to as the “blind spot” of the vehicle. Many blind spot detection (BSD) studies, which uses radar sensors or cameras to detect vehicles in the blind spot area, are currently devoted to reducing the size of blind spots or informing vehicle drivers of approaching vehicles in their blind spot [4] to avoid traffic accidents. However, this kind of BSD system fails to notify nearby vehicle drivers in this blind spot of the possible collision. In these studies, motorcyclists who enter the blind spots of other vehicles still cannot actively avoid their potential danger.
In addition, due to the relatively large body of a large vehicle and the difference of radius of inner wheels [5], it is easy to cause accidents when turning right. The driver cannot see pedestrians or relatively small road users such as motorcycles. In fact, many accidents are caused by pedestrians or motorcycles clinging to large vehicles, being caught in the car after turning, and dying when their vehicle rolls over [6]. Therefore, it would be of great significance to solve the problem of the blind spot caused by the difference in the inner wheel of a large vehicle turning right.
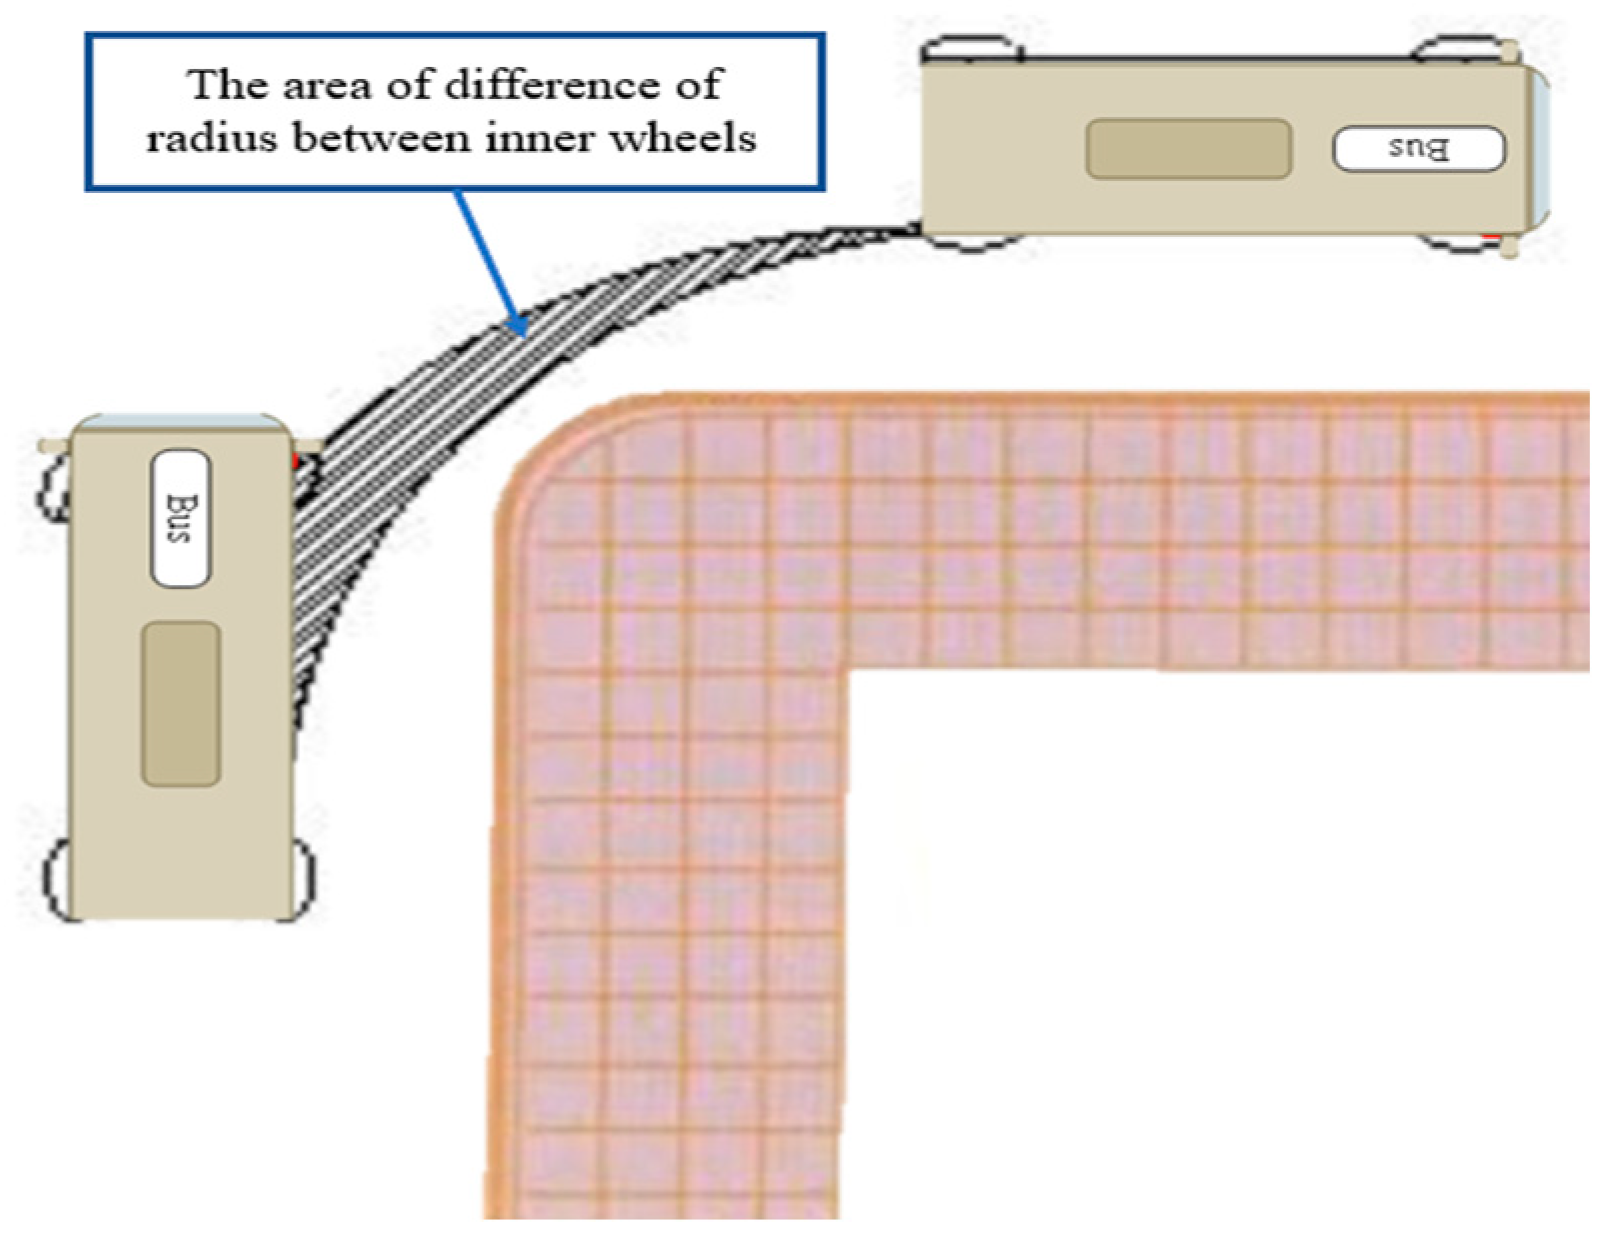
In order to enable motorcyclists to actively avoid hazards, in this paper, we propose and implement an AI-based active blind spot warning system (PBSW) for motorcycles. The system uses dual-lens cameras to capture two images to create a stereoscopic image and transmit it to a cloud server. Then, the cloud server uses the YOLOv4 [7] image recognition model to identify the rear-view mirror of the bus and calculate the relative distance between the motorcycle and the bus. The motorcycle riders who use this proactive blind spot warning system will receive the alarm when they enter the blind spot of the bus, which is shown in Figure 1, or the area of difference of radius between inner wheels, which is shown in Figure 2. The contributions of this study are as follows:
  • Through the combination of dual-lens and artificial intelligence technology, the distance and relative position of the motorcycle to a bus on the move are judged and calculated in real time.
  • Motorcycles equipped with this proactive PBSW system can receive an immediate warning when they enter the blind spot or the area of the inner wheel difference of the bus, which achieves a significant impact on enhancing motorcyclist safety.
  • This proactive PBSW system has been implemented and tested in real life. Video clips and snapshots recorded in the real-world evaluation of this implemented system are presented in Section 4.3. Further, results of six performance metrics provide concrete evidence of the PBSW system’s efficiency and reliability.

2. Related Work

Perceiving the surroundings accurately and quickly is one of the most important and challenging tasks of a proactive blind spot detection system. The processing and analysis of image data is particularly important. Faced with a great amount of image data, effective processing and analysis can greatly improve image quality and reduce the high computing demand of real-time recognition. Traditional image processing technology is difficult to load. Cloud computing, which can provide many computing resources, helps to solve this part of the problem [8]. In recent years, edge computing, which can provide high-speed computing processing and intelligent analysis of image data within the regional communication range, has attracted much attention [9]. Edge computing is carried out with a small model and low computation but can maintain high accuracy. Such models usually use lightweight structure, model compression, model pruning, model quantization, and other techniques to achieve their lightweight goals [10].
In [11], the author employed two fisheye cameras to perceive obstacles all around the vehicles and used the aberrations of the camera images to calculate depth information to generate stereo vision. In addition, the points in the constructed three-dimensional space were classified based on height, width, and traversable slope relative to the neighboring points to distinguish different obstacles. The disadvantage of this method is that it cannot accurately distinguish the types of obstacles. A proactive blind spot detection system must be able to accurately distinguish an obstacle’s position in the bus rear-view mirror and then calculate its distance from the vehicle.
In terms of target recognition, there has been growing interest in the use of a vision system, such as the FHWA scheme proposed by [12], as a detection method in the vehicle recognition system. This system began using localization by generating class-independent region proposals for each video frame, then it used deep convolutional neural networks to classify vehicles more finely. In addition, some researches, such as [13], applied the multi-feature subspace distribution deep learning model with online transfer learning to solve the challenges of environmental complexity and dynamic scenarios in the real environment.
Further feature extraction is performed on each candidate area, and a classifier is used to determine whether the region contains a target object and to precisely locate the target. Representative models of this method include (1) R-CNN, (2) Fast R-CNN, (3) Faster R-CNN, and (4) Mask R-CNN [14]. On the other hand, the “One-stage” model combines the feature extraction network and the target detection network to extract image features. Then, the model can predict the location and category of the target and directly perform object recognition on the entire image to eliminate the process of generating candidate regions [15].
Two-stage models often use selective search techniques to reduce the amount of calculation and improve detection accuracy. Therefore, one-stage models have faster speed and lower computational cost, but the detection accuracy is usually lower. In contrast, two-stage models can achieve higher detection accuracy, but they are slower and more computationally expensive [16]. In order to overcome these difficulties, the researchers proposed various methods and techniques, such as introducing attention mechanisms, multiscale feature fusion, and contextual information, to enhance the feature representation ability of small targets and improve the accuracy of detection [17].
In [18], the GoogLeNet Inception structure and Rainbow series are cited on the basis of the SSD detection network, the SSD Inception v3 Rainbow (INAR-SSD) model architecture is proposed, the performance of INAR-SSD, Faster RCNN, and SSD is compared, and the experimental results show that the accuracy of the INAR-SSD model on the ALDD dataset is 78.80%. Since the rear-view mirror of the bus is a small object in the image relative to the vehicle, like the license plate, we refer to the method of YOLO object detector, which uses the license plate recognition (ALPR) system [19], as our identification method to help us accurately distinguish the position of the rear-view mirror of the bus.
YOLOv1 [20] used a deep convolutional neural network as a feature extractor. The input image was resized to 448 × 448 to ensure that all objects could be effectively detected. The adjusted input image was split into 7 × 7 meshes. The YOLOv1 [20] and YOLOv2 [21] detection schematics used the deep convolutional neural network, which consists of 19 convolutional layers and five maximum pooling layers, as a feature extractor, with a small model size and computation while maintaining good feature extraction capabilities. YOLOv3 [22] used the deep convolutional neural network of Darknet-53 as a feature extractor. Darknet-53 has 15 convolutional layers and can better capture features in images.
In [23], the authors proposed a vehicle detection algorithm based on the YOLOv3 model trained with a great volume of traffic data. The model was pruned to ensure its efficiency on edge equipment. Then, a real-time vehicle tracking counter for vehicles that combines the vehicle detection and vehicle tracking algorithms was proposed to realize the detection of traffic flow.
Module YOLOv4 [7] used CSPDarkNet53 as a feature extractor. CSPDarkNet53 combines the cross-stage partial (CSP) module with the Darknet-53 module to improve feature representation and learning ability by branching and fusing the network. YOLOv4 is trained on object detection using the complete IoU (CIoU) loss function. CIoU considers the complete cross-parallel relationship between the prediction box and the real box, which can more accurately measure the accuracy of the predicted box and further improve detection accuracy. YOLOv5 [24] has five detection models in the public library.
The addition of a small target detection layer to the overall model greatly improves the model’s accuracy [25]. In addition, model compression and acceleration are added for use on small image computing units with limited resources, and the network is further streamlined by channel pruning. Finally, a lightweight detection model is obtained. In [26], the GSC YOLOv5 object detection algorithm was proposed. In YOLOv5, the light weight of the algorithm structure is used to reduce the number of parameters and FLOPs of the model. The CBAM attention module is added to replace the SE attention module, increasing the ability to extract spatial information [27]. In [28], in the backbone of YOLOv5, the ghost module was cited to replace the original convolution, and the method of adding a transformer at the end improved the ability of feature expression. In [29], the R-YOLOv5 object detection algorithm was proposed, and the Swin Transformer module, feature enhancement and attention mechanism (FEAM), and adaptively spatial feature fusion (ASFF) are cited. Using the basis of YOLOv5, the addition of the Swin Transformer module to the end of the backbone enhances the characteristics of small objects and reduces the interference of complex backgrounds on small objects.
In [30], the authors proposed a simple yet effective method which is adaptive to different computational resources by generating dynamic proposals for object detection. Moreover, a dynamic model was extended to choose the number of proposals according to the input image, greatly reducing computational costs. In [31], the authors addressed several innovations such as a weighted cross-entropy loss to address class imbalance to handle the regression component and adaptation layers. A comprehensive empirical evaluation with different distillation configurations was conducted over multiple datasets.
In the current blind spot detection system research, most of the detection systems are like that of [32], using images or signals received by sensors to detect dangerous factors (such as pedestrians, motorcycles, or small vehicles, etc.) in the blind spot area of the vehicle. When dangerous factors are detected around the vehicle, the system will remind the driver and even inform the surrounding dangerous entities to reduce accidents. But these kinds of systems require that all users on the road, whether vehicles or pedestrians, must be equipped with these perception systems and warning systems. Based on this problem, we propose a proactive blind spot detection system. By sensing whether the user of the system has entered the blind spot area of other vehicles, even if other vehicles are not equipped with this system, it can also reduce accidents that occur due to a vehicle entering the blind spot area by mistake.
In this research, we refer to the following methods to implement this proactive blind spot warning system:

2.1. Camera Calibration and Correction

Before the camera captures the image, the camera must first be calibrated and corrected so that the image captured by the camera has less distortion. This is conducive to the construction of a stereoscopic image [33].

2.2. Image Recognition

In order to accurately calculate the relative distance and position between the bus and the motorcyclist, the system uses YOLOv4 to obtain the position of the bus rear-view mirror in the figure as the target point for distance calculation.

2.3. Image Matching

In the distance calculation step, when YOLOv4 recognizes the position of the bus in the picture, the cloud server will find the mapping points between the two images captured by the left and right cameras, respectively. The parallax is calculated by image-matching technology, and the relative distance is further calculated. For faster and more accurate determination of the mapping points, the speeded-up robust features (SURFs) [34] algorithm is used in this system.

2.4. Regulations of Devices for Indirect Vision [35]

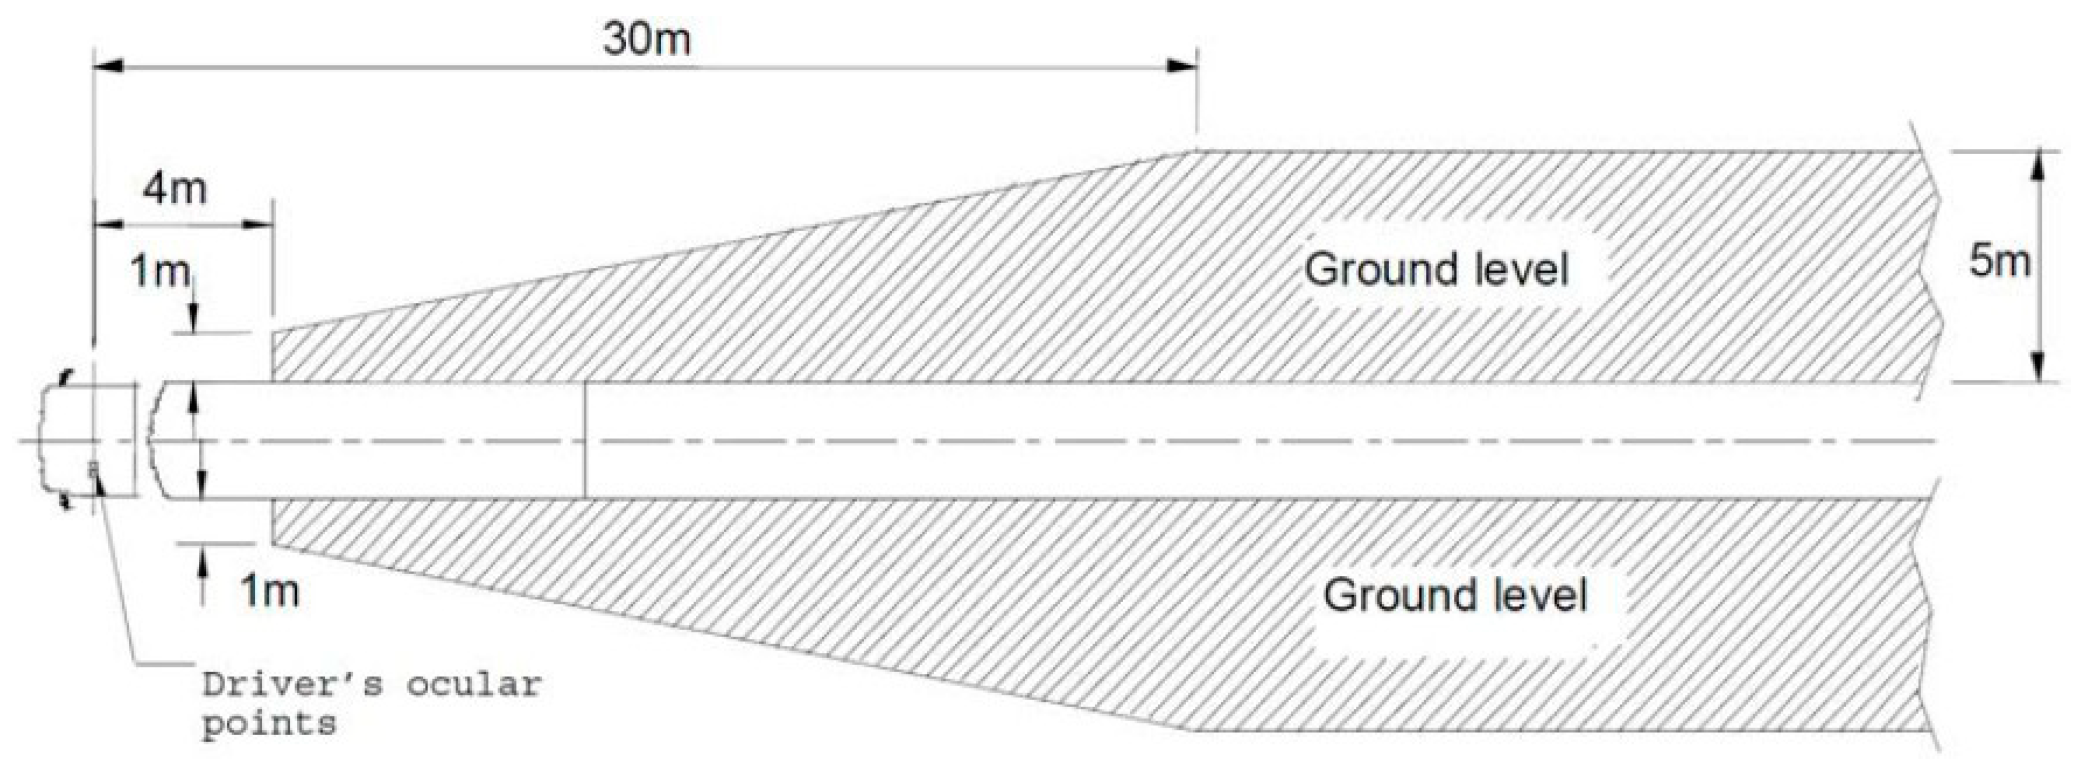
According to the vehicle regulations for installing devices for indirect vision in Taiwan, the main rear-view vision devices, i.e., mirrors, of the bus belong to class II. The field of driver vision, shown in Figure 3, must contain a horizontal area of at least 5 m wide beside the bus. This area extends from 30 m behind the driver’s ocular points to the horizon. In addition, another visible area is bounded by two vertical planes beside the bus; one is 1 m wide and the other is 5 m wide. They start from 4 m and 30 m behind the driver’s ocular points, respectively.

2.5. Inner Wheel Difference Calculation [5,36]

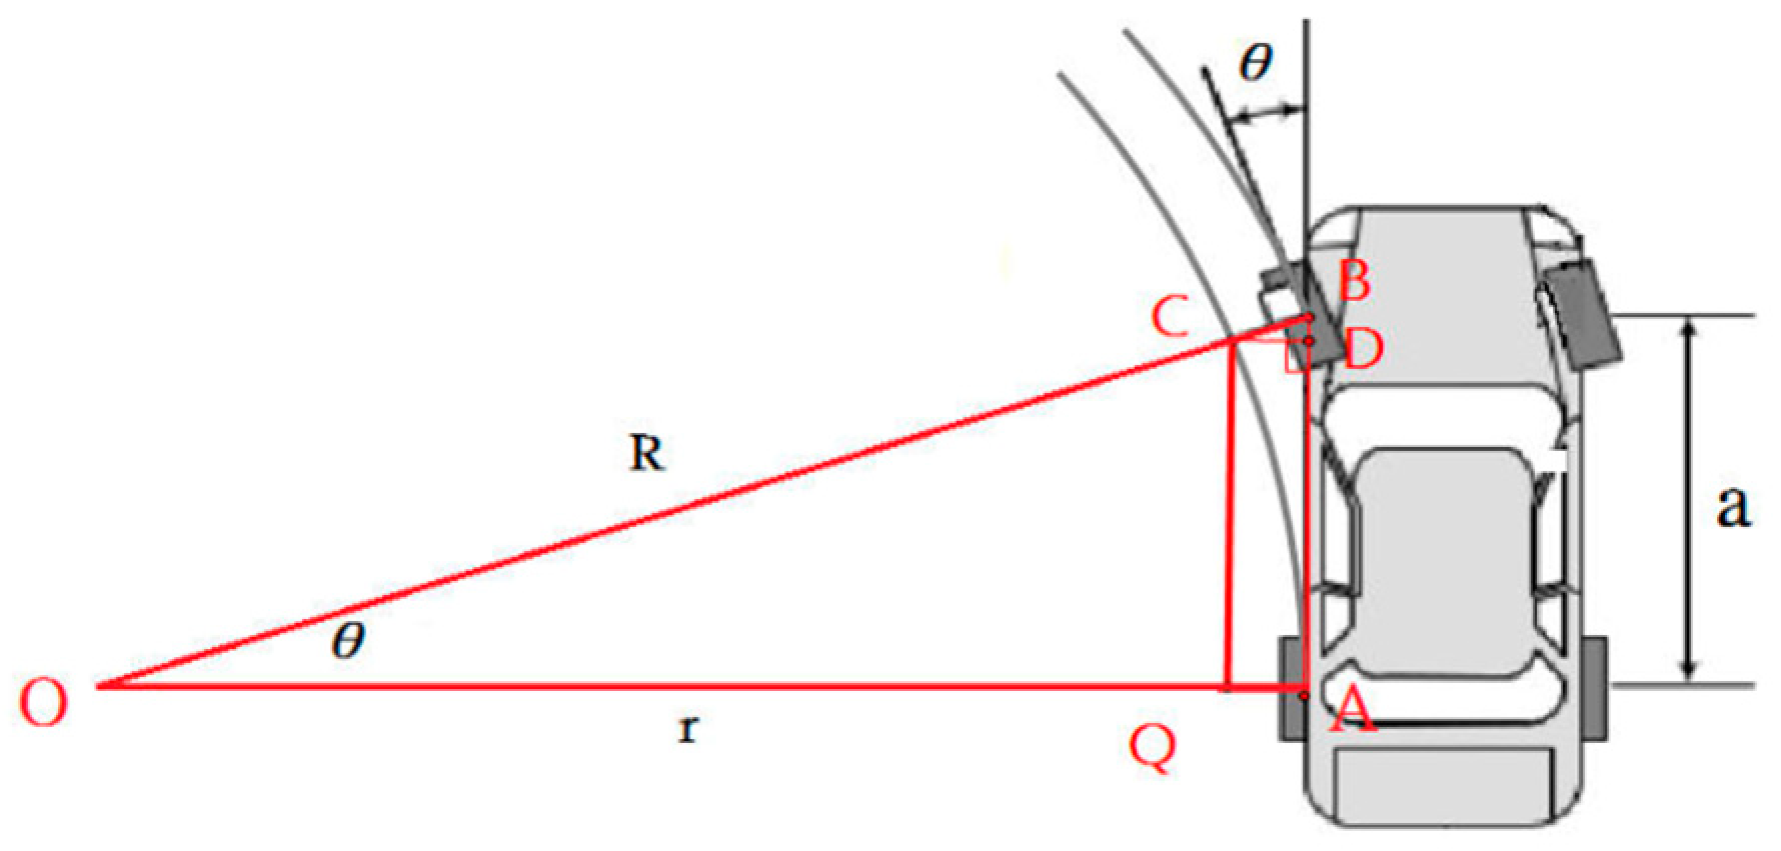
The wheelbase of the bus is large, and the turning radius at low speed is smaller, resulting in a large difference in radius between the inner wheels. Because pedestrians and drivers are not aware of the difference in inner wheel radius, more traffic accidents have occurred. Figure 4 is a schematic diagram of the kinematics of a vehicle similar to a bus when the front wheels turn left by θ degrees, where a is the wheelbase of the vehicle and R and r are the turning radii of the front wheels and the rear ones, respectively. The method of calculating the inner wheel radius difference CD ¯ can be expressed as:
C D ¯ = B C ¯ × c o s θ = a ( 1 c o s θ s i n θ ) c o s θ

3. Design of the PBSW System

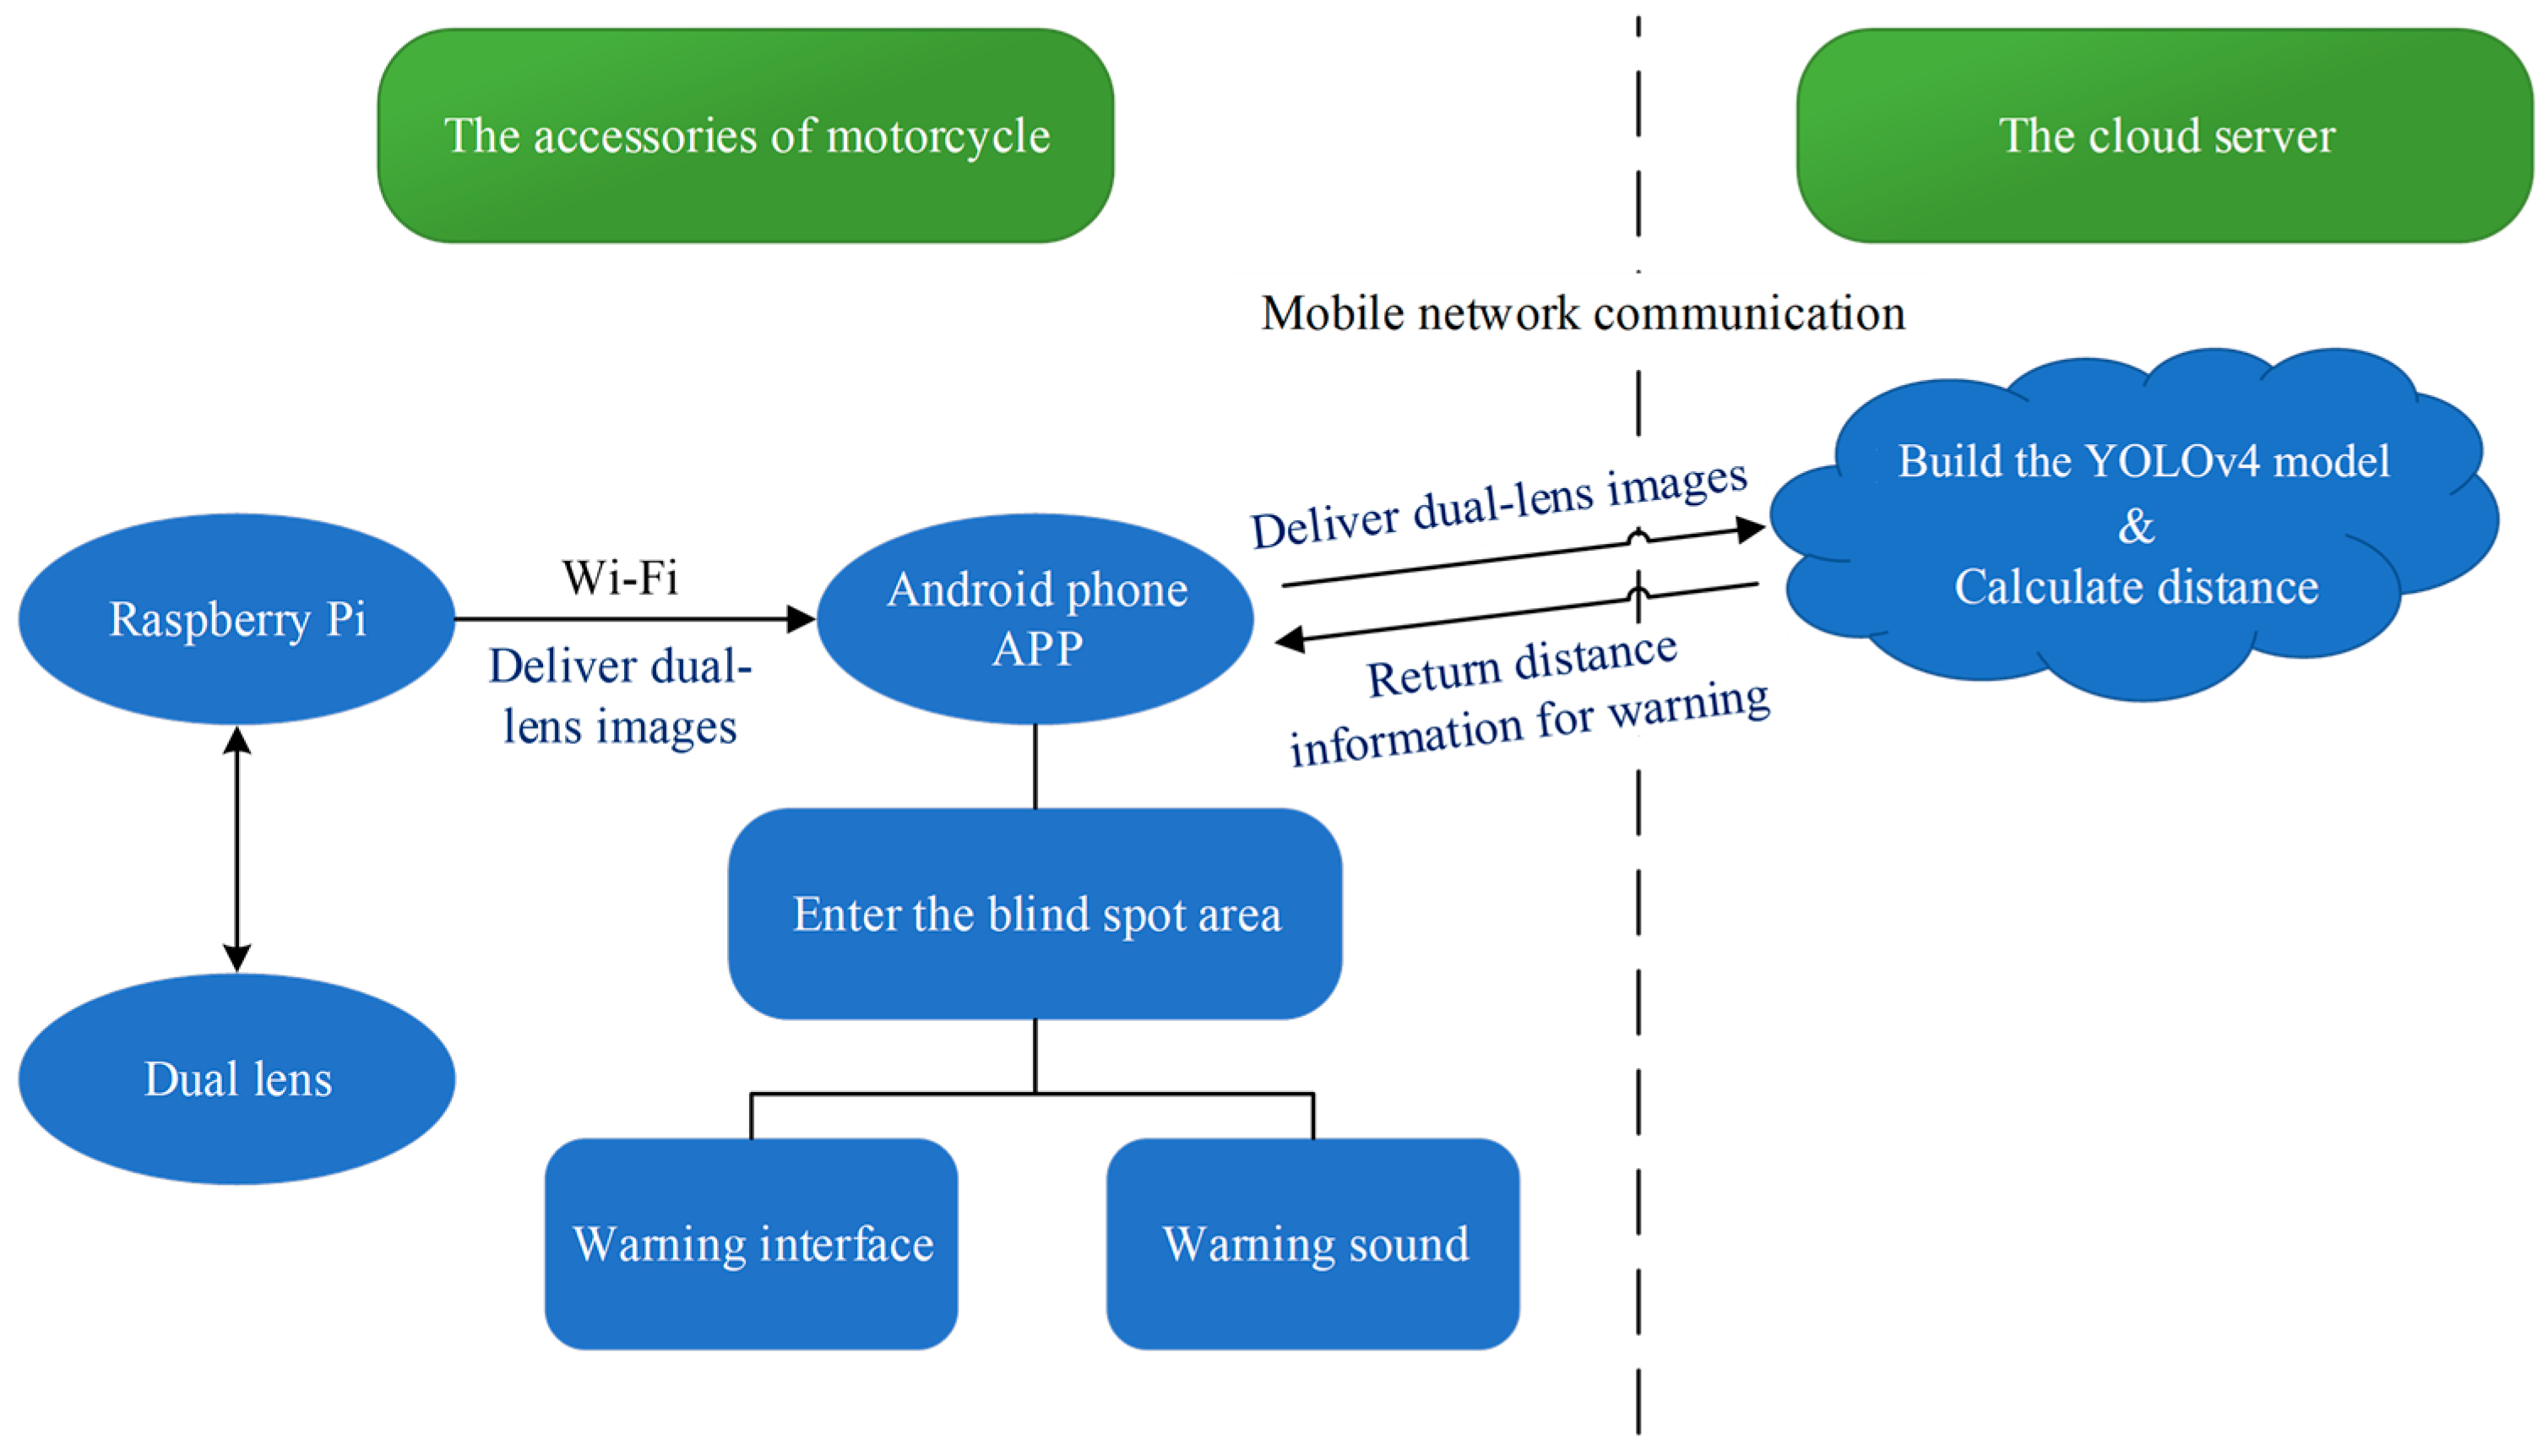
The system architecture proposed in this paper is shown in Figure 5. The hardware on the motorcycle side consists of a Raspberry Pi board and an Android phone. The Raspberry Pi development board connects dual cameras to obtain stereoscopic images and sends the stereoscopic images to an Android phone via Wi-Fi. After receiving the picture, the PBSW app on the Android phone sends the dual-lens image to the cloud server through the mobile network to identify the position of the rear-view mirror in the image. The cloud server further uses the principle of lens imaging to generate stereo vision [32] and estimate the distance between the bus and the motorcycle. Afterwards, the cloud server sends the distance back to the PBSW app, and the app displays the relative position of the motorcyclist and the bus based on the received value. When the motorcycle enters the blind spot of the bus, the PBSW app will issue a warning to the motorcycle driver as soon as possible.

3.1. The Preprocessing Flow of PBSW

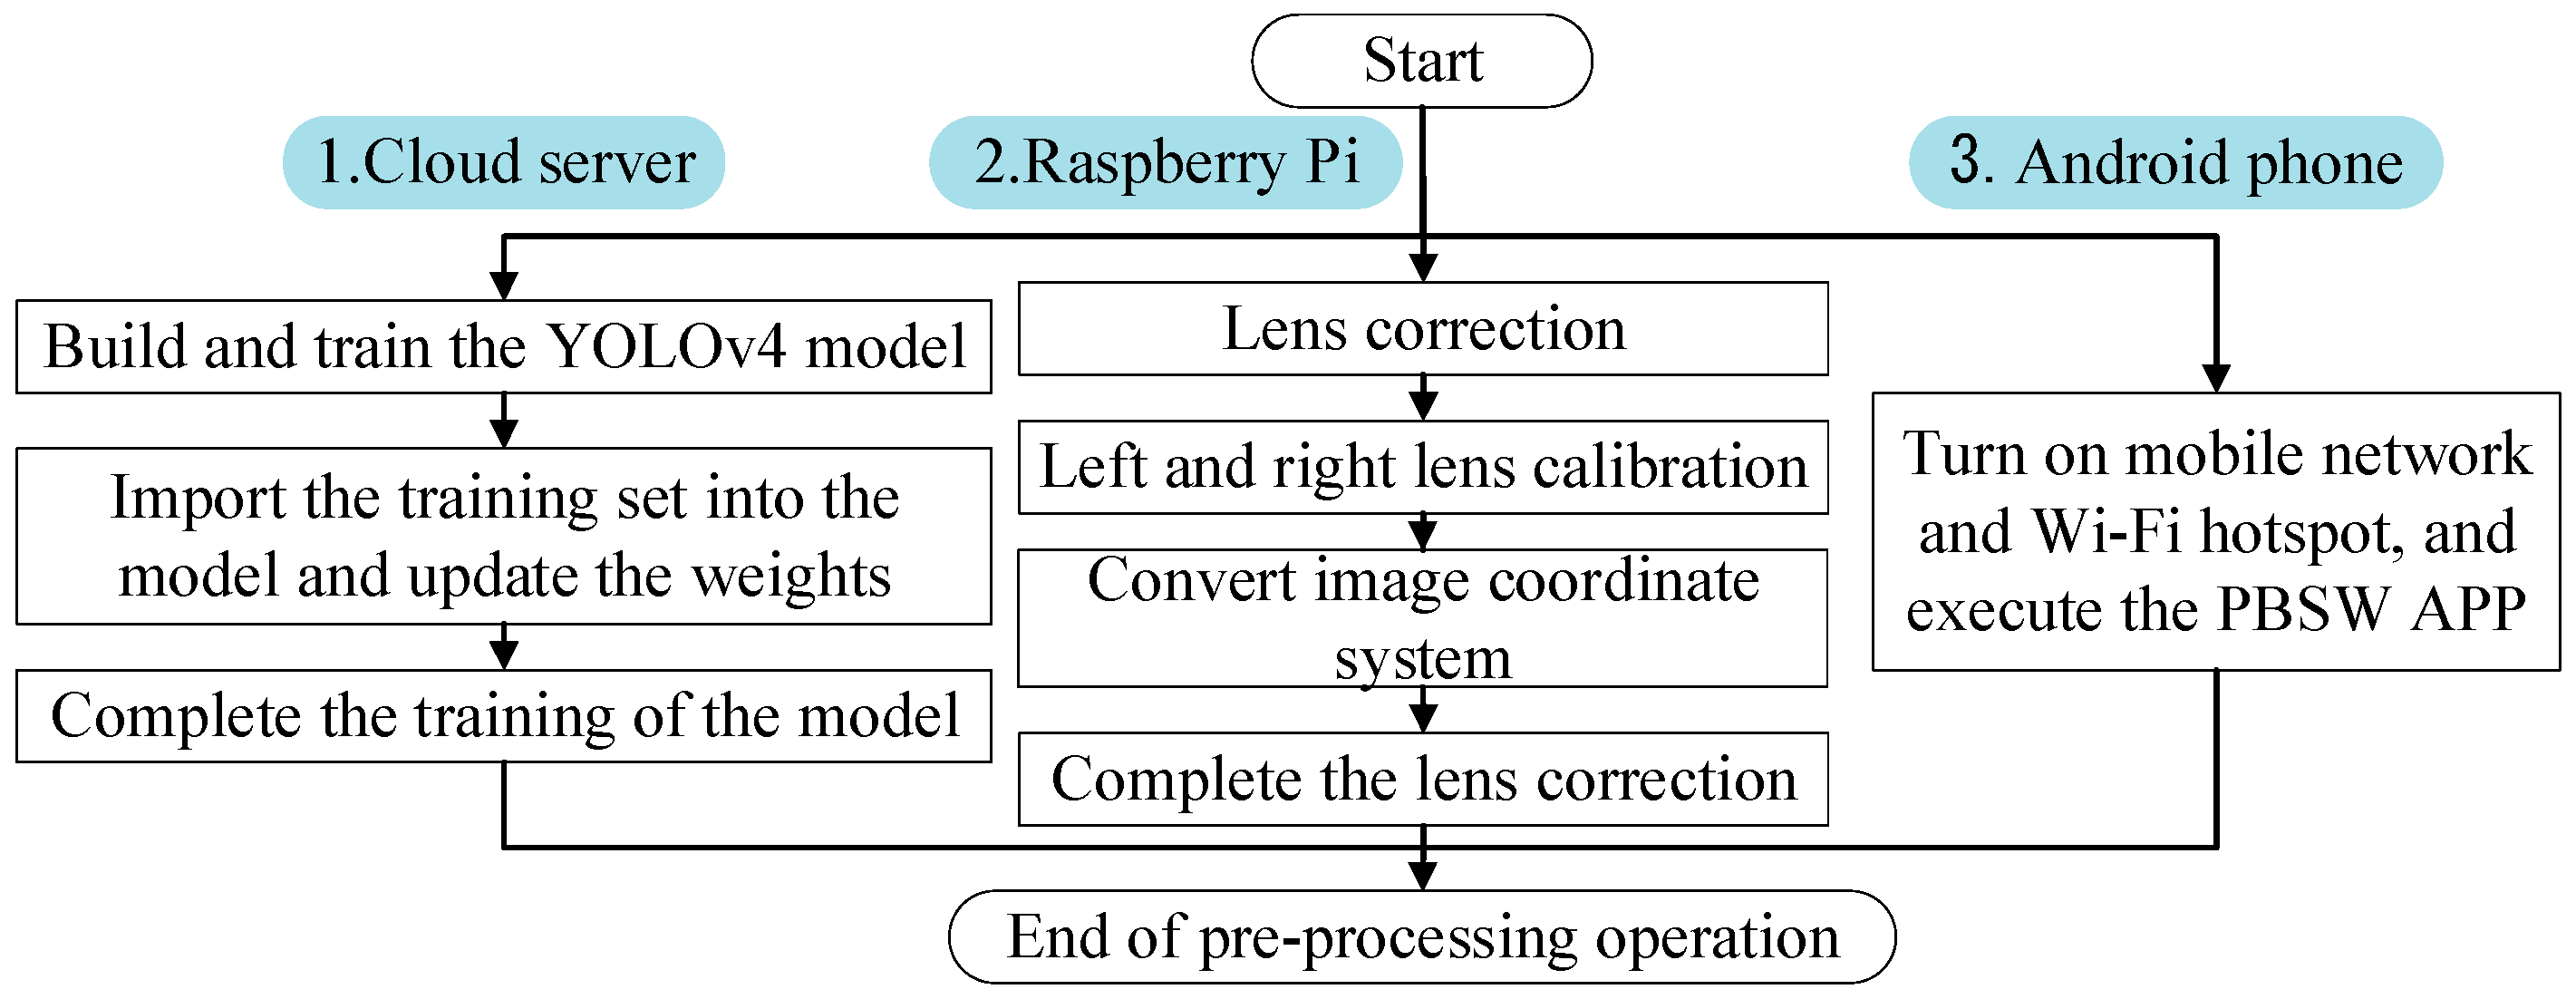
Figure 6 shows the preprocessing flow of the PBSW system, including the three sub-flows of the cloud server, Raspberry Pi, and Android phone. The cloud server imports the images taken by the dual-lens camera as the training set to train the YOLOv4 model. The Raspberry Pi needs to eliminate the distortion caused by the parallax of the double lens through calibration and convert the image coordinate system to the world coordinate system through perspective transformation. The Android phone needs to open the mobile network interface and Wi-Fi hotspot and establish a connection with the cloud server and Raspberry Pi. Finally, the PBSW app is used on the phone.

3.2. Camera Calibration Process

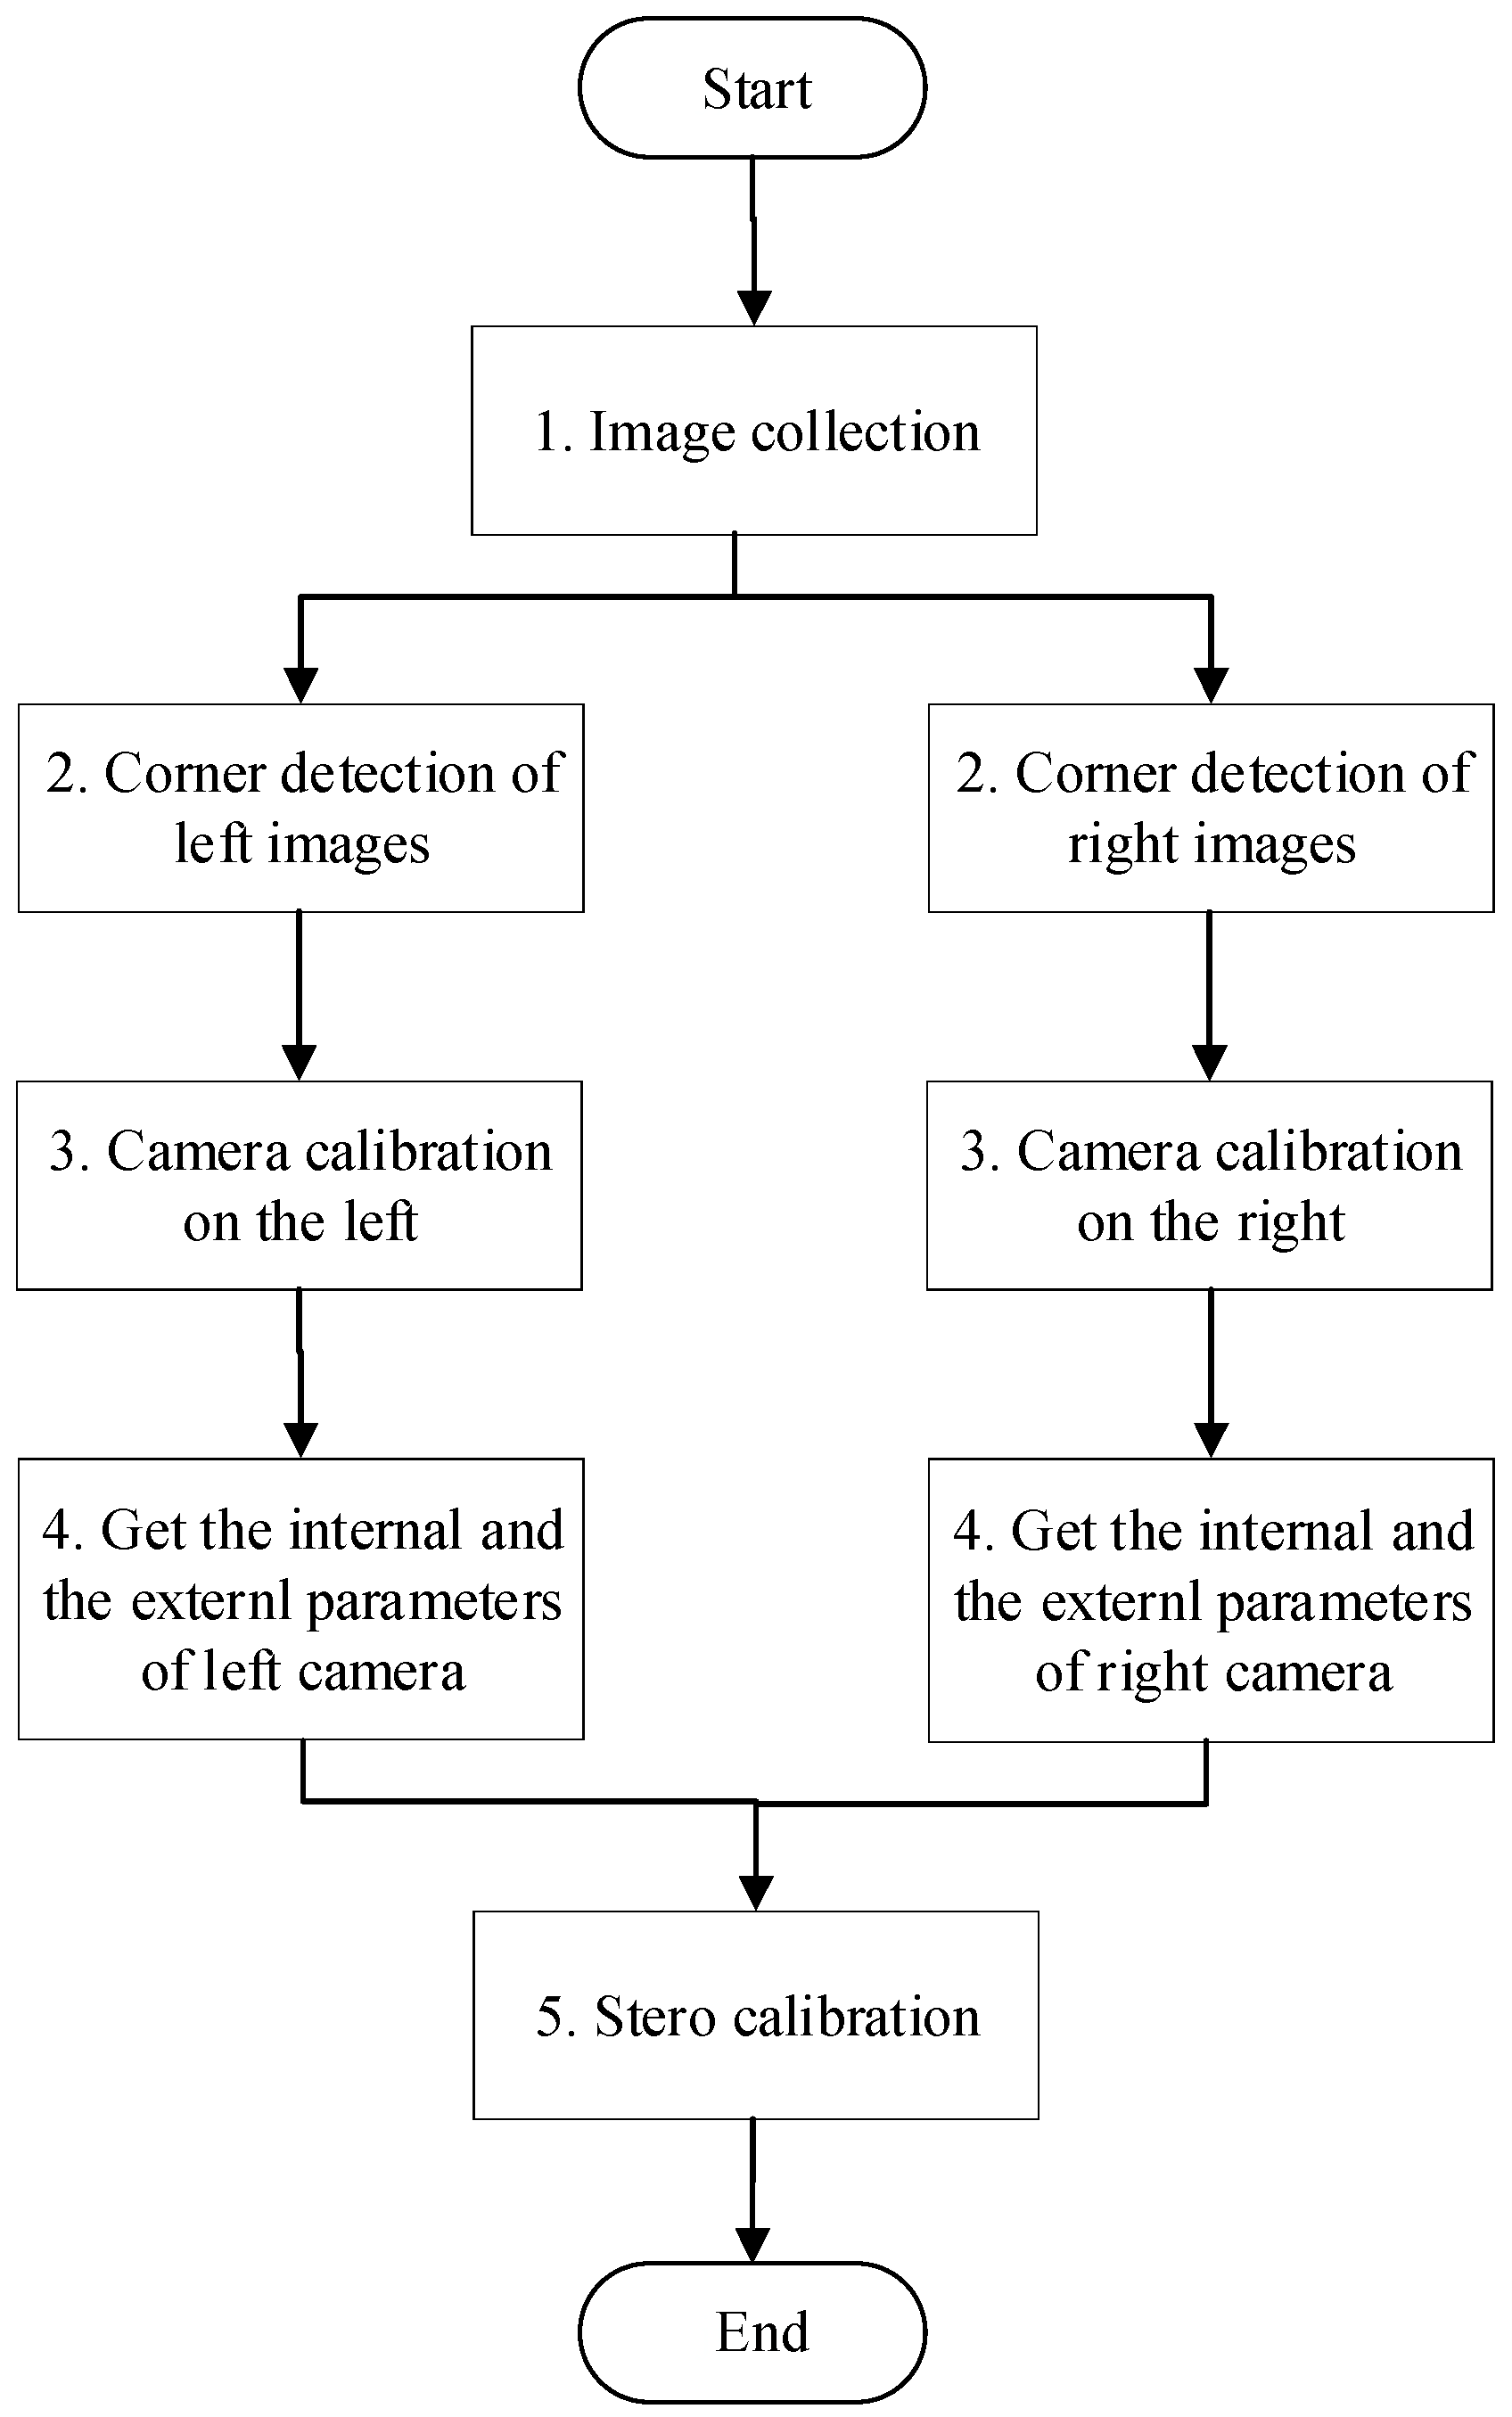
The Raspberry Pi camera on the motorcycle must be calibrated and corrected because the real world is three-dimensional while the image is two-dimensional. The goal of camera calibration is to find the camera parameters through a mathematical model so that we can obtain the function of the three-dimensional to two-dimensional relationship, shown in Figure 7. Through the function of this three-dimensional to two-dimensional process, the inverse function can be found, and then the three-dimensional scene can be reconstructed; that is, the perception of depth. Figure 8 shows the calibration process. The steps of this process are explained below.

3.3. The Blind Spot Warning Process of PBSW

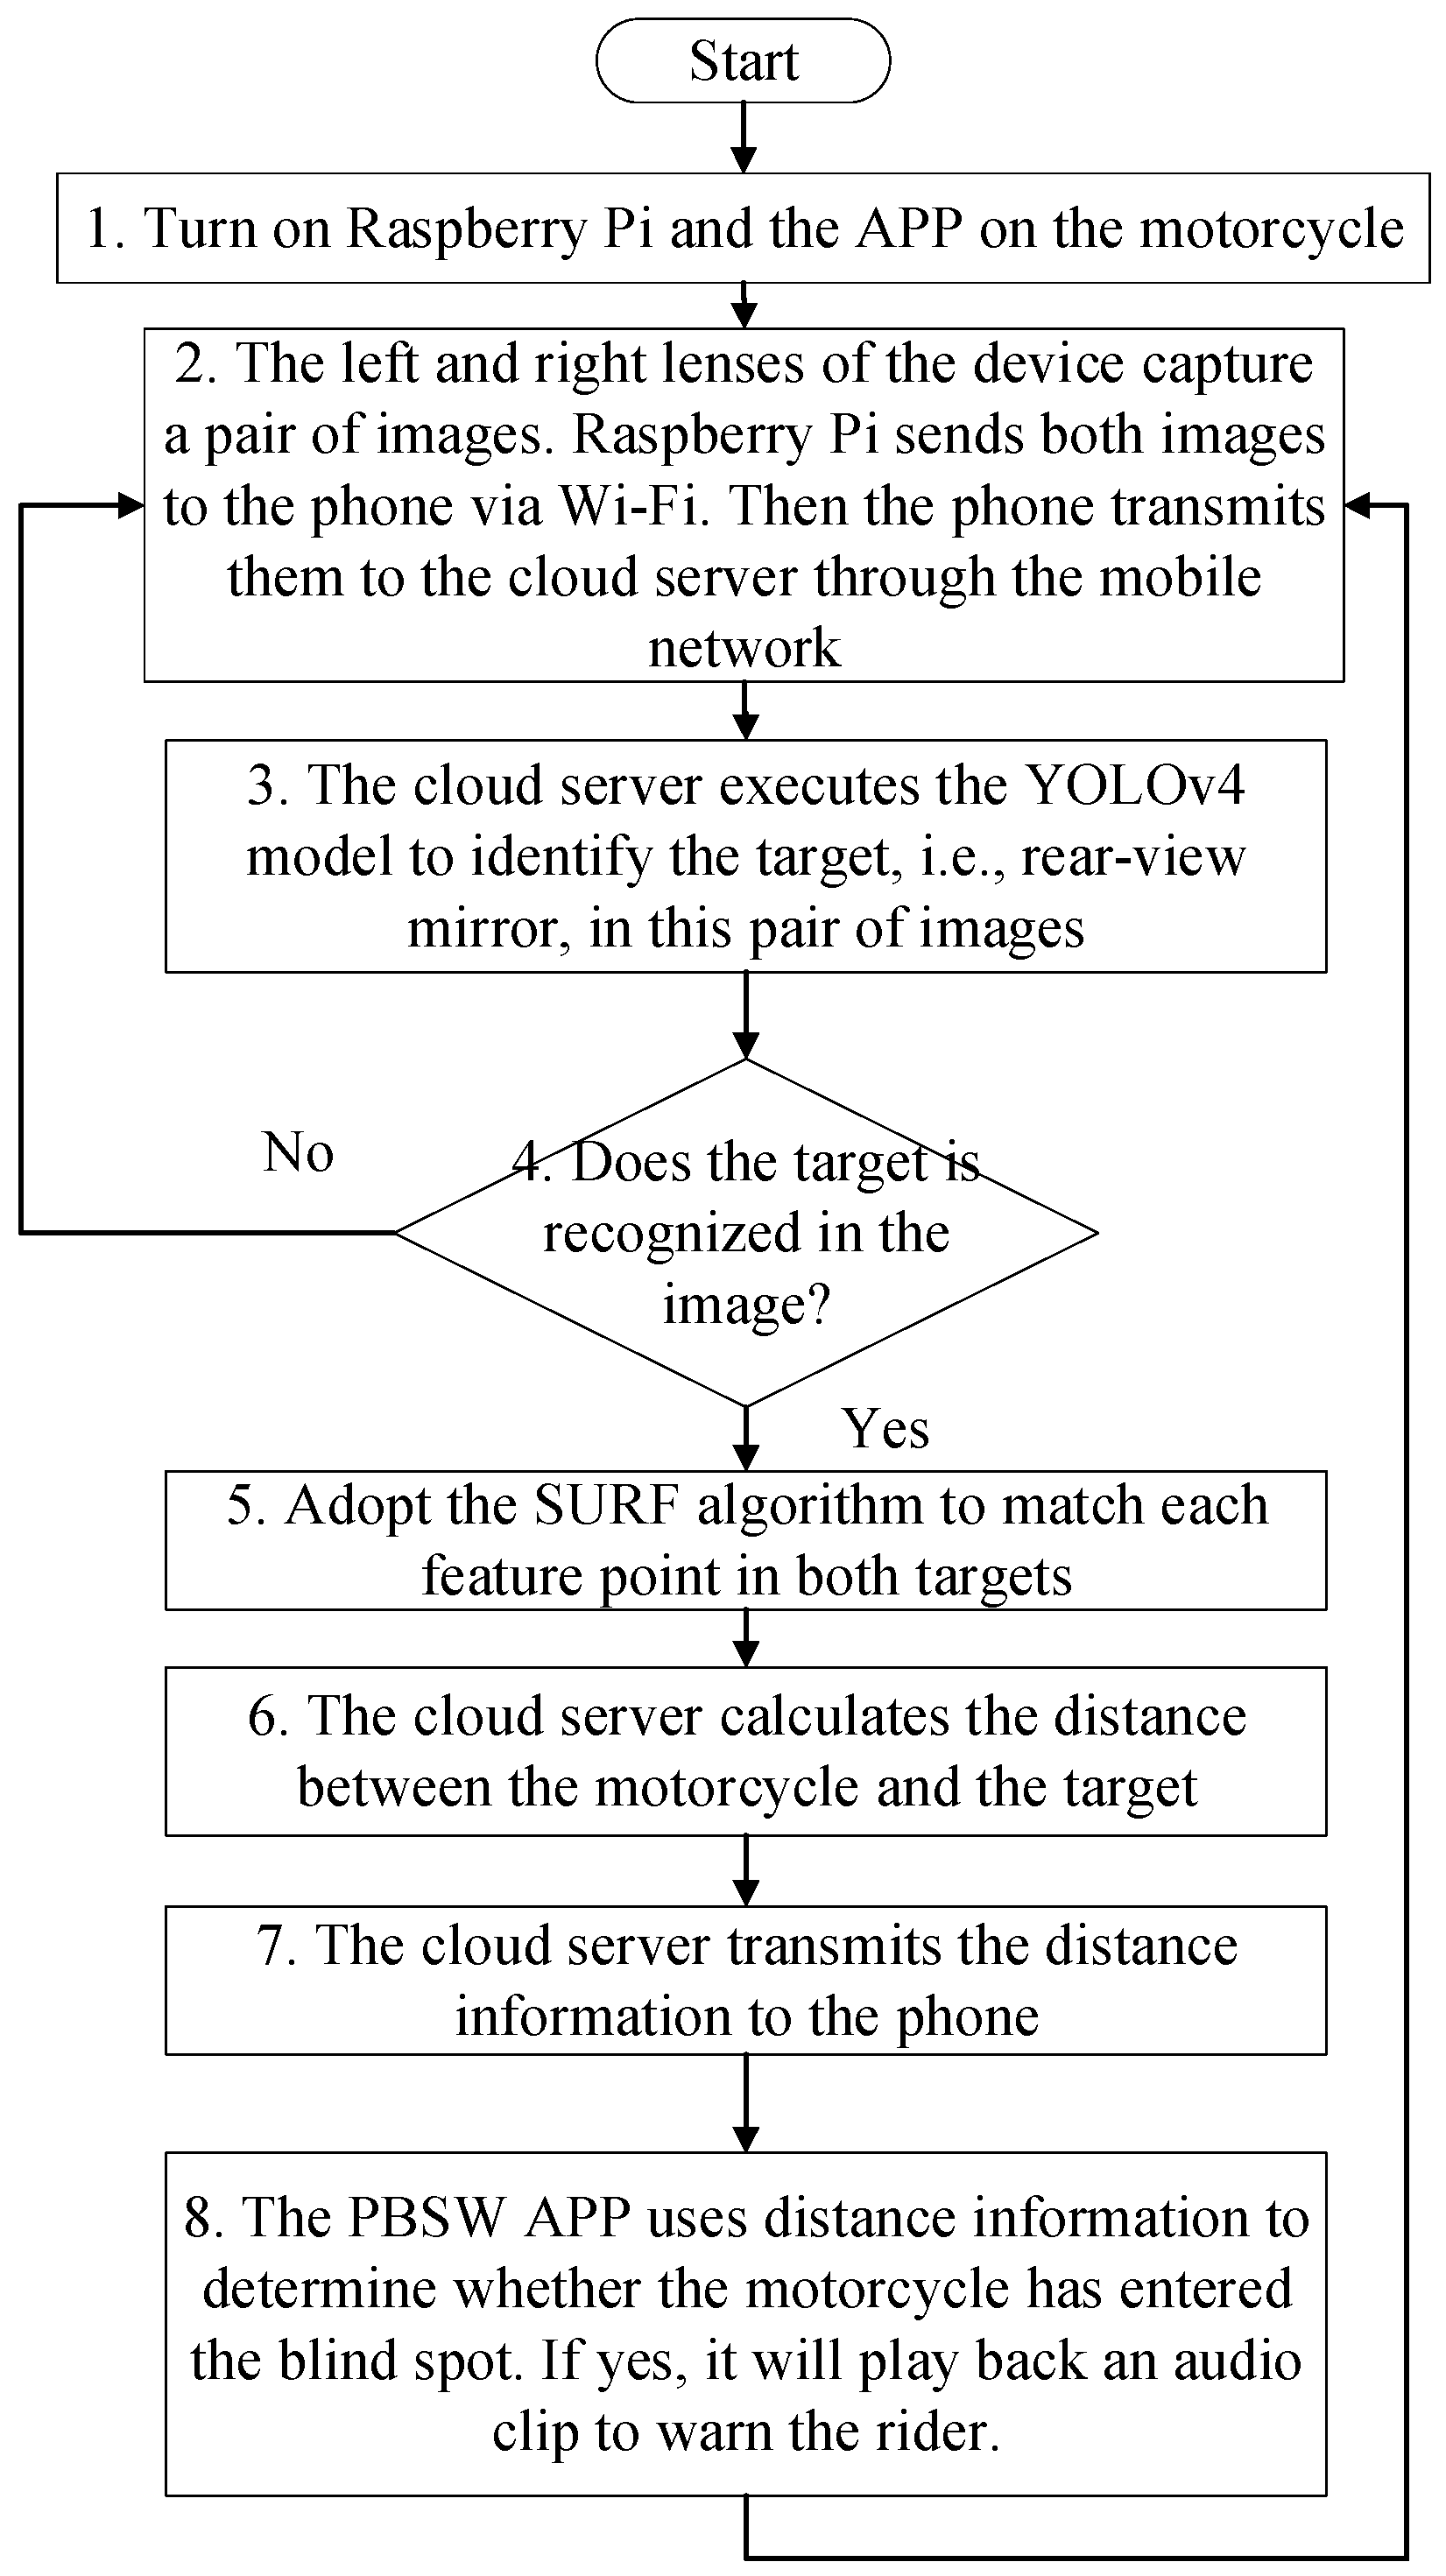
Figure 9 shows the complete blind spot warning process of the PBSW system. The steps of this process are explained below.
  • Turn on the Raspberry Pi device of the motorcycle and open the PBSW app on the Android phone to connect to the cloud server.
  • The Raspberry Pi device captures a pair of images from the left and right lenses at the same time, sends them first to the Android phone via Wi-Fi, and, finally, to the cloud server through the mobile network.
  • The cloud server executes the YOLOv4 model to identify whether there are rear-view mirrors in this pair of images.
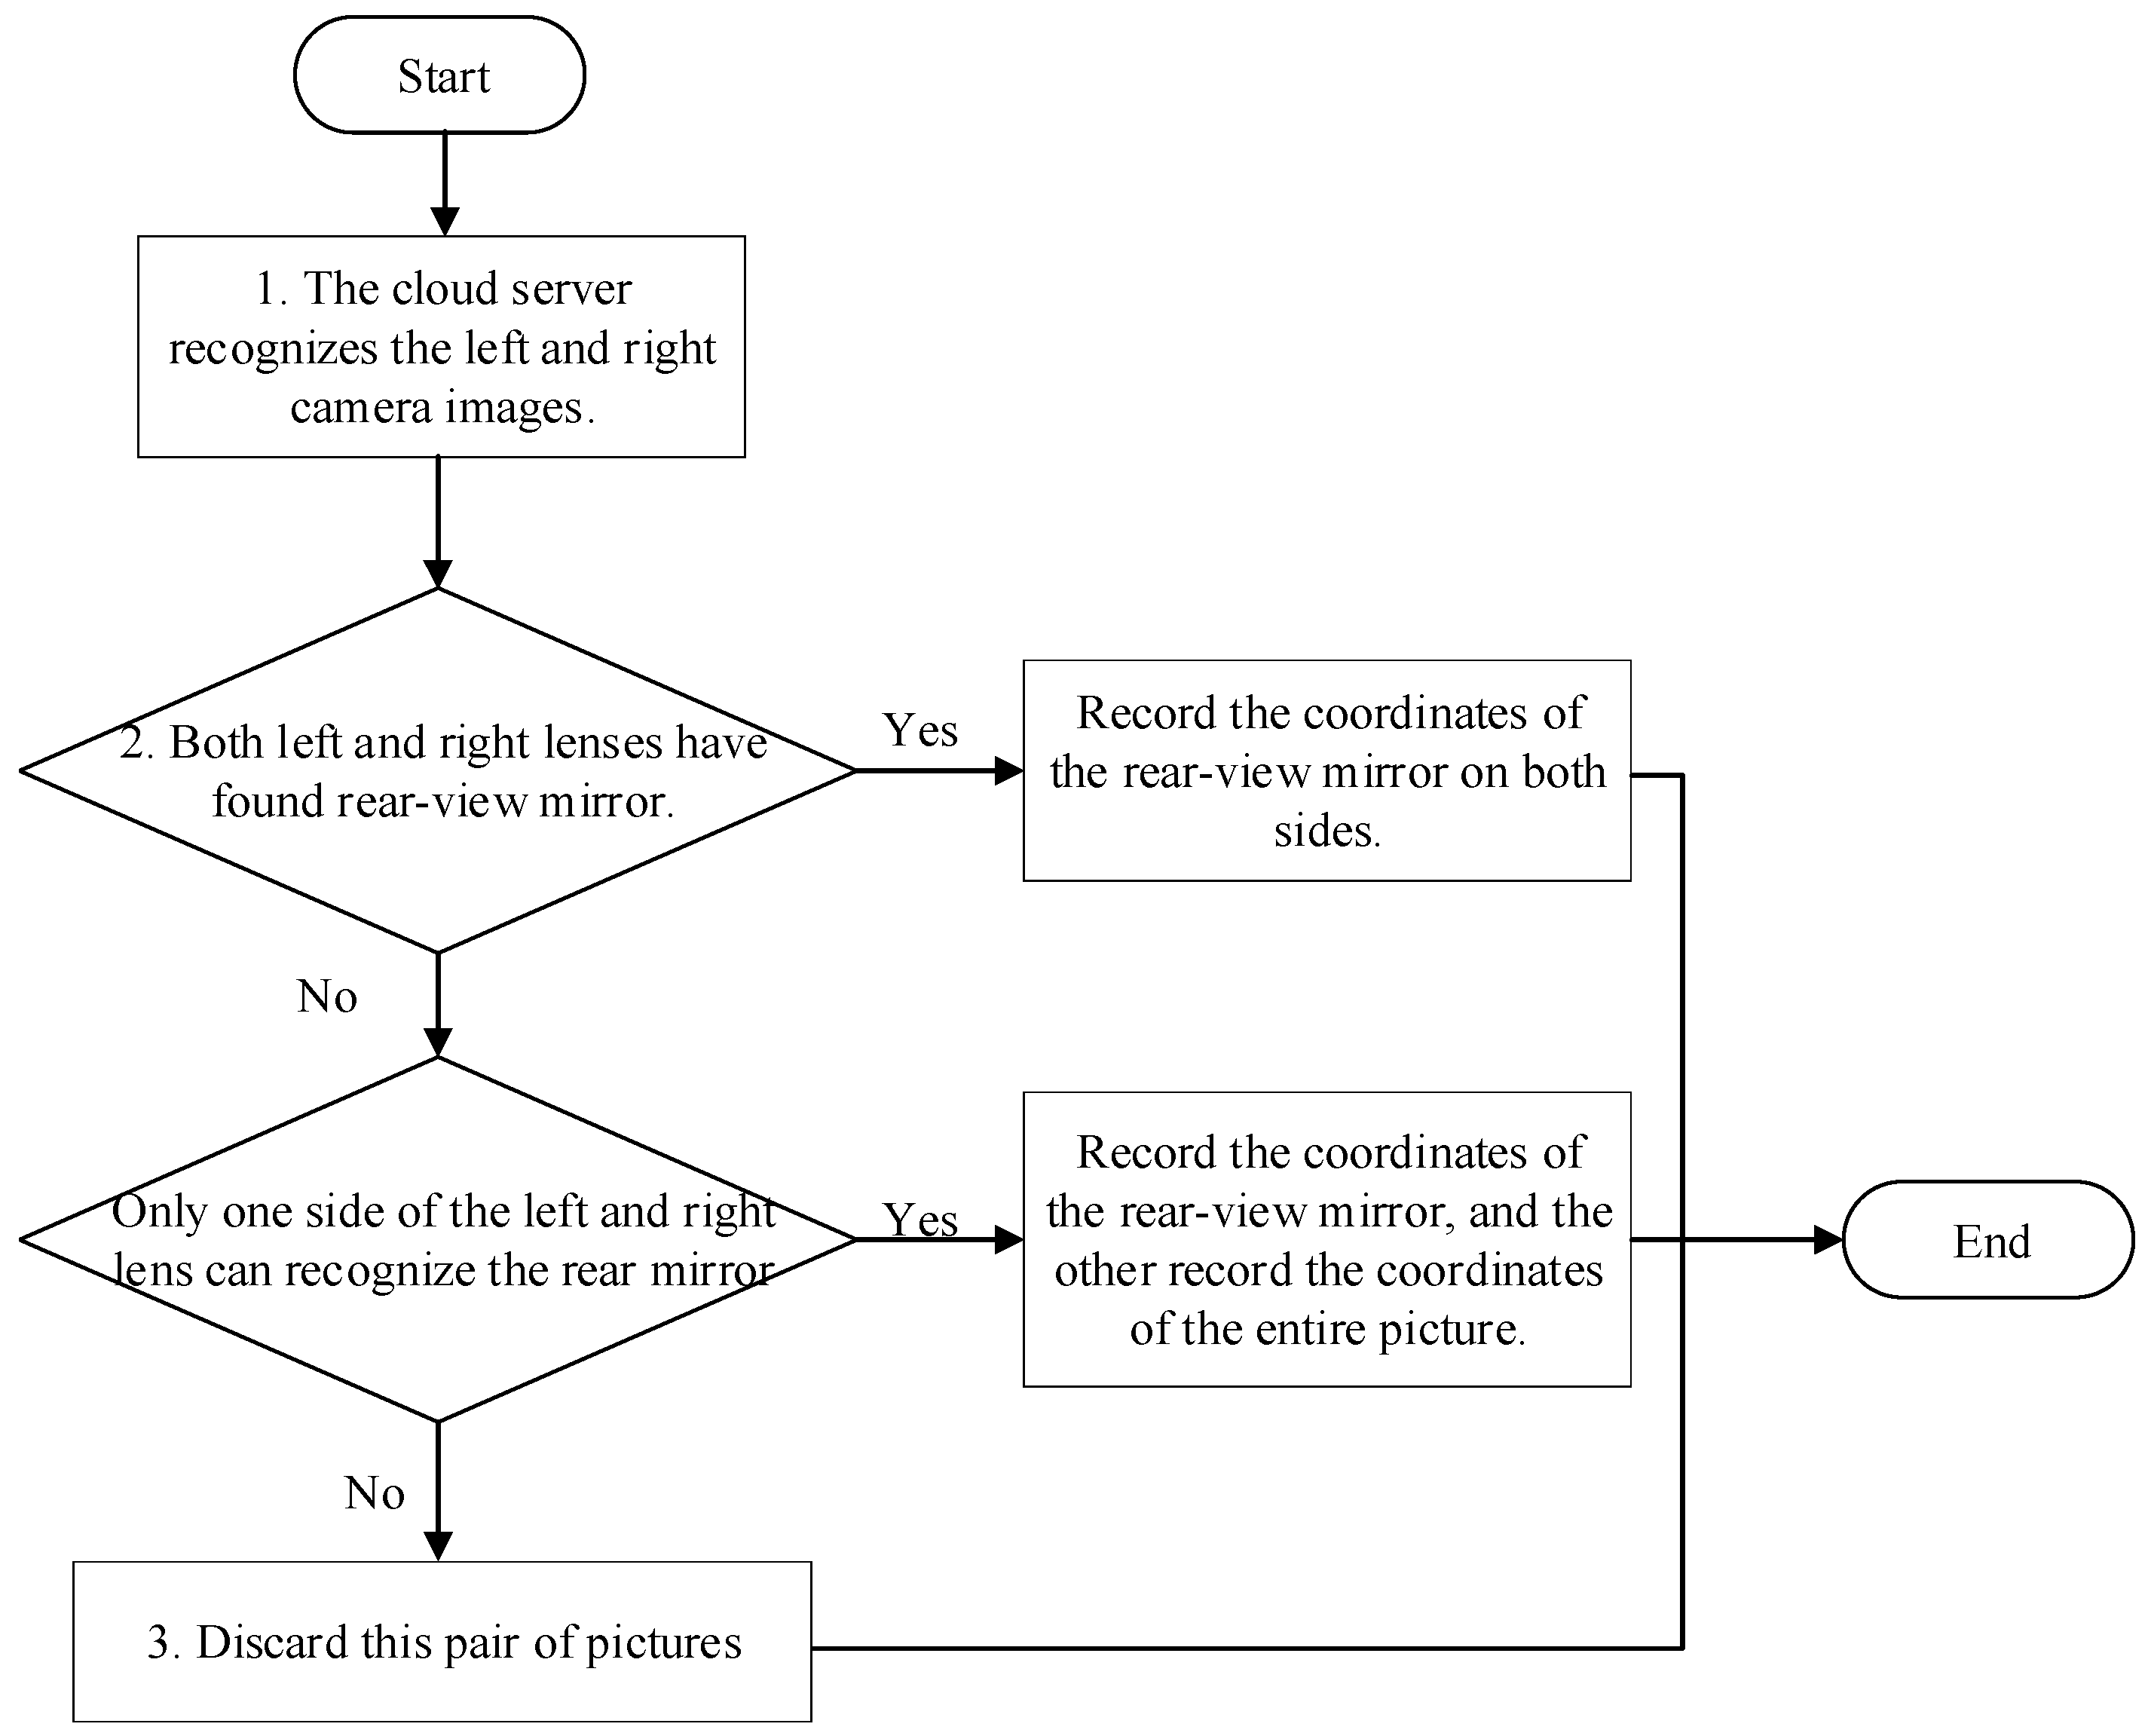
This research uses the YOLOv4 model to identify images. The types of models are bus and rear-view mirror, which will be identified for the entire image. Steps to find and classify the target are as shown in Figure 10.
  • The cloud server receives a pair of images from the mobile phone to identify and record.
  • A decision strategy is chosen based on the identification results.
  • Case 1: If both the left and right images have identified two types of targets, the coordinate information and type of the target class are directly passed to the matching program.
  • Case 2: Under the condition that buses in the images are recognized, if the rear-view mirror has been recognized in the image of one lens only, the coordinate information of the rear-view mirror and the entire image are sent to the matching program.
  • Otherwise: If the two conditions noted above have not been met, this pair of images will be discarded.
4.
If the rear-view mirror has been recognized in the image, go to step 5. Otherwise, go back to step 2.
5.
Adopt the SURF algorithm to match each feature point within the coordinate positions of the rear-view mirrors in this pair of images.
  • If the area of the rear-view mirror in the image is less than 25 pixels × 50 pixels, this area will be enlarged by 2.5 times to perform the feature point detection with the threshold value 1000, as shown in Figure 11.
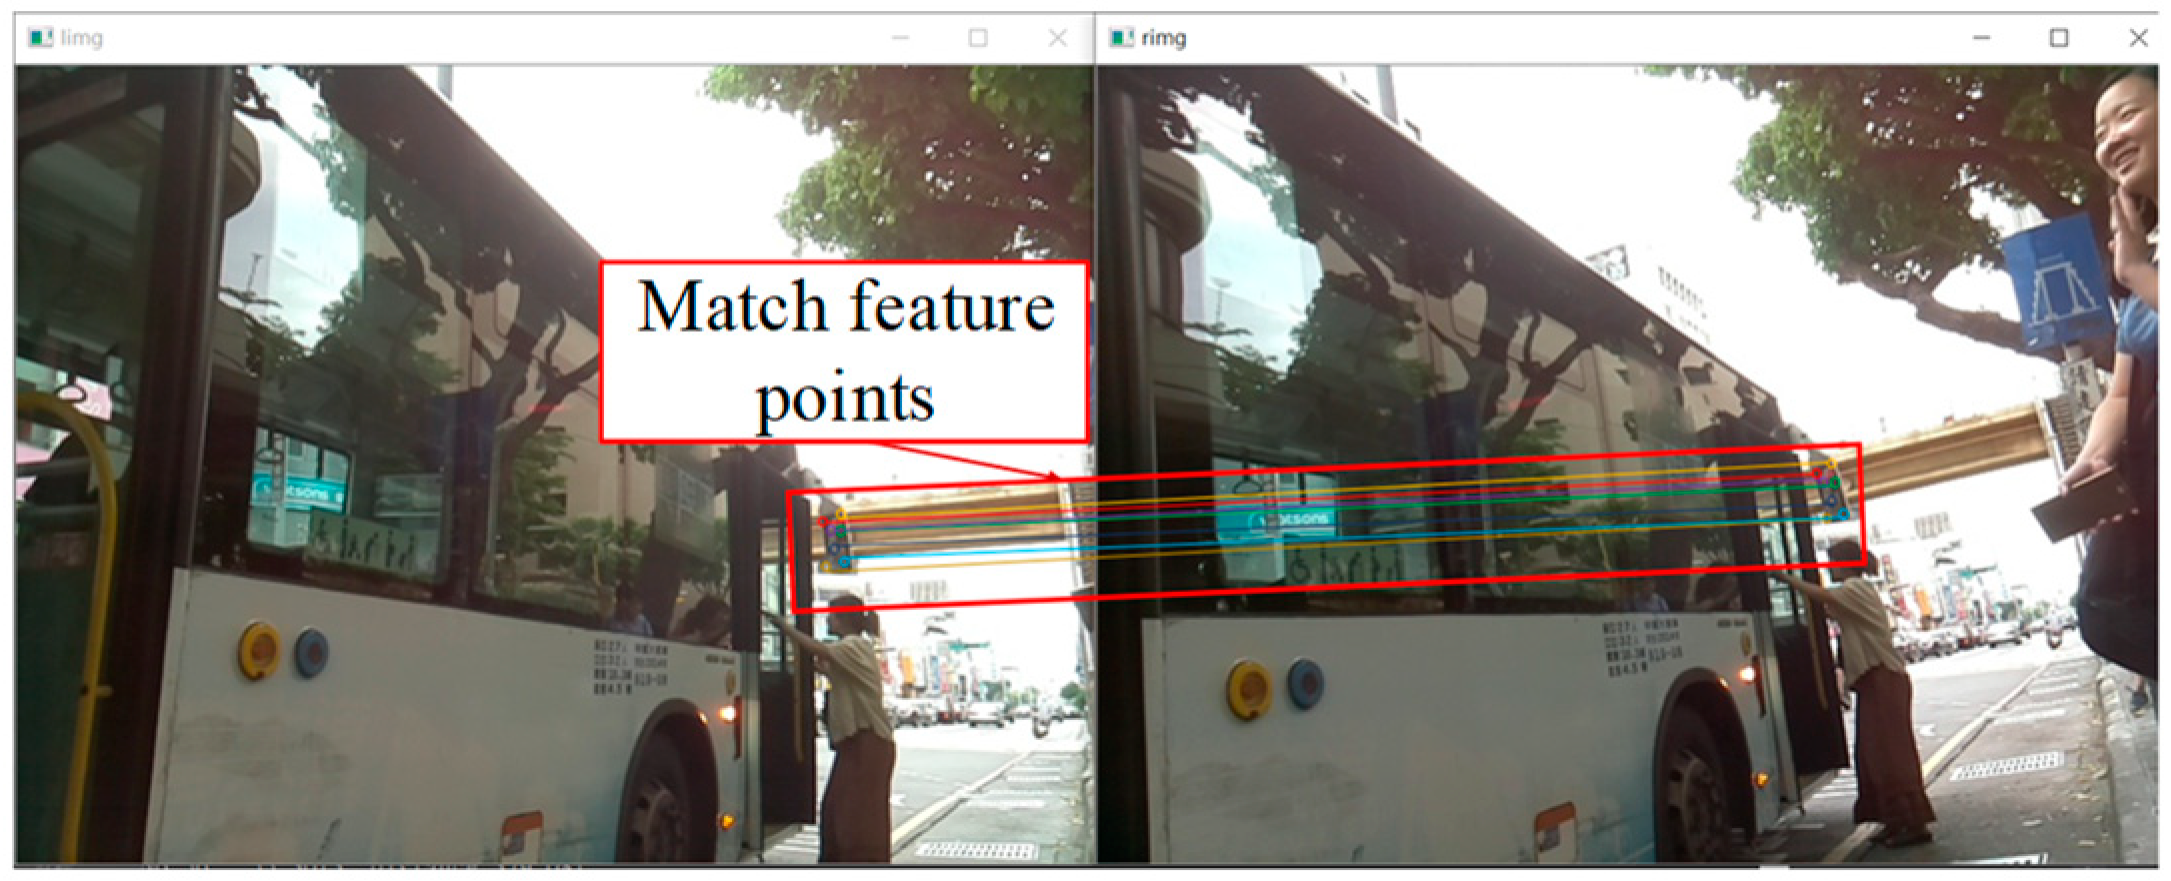
  • Use the feature point sets of the left and right images to match them, as shown in Figure 12.
6.
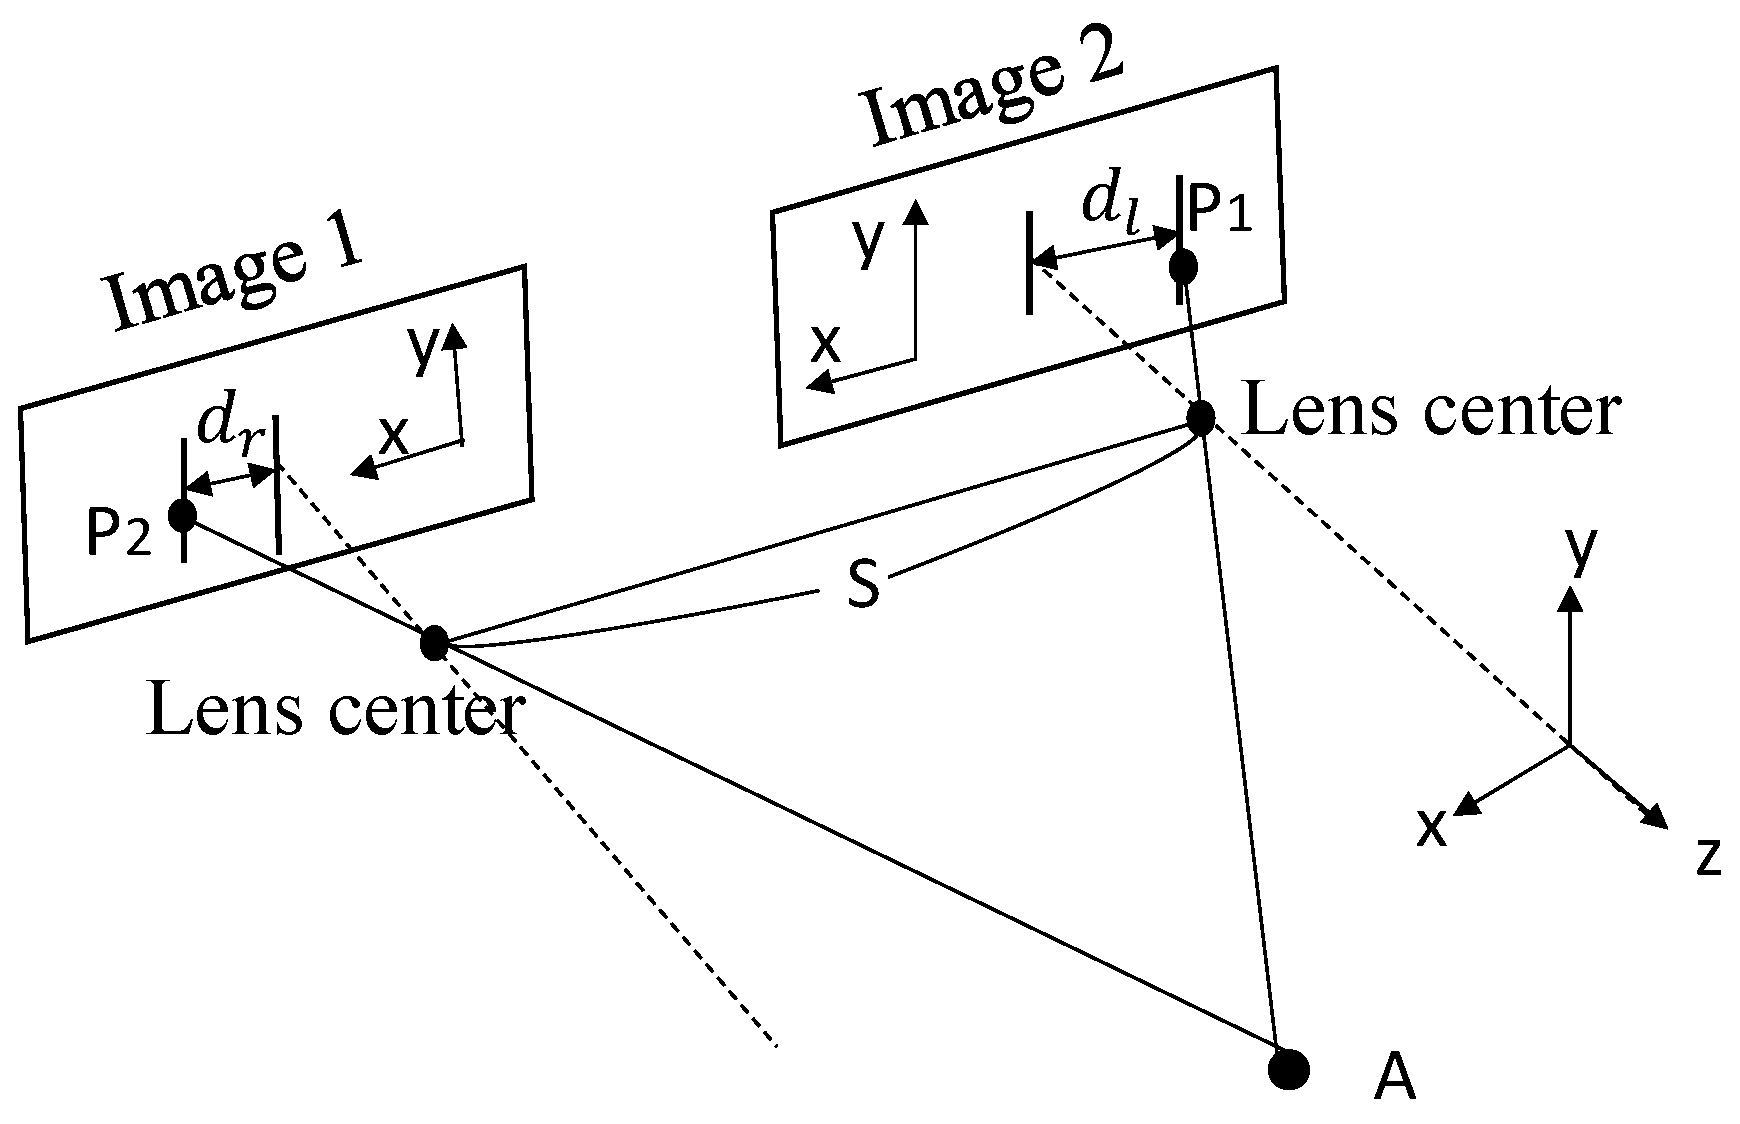
According to the principle of lens imaging [37], which is shown in Figure 13, the distance between the lens and the rear-view mirror can be calculated using the world coordinates of this pair of images. In addition, edge detection is performed on the area within the recognized bus range. The detected edge lines can be used to determine the normal vector of the bus body surface to further calculate the relative angle between the bus and the motorcycle.
The steps of target distance calculation are as follows:
  • Use the rear-view mirror of the bus as the target of the YOLOv4 model.
  • In order to accurately determine the target, first use the focal lengths for both lenses to capture the clearest target images using the autofocus technology. Then, f1 and f2 are averaged to obtain f for the next step.
  • Through the optical centers of the left and right lenses, target A is imaged at location P1 and P2, respectively. To calculate the distance D Z between the lenses and the target A, the three-dimensional space is first projected to the x-z plane. Based on the similar triangle principle, D Z in the unit of m can be calculated by Equation (2), where dl is the x-axis distance from P1 to the optical center of the left lens, dr is the x-axis distance from P2 to the optical center of the right lens, and S is the distance between the optical centers of the left and right lenses:
    D Z = f × S d l + d r + f
  • Based on the imaging relationship for a single lens, the horizontal distance between the imaging position of the object and the image center is d, where d = d l + d r 2 . Hence, the horizontal distance D X between the optical center of a lens and the target can be obtained by Equation (3):
    D X = f d × D Z f
The steps to calculate of the relative angle between the bus and the motorcycle are as follows:
  • Perform edge detection on the identified bus coordinate range and extract the direction vectors close to the four sides of the bus body.
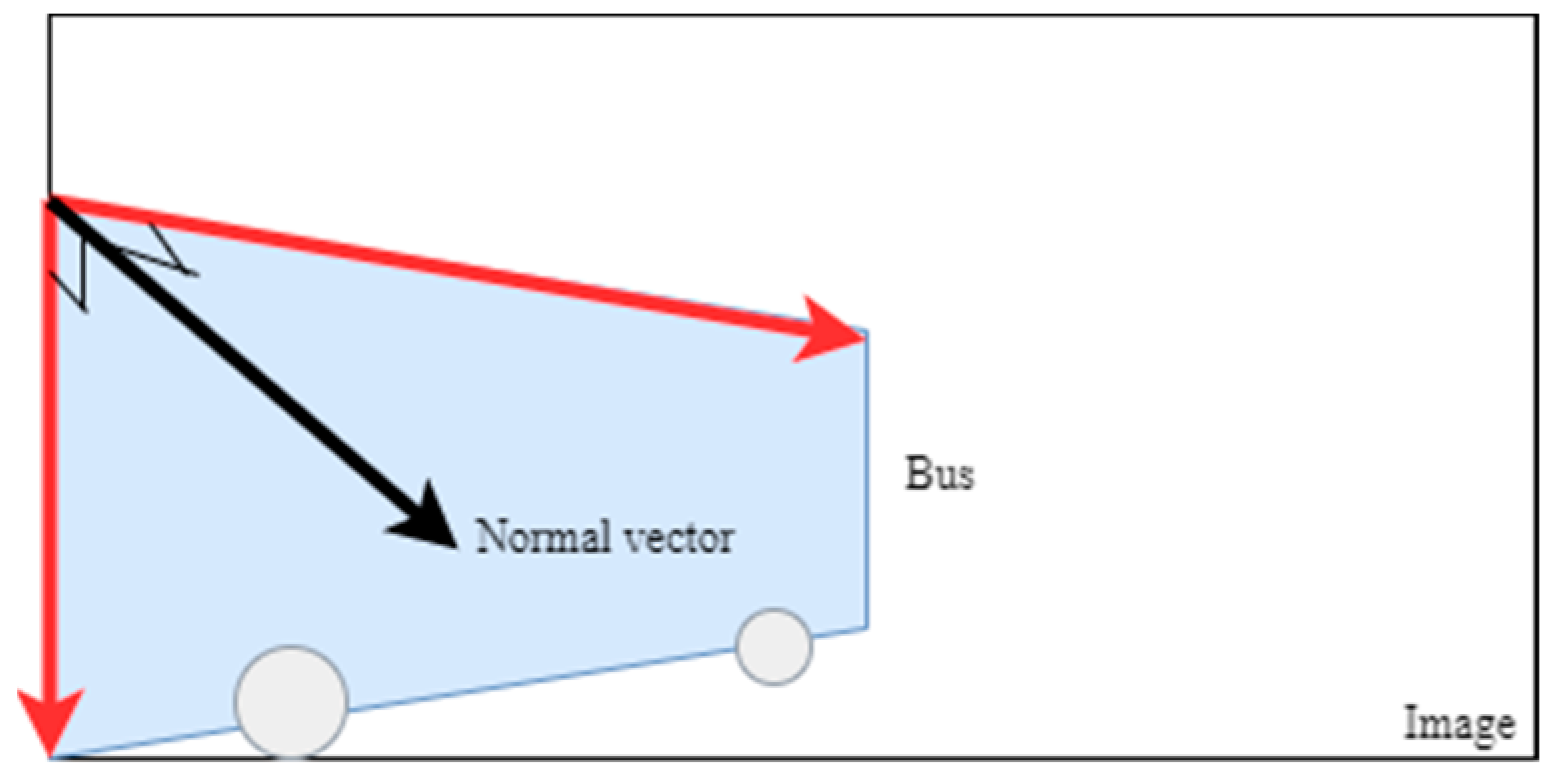
  • Use the outer product of vectors to extract the normal vector of the surface enclosed by the four sides, as shown in Figure 14.
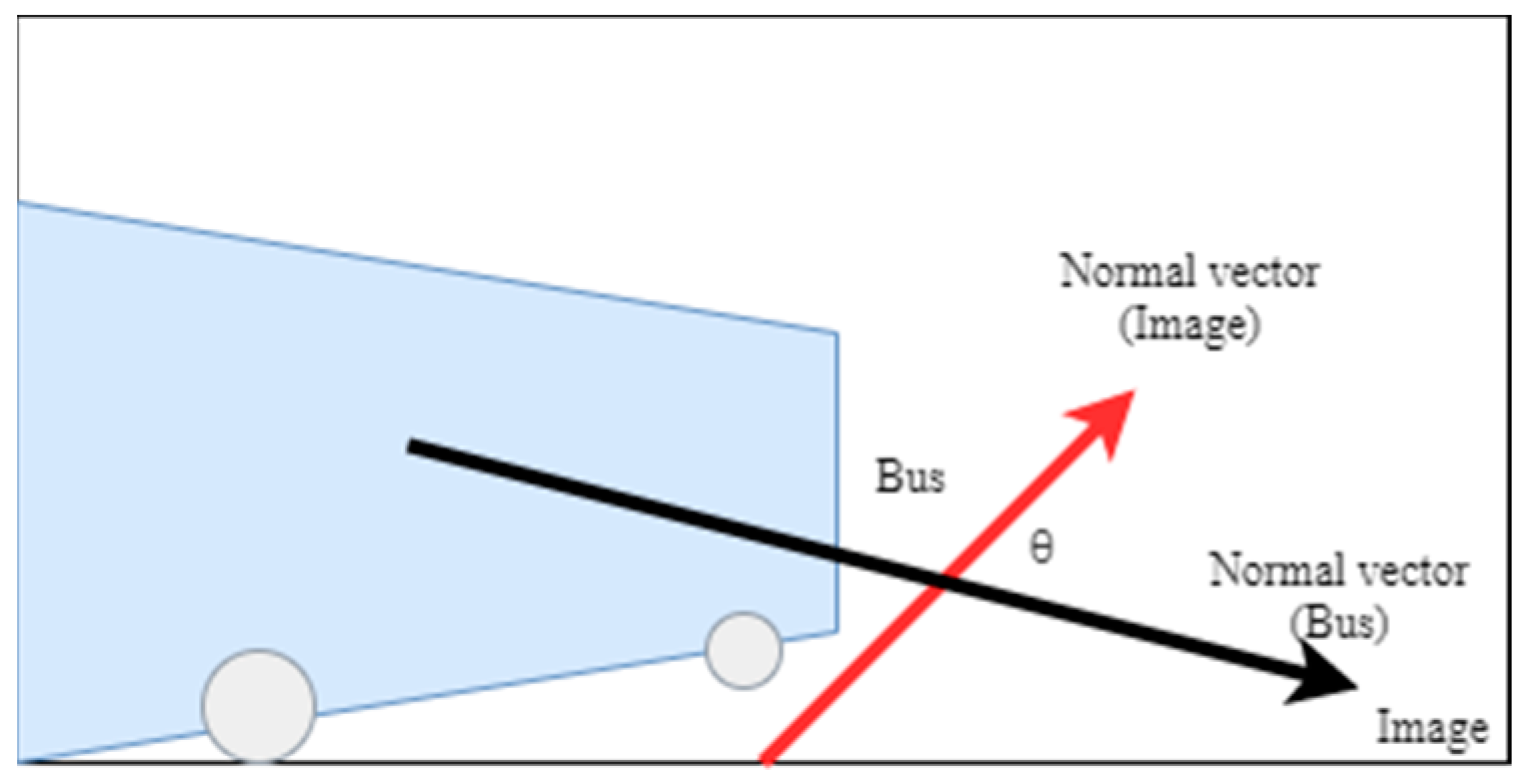
  • Use the inner product of the normal vector of the calculated surface and that of the camera image to further derive the angle between the bus and the motorcycle, as shown in Figure 15.
7.
The cloud server transmits relative angle and distances D X and D Z to the android phone.
8.
As soon as the android phone receives relative angle, D X , and D Z , the PBSW app running on the android updates the relative position of the motorcycle and the bus on the screen. It further determines whether the bus is turning, or whether the motorcycle has entered the blind spot of the bus or not, using angular and distance information, respectively. If yes, an audio clip to warn the motorcycle driver of the incoming danger is played back immediately. Figure 16 illustrates how to confine two zones of the bus blind spot.
  • Zone A: this zone is an invisible rectangle besides the bus and behind the driver’s ocular points. Hence, two formulas, i.e., 0 ≤ D X ≤ 5 and 0 ≤ D Z ≤ 4, confine Zone A.
  • Zone B: this zone is an invisible triangle starting from 4 m behind the driver’s ocular points. It is composed of three vertices, i.e., M1(1, −4), M2(5, −4), and M3(5, −30), under the condition D Z > 4.
9.
In summary, Equation (4) formulates rules in terms of D X and D Z confining the complete blind spot of the bus:
0   D X 5 ,     0 D Z 4 2 13 × D Z + 5 13 D X 5 ,   D Z > 4
Figure 16. The blind spot of the bus contains two invisible zones.
Electronics 12 03310 g016

4. System Implementation and Performance Evaluations

4.1. Hardware and Software

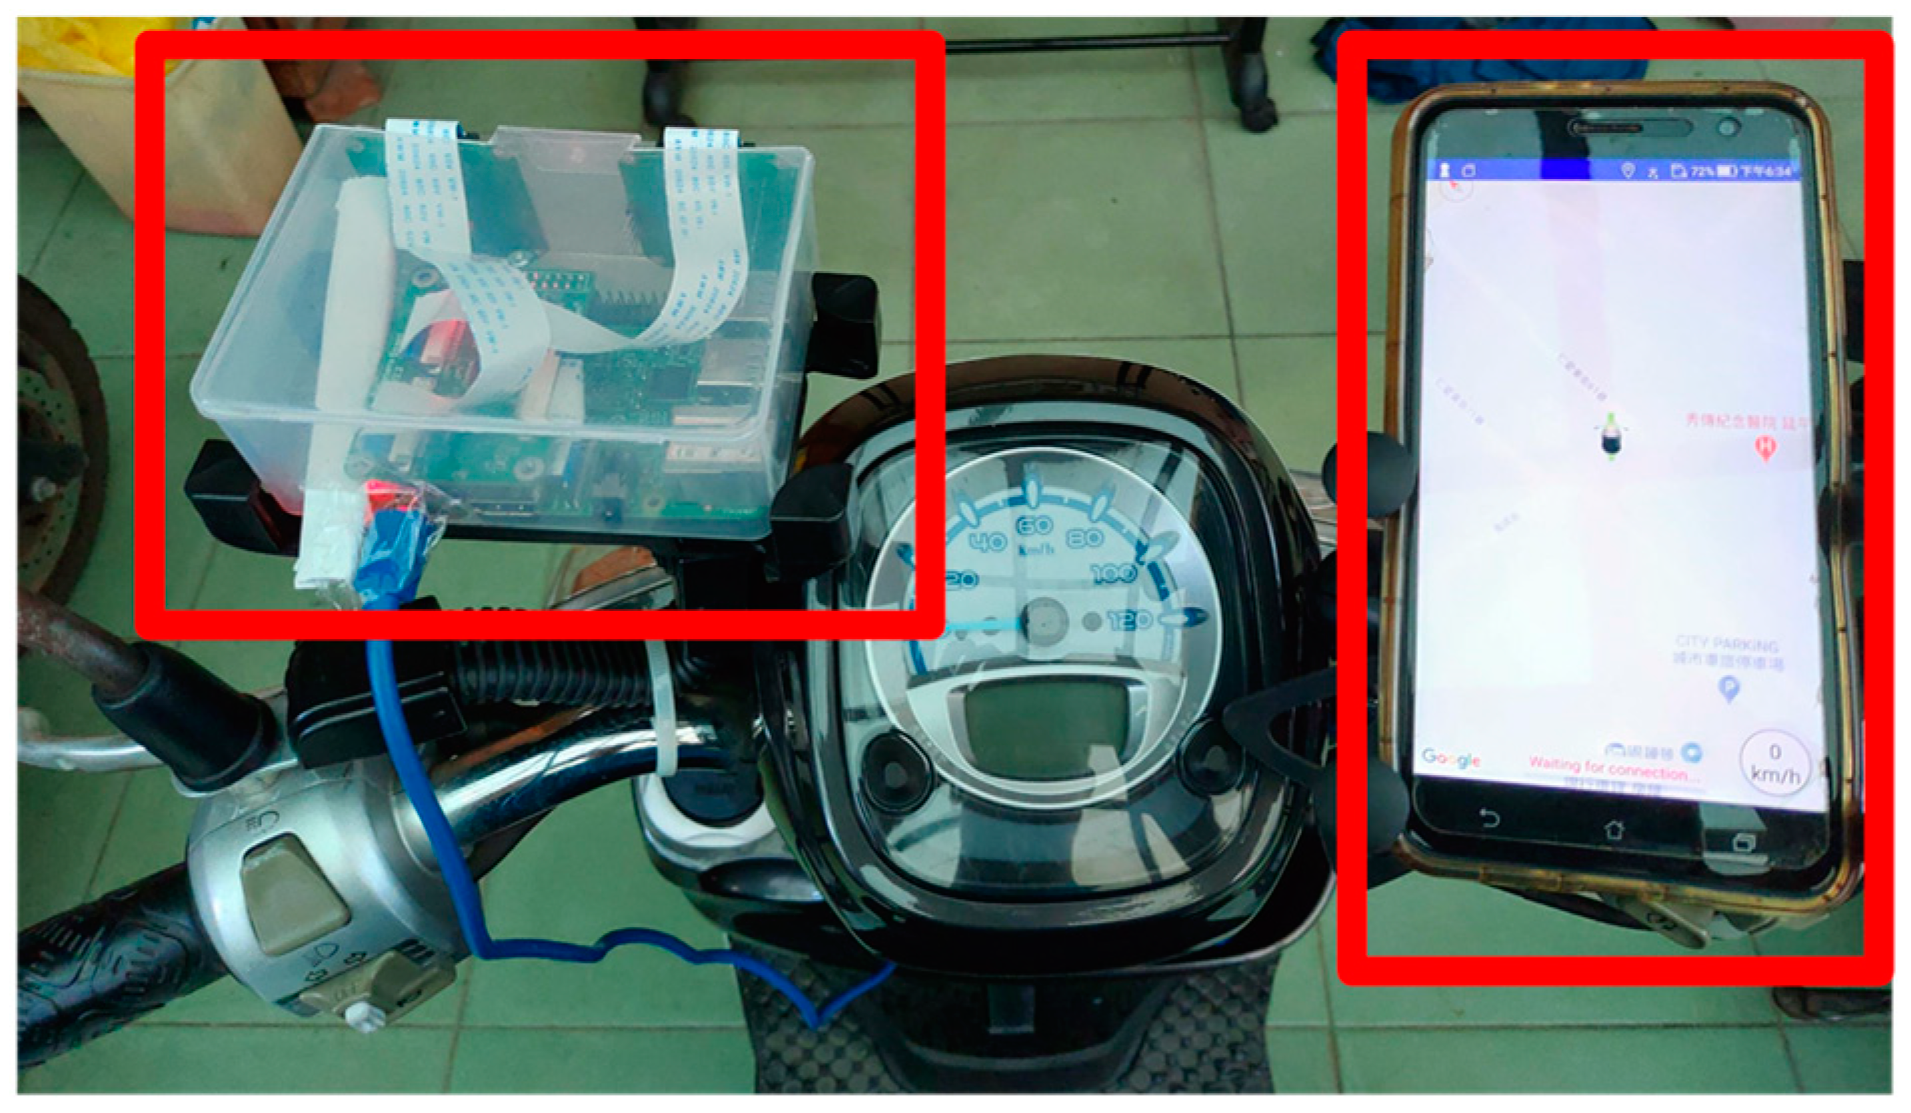
This system uses a Raspberry Pi 3B+ board as the main body to connect two USB cameras for obtaining road images with a resolution of 640 × 480 pixels per frame and seven frames per second (FPS). It also connects a Wi-Fi module to transmit images to Android phones using the connectionless UDP socket. The hardware equipment of the motorcycle is fixed on the steering handle of the motorcycle, as shown in Figure 17. The part on the left is a dual-lens device, and the part on the right is an Android phone. As mentioned above, the Android phone also creates a connectionless UDP socket to transmit the captured images to the cloud server through the mobile network for training the YOLOv4 model. The cloud server used in this system is equipped with an Intel i7-8700 CPU and a NVIDIA GeForce RTX 2080 Ti GPU used to identify the rear-view mirror in the captured image and calculate the distance between the rear-view mirror and the motorcycle. When the system detects that the motorcycle has entered the blind spot or the inner wheel difference area of the bus, it will immediately send a warning to the PBSW app of the motorcyclist. This PBSW system uses C++ to implement the YOLOv4 model and SURF image-matching algorithm, JAVA to implement Android app, and Python and OpenCV-Python to implement dual-lens image acquisition.

4.2. The Android PBSW App

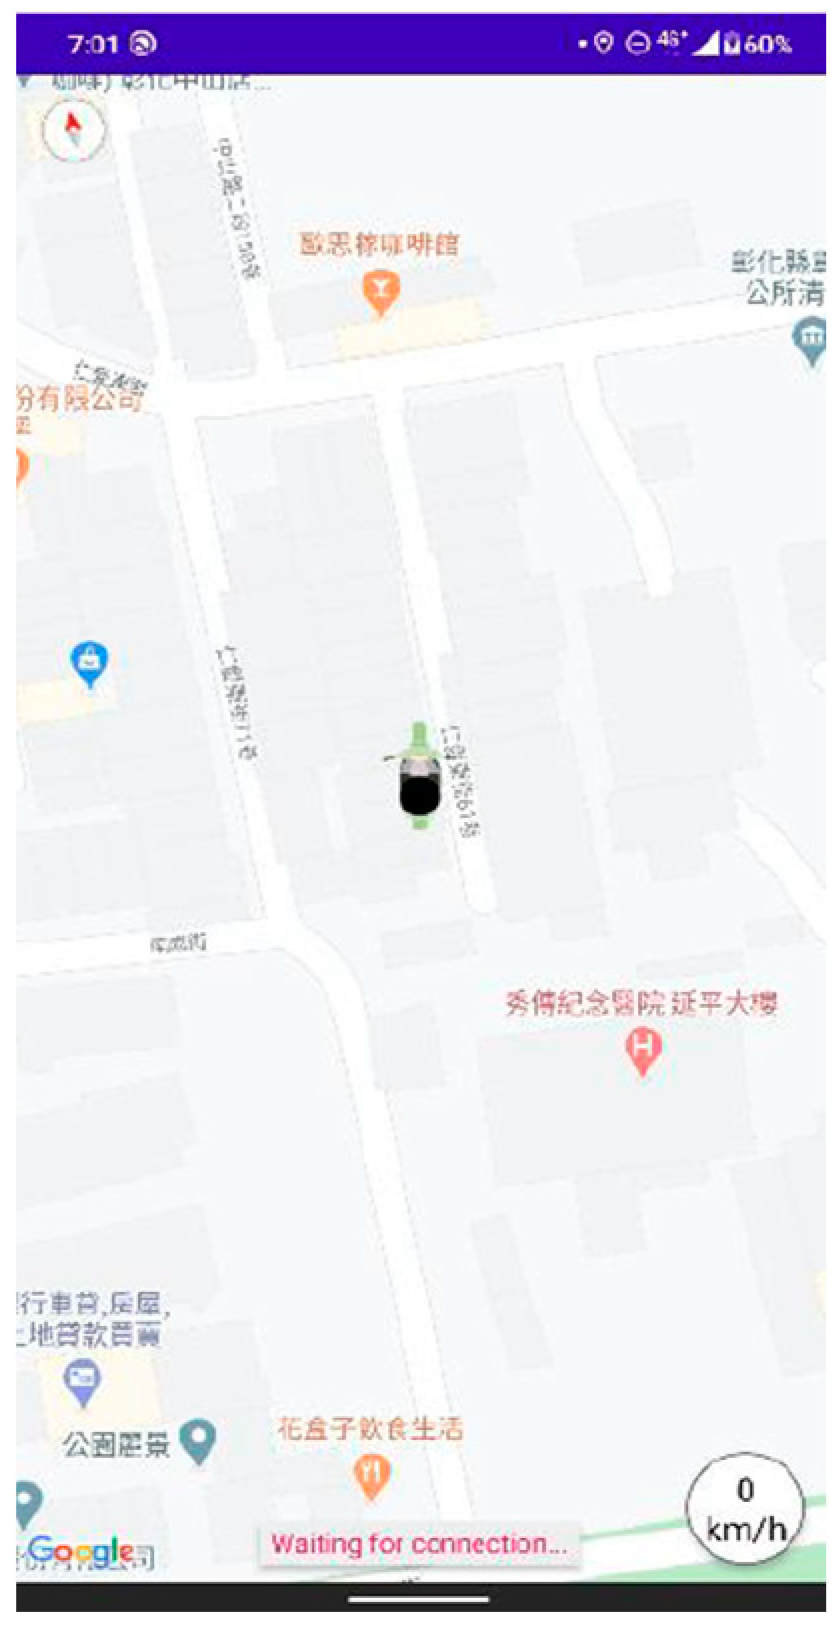
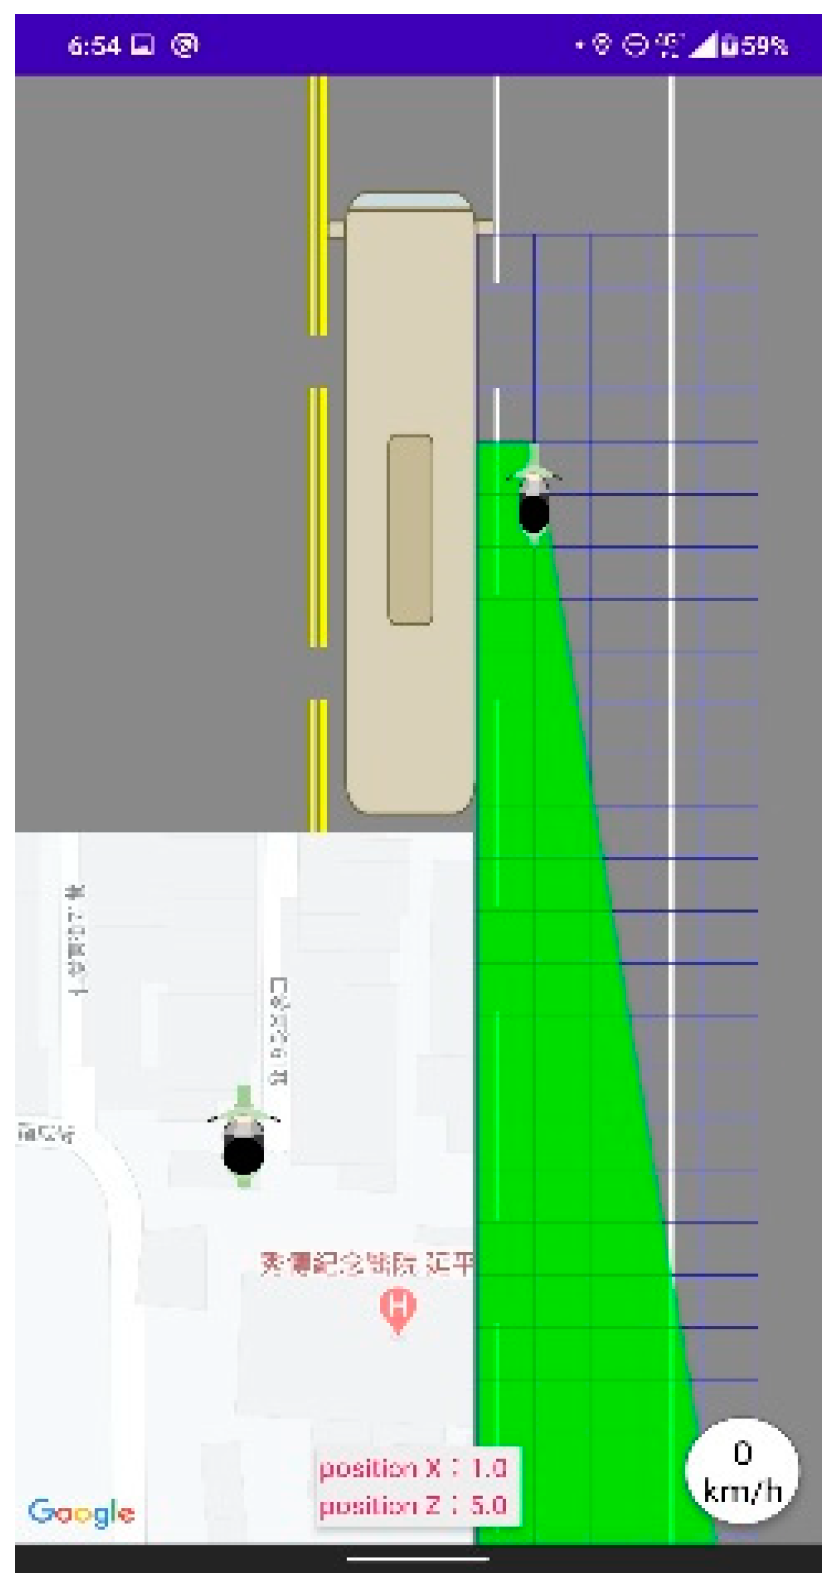
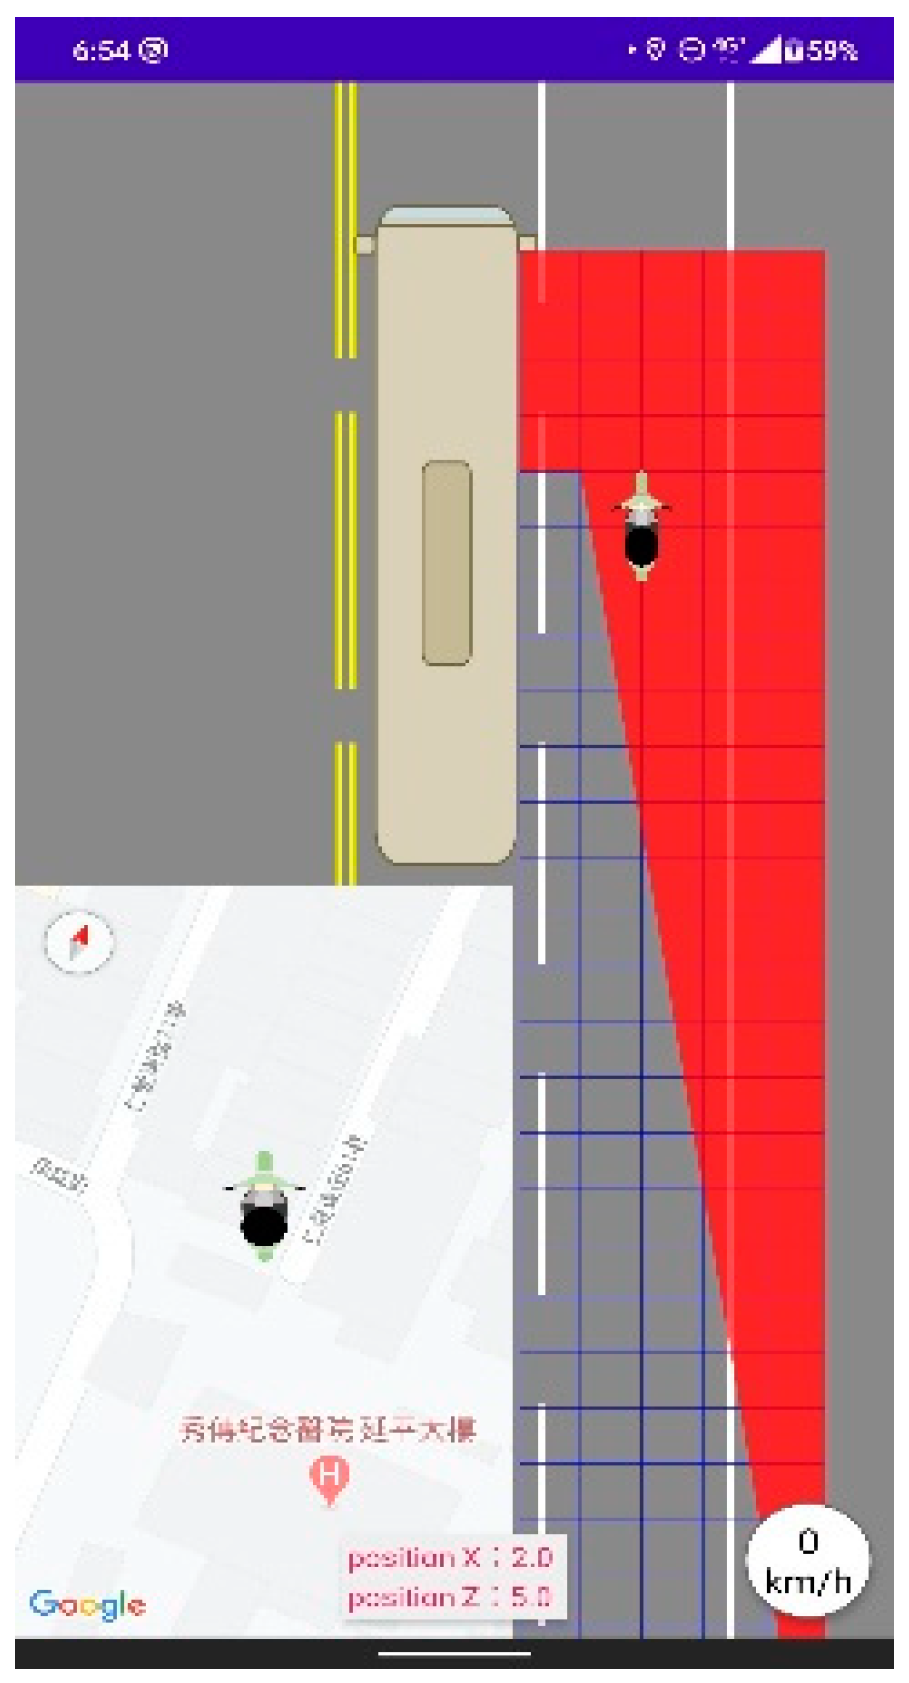
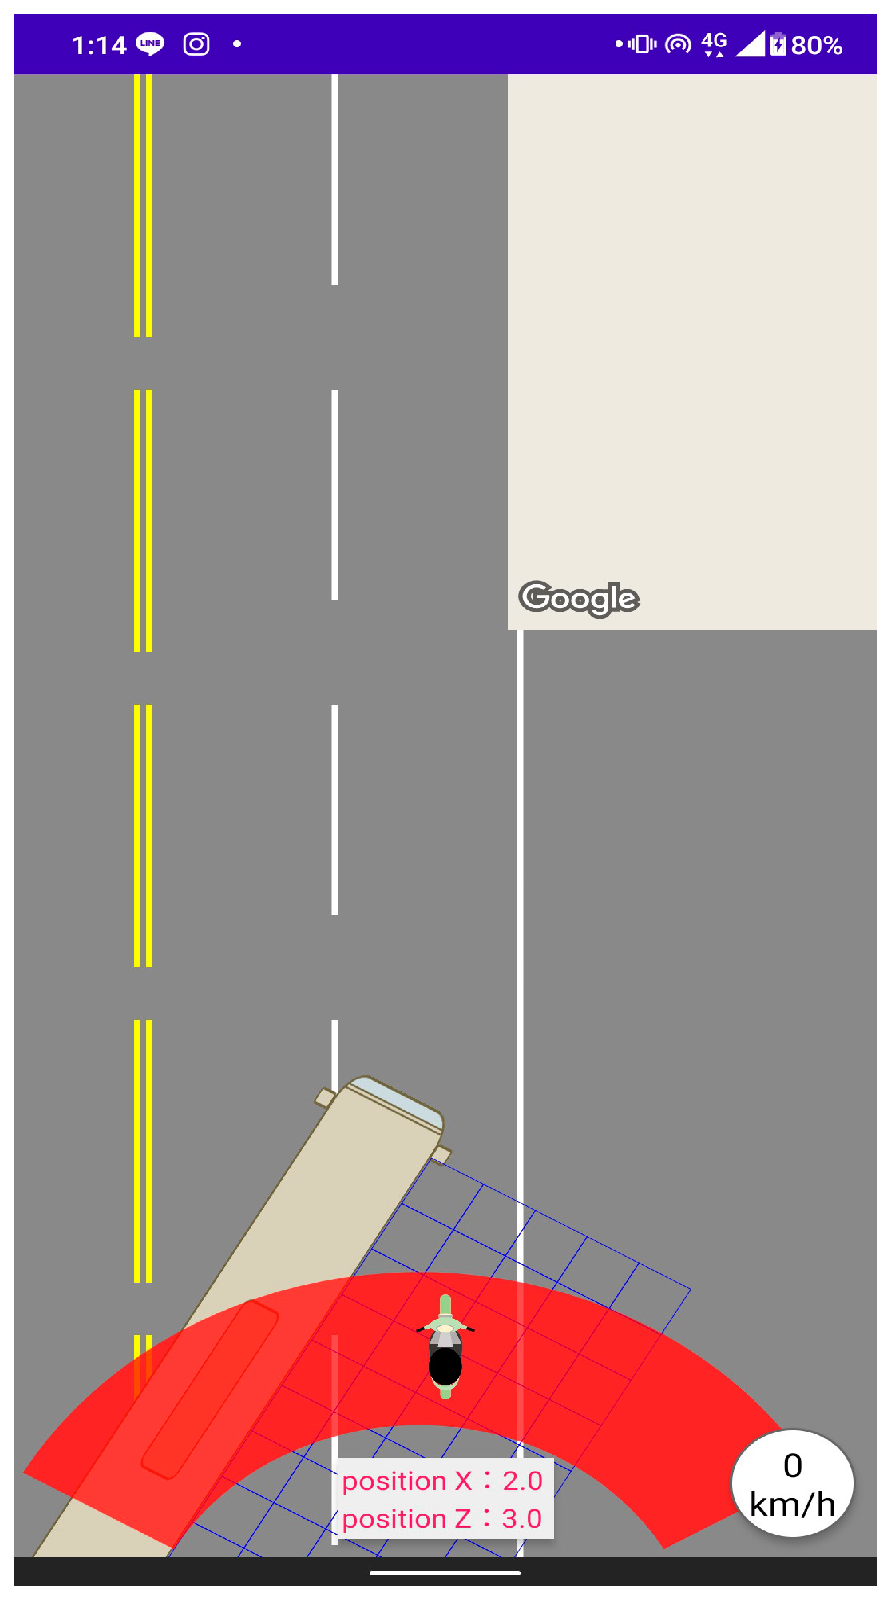
PBSW app includes map mode and warning mode. When the cloud server recognizes that there is no bus rear-view mirror in the image, the PBSW app shown in Figure 18 will display the map mode; that is, the current location of the motorcycle and nearby places with their Chinese names are displayed on the Google map, and this method is used to call the Google Map API. Otherwise, when the motorcycle enters the blind spot of the bus, the PBSW app will switch to the warning mode. In this mode, the app will present a bird’s-eye view of the relative positions of the bus and the motorcycle. The blind spot and the visible area of the bus are illustrated by the color red in Figure 19 and green in Figure 20. In this condition, the app also determines whether the bus is turning or not. If yes, the app will show the inner wheel difference area of the bus on the screen in Figure 21. In addition, the app will display the distance calculated by the cloud server at the bottom of the screen. A small Google Map in the lower left corner shows the driver’s current location, and the lower right shows the current speed. Finally, this PBSW app in warning mode will provide an audio alert to the driver as soon as the motorcycle enters the blind spot or the inner wheel difference area of the bus.

4.3. Performance Evaluations of this System

4.3.1. Real-World Evaluation of the Implemented System

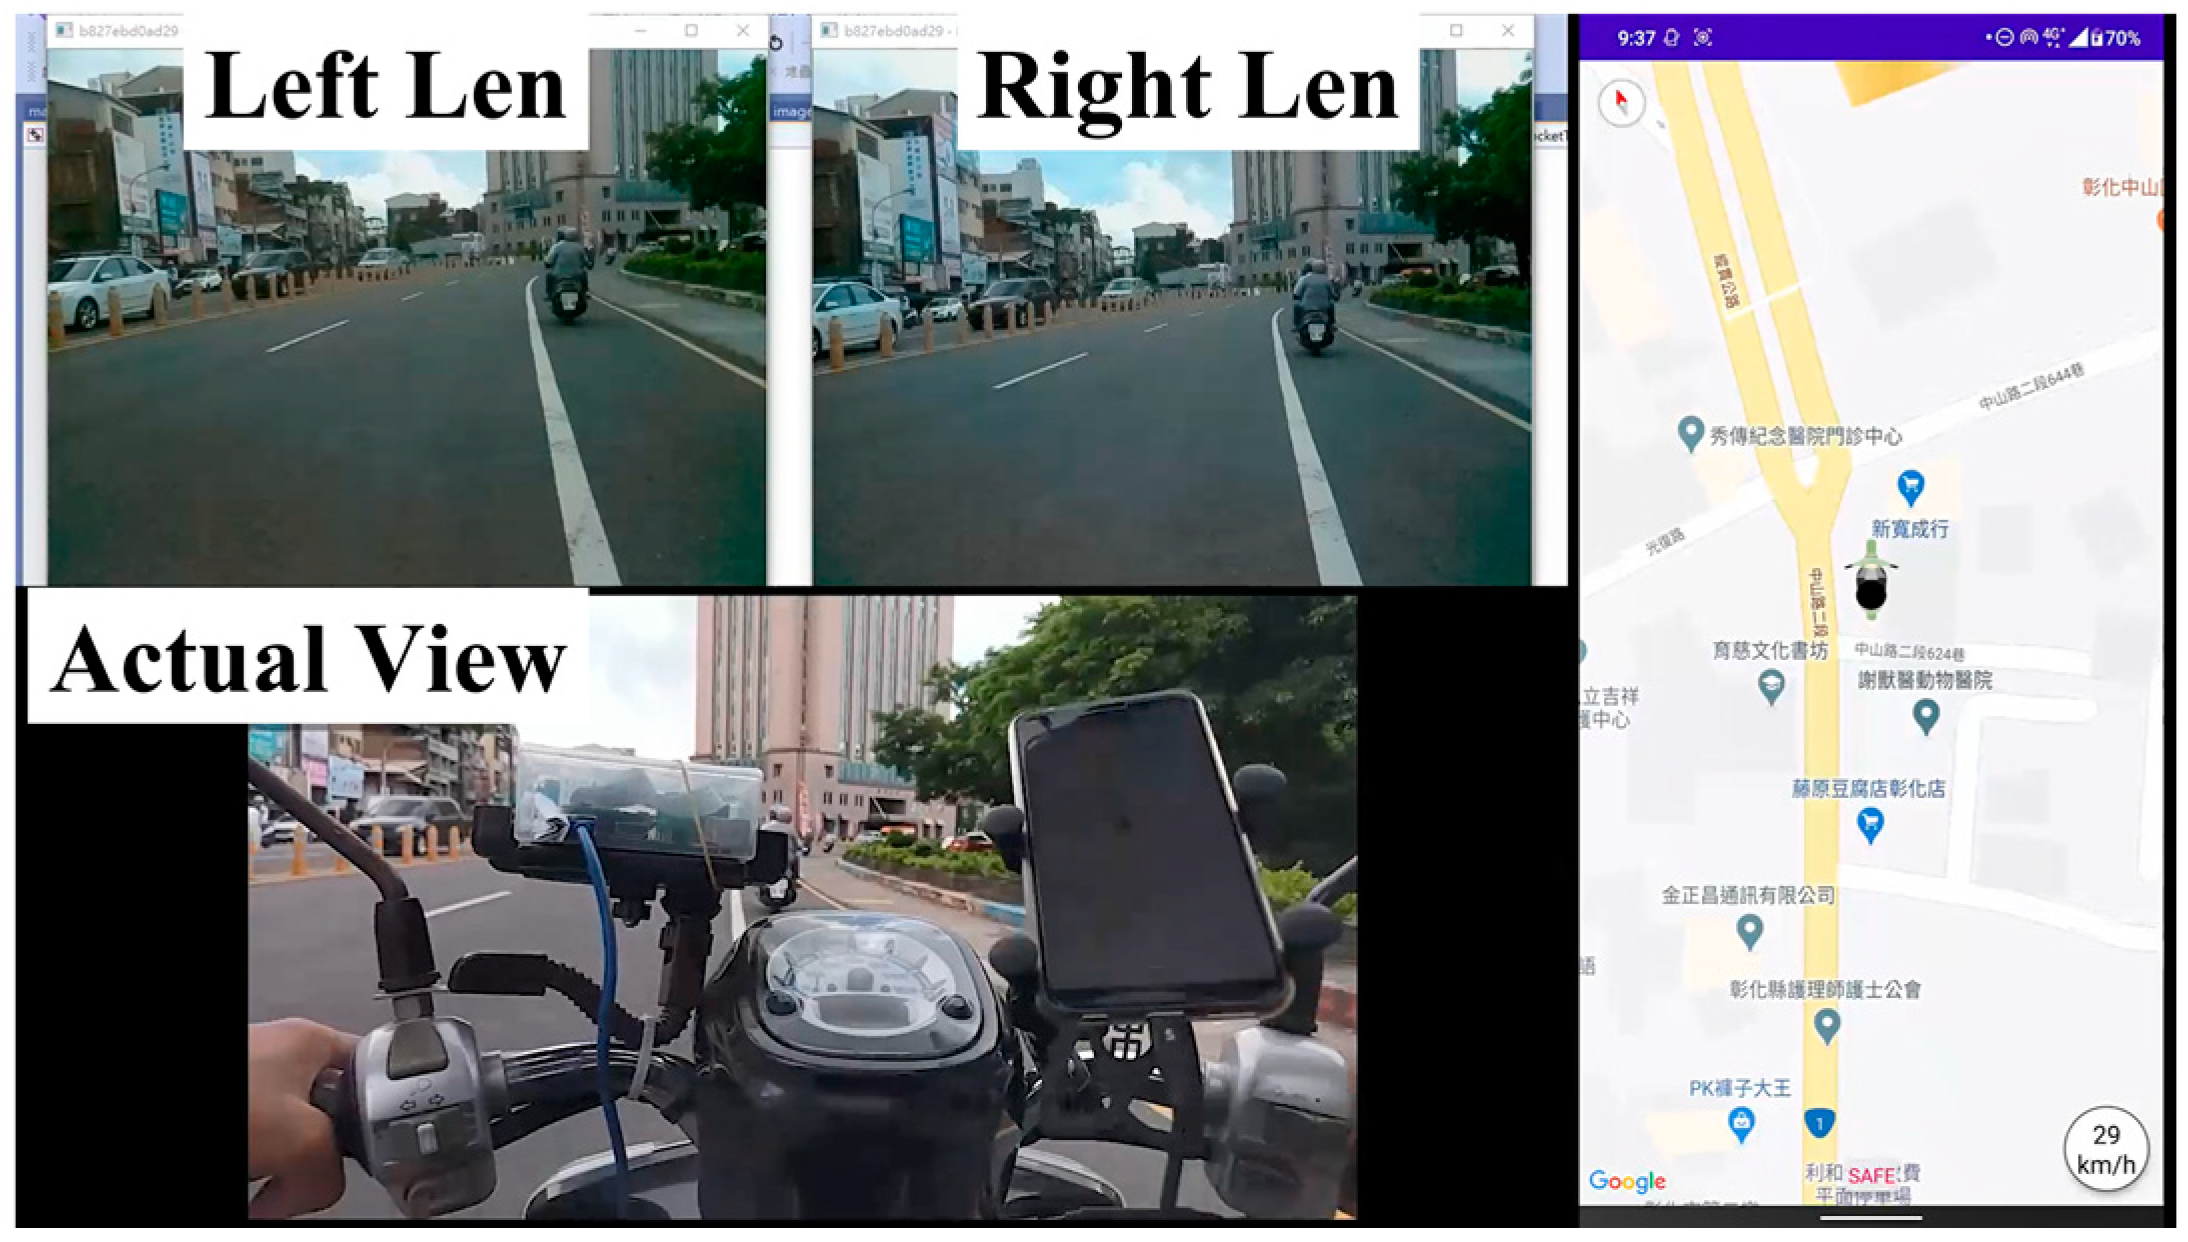
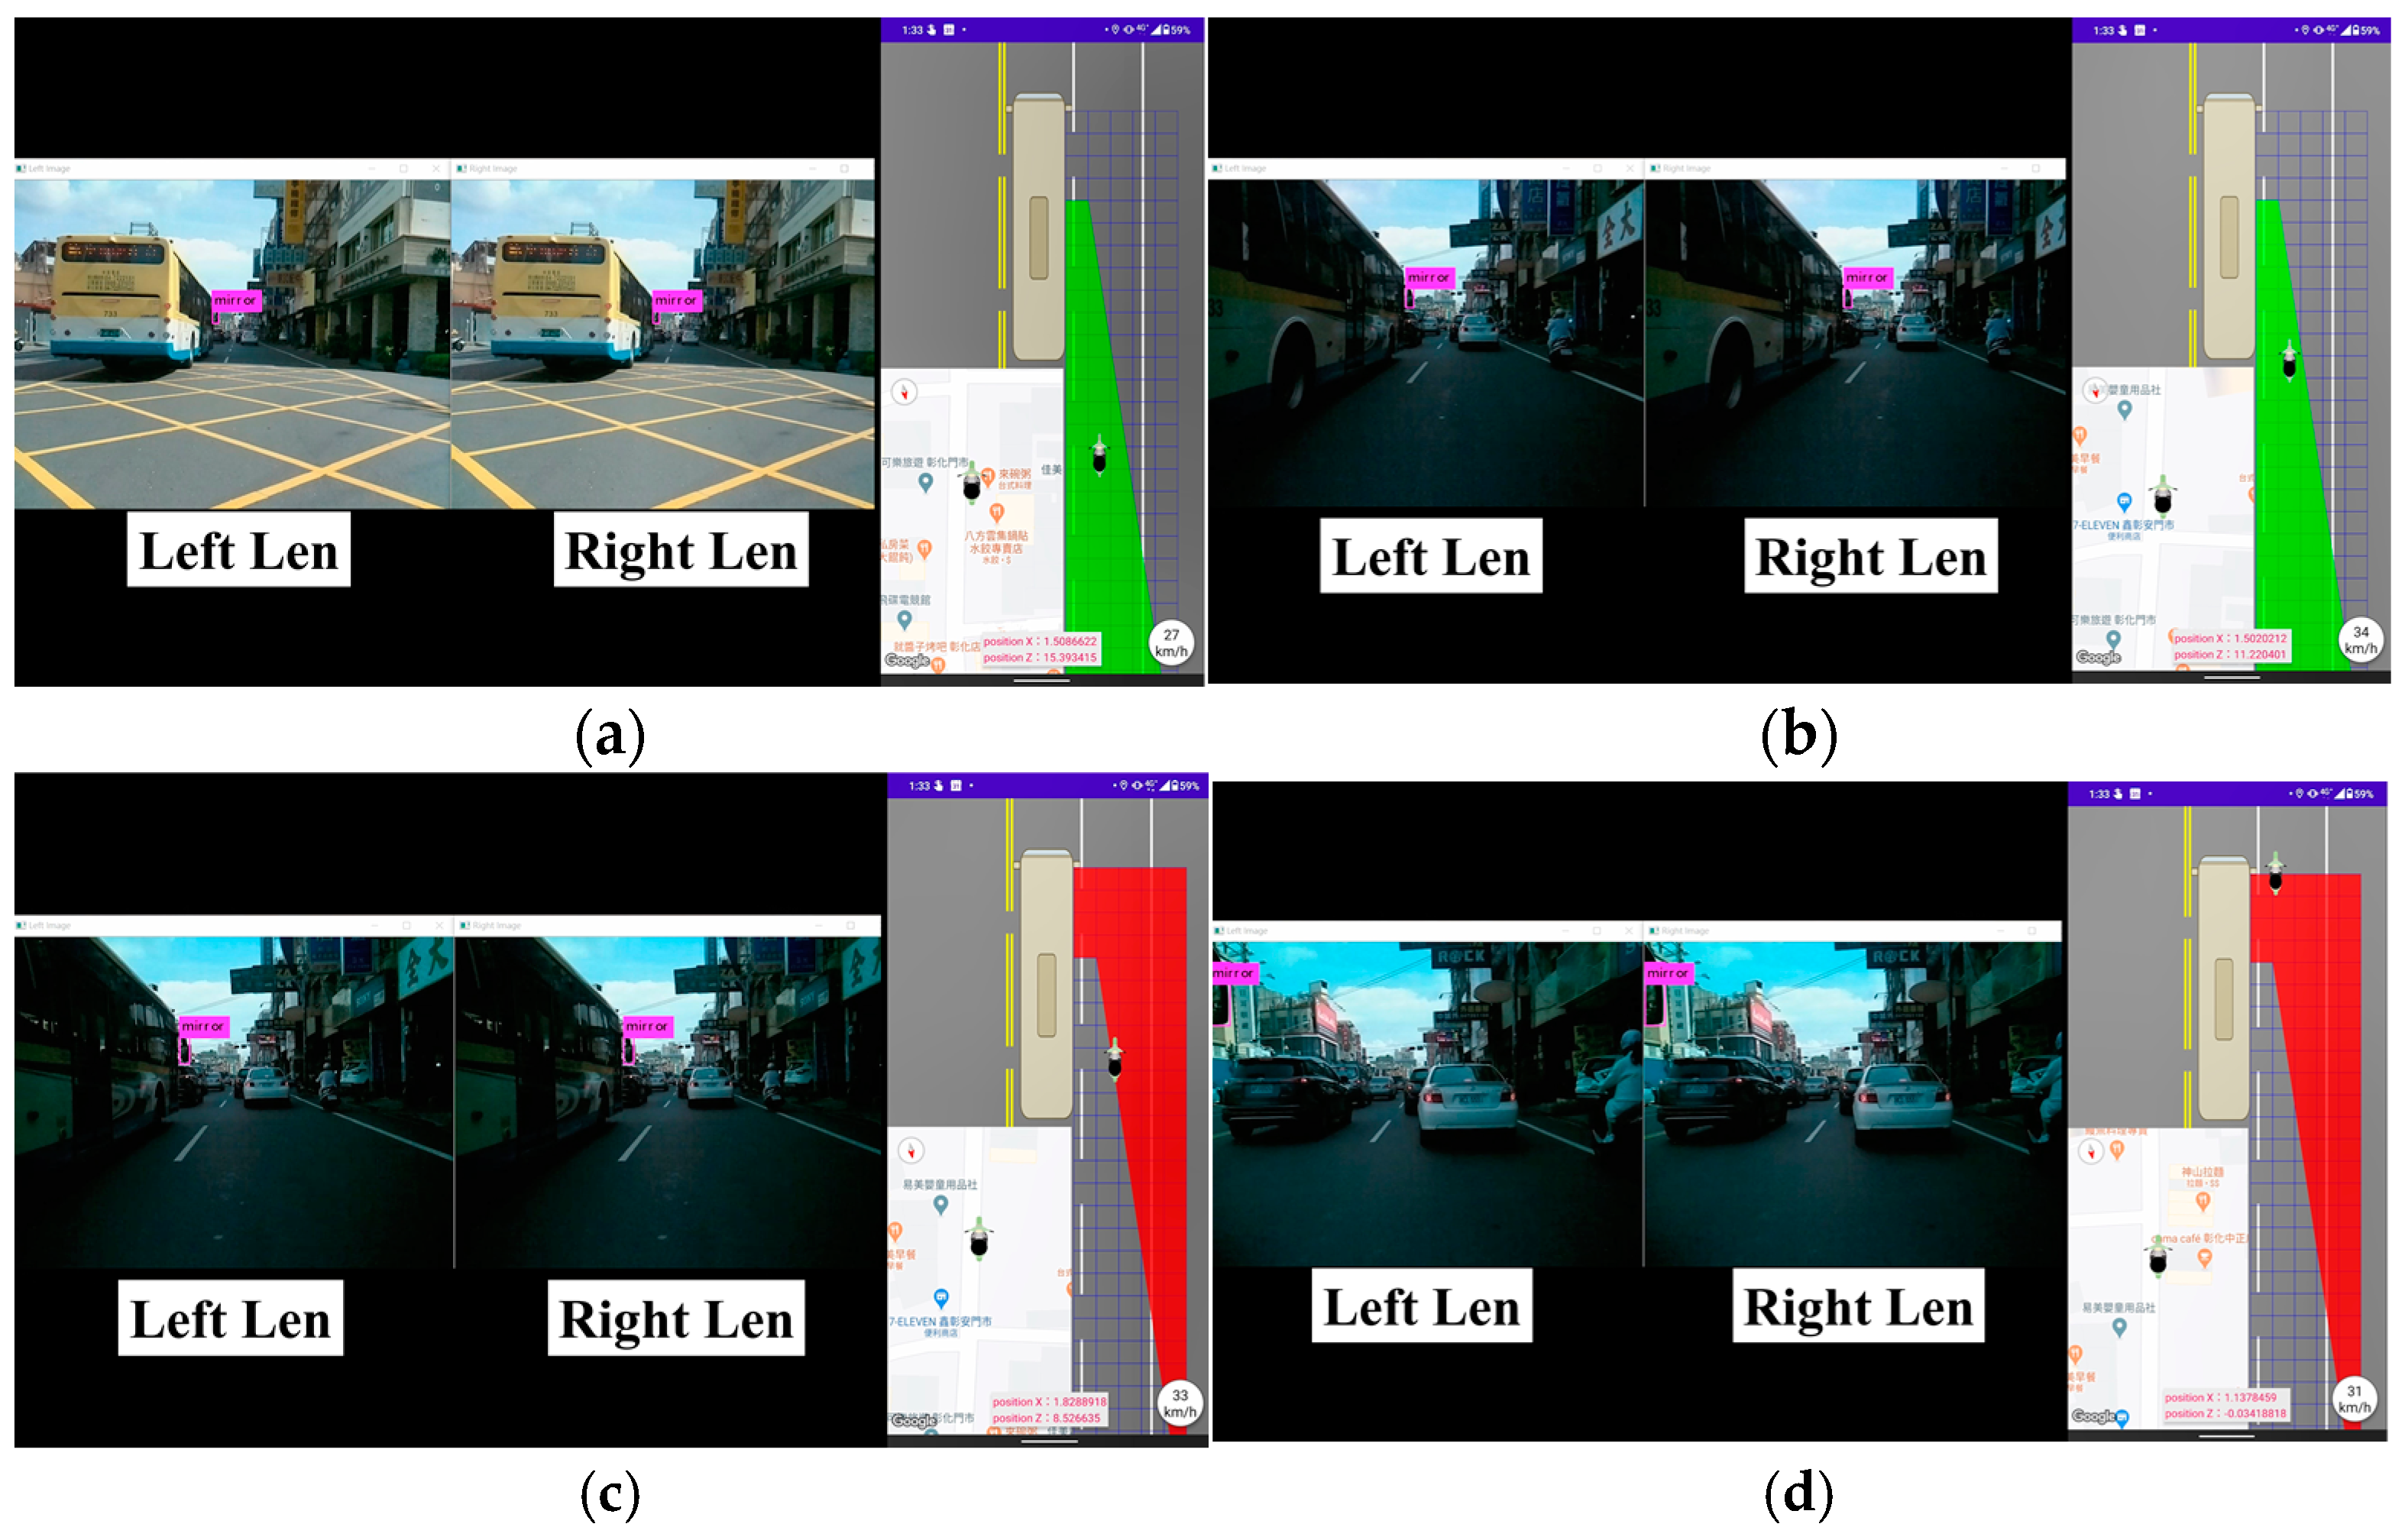
To emphasize the unique advantages, i.e., its real-time functionality and significant impact on enhancing motorcyclist safety, of this proposed PBSW system, it has been tested in real life. Please refer to the video clip shot on the road [38]. Figure 22 presents the map mode snapshot of the PBSW system from this video clip when the motorcycle finds no bus in front. The images taken by the left and right lens, the actual hardware layout of the motorcycle, and the Android PBSW app are shown in the upper left, lower left, and right parts of Figure 22. Whenever the cloud server has recognized the rear mirrors of the bus and has identified that the motorcycle has entered the visible area, i.e., the green zone, or the blind spot, i.e., the red zone, the Android PBSW app illustrates the location of the motorcycle as it receives the relative angle and distances from the cloud server. Figure 23a,b present the PBSW warning mode snapshots as soon as the motorcycle enters the visible area of the bus (when it is behind the bus), and when it reaches the rear end of the bus, respectively. Figure 23c,d present the PBSW warning mode snapshots as soon as the motorcycle enters the blind spot of the bus (when it is beside the bus), and when it reaches the front end of the bus, respectively.
In the following step of the study, six key metrics, i.e., the average image classification and processing time in the cloud server, image transmission rate of the Android phone, round-trip delay between the Android phone and the cloud server, YOLOv4 classification accuracy, and error rate of the estimated distance, are used to provide concrete evidence of the PBSW system’s efficiency and reliability as measured in a real-world evaluation.

4.3.2. Average Image Classification Time in the Cloud Server and Raspberry Pi

At the early stage of the system’s implementation, the YOLOv4 model was executed in the Raspberry Pi board. However, the average time for the Raspberry Pi to recognize the rear-view mirror in the captured image is 394.4 s, as listed in Table 1, which is far greater than the time for this PBSW system to be applicable in real life. Hence, the final PBSW implementation executes the YOLOv4 model in the cloud server as mentioned at step 3 in Section 3.3. This approach achieves an average image classification time of 0.01 s in the real-world evaluation, which is suitable for this application.

4.3.3. Average Image Transmission Rate, Image Processing Time, and Round-Trip Delay

To calculate the average image transmission rate of the Android phone and the average round-trip delay (RTT) between the Android phone and the cloud server in the real-world evaluation, the following steps were executed. When the Android phone was ready to send pairs of images to the cloud server, it recorded the timestamps to send the first and nth pair of images at time t 1 s and t n s , respectively. Hence, the average image transmission rate is defined as n t n s t 1 s fps. To calculate the RTT for the ith pair of images, the Android phone records the timestamp, t i s , to send this pair of images and the timestamp, t i r , when it receives recognition results of this pair from the cloud server. Hence, the average RTT for n pairs of images is defined as i = 1 n t i r t i s n . In the real-world evaluation, when n is 20,000 and the 4G mobile network is stable, the average image transmission rate and the average RTT of this PBSW system are 4 fps and 0.5 s in Table 2, respectively.
The RTT includes the one-way transmission delay for the Android phone to send images to the cloud server, the YOLOv4 image classification and processing time in the cloud server, and the one-way transmission delay for the cloud server to send the results back to the Android phone. The average image classification time of 0.01 sec in the real-world evaluation, as mentioned above. The image processing steps in the cloud server include step 5 in Section 3.3, to match each feature point of the rear-view mirrors with the SURF algorithm, and step 6, to estimate the precise distance between the lens and the rear-view mirror, which required 0.04 ms. Finally, the average one-way transmission delay between the Android phone and the cloud server was 0.245 s. Please note that these RTTs were measured by the Android phone communicating with a cloud server through a stable 4G mobile network. If the 4G signal suffers from significant interferences or is blocked by obstacles, these RTTs may fluctuate significantly.

4.3.4. YOLOv4 Classification Results of the PBSW System

The YOLOv4 training set is 3000 images and the testing set is 450 images in the cloud server. These images are captured by our dual-lens device. True positive (TP), false positive (FP), and false negative (FN) in the confusion matrix is used to judge this trained YOLOv4 model. The YOLOv4 classification results when TP = 392, FP = 24, and FN = 58 are shown in Table 3, where Precision, Recall, and Average Precision (AP) is defined as T P T P + F P , T P T P + F N and R e c a l l × P r e c i s i o n , respectively. Overall, the AP is 92.82% and the F1 score is 0.91 in this real-world evaluation. In terms of these results, this PBSW system can accurately identify the rear-view mirror when the motorcycle moves into the proximity of the bus. Consequently, this PBSW system works well in real life.

4.3.5. The Error Rate of the Estimated Distance

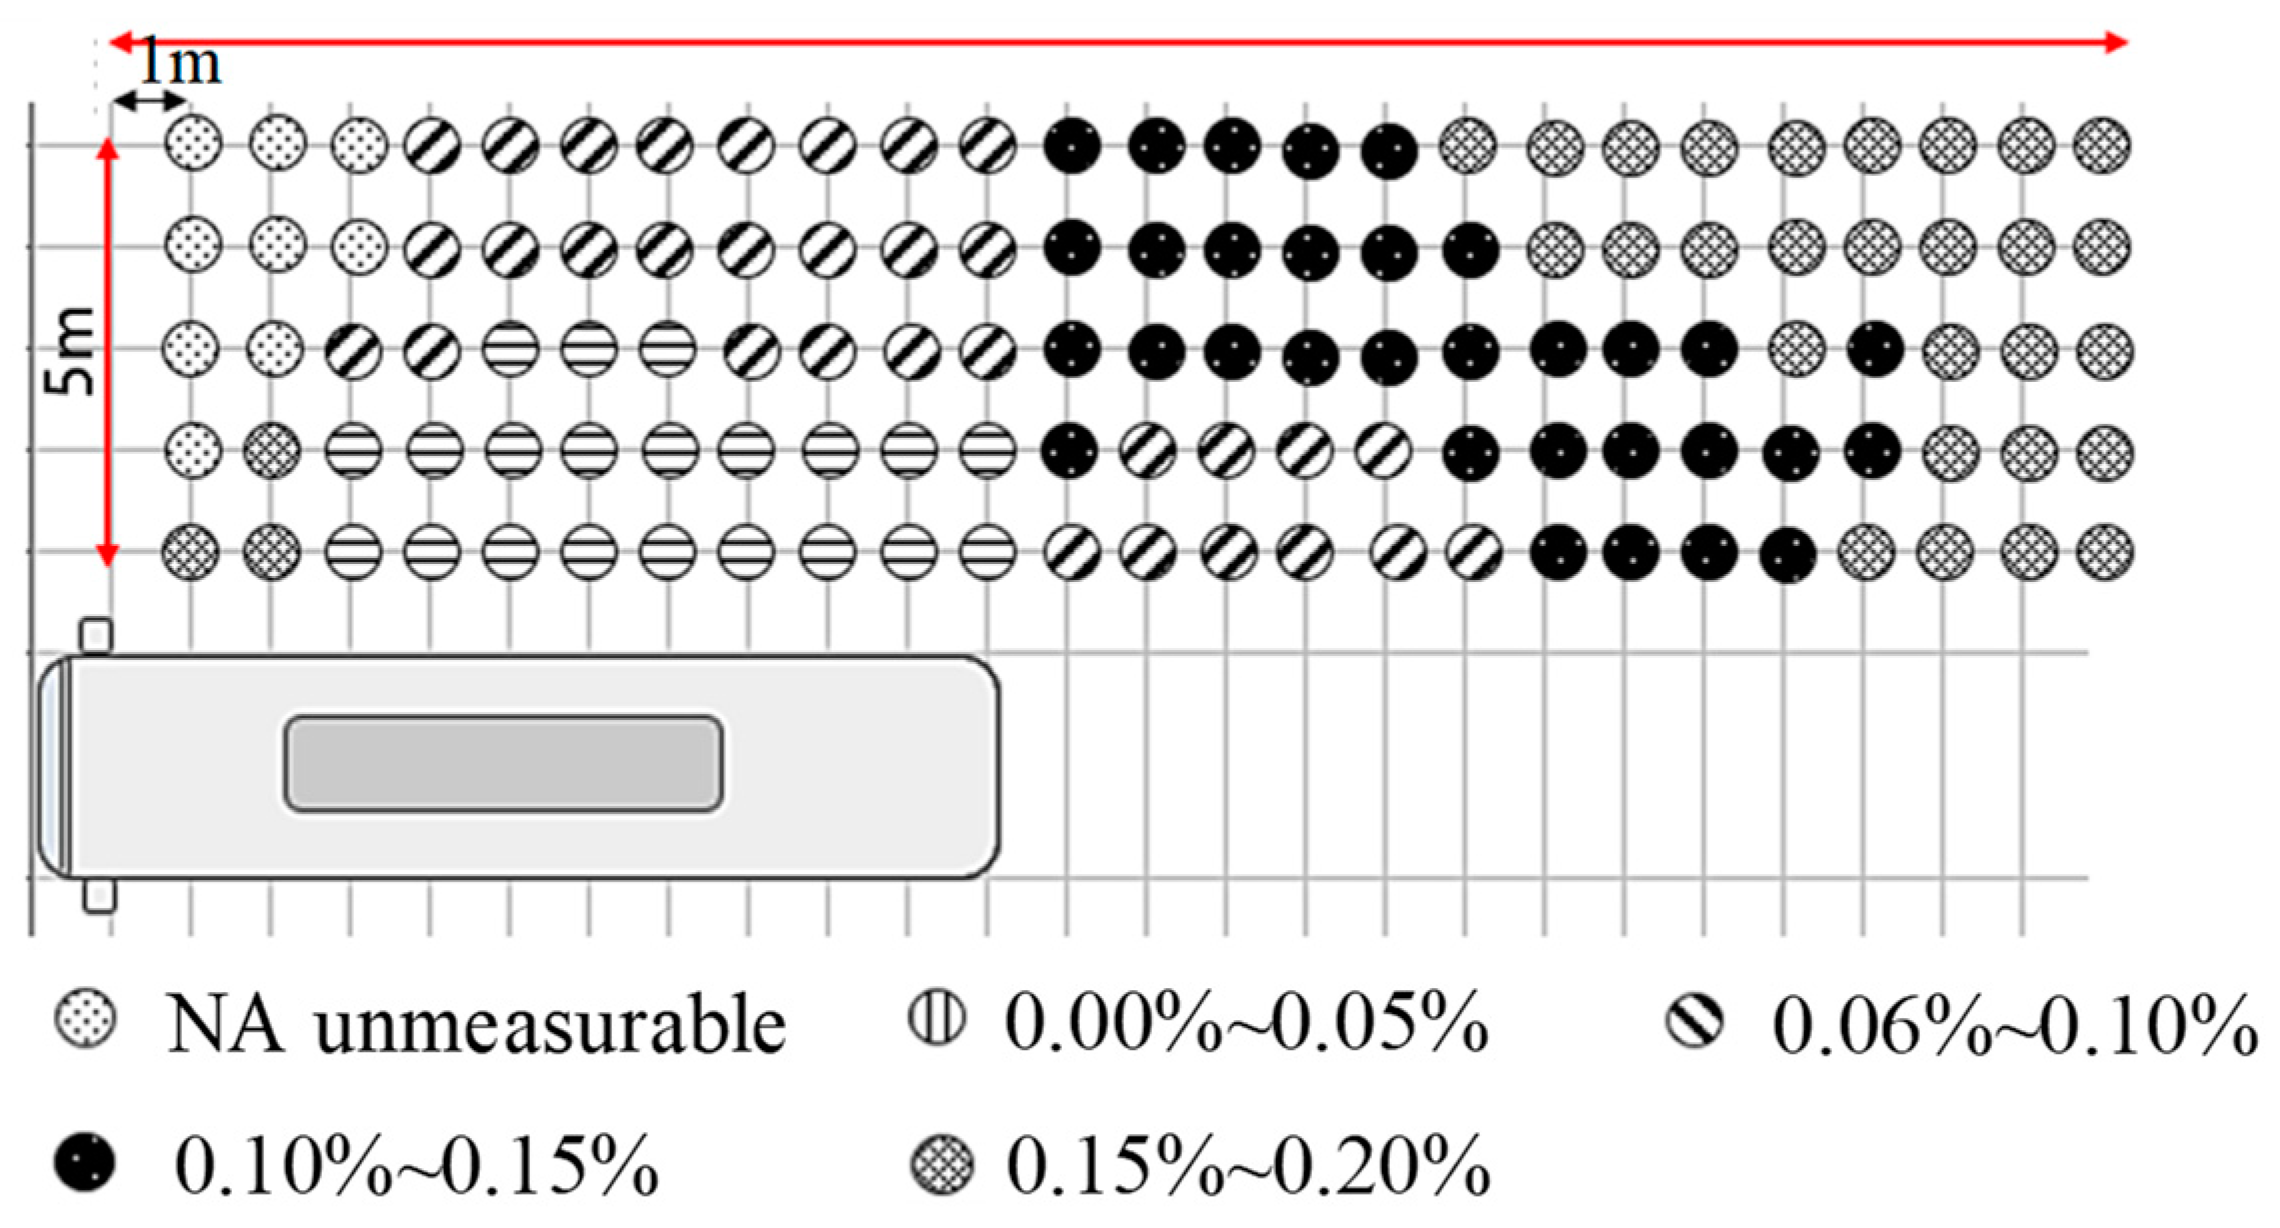
The error rate of the distance estimated by the cloud server in this real-world evaluation is defined as D D D , where D is the estimated straight-line distance between the motorcycle and the rear-view mirror of the bus, and D is the actual distance measured by the BOSCH GLM 40 laser rangefinder. Figure 24 shows the error rate at each location beside the bus in the 5 × 20 m2 area, which is 1 m behind the ocular points of the bus driver. These experimental data show that the proposed distance estimation approach in the PBSW system achieves different error rates for different locations of the motorcycle. The maximum error rate of the dual-lens ranging method used in this PBSW system is 0.20%, which showcases the effectiveness of this lens imaging principle and its ability to deliver accurate distance calculations.

4.3.6. Discussions

In the following section, four issues are addressed to improve this PBSW system in the future.
  • Section 4.3.1 presents the real-world evaluation of the implemented system and results of six performance metrics in our test scenario, demonstrating its profound ability to reduce accidents and significantly enhance motorcycle safety. However, there are many different scenarios on the road; thus, significant time is required to test this system. We will continue working on it to collect data for testing the usability of this PBSW system across different scenarios.
  • Section 4.3.3 discusses the average round-trip delay (RTT) measured between the Android phone and the cloud server in the real-world evaluation. The RTT includes the one-way transmission delay for the Android phone to send images to the cloud server, the YOLOv4 image classification and processing time in the cloud server, and the one-way transmission delay for the cloud server to send the results back to the Android phone. As a result, the average one-way transmission delay between the Android phone and the cloud server is 0.245 s. Please note that these RTTs are measured by the Android phone when it communicates with the cloud server through a stable 4G mobile network. If the 4G signal suffers from significant interferences or blocks by obstacles, these RTTs may fluctuate seriously.
  • This system uses a Raspberry Pi 3B+ board as the main body to connect two USB cameras for obtaining road images with a resolution of 640 × 480 pixels per frame and seven frames per second (fps). The Android phone also creates a connectionless UDP socket to transmit the captured images to the cloud server through the mobile network for training the YOLOv4 model. Due to the load of the Android phone and the fluctuated transmission rate of the 4G mobile network, the average image transmission rate of this PBSW system is further limited to 4 fps, which becomes a performance bottleneck of this system. Hence, the predicted motorcycle location is not continuous, as shown in the video clip recorded in the real-world evaluation. In the future, we will replace the Raspberry Pi 3B+ board with a more efficient one, like the Jetson Nano board [39], to raise the image capture rate, image transmission rate, and image inference speed accordingly.
  • Section 4.3.4 presents the YOLOv4 classification results of the PBSW system. The YOLOv4 classification results, i.e., precision, recall, and average precision (AP) when TP = 392, FP = 24, and FN = 58 are shown in Table 3. Overall, the AP is 92.82% and the F1 score is 0.91 in this real-world evaluation. In terms of these results, this PBSW system, which uses the YOLOv4 model in the cloud server, can accurately identify the rear-view mirror when the motorcycle moves into the proximity of the bus. As mentioned above, if a more efficient image board, instead of Raspberry Pi 3B+, is used on the motorcycle side, it may execute the YOLOv4 or another advanced image recognition model locally to accurately detect the bus’s rear-view mirror while preventing the fluctuated RTTs to transmit images to the cloud server through an unstable 4G mobile network.

5. Conclusions

In order to enable motorcyclists to be notified when entering a bus blind spot, this study proposes a proactive bus blind spot warning system. On the motorcycle side, we set up a Raspberry Pi board with dual cameras to capture pairs of images. These pictures will be transmitted to the Android phone first, and then transmitted to the cloud server through the mobile network. On the cloud server side, we use the YOLOv4 model to identify the position of the bus mirror in the image, match the paired images with the SURF algorithm, synthesize according to the principle of stereo imaging, and, finally, calculate the distance between the motorcycle and the rear-view mirror of the bus. In addition, the server computes the relative angle between the bus and the motorcycle to identify where the inner wheel difference area is. After the Android phone receives the distance and relative angular information returned by the cloud server, the PBSW app displays the relative position of the motorcycle and the bus. When the motorcycle enters the blind spot or the inner wheel gap, the system sends an alarm to the rider and displays the dangerous area of the bus. Based on the real-world performance evaluation of this implemented system, it achieves fast image classification, short round-trip delay, and accurate distance prediction, which allows motorcyclists to stay away from possible dangers instantly.

Author Contributions

Conceptualization, I.-C.C.; methodology, Y.-J.S., W.-R.C., X.-M.K. and P.-H.L.; software, Y.-J.S., W.-R.C., X.-M.K. and P.-H.L.; validation, I.-C.C. and Y.-F.H.; formal analysis, I.-C.C. and C.K.; investigation, C.K.; resources, C.-E.Y.; data curation, Y.-J.S., W.-R.C., X.-M.K. and P.-H.L.; writing—original draft preparation, I.-C.C. and C.K.; writing—review and editing, I.-C.C., C.-E.Y. and Y.-F.H.; visualization, C.K.; supervision, I.-C.C. and Y.-F.H.; project administration, I.-C.C., C.-E.Y. and Y.-F.H.; funding acquisition, Y.-F.H. and I.-C.C. All authors have read and agreed to the published version of the manuscript.

Funding

This research received no external funding.

Data Availability Statement

Not applicable.

Conflicts of Interest

The authors declare no conflict of interest.

References

  1. Ogitsu, T.; Mizoguchi, H. A study on driver training on advanced driver assistance systems by using a driving simulator. In Proceedings of the 2015 International Conference on Connected Vehicles and Expo (ICCVE), Shenzhen, China, 19–23 October 2015. [Google Scholar]
  2. Jean-Claude, K.; de Souza, P.; Gruyer, D. Advanced RADAR sensors modeling for driving assistance systems testing. In Proceedings of the 2016 10th European Conference on Antennas and Propagation (EuCAP), Davos, Switzerland, 10–15 April 2016. [Google Scholar]
  3. Sarala, S.M.; Sharath Yadav, D.H.; Ansari, A. Emotionally adaptive driver voice alert system for advanced driver assistance system (adas) applications. In Proceedings of the 2018 International Conference on Smart Systems and Inventive Technology (ICSSIT), Tirunelveli, India, 13–14 December 2018. [Google Scholar]
  4. Liu, G.; Zhou, M.; Wang, L.; Wang, H.; Guo, X. A blind spot detection and warning system based on millimeter wave radar for driver assistance. Optik 2017, 135, 353–365. [Google Scholar] [CrossRef]
  5. Zhang, R.; Liu, J.; Ma, L. A typical blind spot danger pre-warning method of heavy truck under turning right condition. In Proceedings of the 2015 Sixth International Conference on Intelligent Systems Design and Engineering Applications (ISDEA), Guiyang, China, 18–19 August 2015. [Google Scholar]
  6. Zhou, H.; Shu, W. An early warning system based on motion history image for blind spot of oversize vehicle. In Proceedings of the 2011 International Conference on Electrical and Control Engineering, Yichang, China, 16–18 September 2011. [Google Scholar]
  7. Bochkovskiy, A.; Wang, C.-Y.; Liao, H.-Y.M. YOLOv4: Optimal speed and accuracy of object detection. arXiv 2020, arXiv:2004.10934. [Google Scholar]
  8. Chen, C.; Liu, B.; Wan, S.; Qiao, P.; Pei, Q. An edge traffic flow detection scheme based on deep learning in an intelligent transportation system. IEEE Trans. Intell. Transp. Syst. 2020, 22, 1840–1852. [Google Scholar] [CrossRef]
  9. Liang, S.; Wu, H.; Zhen, L.; Hua, Q.; Garg, S.; Kaddoum, G.; Hassan, M.M.; Yu, K. Edge YOLO: Real-time intelligent object detection system based on edge-cloud cooperation in autonomous vehicles. IEEE Trans. Intell. Transp. Syst. 2022, 23, 25345–25360. [Google Scholar] [CrossRef]
  10. Wang, C.-H.; Huang, K.-Y.; Yao, Y.; Chen, J.-C.; Shuai, H.-H.; Cheng, W.-H. Lightweight deep learning: An overview. IEEE Consum. Electron. Mag. 2022. [Google Scholar] [CrossRef]
  11. Appiah, N.; Bandaru, N. Obstacle detection using stereo vision for self-driving cars. In Proceedings of the IEEE Intelligent Vehicles Symposium (IV), Baden-Baden, Germany, 5–9 June 2011. [Google Scholar]
  12. Adu-Gyamfi, Y.O.; Asare, S.K.; Sharma, A.; Titus, T. Automated vehicle recognition with deep convolutional neural networks. Transp. Res. Rec. 2017, 2645, 113–122. [Google Scholar] [CrossRef] [Green Version]
  13. Wang, H.; Yu, Y.; Cai, Y.; Chen, L.; Chen, X. A vehicle recognition algorithm based on deep transfer learning with a multiple feature subspace distribution. Sensors 2018, 18, 4109. [Google Scholar] [CrossRef] [PubMed] [Green Version]
  14. Bai, T. Analysis on Two-stage Object Detection based on Convolutional Neural Networks. In Proceedings of the 2020 International Conference on Big Data & Artificial Intelligence & Software Engineering (ICBASE), Bangkok, Thailand, 30 October–1 November 2020; pp. 321–325. [Google Scholar]
  15. Zhang, Y.; Li, X.; Wang, F.; Wei, B.; Li, L. A comprehensive review of one-stage networks for object detection. In Proceedings of the 2021 IEEE International Conference on Signal Processing, Communications and Computing (ICSPCC), Xi’an, China, 17–19 August 2021; pp. 1–6. [Google Scholar]
  16. Soviany, P.; Ionescu, R.T. Optimizing the trade-off between single-stage and twostage deep object detectors using image difficulty prediction. In Proceedings of the 2018 20th International Symposium on Symbolic and Numeric Algorithms for Scientific Computing (SYNASC), Timisoara, Romania, 20–23 September 2018; pp. 209–214. [Google Scholar]
  17. Krishna, H.; Jawahar, C. Improving small object detection. In Proceedings of the 2017 4th IAPR Asian Conference on Pattern Recognition (ACPR), Nanjing, China, 26–29 November 2017; pp. 340–345. [Google Scholar]
  18. Jiang, P.; Chen, Y.; Liu, B.; He, D.; Liang, C. Real-time detection of apple leaf diseases using deep learning approach based on improved convolutional neural networks. IEEE Access 2019, 7, 59069–59080. [Google Scholar] [CrossRef]
  19. Laroca, R.; Zanlorensi, L.A.; Gonçalves, G.R.; Todt, E.; Schwartz, W.R.; Menotti, D. An efficient and layout-independent automatic license plate recognition system based on the YOLO detector. arXiv 2019, arXiv:1909.01754. [Google Scholar]
  20. Redmon, A.; Divvala, S.; Girshick, R.; Farhadi, A. You only look once: Unified, realtime object detection. In Proceedings of the IEEE Conference on Computer Vision and Pattern Recognition, Las Vegas, NV, USA, 27–30 June 2016; pp. 779–788. [Google Scholar]
  21. Redmon, J.; Farhadi, A. YOLO9000: Better, faster, stronger. In Proceedings of the IEEE Conference on Computer Vision and Pattern Recognition, Honolulu, HI, USA, 21–26 July 2017; pp. 7263–7271. [Google Scholar]
  22. Redmon, J.; Farhadi, A. Yolov3: An incremental improvement. arXiv 2018, arXiv:1804.02767. [Google Scholar]
  23. Mingxing, T.; Pang, R.; Le, Q.V. Efficientdet: Scalable and efficient object detection. In Proceedings of the IEEE/CVF Conference on Computer Vision and Pattern Recognition, Seattle, WA, USA, 13–19 June 2020. [Google Scholar]
  24. Zhang, Y.; Yuan, B.; Zhang, J.; Li, Z.; Pang, C.; Dong, C. Lightweight PM-YOLO Network Model for Moving Object Recognition on the Distribution Network Side. In Proceedings of the 2022 2nd Asia-Pacific Conference on Communications Technology and Computer Science (ACCTCS), Shenyang, China, 25–27 February 2022; pp. 508–516. [Google Scholar]
  25. Li, Y.; Lv, C. Ss-yolo: An object detection algorithm based on YOLOv3 and shufflenet. In Proceedings of the 2020 IEEE 4th Information Technology, Networking, Electronic and Automation Control Conference (ITNEC), Chongqing, China, 12–14 June 2020; Volume 1, pp. 769–772. [Google Scholar]
  26. Wu, L.; Zhang, L.; Zhou, Q. Printed circuit board quality detection method integrating lightweight network and dual attention mechanism. IEEE Access 2022, 10, 87617–87629. [Google Scholar] [CrossRef]
  27. Wang, Y.; Wang, Y.; Zhao, J. MGA-YOLO: A lightweight one-stage network for apple leaf disease detection. Front. Plant Sci. 2022, 13, 927424. [Google Scholar] [CrossRef] [PubMed]
  28. Zhang, J.; Jin, J.; Ma, Y.; Ren, P. Lightweight object detection algorithm based on YOLOv5 for unmanned surface vehicles. Front. Mar. Sci. 2023, 9, 1058401. [Google Scholar] [CrossRef]
  29. Li, Z.; Pang, C.; Dong, C.; Zeng, X. R-YOLOv5: A Lightweight Rotational Object Detection Algorithm for Real-Time Detection of Vehicles in Dense Scenes. IEEE Access 2023, 11, 61546–61559. [Google Scholar] [CrossRef]
  30. Cui, Y.; Yang, L.; Liu, D. Dynamic proposals for efficient object detection. arXiv 2022, arXiv:2207.05252. [Google Scholar]
  31. Chen, G.; Choi, W.; Yu, X.; Han, T.; Chandraker, M. Learning efficient object detection models with knowledge distillation. In Proceedings of the 31st Conference on Neural Information Processing Systems (NIPS 2017), Long Beach, CA, USA, 4–9 December 2017; pp. 1–10. [Google Scholar]
  32. De Raeve, N.; De Schepper, M.; Verhaevert, J.; Van Torre, P.; Rogier, H. A bluetooth-low-energy-based detection and warning system for vulnerable road users in the blind spot of vehicles. Sensors 2020, 20, 2727. [Google Scholar] [CrossRef] [PubMed]
  33. Blondé, L.; Doyen, D.; Borel, T. 3D stereo rendering challenges and techniques. In Proceedings of the 2010 44th Annual Conference on Information Sciences and Systems (CISS), Princeton, NJ, USA, 17–19 March 2010. [Google Scholar]
  34. Bay, H.; Ess, A.; Tuytelaars, T.; Van Gool, L. Speeded-up robust features (SURF). Comput. Vis. Image Underst. 2008, 110, 346–359. [Google Scholar] [CrossRef]
  35. Regulations, “Installation of Devices for Indirect Vision”, Motor Vehicle Driver Information Service, R46 04-S4, R81 00-S1. Available online: https://www.mvdis.gov.tw/webMvdisLaw/Download.aspx?type=Law&ID=32218 (accessed on 30 July 2023).
  36. Zhang, Q.; Wei, Y.; Wang, K.; Liu, H.; Xu, Y.; Chen, Y. Design of arduino-based in-vehicle warning device for inner wheel difference. In Proceedings of the 2019 IEEE 2nd International Conference on Electronics Technology (ICET), Chengdu, China, 10–13 May 2019. [Google Scholar]
  37. Fu, K.S.; Gonzalez, R.C.; Lee, C.S.G. Robotics: Control, Sensing, Vision, and Intelligence; McGraw-Hill: New York, NY, USA, 1987; pp. 313–328. [Google Scholar]
  38. The Video Clip of the PBSW System. Available online: https://drive.google.com/file/d/1FsX5DZLE6-WQbgcSi7cBlt-BxFbdXyva/view?usp=drive_link (accessed on 20 June 2023).
  39. Jetson Nano Developer Kit for AI and Robotics. Available online: https://www.nvidia.com/en-us/autonomous-machines/embedded-systems/jetson-nano/ (accessed on 20 June 2023).
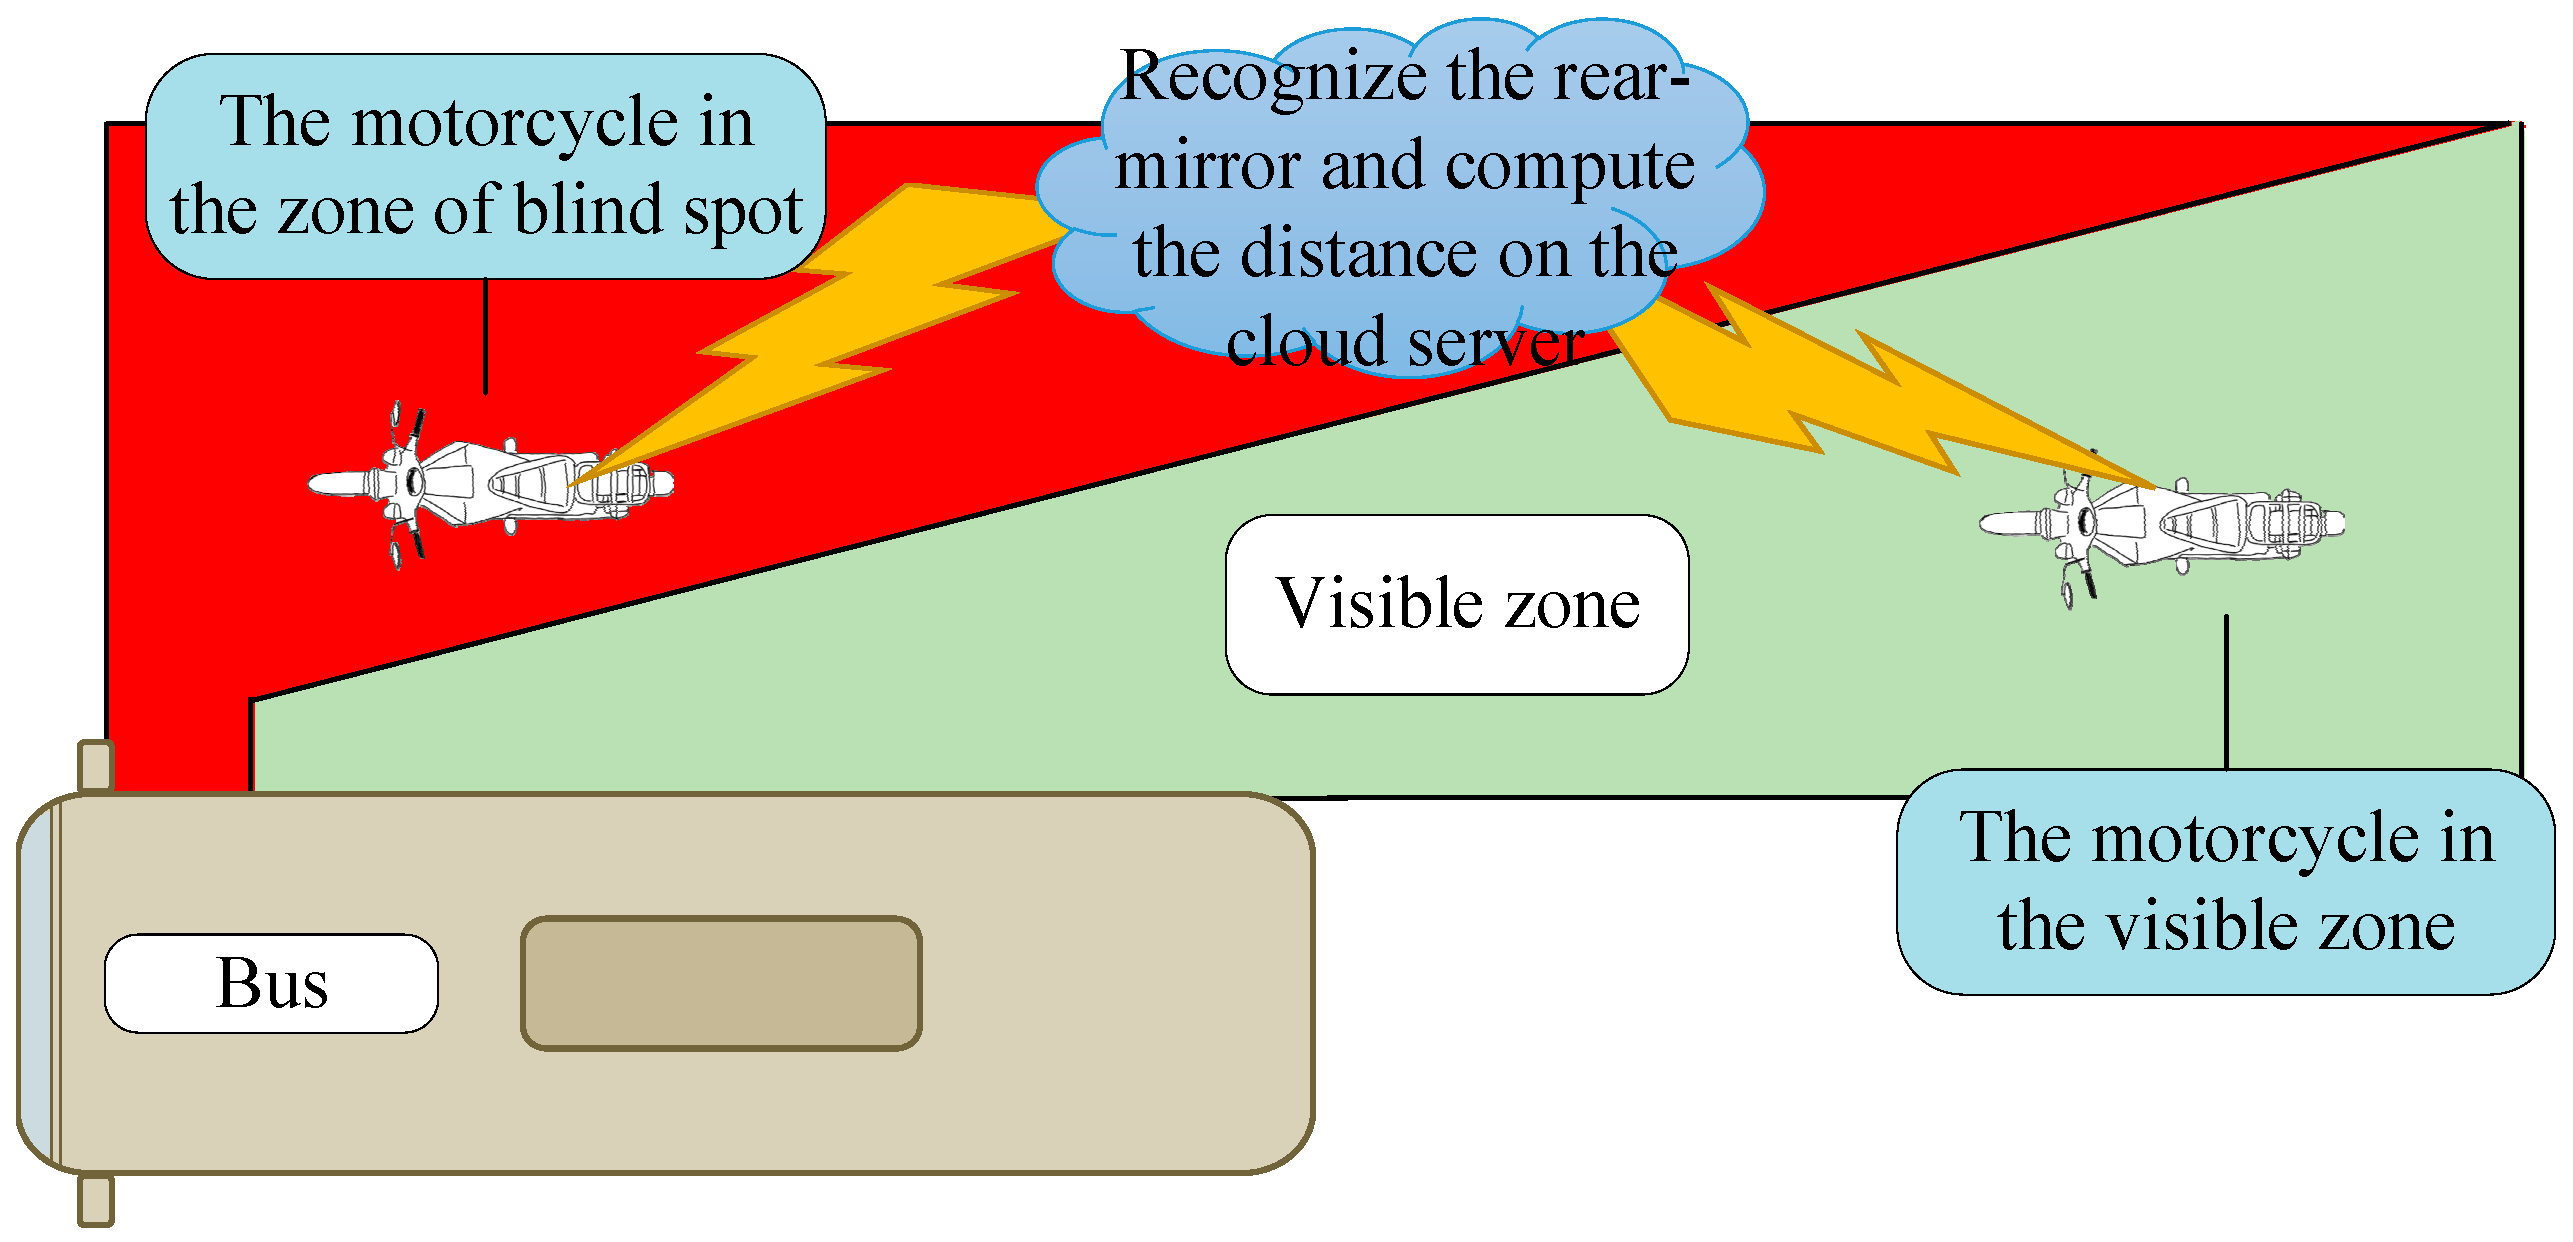
Figure 1. The blind spot, i.e., red zone, and the visible spot, i.e., green zone, of the bus.
Electronics 12 03310 g001
Figure 2. The area of difference of radius between inner wheels of the bus.
Electronics 12 03310 g002
Figure 3. Class II fields of vehicle vision.
Electronics 12 03310 g003
Figure 4. Schematic diagram of the kinematics of the vehicle.
Electronics 12 03310 g004
Figure 5. The architecture of the PBSW system.
Electronics 12 03310 g005
Figure 6. The PBSW preprocessing flow.
Electronics 12 03310 g006
Figure 7. Three-dimensional and two-dimensional relationship.
Electronics 12 03310 g007
Figure 8. Camera calibration process.
Electronics 12 03310 g008
Figure 9. Complete blind spot warning process.
Electronics 12 03310 g009
Figure 10. Cloud server detection and classification target.
Electronics 12 03310 g010
Figure 11. Matching process of SURF feature point.
Electronics 12 03310 g011
Figure 12. Match the feature points of the left and right images.
Electronics 12 03310 g012
Figure 13. Diagram of dual-lens imaging [18].
Electronics 12 03310 g013
Figure 14. Normal vector of bus body surface.
Electronics 12 03310 g014
Figure 15. Relative angle between bus and camera image.
Electronics 12 03310 g015
Figure 17. Layout of two components of the motorcycle. The left one is the dual-lens device and the right one is the Android phone.
Electronics 12 03310 g017
Figure 18. Map mode.
Electronics 12 03310 g018
Figure 19. Warning mode (visible area).
Electronics 12 03310 g019
Figure 20. Warning mode (blind spot).
Electronics 12 03310 g020
Figure 21. Warning mode (inner wheel difference).
Electronics 12 03310 g021
Figure 22. The PBSW map mode snapshot when the motorcycle finds no bus in front.
Electronics 12 03310 g022
Figure 23. (a) The PBSW warning mode snapshot when the motorcycle is behind the bus. (b) The PBSW warning mode snapshot when the motorcycle reaches the rear end of the bus. (c) The PBSW warning mode snapshot when the motorcycle is beside the bus. (d) The PBSW warning mode snapshot when the motorcycle reaches the front end of the bus.
Electronics 12 03310 g023
Figure 24. The error rate of the calculated distance at each location beside the bus in the real-world evaluation.
Electronics 12 03310 g024
Table 1. The average image classification time for the cloud server and Raspberry Pi in the real-world evaluation to recognize the rear-view mirror in an image.
Raspberry PiCloud Server
Average Image Classification Time394.4 s0.01 s
Table 2. The average image processing time in the cloud server, the image transmission rate of the Android phone, and the round-trip delay between the Android phone and the cloud server in the real-world evaluation.
Average Image Processing TimeAverage Image Transmission RateAverage Round-Trip Delay
0.04 ms4 fps0.5 s
Table 3. Classification results of the YOLOV4 model in the real-world evaluation when TP = 392, FP = 24, and FN = 58.
Number of TargetsPrecisionRecallAPF1 Score
Rear-view mirror4500.940.8792.82%0.90
Disclaimer/Publisher’s Note: The statements, opinions and data contained in all publications are solely those of the individual author(s) and contributor(s) and not of MDPI and/or the editor(s). MDPI and/or the editor(s) disclaim responsibility for any injury to people or property resulting from any ideas, methods, instructions or products referred to in the content.