Abstract
Crosstalk is an undesirable factor that degrades the quality of data transmission in printed circuit boards (PCBs). The signal integrity (SI) in multiconductor transmission lines is controlled by using a large number of multiport tests and measurements, which require a lot of time and expensive laboratory equipment. Proposed signal processing methods based on blind identification allow a reduction in the measurement burden. Contrary to the traditional approach requiring knowledge of sampling time offset, input pseudorandom bit sequence (PRBS), and time delay between received data and transmitted PRBS, the proposed alternative method performs blind separation of measured data for the linear fit pulse response (LFPR) procedure. The waveform identification of the partial pulse responses is evaluated for additively mixed cyclostationary sources of the data, intersymbol interference, and crosstalk. A mixed matrix model of composed random vectors is considered. The proposed estimation procedure is based on preprocessing of measured data using principal component analysis (PCA) and following independent component analysis (ICA). It is shown that the proposed component analysis allows diagnostics of signal integrity using eye-diagram patterns and the channel operating margin (COM).
1. Introduction
The technical identification (TI) of digital signals [1] in telecommunication systems is a procedure of data recovery combined with channel identification. TI of wireless communication signals has much in common with signal integrity (SI) compliance testing [2] of the wireline communication links.
The compliance testing is served by laboratory experiments [3] using preferably time-domain measurement equipment [4]. The device under test (DUT) is a PCB that provides the physical medium of signal transmissions between interconnects, chips, or modules of digital high integrated devices. The measurement setup includes PRBS generators, DUT, and multichannel digital oscilloscope with deep memory options [5]. The memory option allows the acquisition of a long-time waveform observed in PCB transmission line.
The measured transient waveform is analyzed using a statistical processing procedure [6]. It starts from clock and data recovery (CDR) followed by de-emphasis of pulse shape if it is necessary. The extensional signal analysis is achieved via synchronous averaging of the waveforms based on the periodic testing PRBSs [2].
The linear fit pulse response [4] is a starting procedure for SI testing. The improvement of CDR error performance via signal equalization is based on the estimated single bit response (SBR) [7,8,9]. SBR is a pulse carrying data symbols in the wireline links with pulse amplitude modulation (PAM). After finishing the SI analysis phase, the SI synthesis phase is started.
The wireline link design is based on the statistical model including near-end crosstalk (NEXT) and far-end crosstalk (FEXT) [10]. The synthesis of equalizers [7,11] and error correction coders [12,13] can be implemented using an optimization procedure. The bit error ratio (BER) can be defined using figures of merits (FoM), including the eye width (EW), total jitter (TJ), eye height (EH), signal-to-noise ratio (SNR), pulse distortions (PD) and, channel operating margin [14,15]. The closed loop of SI design is fulfilled if the targeted BER is achieved.
The discussed signal integrity flow chart is presented in Figure 1. In a narrow sense, the serializer/deserializer (SerDes) puts data bytes for serial high-speed transmission into the wireline links and obtains data bytes by converting transmitted symbols based on received signal decisions. In wide sense SerDes describes everything between the serializer and deserializer using behavioral models given by the closed loop design process. The PCB computer-aided design (CAD) is a workflow with integrated electronic design automation (EDA) program tools that are used for signaling synthesis. The preproduction prototypes or development PCB are used for optimization followed by SI analysis. The successive optimization based on the equalization (CTLE, FFE, and DFE) and forward error correction (FEC) codding gives out from the loop. The SI analysis phase keeps the conversion between the real world and digital world via DUT measurements using a digital oscilloscope. The signal model is an interface for measurement and optimization provided by linear fitting, statistical processing, and the estimation of FoMs.
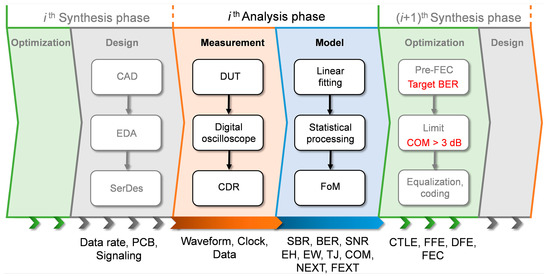
Figure 1.
Signal integrity flowchart.
The discussed processing in the part of signal analysis is the TI of the transmitted electrical waveform based on the time-domain voltage measurements in the transmission lines using digital oscilloscopes.
This paper introduces the extension of the blind identification technique of cyclostationary signals presented in [16]. The bitrate of transmitted data is assumed as known. Contrary to the traditional approach requiring knowledge of sampling time offset, PRBS, and time delay between received data and transmitted PRBS, the proposed alternative method performs blind separation of the measured data for LFPR. The sampling time offset is assumed to be unknown as well as a random bit sequence. The probability distribution of the random data symbol will be discussed and the decision error ratio (DER) will be examined.
The measured data were used to verify the proposed blind processing. The simple single-ended transmission line was used to demonstrate the performance of binary signaling under the worst-case crosstalk [17].
In order to quantify the results of the SI analysis the application of COM is proposed. The COM aggregates several time-domain measurements of the eye diagram like SBR and EH. The targeted BER is used for the EH measurement constraint. The COM has the form similar to the signal-to-noise ratio. The nominator of COM is a SBR at sampling point, given usually by the Mueller–Muller synchronization criterion [18]. The denominator of COM is an eye closure determined relative to the desired pre-FEC BER. The COM evaluation based on the measured data is performed after the identification of the SBR.
The announced identification is a class of the processing algorithms without iterative procedures like LFPR. The programing of this algorithm can be easily implemented by standard matrix operations, including singular value decomposition. The initial analyzed data obtained from the digital oscilloscope can be replaced by simulated data using EDA program tools.
Among the well-known methods of blind statistical data processing, one can note the work [19], in which PCA is considered as a statistical tool, which is suitable for the extraction of dominant features (principal components) from a set of multivariate data. In the work [20], it was noted that in addition to PCA it is possible to determine the linear transformation to make the components as statistically independent as possible using ICA, so the authors proposed to apply an integration of PCA and ICA.
The correlation analysis was implemented via a two-channel virtual experiment [21] using cyclostationary properties of transmitted signals. This procedure involves data matrix rank reduction based on the principal component analysis. Second order statistical processing is finished via standard to coherence coordinate transformation [22], which is also known as principal coordinate analysis (PCoA) [23].
The following high-order statistical analysis is applied for coordinate plane rotation. The algorithm of ICA [24] combines proposed procedures for blind identification of the measured waveform. The mixing matrix corresponds to the partial pulse responses (PPR) [25] of the victim’s signal and aggressor’s signal. The independent components combine data, intersymbol interference (ISI), and crosstalk symbols. The blind separation of the measured mixed cyclostationary waveforms is achieved using the following procedure. First, SBR linear fitting is applied for data matrix using the victim’s signal identification. Second, the residue matrix between the observation and linear model of the victim’s signal is used for the next step of the aggressor’s signal identification. The symbol matrix for identification has a Toeplitz form for decisions based on the independent components.
The COM will be evaluated for measured data before and after separation, as is assumed in the linear model. The dependence of COM on the length of the delay line and bitrate will be examined. The blind separation of victim signal and crosstalk for two coupled transmission lines will be shown. A set of experiments for different values of the delay line length had verified the robustness of the processing procedure for victim signal estimation.
2. The Error Performance of Wireline Communication Link
The bitrate and BER are basic requirements for the communication system. The error performance of the communication system is characterized using the specified BER. BER is defined as follows [26]:
where is a number of erroneous bits and is a total number of transmitted bits during the time interval .
The expected value of BER is a probability of the erroneous decision for the value of the received signal . The cyclostationary signal [27] is characterized by the eyediagram of the synchronous ensemble with a cyclic period :
where is a set of integers.
The error performance of the binary signaling is controlled by a cumulative distribution function (CDF) [14] that depends on eye height (EH) and time offset .
where CDF is calculated using the PDF of the received signal, which is a vertical slice of the eye diagram:
The signal distortions caused by linear time invariant (LTI) transform are characterized in the time domain by the channel impulse response . The intersymbol interference, crosstalk, and noise are main sources of disturbances for the received signal.
The channel operating margin is a generalized figure of merit for the wireline links [28,29,30] combing the targeted BER, bitrate, and signal integrity design. COM is evaluated as follows:
where is a signal level that is a single bit response (SBR) for time offset .
where is a disturbance level due to the ISI, crosstalk, and noise that is a vertical eye closure defined with respect to the specified BER:
Eye height is evaluated using the inverse function of CDF for the targeted BER:
The timing offset is given by the Mueller–Muller synchronization criterion:
COM can be rewritten by substituting the SBR and BER as follows:
An example of COM evaluation is shown in Figure 2. The current COM is 5.5 dB for testing bitrate Gbit/s and targeted .
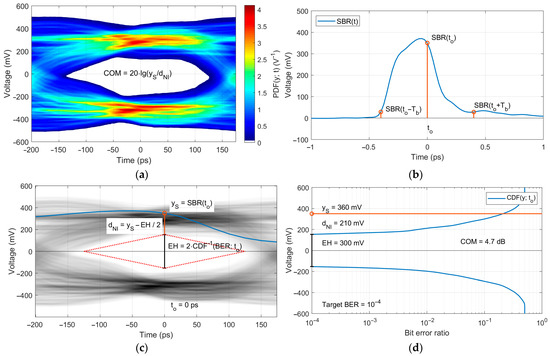
Figure 2.
An example of COM evaluation: (a) Eye diagram of the measured signal; (b) Single bit response; (c) Single contour of the BER diagram; (d) BER bathtub curve. Bitrate Gbit/s.
An optimization of the signal integrity design in accordance with COM maximization is proposed. The threshold value of the COM, which is usually 3 dB, is used for testing of the signal integrity.
In order to estimate COM, the factorization of the channel transfer function is applied. The received signal is decomposed into the data signal, interference, crosstalk, and noise. The linear and decision feedback equalization performance is taken into account. The crosstalk cancelation is modeled. In practice, the decades of the measured factors and terms are used for statistical signal processing.
The proposed approach in this work is based on the signal separation. The random independent sources of signals are assumed. This approach will be demonstrated by using the processing of experimental results.
3. Correlation Analysis of Measured Signal
The measurement of the signal in the transmission line is provided by a digital oscilloscope with a sampling time interval . The th element of the real-valued observation matrix of the measured waveform is obtained via the periodic averaging of discrete timeseries as follows:
where is a number of averages, is a period of PRBS, is a cyclic period of the cyclostationary signal , is a set of the real numbers, and its superscript represents the size of matrix .
The concept of the virtual two-channel experiment is assumed. The linear modulation by symbols in is proposed for pulses collected in the corrupted by additive noise :
The symbol estimation with an error is given by the linear transform of the measured data using filter :
The two-channel experiment forms observation for the synchronous symbols and measurements :
The correlation matrix estimation of observation is given by
where and are corresponding estimates of the correlation matrices.
The optimum linear filter estimation is written as follows:
which corresponds to the error covariance matrix
The low-rank matrix inversion problem is solved in practice using the singular value decomposition (SVD). SVD of the observation matrix is evaluated as follows:
where is a diagonal matrix of the singular values that are arranging in the descending order
are matrices of the left and the right eigenvectors. respectively.
The reduced rank () approximation [31] of the observation matrix corresponds to the first principal components :
where
are submatrices of and respectively.
The More–Penrose pseudoinversion is calculated as follows:
In many practical cases the number of outputs is more than the number of inputs for the data matrix model. This yields the overdetermined problem. The redundant measured data are provided by a high sampling rate comparing with bitrate. The first step of the statistical signal processing [32,33] is the PCA dimension reduction.
Eye diagrams of the measured victim’s and aggressor’s signals and the scatter diagrams of the corresponding coherence coordinates are shown in Figure 3. The optimum filter output (color contours) is compared with normalized coherence coordinates (gray contours) in the coherence coordinate plane.
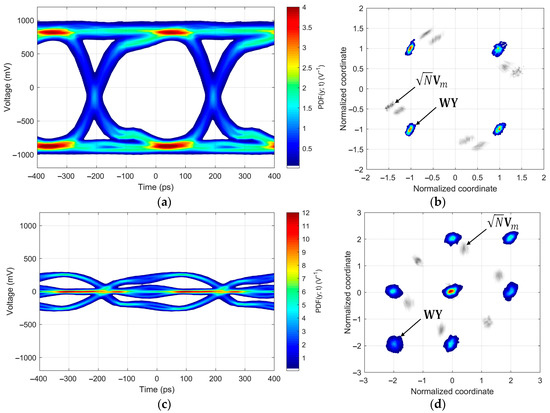
Figure 3.
Eye diagrams and scatter diagrams: (a) Eye diagram of the measured victim’s signal. (b) Victim’s coherence coordinate plane. (c) Eye diagram of the measured aggressor’s signal. (d) Aggressor’s coherence coordinate plane.
The pulse response identification has the form similar to (16) and can be obtained by the replacing with and contra versa:
The estimation of the noise covariance matrix is given by
The problems of the blind identification and blind signal separation are related to the correlation analysis discussed above. As was assumed earlier, the knowledge of transmitted symbols and pulse shape is not available. This leads to the unresolved problem. The independent component analysis is applied for its solution.
4. Independent Component Analysis of Measured Signal
The ICA starts from a preprocessing procedure involving centering and whitening the input data. The measured signal can be written in the matrix form using the following expression:
where
is a matrix of independent components, is the th observation vector of the symbols associated with one of the signal sources, is a number of independent components,
is a mixing matrix, and is the th partial pulse response associated with the corresponding signal source.
The blind processing algorithm for the estimation of the mixing matrix consists of two steps. The first step is a second-order blind identification (SOBI) and the next step is a fourth-order blind identification (FOBI).
The SOBI is often based on the principal component analysis (PCA). The estimation of the principal components is given by the singular value decomposition (SVD) already discussed above.
The introduced processing is used for the coordinate transform and based on the principal coordinate analysis (PCoA). The standard coordinates associated with components of the th observation vector are projected into the coherence coordinates of the th vector :
The obtained coordinates are normalized and uncorrelated. This procedure is known as whitening.
The column-wise quadratic transform follows after the coordinate transformation:
The th column vector of the matrix is given by a Kronecker product of the columns of the coherence coordinate matrix :
This transform yields the data matrix for the statistical estimation of the quadricovariance matrix. The FOBI procedure is based on the quadricovariance matrix eigenvalue decomposition (EVD). In the discussed approach the eigenvectors of the quadricovariance matrix are used to rotate the coherence coordinates in the direction of the minimum of the mutual information.
In order to estimate eigenvectors of the quadricovariance matrix, SVD is obtained after sample mean compensation:
where
is a sample mean vector, is a vector of the ones, is a diagonal matrix of the singular values which are arranging in the increasing order , and
are matrices of the left and the right eigenvectors respectively.
The value of the first significant singular value corresponds to the threshold which is a thousand magnitudes of the floating point error .
The subspace of the left eigenvectors and is used to form the fourth-order cumulant eigenmatrices and . The th eigenvector corresponds to the vectorization of the th eigenmatrix of the fourth-order tensor with rank :
The th eigenmatrix of the fourth order tensor is a unit rank square matrix. EVD with unit eigenvalue of the th eigenmatrix is written as follows:
The processing is finalized via the identification of the mixing matrix using following expression:
where the rotation matrix is defined as
The least-square estimations of unknown independent components are given by
The independent components that are associated with random data symbols, intersymbol interference, and crosstalk are shown in Figure 4.
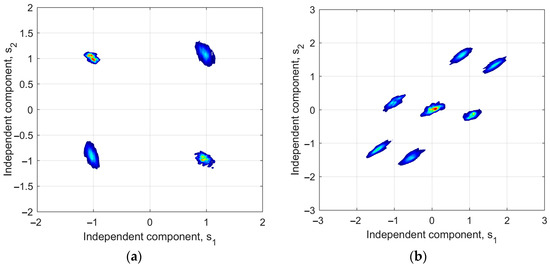
Figure 4.
Independent components: (a) Victim’s signal. (b) Aggressor’s signal.
5. Single Bit Response Estimation
The decisions on the binary data symbols are evaluated using the simple slicing of the first independent component with threshold :
The decisions on the ternary symbols are evaluated using the double-level slicing second independent component with thresholds :
The bathtub curves for the decision-error ratio of binary victim’s symbols and ternary aggressor’s symbols are presented in Figure 5.

Figure 5.
Bathtub curves: (a) Binary decision error ratio. (b) Ternary decision error ratio.
The matrix is used for the single bit response estimation and obtained for shifts of delay via symbols in :
where is a cyclic permutation matrix.
The estimated samples of are contained in the first columns of matrix which is given by solution (25):
The last th column of the evaluated matrix contains the sample mean of matrix observation .
6. Signal Separation
The binary signal transmitted through the microstrip line is formed using two-level pulse amplitude modulation [34]. The period or signaling interval of the pulse sequence is the inverse of the bitrate. The two parallel transmission lines are supposed for double link communication. The signal integrity is tested by measuring the signal in two transmission lines. The observed signal in the transmission line is assumed to be an additive mixture of transmitted signal, interferences, and noise [35,36].
The simplest crosstalk model can be obtained in agreement with (12) for double link and is written as follows:
where is a matrix containing, in accordance with (44), the samples of th SBR in the th link induced by the transmission of data , and is a residue signal in the th link.
The photo of the measurement setup is shown in Figure 6a. Two identical PCBs are used to simulate the crosstalk induced in the victim’s microstrip line. The binary PRBS with lengths equal to (210−1) bits was generated using the Anritsu pulse pattern generator MP1604B. The bitrate was chosen as 2500 Mbit/s and the values of bit levels are equal to ±1 V.
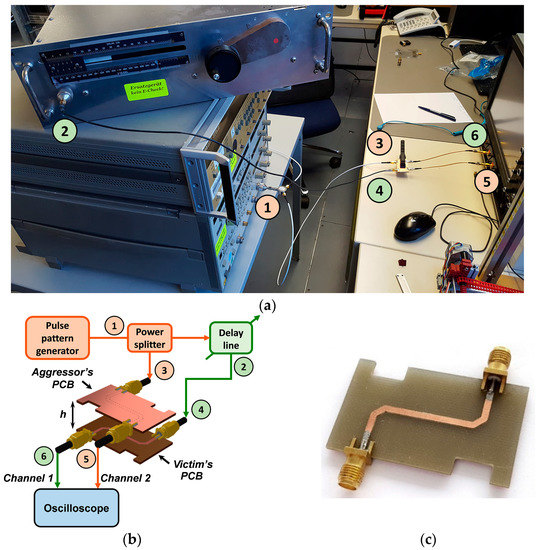
Figure 6.
(a) Photo of the measurement setup; (b) Wiring diagram of the measurement setup; (c) Photo of the printed circuit board with a microstrip line of zigzag configuration. (1) an entrance of power splitter; (2) an exit of delay line; (3) an entrance of aggressor’s PCB; (4) an entrance of victim’s PCB; (5) an exit of aggressor’s PCB; (6) an exit of victim’s PCB.
The wiring diagram of the experimental equipment is presented in Figure 6b. The photo of the printed circuit board with a microstrip line of zigzag configuration is shown in Figure 6c. Microstrip lines were fabricated by using a 1.6 mm thick FR4 substrate with a characteristic impedance of 50 Ω with the length of 50 mm and the width of 1.85 mm.
The first victim’s link is labeled using numbers 1, 2, 4, and 6 on the photo of the measurement setup (Figure 6a) and wiring diagram (Figure 6b). The victim’s PCB is located above the aggressor’s PCB at the height . The second aggressor’s link is labeled using numbers 1, 3, and 5 in Figure 6a,b.
The victim’s signal was passed through the delay line to the corresponding PCB and measured in channel 1 of serial data analyzer LeCroy SDA 813Zi-A. The aggressor’s signal was passed through the transmission line of aggressor’s PCB and measured synchronously in channel 2 of the serial data analyzer.
The characteristics of the measurement equipment are presented in Table 1.

Table 1.
Characteristics of the measurement equipment.
According to the described ICA procedure, the victim’s and aggressor’s SBRs were estimated. The obtained SBRs for two channel measurement are shown in Figure 7. The weak victim’s SBR (blue line) due to the attenuation in the delay line and strong crosstalk pulse response (red line) are shown in Figure 7a. Channel 1 is characterized by the worst case of disturbance due to the crosstalk. In the opposite case, which is shown in Figure 7b for channel 2, the aggressor’s SBR (red line) is strong and the crosstalk response (blue line) is weak. The estimated COMs are about 5 dB in channel 1 and 10 dB in channel 2.

Figure 7.
SBRs for two channel measurement: (a) SBRs for the first channel with strong crosstalk and weak victim’s signal. (b) SBRs for the second channel with weak crosstalk and strong aggressor’s signal.
The eye diagrams of the separated signals in two channels are shown in Figure 8 and Figure 9. The eye diagrams of the victim’s signal and crosstalk are compared with eye diagrams of the measured and residue signals. The timing offset is referred to the victim’s signal of the first channel while the relative actual timing offsets for other signals are subordinated.


Figure 8.
Eye diagrams for the first channel: (a) Measured signal . (b) Victim’s signal . (c) Crosstalk . (d) Residue signal .
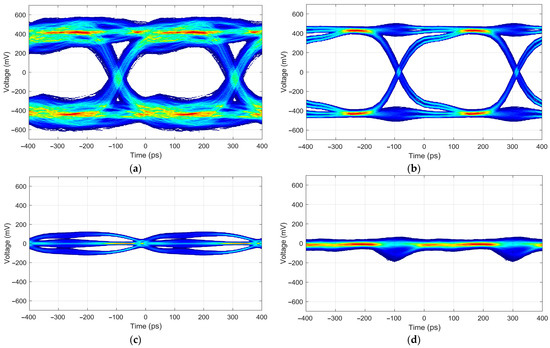
Figure 9.
Eye diagrams for the second channel: (a) Measured signal . (b) Aggressor’s signal . (c) Crosstalk . (d) Residue signal .
The time offset dependence of the linear fitting model demonstrates cyclic time shifts of SBRs. Victim’s and aggressor’s SBRs with corresponding crosstalk responses are shown in Figure 10. The cyclic shifts are synchronous for the corresponding SBR and crosstalk response . The time offset invariance of the SBR shape validates the approach based on ICA.
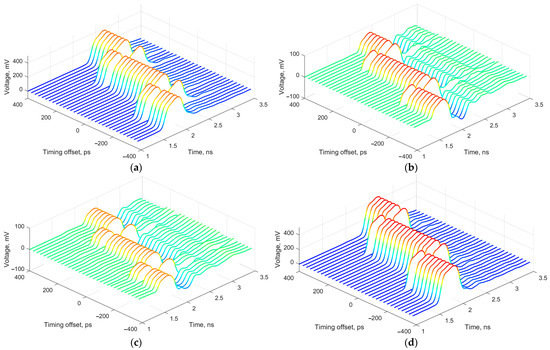
Figure 10.
(a) Single bit response () and (b) crosstalk response () evaluated in the first link for different time offsets. (c) Crosstalk response () and (d) single bit response () evaluated in the second link for different time offsets.
To demonstrate the dependence of COM due to different lengths in the delay line, two-channel measurements were processed using ICA. The COM for lengths of the delay line from 0 cm to 12 cm are shown in Figure 11.

Figure 11.
Channel operating margin for different lengths of the delay line in the first channel (a) and in the second channel (b).
The curve with crosstalk (blue line) indicates smaller COM values than the curve without crosstalk (red line) for all lengths of the delay line. The minimum value of COM corresponds to the first channel with low level signal and high-level crosstalk. The maximum value of COM corresponds to the second channel with high level signal and low-level crosstalk. The COM curves for the signals with crosstalk exhibit the variations that do not exist for the victim’s signals in both channels. The delays corresponding to maximums of COM for signals with crosstalk differ for investigated channels.
Statistical signal processing was implemented for eight different bitrates from 0.4 Gbps to 2.5 Gbps:
- Whitening using SVD;
- EVD of quadricovariance;
- Linear fitting;
- COM calculation for the BER level 10−4.
SBRs and COMs for bitrates from 0.4 Gbit/s to 2.5 Gbit/s are shown in Figure 12 and Figure 13, correspondingly.
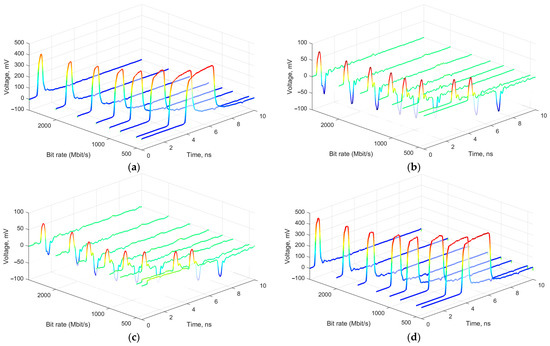
Figure 12.
Single bit response () (a) and crosstalk response () (b) evaluated in the first link for different bitrates. Crosstalk response () (c) and single bit response () (d) evaluated in the second link for different bitrates.

Figure 13.
COM for different bitrates in first channel (a) and second channel (b).
The duration of almost unipolar pulses which are shown in Figure 12a,d, defined between the rising edge and the falling edge of the pulse, decreases as the bitrate increases from 2.5 ns to 0.4 ns. Figure 12b,c show that the bipolar pulses have a shape that approximates the derivative of the unipolar pulses. The positive and negative impulse spikes of the bipolar pulses are observed separately and have a constant duration in Figure 12c,d. Positive and negative impulse spikes are overlapped at the highest bitrate of 2500 Mbps.
The energy of pulses in Figure 12a,d is proportional to their duration and, therefore, depends on the bitrate. The energy of the bipolar pulses is weakly dependent on the bitrate since their energy is defined by the sum of the rising and falling spike’s energies. Consequently, increases in the bitrate lead to decreases in the ratio between the pulse energy and crosstalk energy.
These conclusions are confirmed by Figure 13 representing the decreasing dependences of COM both for the measured signals with and without crosstalk after blind separation. But, COM after blind separation is higher than initial COM for all bitrates. The decreasing character of COM can be explained by the growing influence of intersymbol interference.
7. Conclusions
The error performance analysis of wireline links based on the COM is introduced. The communication link requirements are the bitrate and targeted BER. The value of the SBR at the sampling time offset and inverse CDF for targeted BER gives COM.
The two-channel virtual experiment was examined using correlation analysis. The observation matrix is obtained for the synchronized data symbols and measured signal. The block form of the correlation matrix was used for the linear estimations of data symbols and pulse shape by the solution of the corresponding inverse problems. The joint distributions of the data symbols and ISI were analyzed for the victim’s signal and aggressor’s signal in the coherence coordinate plane, where coordinates of the victim’s signal correspond to the corners of the unit square. The coordinates of the aggressor’s signal are vertex of two unit squares shifted by half along the square diagonal.
The blind identification of the measured waveform was implemented using the ICA algorithm. The estimated independent components were used for making the decisions on the binary data symbols evaluated via the simple slicing of the first independent component symbol. The decision error ratio is analyzed for measurements of the victim’s signal and aggressor’s signal. The decision error ratio demonstrates the error performance for binary and ternary symbol recovery based on the independent components.
The identification problem was introduced for two-channel measurement. The signal separation was analyzed using measured mixed cyclostationary sources of the data, intersymbol interference, and crosstalk waveforms obtained using laboratory experiments. The SBRs of victim’s signals and aggressor’s signals were demonstrated by applying the ICA. The timing-shift invariance of the pulse shapes confirms the algorithm robustness. The separated signals were presented with residue signals using time-domain eye diagrams.
The joint observation for COMs in two channels demonstrates the nontrivial optimization problem for the delay between channel signals in the double-link schemes. The maximums of COMs with crosstalk were obtained for different delay lengths. The importance of crosstalk cancelation was verified via COMs without crosstalk.
The degradation of the SI due to the ISI and crosstalk were verified using presented COM versus bitrate. The worst-case crosstalk victim’s disturbance was obtained for highest bitrate. The worst-case COM was very near to the commonly used 3 dB threshold. It is shown that the proposed component analysis allows diagnostic of signal integrity using eye-diagram patterns and the channel operating margin. The proposed methodology presents an alternative method performing the blind separation of the measured data for the linear fit pulse response (LFPR) procedure.
Author Contributions
Conceptualization, Y.V.K., A.B.B. and M.A.K.; writing—original draft preparation, M.A.K.; writing—review and editing, Y.V.K., A.B.B. and A.A.G.; supervision, Y.V.K. All authors have read and agreed to the published version of the manuscript.
Funding
This research received no external funding.
Data Availability Statement
The data presented in this study are available on request from the corresponding author.
Acknowledgments
The authors would like to thank Johannes Russer and Michael Hider for the organization and fruitful support of the experimental investigations in the laboratory of the Munich Technical University and Peter Russer for substantial discussions of the theoretical results.
Conflicts of Interest
The authors declare no conflict of interest.
References
- Recommendation ITU-R SM.1600-3; Technical Identification of Digital Signals. International Telecommunication Union: Geneva, Switzerland, 2017. Available online: https://www.itu.int/rec/R-REC-SM.1600-3-201709-I/en (accessed on 1 June 2023).
- Pupalaikis, P.J. S-Parameters for Signal Integrity; Cambridge University Press: Cambridge, UK, 2020. [Google Scholar]
- Ravelo, B.; Xu, Z. Tensorial Analysis of Networks (TAN) Modelling for PCB Signal Integrity and EMC Analysis; Institution of Engineering and Technology: Stevenage, UK, 2020. [Google Scholar]
- End-to-End High-Speed Digital Design. Available online: https://www.signalintegrityjournal.com/articles/3104-end-to-end-high-speed-digital-design (accessed on 10 June 2023).
- Herres, D. Oscilloscopes: A Manual for Students, Engineers, and Scientists; Springer International Publishing: Berlin/Heidelberg, Germany, 2020. [Google Scholar]
- Edlund, G. Timing Analysis and Simulation for Signal Integrity Engineers; Pearson Education: London, UK, 2007. [Google Scholar]
- Hall, S.H.; Heck, H.L. Advanced Signal Integrity for High-Speed Digital Designs; Wiley: Weinheim, Germany, 2011. [Google Scholar]
- Oh, K.S.; Yuan, X.C. High-Speed Signaling: Jitter Modeling, Analysis, and Budgeting; Pearson Education: New York, NY, USA, 2011. [Google Scholar]
- Common Electrical Interface Implementation Agreement OIF-CEI-5.0. Available online: https://www.oiforum.com/wp-content/uploads/OIF-CEI-5.0.pdf (accessed on 1 June 2023).
- Bogatin, E. Signal and Power Integrity—Simplified; Pearson Education: London, UK, 2017. [Google Scholar]
- Kim, J.; Chen, E.-H.; Ren, J.; Leibowitz, B.S.; Satarzadeh, P.; Zerbe, J.L.; Yang, C.-K.K. Equalizer Design and Performance Trade-Offs in ADC-Based Serial Links. IEEE Trans. Circuits Syst. I Regul. Pap. 2011, 58, 2096–2107. [Google Scholar] [CrossRef]
- Yang, M.; Shahramian, S.; Shakiba, H.; Wong, H.; Krotnev, P.; Carusone, A.C. Statistical BER Analysis of Wireline Links With Non-Binary Linear Block Codes Subject to DFE Error Propagation. IEEE Trans. Circuits Syst. I Regul. Pap. 2020, 67, 284–297. [Google Scholar] [CrossRef]
- Yang, M.; Shahramian, S.; Wong, H.; Krotnev, P.; Carusone, A.C. Pre-FEC and Post-FEC BER as Criteria for Optimizing Wireline Transceivers. In Proceedings of the 2021 IEEE International Symposium on Circuits and Systems (ISCAS), Daegu, Republic of Korea, 22–28 May 2021; pp. 1–5. [Google Scholar] [CrossRef]
- Mellitz, R.; Ran, A.; Li, M.P.; Ragavassamy, V. Channel Operating Margin (COM): Evolution of Channel Specifications for 25 Gbps and Beyond. In Proceedings of the DesignCon 2013, Santa Clara, CA, USA, 28–31 January 2013. [Google Scholar]
- Pu, B.; He, J.; Harmon, A.; Guo, Y.; Liu, Y.; Cai, Q. Signal Integrity Design Methodology for Package in Co-packaged Optics Based on Figure of Merit as Channel Operating Margin. In Proceedings of the 2021 IEEE International Joint EMC/SI/PI and EMC Europe Symposium, Raleigh, NC, USA, 26 July–13 August 2021; pp. 492–497. [Google Scholar] [CrossRef]
- Kuznetsov, Y.V.; Baev, A.B.; Konovalyuk, M.A.; Gorbunova, A.A.; Russer, J.A. Independent Component Analysis of the Cyclostationary Signals in the Transmission Line. In Proceedings of the 2022 International Symposium on Electromagnetic Compatibility—EMC Europe, Gothenburg, Sweden, 5–8 September 2022; pp. 96–101. [Google Scholar] [CrossRef]
- Kuznetsov, Y.V.; Baev, A.B.; Konovalyuk, M.A.; Gorbunova, A.A. Cyclostationary Crosstalk Cancelation in High-Speed Transmission Lines. Appl. Sci. 2021, 11, 7988. [Google Scholar] [CrossRef]
- Meyr, H.; Moeneclaey, M.; Fechtel, S.A. Digital Communication Receivers: Synchronization, Channel Estimation, and Signal Processing; Wiley: Chichester, UK, 1998. [Google Scholar]
- Sophian, A.; Tian, G.Y.; Taylor, D.; Rudlin, J. A feature extraction technique based on principal component analysis for pulsed Eddy current NDT. NDT & E Int. 2003, 36, 37–41. [Google Scholar] [CrossRef]
- Cheng, L.; Gao, B.; Tian, G.Y.; Woo, W.L.; Berthiau, G. Impact Damage Detection and Identification Using Eddy Current Pulsed Thermography Through Integration of PCA and ICA. IEEE Sens. J. 2014, 14, 1655–1663. [Google Scholar] [CrossRef]
- Schreier, P.; Scharf, L. Statistical Signal Processing of Complex-Valued Data: The Theory of Improper and Noncircular Signals; Cambridge University Press: Cambridge, UK, 2010. [Google Scholar]
- Scharf, L.; Thomas, J.K. Wiener filters in canonical coordinates for transform coding, filtering, and quantizing. IEEE Trans. Signal Process. 1998, 46, 647–654. [Google Scholar] [CrossRef]
- Anderson, M.J.; Willis, T.J. Canonical Analysis of Principal Coordinates: A Useful Method of Constrained Ordination for Ecology. Ecology 2003, 84, 511–525. [Google Scholar] [CrossRef]
- Cardoso, J.-F. Source separation using higher order moments. In Proceedings of the International Conference on Acoustics, Speech, and Signal Processing, Glasgow, UK, 23–26 May 1989; Volume 4, pp. 2109–2112. [Google Scholar] [CrossRef]
- Gelgor, A.; Gelgor, T. New Pulse Shapes for Partial Response Signaling to Outperform Faster-than-Nyquist Signaling. In Proceedings of the 2019 IEEE International Conference on Electrical Engineering and Photonics (EExPolytech), St. Petersburg, Russia, 17–18 October 2019; pp. 144–148. [Google Scholar] [CrossRef]
- Recommendation ITU-R E.800; Definitions of Terms Related to Quality of Service. International Telecommunication Union: Geneva, Switzerland, 2008. Available online: https://www.itu.int/rec/T-REC-E.800-200809-I/en (accessed on 1 June 2023).
- Gardner, W.A. Cyclostationarity in Communication and Signal Processing; IEEE Press: New York, NY, USA, 1994. [Google Scholar]
- Dovale, L.; Roa, E. Channel Operating Margin as Transceiver Architecture Design Tool. In Proceedings of the 2021 IEEE International Symposium on Circuits and Systems (ISCAS), Daegu, Republic of Korea, 22–28 May 2021; pp. 1–5. [Google Scholar] [CrossRef]
- Measuring Channel Operating Margin. In Proceedings of the Richard Mellitz, Intel Corporation March 2016 IEEE Plenary, Macau, China, 14–17 March 2016.
- IEEE Std. 802.3bj-2014 (Amendment to IEEE Std. 802.3-2012); Annex 93A.1 Channel Operating Margin. IEEE: Piscataway, NJ, USA, 2014.
- Scharf, L.; Tufts, D. Rank reduction for modeling stationary signals. IEEE Trans. Acoust. Speech Signal Process. 1987, 35, 350–355. [Google Scholar] [CrossRef]
- Hyvärinen, A.; Karhunen, J.; Oja, E. Independent Component Analysis; Wiley Interscience: London, UK, 2001; ISBN 978-0-471-40540-5. [Google Scholar]
- Nadal, J.P.; Korutcheva, E.; Aires, F. Blind source processing in the presence of weak sources. Neural Netw. 2000, 13, 589–596. [Google Scholar] [CrossRef] [PubMed]
- Kuznetsov, Y.V.; Baev, A.B.; Konovalyuk, M.A.; Gorbunova, A.A.; Russer, J.A. Bit Error Rate Estimation Based on the Probabilistic Model of the Crosstalk Voltage. In Proceedings of the 2020 International Symposium on Electromagnetic Compatibility—EMC EUROPE, Rome, Italy, 23–25 September 2020; pp. 1–6. [Google Scholar] [CrossRef]
- Kuznetsov, Y.; Baev, A.; Konovalyuk, M.; Gorbunova, A.; Russer, J.A.; Haider, M.; Russer, P. Cyclostationary Characterization of the Interference Induced by Crosstalk Between Transmission Lines. In Proceedings of the 2019 International Symposium on Electromagnetic Compatibility—EMC EUROPE, Barcelona, Spain, 2–6 September 2019; pp. 574–579. [Google Scholar]
- Kuznetsov, Y.; Baev, A.; Konovalyuk, M.; Gorbunova, A.; Russer, J.A. Autocorrelation Analysis and Near-Field Localization of the Radiating Sources with Cyclostationary Properties. IEEE Trans. Electromagn. Compat. 2020, 62, 2186–2195. [Google Scholar] [CrossRef]
Disclaimer/Publisher’s Note: The statements, opinions and data contained in all publications are solely those of the individual author(s) and contributor(s) and not of MDPI and/or the editor(s). MDPI and/or the editor(s) disclaim responsibility for any injury to people or property resulting from any ideas, methods, instructions or products referred to in the content. |
© 2023 by the authors. Licensee MDPI, Basel, Switzerland. This article is an open access article distributed under the terms and conditions of the Creative Commons Attribution (CC BY) license (https://creativecommons.org/licenses/by/4.0/).