Abstract
Internet of Things (IoT) technology is widely used in new power systems, and it also provides many new modes for network attacks. Illegal terminal device identification is also a significant topic in the field of wireless authentication technology. Some kinds of power network equipment are located in sparsely populated areas and rely on IoT terminals for real-time monitoring. Attackers use illegal terminals to connect power IoT devices for production monitoring and to carry out network attacks, which may cause serious damage, such as power data theft and misoperation of power network equipment. Radio frequency fingerprint (RFF) can extract hardware features from different devices, and is widely used for device identification and authentication. The area over which power network equipment placed is vast, and there are many wireless communication devices and terminals. It is difficult to identify illegal devices through commonly used network management techniques, thus making it difficult to distinguish between the mobile terminals of employees and illegal terminals in general spectrum screening. In response to the above situation, this paper uses the characteristics of the squared spectrum of random access preamble signals to extract hardware device features, proposes an illegal device identification algorithm based on Gaussian distribution theory, and evaluates its performance. The experimental results show that, when the signal-to-noise ratio (SNR) is greater than 15 dB, the average recognition result is greater than 92%. In addition, the algorithm has low computational complexity and high engineering application value.
1. Introduction
In recent years, with the continuous promotion of China’s 2060 carbon neutrality target, the construction of new power network systems has been accelerated. The development of power network systems has, thus, been rapid, aiming at improving public health, sparking technological innovation and creating new economic opportunities. The power network stations cover a large area, and the space is open. With limited human resources, managers can only rely on a small number of people to complete on-site duty work, which results in a lack of regulation and high network security risks. For example, it is difficult to detect when outsiders come into direct contact with control equipment on site, and equipment is prone to be overlapped by external lines and being attacked by intermediaries [1,2,3,4,5,6]. For example, some criminals utilize today’s rapidly developing science and technology to connect illegal mobile phones with power network systems through cellular mobile communication. Figure 1 presents a schematic diagram of an attack scenario, which illustrates an example of power network data leakage. Firstly, illegal terminal devices make connections to power network systems by adopting a cellular wireless networking method. In this way, attackers can access the local network of power stations through cellular mobile communications from afar, conduct sniffing, tapping, and network attacks, including infiltrating and controlling various terminal devices in the local network, collect network traffic, and even forge and tamper with power control instructions in the network. After attacking the power network system successfully, the illegal equipment transmits the stolen information to the external base station.
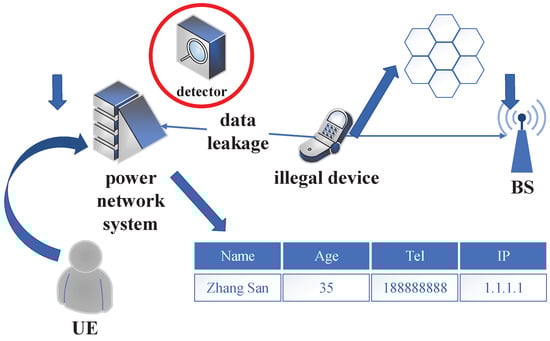
Figure 1.
Schematic diagram of attack scenario.
From the example given of data leakage from a power network, it can be seen that, if illegal devices are connected to the power equipment, large quantities of important information may be leaked. Therefore, effective device authentication mechanisms are needed to improve network security. Radio frequency fingerprint (RFF) identification is an effective technology for classifying wireless device identities [7,8,9,10,11,12,13,14,15]. As shown in Figure 1, a detector is used in this example, playing the role of third party testing equipment. Illegal devices use cellular communication, which has the characteristics of small coverage and low power transmission. Moreover, mobile phones used by venue employees share the same network as criminal devices, which makes it difficult for the detector to accurately and effectively detect illegal devices.
This article considers an identification method for illegal equipment in new power network systems, and proposes a recognition algorithm based on a Gaussian distribution fitting test. The main contents of the investigation include: first, estimating the arrival time of the preamble signal of the wireless device through the Haar wavelet transform, then analyzing the squared spectrum characteristics of the preamble signal, that is, calculating its squared spectrum, and analyzing its differences to provide a basis for feature extraction. On this basis, this article reports a recognition algorithm based on a goodness of fit test of the Gaussian distribution to achieve recognition of illegal equipment and legal equipment.
The rest of the article is organized as follows: Section 2 provides a detailed summary of work undertaken so far. Section 3 describes the methodology used, including the signal model, analysis of the Zadoff–Chu (ZC) sequence, signal collection, and the analysis approach, including the confusion matrix and goodness of fit test. Section 4 provides the experimental results. Section 5 presents the conclusions.
2. Related Work
A number of scholars have conducted extensive research on the issue of RFF recognition [7,8,9,16,17,18,19,20,21], which is discussed below.
Existing RFF recognition methods involve two main schemes. One is traditional device fingerprint technology, which usually selects one or more signal features for fingerprint extraction, such as the I/Q imbalance, frequency offset, phase noise, and so on. The other involves utilization of neural networks to automatically extract features for device identification. By increasing the size of the network, deep learning methods can improve the capacity of a fingerprint model and improve the differentiation degree of the device fingerprint, which has been extensively considered in recent years.
Linning Peng proposed a method to extract the RF fingerprint by using a differential constellation trace figure [8], which can be obtained by oversampling the received signal and performing differential operations on the signal to plot the sample points. Then the cluster center is calculated using the K-means clustering method. USRP was used as the receiving platform to identify 12 CC2530 devices using OQPSK modulation. The experimental results indicated that, when SNR was above 15 dB, it could reach a recognition accuracy of over 95%, and when the SNR was above 30 dB, it could reach 99%. Based on this work, Linning Peng later proposed a hybrid device classification scheme based on multi RF fingerprint features [7], which uses four modulation features, namely, a differential constellation trace figure (DCTF), a carrier frequency offset, a modulation offset, a constellation offset, and an I/Q offset. Based on this, a hybrid classifier scheme was designed to adaptively combine different features according to the channel signal-to-noise ratio (SNR). The weight of each feature was obtained during the training period. These features were combined with the weights selected according to the estimated SNR during the testing period. The classification error rate was as low as 0.048.
Laxima Niure Kandel exploited channel state information (CSI) for recognition [16]. The author collected the measured data in different locations as the training data and designed a classifier to determine whether the equipment was legal. Comprehensive experiments in diverse real environmental settings were conducted using the training set and the test set with a ratio of 8.5:1.5. The results indicated that, when transmitter and receiver were static, an accuracy of 98% was obtained, and, for the moving area, 92% device identification accuracy was obtained.
In light of the phenomenon that most existing RFF technologies are data-dependent, Yang Yang proposed a data-independent RFF extraction scheme [17], which was implemented on random data segments, such as communication data. In this study, a method called least mean square (LMS)-based adaptive-filter-based stacking (LAFS) was designed for RFF extraction; then, the author used the tap coefficients of an adaptive filter to represent the features. By utilizing the proposed LAFS, stable device fingerprints can be extracted from changing data. The LAFS was evaluated and the experimental results indicated that the classification accuracy could reach 98.9%, outperforming the deep learning network.
All the methods mentioned above are state of the art in traditional RFF recognition. Nevertheless, these selected features are effective in distinguishing a limited number of devices only when used alone or with a few cases. The distinguishing accuracy decreases as the number of devices grows [10].
In recent years, with the development of artificial intelligence technology, machine learning algorithms have been widely applied in fingerprint extraction and device recognition [18,19,20]. Amani Al Shawabka et al. [21] proposed a deep-learning-based recognition algorithm, which first analyzes features and then uses a convolutional neural network (CNN) to achieve fingerprint accuracy levels that traditional low dimensional algorithms cannot achieve. Pengcheng Yin proposed a novel multi-channel convolutional neural network (MCCNN) for long-term evolution (LTE) terminal identification [9]. The MCCNN is leveraged for feature extraction from the different parts of the signal, including the transient-on part, the modulation part, and the transient-off part. Then, the extracted features are combined to achieve higher classification accuracy. The experimental results obtained indicate that the identification accuracy achieved was as high as 98.96%.
At the same time, experts in some fields are gradually starting to research and use deep neural networks (DNNs) to construct modulation recognition classifiers in order to improve the effectiveness and reliability of recognition algorithms. However, this type of method also has certain limitations, requiring a large number of training samples and having high computational costs, making it unsuitable for applications with high real-time requirements.
In conclusion, the traditional RFF identification methods have difficulty recognizing a large number of devices accurately. RFF identification based on deep learning also requires large training samples and struggles to meet high real-time requirements. In addition, the aim of our article is to identify whether a terminal device is moving, which is a little different from traditional RFF research, the goal of which is to identify whether a device belongs to a specific category. Such research on recognizing static devices has not been carried out before. Therefore, a new method for identifying static terminals based on RFF with high real-time effectiveness and reliability still requires investigation.
3. Methodology
3.1. Signal Model
When a terminal is connected to a mobile network, it will send initial information to achieve synchronization with the base station, which is referred to as sending of preamble signals. The preamble signals of wireless devices are generated by one or several ZC sequences, with a total of 64 different ZC sequences in each cell. Mobile devices will randomly select one ZC sequence for access. The ZC sequence can be represented as described in [9]:
where n is the number of sequences and there are a total of 64 different ZC sequences; q and N are adjustable parameters and is the length of the ZC sequence.
The signal after adding Gaussian white noise can be expressed as
where represents the added Gaussian white noise signal, whose mean value is zero and with variance of .
The identification problem of illegal devices in this design can be expressed in terms of the following hypothesis-testing model:
In this scenario, illegal devices are wired to power devices and steal data, usually in a static state; legitimate devices refer to mobile devices (such as mobile phones) used by employees. These devices generally follow employees around as they operate the devices, making it difficult for them to remain stationary. Therefore, the identification of illegal devices can be further transformed into the identification of moving/static devices, which can be expressed as
3.2. Analysis of ZC Sequence
The preamble signals of mobile phone are composed of multiple ZC sequence cyclic shifts [9]. Different ZC sequences have orthogonality. According to simulations, the real part of the squared spectrum of the ZC sequence follows a Gaussian distribution; the distribution fitting results are shown in Figure 2.
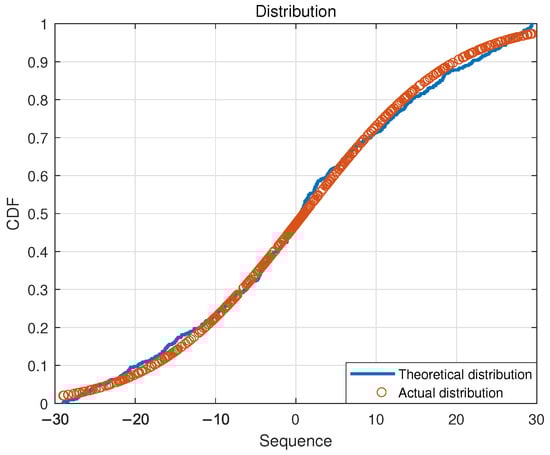
Figure 2.
Schematic diagram for distribution fitting of ZC square spectral sequence.
The reason for this phenomenon is that different cyclic shifts of the ZC sequence have orthogonality for static equipment. In this way, for equipment in a static environment, different ZC sequences are independent of each other, and the real part of the squared spectrum of the preamble signal thus obeys a Gaussian distribution. For equipment in the moving environment, due to the Doppler effect, the orthogonality between different cyclic shifts of the ZC sequence will be destroyed. In this case, different ZC sequences will, thus, no longer have mutual independence. Therefore, when a moving device is connected to the network, the squared spectrum of the preamble signal does not follow a Gaussian distribution; that is, the squared spectrum of the legitimate device’s preamble signal does not follow a Gaussian distribution. Reflecting this characteristic, this article proposes a recognition algorithm based on the goodness of fit test of a Gaussian distribution, which can effectively identify illegal equipment.
3.3. Collection of Preamble Signal
The preamble signal of a wireless device is the initial message sent by the terminal while accessing the mobile network before transmitting data; it can also be used to synchronize the user equipment with the base station to obtain base station resources. Usually, the preamble is triggered when it is necessary to connect to a mobile network. The typical preamble signal waveform is shown in Figure 3.
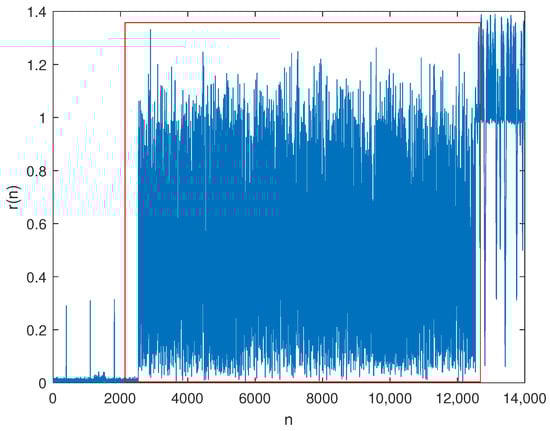
Figure 3.
Typical leading signal waveform (in red frame).
Estimating the arrival time of signals in low SNR environments is an important topic in signal processing and analysis. In [22], a signal arrival time estimation method based on Haar wavelet transform is reported; the Haar wavelet transform has the functions of edge detection and mutation point localization. It has been widely applied in the signal processing area. This article uses the Haar wavelet transform algorithm to reduce the noise level of the received signal [22], thereby estimating the start and end times of the preamble signal without prior signal information. The discrete Haar wavelet transform function used in this article is as follows [22]:
where a represents the scale and n represents the translation. is the mother wavelet function, which can be written as:
In our experimental approach, first, the collected signal with noise is subjected to a wavelet transform as described above. Then an optimal approximation to the original signal is found in the function space formed by scaling and translation of the wavelet mother function to remove the noise contained in it. Finally, the processed wavelet coefficients are subjected to a wavelet inverse transform to obtain the denoised signal. The waveform of the denoised leading signal is shown in Figure 4. The arrival and end times of the preamble signal can, thus, be accurately estimated.
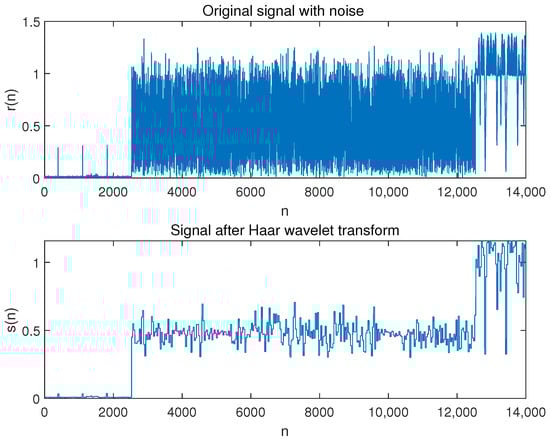
Figure 4.
Schematic diagram of comparison before and after wavelet transform.
3.4. Analysis of Feature
As shown in Figure 5 and Figure 6, the time-domain and frequency-domain waveform of the preamble signals of static and moving devices are very similar. The waveform is a random variable consisting of random variables in the time and frequency domain and does not have any significant peak. Therefore, in this design, it is difficult to effectively distinguish the preamble signals emitted by the static and moving devices through general processing, such as time-domain modulus extraction and signal Fourier transform, as expected. Therefore, in this article, an illegal device recognition algorithm based on the Gaussian distribution RF fingerprint features is considered.
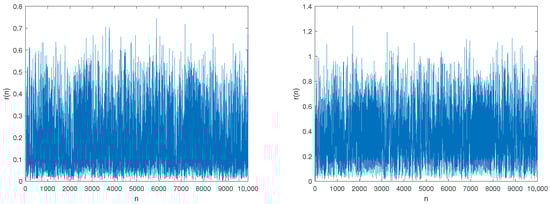
Figure 5.
The time domain waveform of preamble signals for static (left) and moving (right) devices.
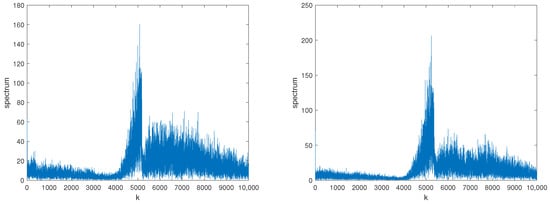
Figure 6.
The frequency domain waveform of preamble signals for static (left) and moving (right) devices.
According to the analysis of the ZC sequence above, it can be concluded that the real part of the squared spectrum of the preamble signal of a static device follows a Gaussian distribution, while the real part of the squared spectrum of the preamble signal of a moving device does not follow a Gaussian distribution. Therefore, this algorithm first extracts the squared spectrum of two types of preamble signals and calculates their real parts. The real part of the squared spectrum waveform of the two devices is shown in Figure 7. Figure 7 indicates that the real part of the squared spectrum waveform of the preamble signals of the static device consists of random variables and does not have any significant peak, while for moving devices, it exhibits two significant peaks. The peaks indicate that the signal comprises a deterministic part and additive phase noise, which do not follow a Gaussian distribution. The difference in the real part of the squared spectrum waveform of the preamble signals can be utilized to distinguish the two signals.
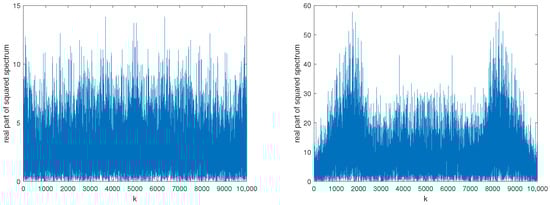
Figure 7.
The real part of the squared spectrum waveform of preamble signals for static (left) and moving (right) devices.
3.5. Goodness of Fit Test Algorithm for Distribution
In theoretical research, when it is necessary to test whether a group of random samples conforms to a certain probability distribution, a goodness of fit test of distribution is usually utilized. Widely used methods include the Anderson–Darling (AD) test, the Kolmogorov–Smirnov (KS) test, etc. [23]. The goodness of fit test method used in this paper is the KS test, which is used to test whether the distribution of the real part of the squared spectrum of the preamble approximately follows a Gaussian distribution. If it follows a Gaussian distribution, it is determined to be illegal equipment. If it does not follow a Gaussian distribution, it is determined to be legal equipment.
In this design, it is assumed that the samples are independent, identically distributed observation samples arranged in ascending order in the squared spectrum of the leading signal, all of which come from the overall empirical distribution samples . Here, the distribution of the samples is a Gaussian distribution of the overall empirical distribution samples.
The null hypothesis needs to be tested:
where F is the distribution cluster, whose parameter is . The basic idea of the goodness of fit test of an empirical distribution function is to compare the distance between the hypothetical distribution and the empirical distribution .
The identification of illegal devices can be further transformed into an identification model expressed as:
The empirical distribution function can be calculated using the following formula:
The basic process of the KS test is as follows:
Step 1: Calculate the empirical cumulative distribution function .
Step 2: Define the absolute value of the maximum difference between two cumulative distribution functions as the test statistic of goodness of fit:
where
Step 3: Compare the goodness of fit test statistics with the threshold ; accept () if and reject if . When the significance level or error warning probability of the given test is given, the threshold can, thus, be obtained by solving the following equation:
where .
3.6. Evaluation Metrics
In this article, we use the confusion matrix to evaluate the performance of the goodness of fit test for the distribution algorithm. The confusion matrix provides high precision and excellent classification capability, so that it is used for classification in this article.
The basic standard evaluation criteria include true positive (TP), false positive (FP), false negative (FN), and true negative (TN), which are shown in Table 1.

Table 1.
Confusion Matrix.
However, the evaluation criteria in the confusion matrix cannot measure the advantages and disadvantages of the proposed algorithm by counting the quantity of data only. Therefore, the confusion matrix is extended to include the following four secondary indicators with the basic statistical results, shown in Table 2: accuracy, precision, recall, and specificity.
Table 2.
The secondary indicators.
Using the above four secondary indicators, the quantity values in the confusion matrix can, thus, be converted into a proportion between 0 and 1.
Utilizing these four indicators, another third-level indicator called is, thus, derived, which can be represented as:
The value ranges from 0 to 1; a value of 1 represents the best output of the model, while 0 represents the worst output of the model.
In this article, the performance of the goodness of fit test for the distribution algorithm can, thus, be evaluated by the criteria described above.
4. Results and Analysis
This section introduces the construction of the experimental platform and the setting of the experimental parameters. Then, we display the empirical and theoretical distributions of the real parts of the squared spectrum of two types of signals, and, finally, analyze their performance.
4.1. Establishment of Experimental Platform and Parameter Settings
In order to verify the illegal device recognition algorithm based on Gaussian distribution features proposed in this article, an experimental system was built, which included a static mobile phone serving as an illegal device and a moving mobile phone serving as legitimate equipment carried by staff.
Software defined radio (SDR) is a radio broadcasting communication technology that controls traditional hardware circuits through software to receive and transmit wireless signals of different frequency bands and standards. This design uses a USRP B210 device to build a base station system in the Ubuntu 18.04 system using the srsRAN 21 open-source software suite, while another USRP N210 device is used to capture signals. The related parameters of USRP B210 and USRP N210 are shown in Table 3. These two USRP devices mainly perform front-end processing, such as signal transmission, filtering, mixing, and sampling. The maximum frequency of USRP is 6 GHz and the maximum processing bandwidth is 56 MHz. By using variable sampling theory, it can be converted to a sampling rate of 30.72 Msps, meeting the requirements of a 10 MHz bandwidth and 2.565 GHz center frequency in this study.
Table 3.
USRP equipments and related parameters.
4.2. Experimental Results
As shown in Figure 8 and Figure 9, the solid blue line represents the theoretical Gaussian distribution curve of the squared spectrum sequence of the preamble signal, and the actual distribution of the squared spectrum sequence is represented by small red circles. The above results provide estimated empirical distribution functions for two scenarios and theoretical distribution functions obtained from fitting data based on a Gaussian distribution. From the graph, it can be seen that, under hypothetical circumstances, the empirical distribution function of the squared spectral sequence fits a Gaussian distribution well (); under hypothetical circumstances, the actual distribution function is significantly different from a Gaussian distribution (). From this, it can be verified that the squared spectrum of the preamble signal of illegal equipment (static equipment) follows a Gaussian distribution, while the squared spectrum of the preamble signal of legal equipment (moving equipment) does not follow a Gaussian distribution. In the experiment, each hypothetical case corresponds to one of the evaluation criteria, respectively, which is shown in Table 4.
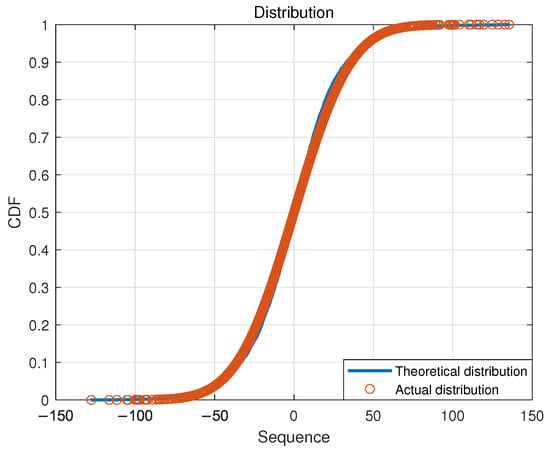
Figure 8.
Fitting result of the squared spectral distribution of the preamble signal of an illegal device ().
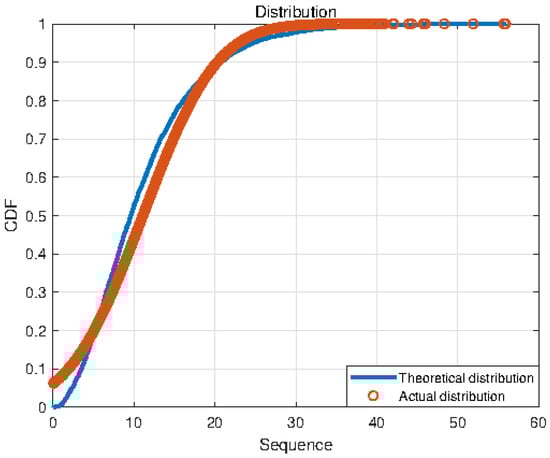
Figure 9.
Fitting result of the squared spectral distribution of the preamble signal of a legal device ().
Table 4.
Correspondence of the hypothetical case and the evaluation criteria.
In this design, SNR is one of the main factors affecting algorithm performance. Therefore, this article investigates its impact on algorithm performance.
In this study, 1000 sets of preamble signals were collected in two different scenarios, and varying degrees of noise were added. The minimum SNR was 0 dB and the maximum value was 30 dB, with an increment of 3 dB. The sampling point for each preamble signal was 10,000. For each SNR, the collected signals were identified and the recognition results obtained from these simulations were used to obtain their respective recognition accuracy. As shown in Table 5, five criteria were evaluated in the design, each of which gradually increases with increase in SNR.
Table 5.
Extended performance diagram of distribution fitting recognition algorithm.
It can be seen from Table 6 that TNR and FNR are basically not affected by SNR. The reason is that, after the spectrum processing described in this article, the waveform of the preamble signal of the static equipment can approximately be regarded as the spectrum of Gaussian white noise. Therefore, no matter how low the SNR is, its spectrum can be regarded as a spectrum of noise obeying a Gaussian distribution. The performance is, thus, affected little by SNR. TPR and FNR are greatly affected by SNR because there are obvious peak spectral lines in the square spectrum of the moving signal, which is a combination of the noise spectrum and the signal spectrum. Therefore, when the SNR is too low, the power of the signal spectrum component will decrease, causing the peak spectral line of the spectrum to be small, resulting in unclear characteristics and a decrease in the recognition accuracy.
Table 6.
Basic performance diagram of distribution fitting recognition algorithm.
Table 5 illustrates five extended performances of the proposed algorithm in this article. The five criteria increase as SNR grows. As shown in the figure, they can all reach an accuracy of more than 90% when SNR is more than 15 dB. This is aligned with our expectations since this algorithm can provide high accuracy of recognition.
4.3. Comparison with Other Scheme
As shown in Figure 10, TPR and TNR are compared with RFF based on deep learning, which is exploited in [16] for device identification using the training set and the test set with a ratio of 8.5:1.5. Inspired by [16], this article simulates 1000 samples of CSI collected from different devices, from which the samples are first divided randomly into two parts: 85% for the training set and 15% for the test set. By comparison, we find that the performance of the scheme proposed in this article shows little difference with the scheme of deep learning. RFF identification in this article can reach an accuracy of 96.6% and the scheme in [16] can reach 98.1%, which indicates that the performance in our article is a little lower. Fortunately, compared with the deep learning method, this algorithm does not require a training section and has low complexity, resulting in high engineering value.
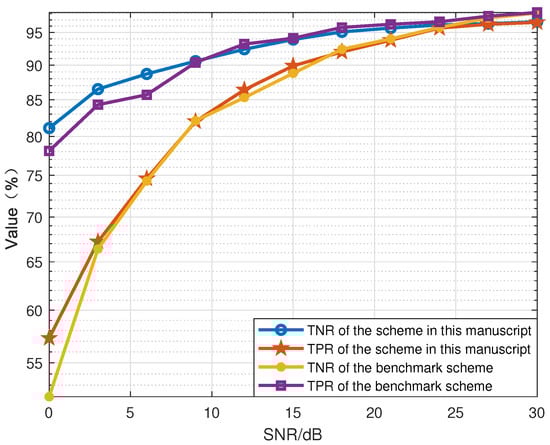
Figure 10.
Comparison of recognition with schemes proposed in [16] by Kandel, L in 2019.
5. Conclusions
This article proposed an illegal mobile device identification scheme based on RFF. Firstly, we studied the characteristics of the ZC sequence. As was discussed in Related Work, most existing schemes have difficulty achieving high accuracy and meeting high real-time requirements at the same time. To overcome this shortcoming, we proposed a recognition algorithm based on a Gaussian distribution fitting test by analyzing the squared spectrum characteristics of the preamble signals of illegal and legitimate devices in a power network system. The real part of the squared spectrum of the preamble signals of illegal devices follows a Gaussian distribution, while the real part of the squared spectrum of legitimate device’s preamble signals does not follow a Gaussian distribution. The experimental results showed that, in an environment with an SNR of 30 dB, the average recognition accuracy of the algorithm could reach 96.6%, and the algorithm has low complexity and high engineering value. In conclusion, this algorithm displays high precision and excellent classification capability, making it suitable for the identification of illegal equipment in power network stations. This design has the advantage of recognizing signals of the same type and recognizing whether they are static. When the signals are composite signals, it may be difficult to use this method to identity an illegal device. The application of this method in the case of composite signals (mixed with other types of signals) will be studied in the future.
Author Contributions
Conceptualization, Z.S., Z.L. and T.Z.; methodology, W.W. and T.Z.; software, Z.L. and T.Z.; validation, Z.S., Z.L. and T.Z.; formal analysis, Z.S. and Z.L.; investigation, Z.S.; resources, Z.S.; data curation, Z.S., Z.L. and T.Z.; writing—original draft preparation, W.W.; writing—review and editing, Z.S. and W.W.; visualization, Z.L. and T.Z.; supervision, Z.S. and Z.L.; project administration, Z.S.; funding acquisition, W.W. All authors have read and agreed to the published version of the manuscript.
Funding
This research was funded by Research on Distributed Flexible Resource Aggregation Regulation Security Protection System and Key Technologies under grant number 5400-202258435A-2-0-ZN.
Institutional Review Board Statement
Not applicable.
Informed Consent Statement
Not applicable.
Data Availability Statement
Not applicable.
Conflicts of Interest
The authors declare no conflict of interest.
Abbreviations
The following abbreviations are used in this manuscript:
| AD | Anderson–Darling |
| CNN | Convolutional neural network |
| CSI | Channel state information |
| DC | Direct current |
| DCTF | Differential constellation trace figure |
| DNN | Deep neural network |
| FN | False negative |
| FP | False positive |
| IoT | Internet of Things |
| KS | Kolmogorov–Smirnov |
| LMS | Least mean square |
| LTE | Long-term evolution |
| MCCNN | Multi-channel convolutional neural network |
| RFF | Radio frequency fingerprint |
| SDR | Software defined Radio |
| SNR | Signal-to-noise ratio |
| TN | True negative |
| TP | True positive |
| ZC | Zadoff–Chu |
References
- Zhang, Z.; Hu, A.; Wei, X. An artificial radio frequency fingerprint embedding scheme for device identification. IEEE Commun. Lett. 2022, 26, 974–978. [Google Scholar] [CrossRef]
- Ahmad, I.; Kumar, T.; Liyanage, M.; Okwuibe, J.; Ylianttila, M.; Gurtov, A. Overview of 5G security challenges and solutions. IEEE Commun. Stand. Mag. 2018, 2, 36–43. [Google Scholar] [CrossRef]
- Hussain, S.; Chowdhury, O.; Mehnaz, S.E.B. LTEInspector: A systematic approach for adversarial testing of 4G LTE. In Proceedings of the Network and Distributed System Security Symposium, San Diego, CA, USA, 18–21 February 2018; pp. 1–15. [Google Scholar]
- Zhang, W.; Shan, H. LTE redirection: Forcing targeted LTE cellphone into unsafe network. In Proceedings of the Defcon, Las Vegas, NV, USA, 4–7 August 2016. [Google Scholar]
- Shaik, A.; Borgaonkar, R. New vulnerabilities in 4G and 5G cellular access network protocols: Exposing device capabilities. In Proceedings of the WiSec—Conference on Security and Privacy in Wireless and Mobile Networks, Miami, FL, USA, 14–17 May 2019. [Google Scholar]
- Wang, Y.; Zhang, Z.; Xie, Y. Privacy-Preserving and Standard-Compatible AKA Protocol for 5G. In Proceedings of the USENIX Security Symposium, Virtual, 11–13 August 2021. [Google Scholar]
- Peng, L.; Hu, A.; Zhang, J.; Jiang, Y.; Yu, J.; Yan, Y. Design of a hybrid RF fingerprint extraction and device classification scheme. IEEE Internet Things J. 2019, 6, 349–360. [Google Scholar] [CrossRef]
- Peng, L.; Zhang, J.; Liu, M.; Hu, A. Deep learning based RF fingerprint identification using differential constellation trace figure. IEEE Trans. Veh. Technol. 2020, 69, 1091–1095. [Google Scholar] [CrossRef]
- Yin, P.; Peng, L.; Zhang, J.; Liu, M.; Fu, H.; Hu, A. LTE device identification based on RF fingerprint with multi-channel convolutional neural network. In Proceedings of the IEEE GLOBECOM, Madrid, Spain, 7–11 December 2021; pp. 1–6. [Google Scholar]
- Li, G.; Yu, J.; Hu, A. Research on physical-layer security based on device and channel characteristics. J. Cryptologic Res. 2020, 7, 224–248. [Google Scholar]
- Yu, J.; Hu, A.; Zhu, C.; Peng, L.; Jiang, Y. RF fingerprinting extraction and identification of wireless communication devices. J. Cryptologic Res. 2016, 3, 433–446. [Google Scholar]
- Li, T.; Wang, Y.; Xing, Y.; Hu, A. Research on multi-dimensional privacy disclosure evaluation model of mobile terminals. Chin. J. Comput. 2018, 41, 2134–2147. [Google Scholar]
- Zhang, J.; Woods, R.; Sandell, M.; Valkama, M.; Cavallaro, J. Radio Frequency Fingerprint Identification for Narrowband Systems, Modelling and Classification. IEEE Trans. Inf. Forensics Secur. 2021, 16, 3974–3987. [Google Scholar] [CrossRef]
- Shen, G.; Zhang, J.; Marshall, A.; Peng, L.; Wang, X. Radio frequency fingerprint identification for LoRa using spectrogram and CNN. In Proceedings of the 40th IEEE IEEE International Conference on Computer Communications (INFOCOM), Vancouver, BC, Canada, 10–13 May 2021; Volume 2021. [Google Scholar]
- Xing, Y.; Hu, A.; Zhang, J.; Peng, L.; Li, G. On radio frequency fingerprint identification for DSSS systems in low SNR scenarios. IEEE Commun. Lett. 2018, 22, 2326–2329. [Google Scholar] [CrossRef]
- Kandel, L.; Zhang, Z.; Yu, S. Exploiting CSI-MIMO for accurate and efficient device identification. In Proceedings of the IEEE GLOBECOM, Waikoloa, HI, USA, 9–13 December 2019; pp. 1–6. [Google Scholar]
- Yang, Y.; Hu, A.; Xing, Y.; Yu, J.; Zhang, Z. A data-independent radio frequency fingerprint extraction scheme. IEEE Wirel. Commun. Lett. 2021, 10, 2524–2527. [Google Scholar] [CrossRef]
- Das, R.; Gadre, A.; Zhang, S.; Kumar, S.; Moura, J. A deep learning approach to IoT authentication. In Proceedings of the IEEE International Conference on Communications, Kansas City, MO, USA, 20–24 May 2018. [Google Scholar]
- Baldini, G.; Gentile, C.; Giuliani, R.; Steri, G. Comparison of techniques for radiometric identification based on deep convolutional neural networks. Electron. Lett. 2019, 55, 90–92. [Google Scholar] [CrossRef]
- Baldini, G.; Giuliani, R.; Dimc, F. Physical layer authentication of Internet of Things wireless devices using convolutional neural networks and recurrence plots. Internet Technol. Lett. 2019, 2, e81. [Google Scholar] [CrossRef]
- Al-Shawabka, A.; Restuccia, F.; D’Oro, S.; Rendon, T.J.B.C. Exposing the Fingerprint: Dissecting the Impact of the Wireless Channel on Radio Fingerprinting. In Proceedings of the 38th IEEE International Conference on Communications (INFOCOM), Toronto, ON, Canada, 6–9 July 2020; pp. 646–655. [Google Scholar]
- Hu, G.; Liu, Y.; Deng, Z. Arrival time estimation of signals based on Haar wavelets transform. Tong Gong Cheng Dian Shu/Syst. Eng. Electron. 2009, 31, 1615–1619. [Google Scholar]
- Yang, L.; Hu, G.; Hu, X. Modulation identification of BPSK/QPSK signals based on goodness of fit-test of GP distribution. Telecommun. Eng. 2019, 59, 691–698. [Google Scholar]
Disclaimer/Publisher’s Note: The statements, opinions and data contained in all publications are solely those of the individual author(s) and contributor(s) and not of MDPI and/or the editor(s). MDPI and/or the editor(s) disclaim responsibility for any injury to people or property resulting from any ideas, methods, instructions or products referred to in the content. |
© 2023 by the authors. Licensee MDPI, Basel, Switzerland. This article is an open access article distributed under the terms and conditions of the Creative Commons Attribution (CC BY) license (https://creativecommons.org/licenses/by/4.0/).