Article

Assessment of Visual Motor Integration via Hand-Drawn Imitation: A Pilot Study

1
School of Computing, University of Portsmouth, Portsmouth PO1 3HE, UK
2
Institute of Semiconductors, Chinese Academy of Sciences, Beijing 100083, China
3
International College, University of Creativity Art, Farnham GU9 7DS, UK
4
Yanqi Lake Beijing Institute of Mathematical Sciences and Applications, Beijing 101408, China
*
Author to whom correspondence should be addressed.
Electronics 2023, 12(13), 2776; https://doi.org/10.3390/electronics12132776
Submission received: 12 May 2023 / Revised: 16 June 2023 / Accepted: 17 June 2023 / Published: 22 June 2023
(This article belongs to the Section Artificial Intelligence)

Abstract

:
Copious evidence shows that impaired visual–motor integration (VMI) is intrinsically linked to the core deficits of autism spectrum disorder (ASD) and associated with an anomalous social capability. Therefore, an effective evaluation method of visual–motor behaviour can provide meaningful insight into the evaluation of VMI towards social capability. The current pilot study aims to explore the appropriate quantified metrics for evaluating VMI ability based on a hand-drawn imitation protocol. First, a simple and interesting hand-drawn protocol was designed, and six healthy participants were recruited to perform the task. Then, based on the collected hand–eye behaviour data, several metrics were applied to infer the participant’s social capability and VMI in engagement and visual–motor complexity based on hand–eye properties with Hausdorff distance and cross-recurrence quantification analysis (CRQA). Finally, those quantified metrics were verified through statistical significance. This study proposed a set of quantitative metrics to construct a comprehensive VMI evaluation, including outcome and progress measures. The results revealed the proposed method as a directly interpretable indicator providing a promising computational framework and biomarker for VMI evaluation, paving the way for its future use in ASD diagnosis and guiding intervention.

1. Introduction

Visual–motor integration(VMI) or perception–action coupling is the synchrony of visual perception and fine motor control. It is the ability of the vision system to coordinate the information received through the eyes to control, guide, and direct the hands in the accomplishment of a given task [1,2]. A considerable amount of studies in the literature have demonstrated the presence of motor difficulties in individuals with autism spectrum disorder (ASD), with recent estimates indicating that 87 percent of individuals with ASD experience motor difficulties [3,4]. The abnormalities in gross and fine motor skills, gait, balance, motor planning, and motor coordination have been identified [5,6,7,8,9]. Recent meta-analyses have demonstrated that motor skills are poorer in very young children with ASD than in typically developing (TD) children. The groups become increasingly divergent with age [10,11,12]. Notably, the group differences in motor skills appeared far earlier than ASD is typically detected, suggesting the potential for motor analysis in early screening and intervention for ASD. Meanwhile, numerous studies show children with ASD are particularly impaired on tasks requiring efficient VMI and significantly associated with impairment in social–communicative skills [13,14,15].
Therefore, evaluating the VMI ability is critical to understanding heterogeneity in the social and communicative deficits at the core of ASD  [15,16]. VMI impairment commonly contributes to impaired motor imitation and also affects social–communicative skill development. Thus, assessing the VMI through imitation behaviour has been considered as a critical interaction protocol for understanding the VMI and social–communicative deficits of ASD. Recently, Lidstong et al. [17] proposed a Computerised Assessment of Motor Imitation (CAMI) focusing on analysing VMI through a dance imitation protocol. Andrius et al. [18] through an imitate simple hand movements protocol investigated the discrimination between autistic and non-autistic individuals. As a simple, interesting and highly acceptable interactive protocol for children, hand-drawn imitation tasks have been used as one of the standardised assessment tools in manual behaviour observation, i.e., the Beery VMI test [19]. However, a computer-assisted VMI method based on hand-drawn imitation protocol is still absent. Due to the hand-drawn imitation highly involving visual perception to receive and guild hand movement and hand fine motor control to precisely copy the geometric shapes, the key challenge is how to model the hand and eye behaviour.
Fortunately, in the last five years, computer technology has facilitated an explosion of computer-aided methods for studying hand and eye behaviour. Many effective methods and frameworks have been proposed for handwriting explainable approaches in many applications. Daniela Mazzolini et al. [20] presented an easy-to-explain yet effective framework to support semi-automatic signature verification in forensic settings. Paul Whitten et al. [21] introduced a partitioning approach to construct an explainable architecture that recognised handwritten characters. Noemi Gozzi et al. [22] adapted XAI algorithms to EMG hand gesture classification to understand the outcome of machine learning models with respect to physiological processes, evaluating the contribution of each input feature to the prediction. Moreover, there are a growing number of new markers or techniques for assessing hand and eye behaviours. Those metrics can be divided into outcome and process measures. Considering the potentially high failure rates in children with ASD, the outcome and process measures are all vital for a comprehensive VMI evaluation. The outcome measures focus on a certain level of involvement in hand–eye behaviour as well as the completion of the experimental task, such as the correlation of end-points, game score, shapes’ spatial accuracy, total distance, time delay, and duration based on different task properties [23,24,25,26,27,28,29]. Under our task properties, a combination of parameters is used to describe the engagement as the outcome measure, where the engagement refers to social capability and indicates the result of participants engaging in drawing imitation, including gaze fixation on the area of interest (AOI), hand-drawing and hand-drawn performance from drawing similarity estimated by Hausdorff distance. Moreover, for process measures, we investigate the synchrony between eye and hand behaviours during the task. We applied cross-recurrence quantification analysis (CRQA) [30] for the first time in VMI measurement. CRQA has become a prominent tool to assess correlation or coupling by comparing the co-evolution of two signals. Nowadays, applications of CRQA are very prominent in joint action research investigating the coupling of behaviours. Particularly, CRQA has been used to investigate the correlation of parent–child interaction [31], hand movement and speech properties development [32], social interaction [33], or gaze behaviour analysis [34,35].
Therefore, this study aims to explore effective indicators for a comprehensive evaluation of VMI through a hand-drawn imitation protocol, paving the way for future applications in ASD diagnosis and guided intervention. Specifically, in this paper, we focus on framework feasibility validation, and therefore, we describe the motion protocol, the data collection system, and the proposed metrics of VMI capacity by recruiting healthy subjects. The proposed method includes outcome and process measures corresponding to participant engagement and visual–motor complexity estimated by CRQA for a comprehensive VMI evaluation. Furthermore, the proposed quantitative indicators were verified through the statistical significance of different difficulty level results. The main contributions of this study can be summarised as follows:
  • A VMI evaluation framework was proposed based on a computer-assisted hand-drawn imitation task.
  • C-RQA was first introduced to measure the VMI from the complexity of the hand and eye behaviour synchrony. It fills the gap without a computational framework for visual–motor behaviour.
  • We conducted a pilot study of the proposed VMI evaluation tool and verified the validity of the proposed method by a statistical significance test, providing promising VMI indicators.
The rest of this paper is organised as follows: Section 2 details the participants, motion protocol, and experiment setup. Section 3 introduces the proposed engagement and visual–motor assessment methods. Section 4 illustrates the experiment results with discussions. Finally, the conclusion and future work are given in Section 5.

2. Experiment Design

2.1. Participants

This study recruited 11 participants, including 10 healthy adults (4 male, 6 female, average age = 28.2, STD = 4.49) and 1 healthy child (female, age = 5.5), including both right-handed and left-handed participants. All participants met the following criteria: (1) normal or corrected visual acuity, (2) no severe cognitive deficit, and (3) did not have a history of motor difficulties. The study followed the declaration of Helsinki guidelines and was approved by the University of Portsmouth Ethics Commit (TECH2022-D.Z-02).

2.2. Drawing Imitation Task

Following our previous research [36], and based on the fact that children with ASD generally perform worse on geometry shape copying tests than typical development (TD) children [37,38,39], we design this task to assess the participant’s VMI ability through hand-drawing imitation protocol. The goal of this task is to evaluate VMI ability by having the participant use their finger to imitate a hand-drawn image on a touchscreen device (tablet) following a given demonstration video on the screen in front of them. The hand-drawn imitation task mainly involves visual perception (head, eye) and fine motor (hand, fingers, and upper arm) behaviours in real-time. During the task, the reference hand-drawn trajectory video will appear and play on screen as soon as data collection starts for 60 s. All participants will be asked to imitate each reference hand-drawn 10 times under data collection. The reference hand-drawn demo trajectory videos are hand-drawn and recorded by fine artists using an iPad.
In order to evaluate the validation of the proposed method, we design those two hand-drawn examples with visible differences in difficulty, which are easy level (T-shirt) Figure 1a and hard level (cat) Figure 1b.

2.3. Experiment Setup

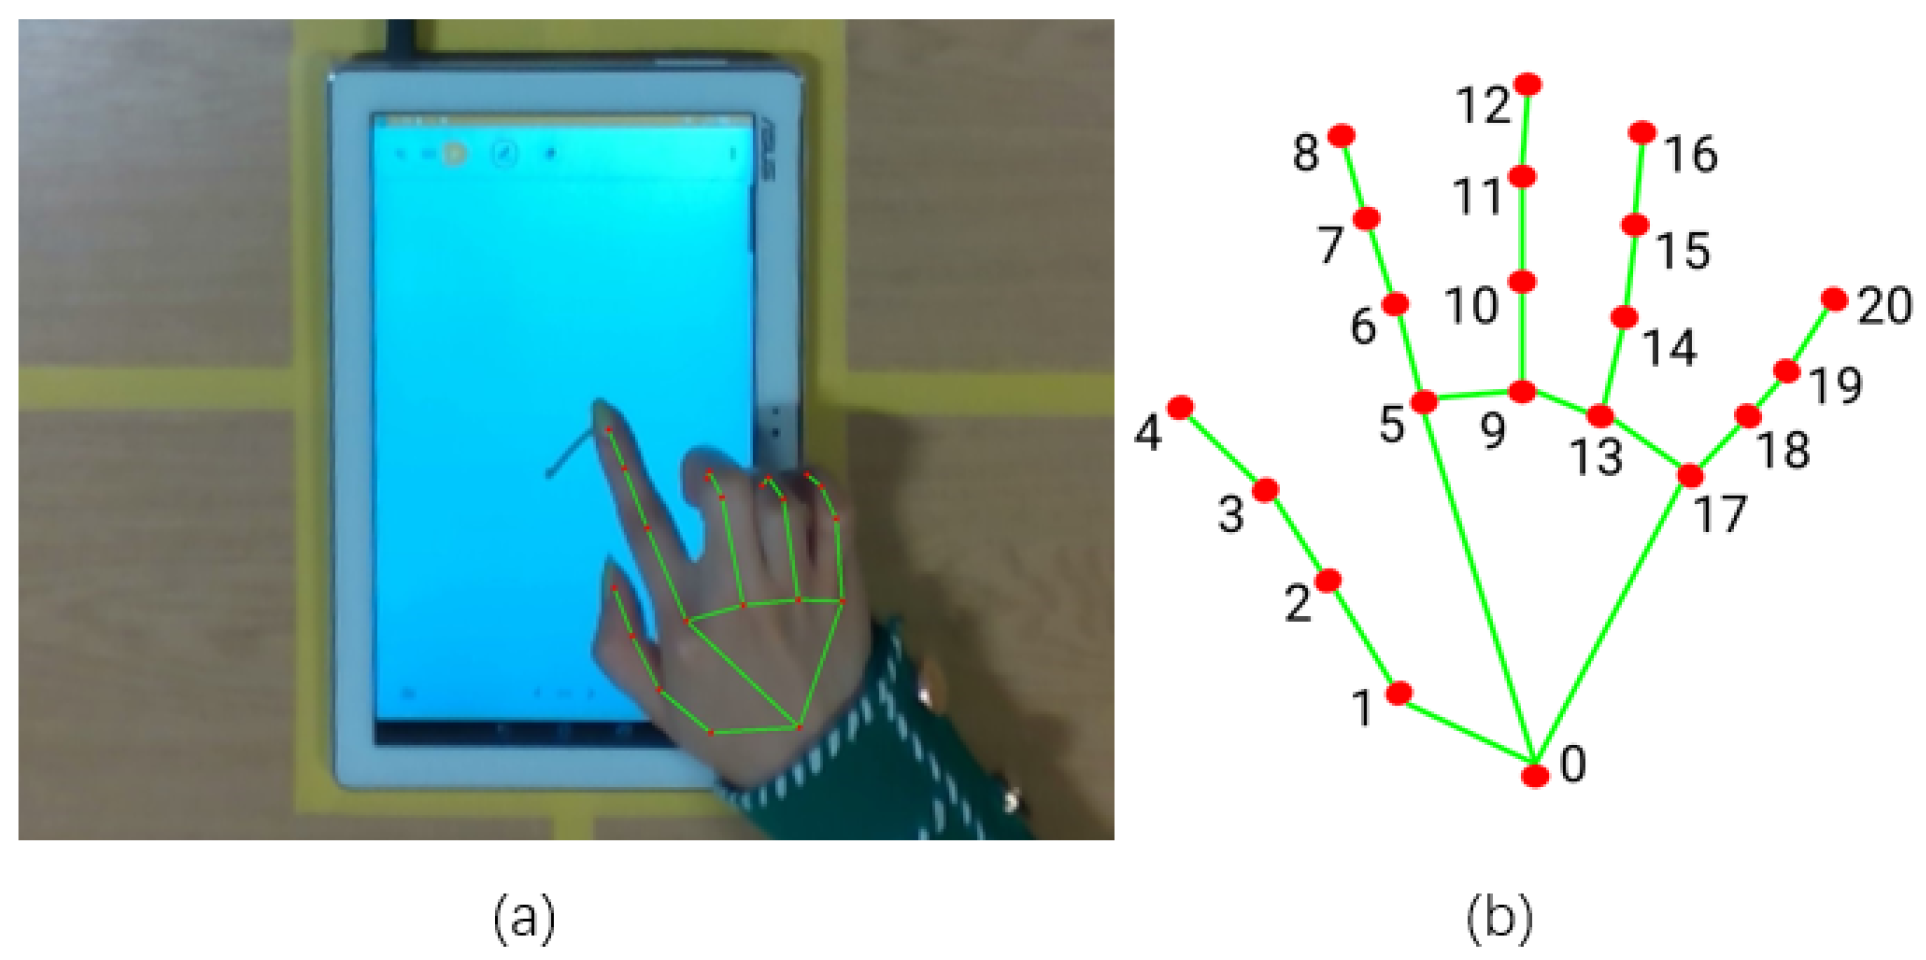
The data acquisition system consisted of a touchscreen device (ASUS), two 27-inch monitors (DELL), a screen-mounted eye-tracking system (Tobii Pro, Tobii), two RGB-D cameras (Realsense, Intel), and a Desktop (Intel i7, 32 G RAM). All cameras are fixed on custom frames with fixed geometric relationships. The touchscreen device is used as a visualised tool to display drawing trajectories in real time. During the experiment, the two cameras and eye-tracker will capture the participant’s hand motion and gaze data by a tailor-made Python script (python3.6). The hand skeleton data were estimated using the media-pipe hand (Google) [40]. For each video frame, the x–y pixel coordinates of data from the following 21 joints in Figure 2 were exported.
The data acquisition system is synchronised by the lab-streaming-layer software package (LSL) at a frame rate of 30 Hz for cameras and an eye-tracker. For each frame of the acquisition process, the system will store hand RGB, hand depth map, face RGB, face depth map, gaze position, and hand skeletons.

2.4. Procedures

The study was carried out in our lab with no other interference. Participants were seated on a fixed-position chair, approximately 75 cm from the monitor, with their eyes at the same height as the centre of the screen. We calibrated the eye tracker for each participant to ensure an accurate recording of gaze coordinates. Verbal instructions, a demonstration, and a practice trial were provided to each participant before the task commenced, allowing them to become familiar with the task.
The protocol for the experiment includes three steps. First, the participant will be greeted and seated. The chair height will be adjusted to ensure the eye centre is aligned with the camera. The Tobii eye-tracker calibration procedure will then be initiated, which is followed by an introduction of the task to the participant. The second step involves the participant undergoing a trial round to familiarize themselves with the device, specifically drawing on the tablet following the demo video. After this, we will confirm if the participant is ready and remind them to look at the screen throughout. The drawing video will then be played, and the participant will be asked to draw on the tablet simultaneously for 60 s. In the third step, we will repeat step 2 for each of the 10 complexity levels. After each drawing session, there will be a break before proceeding to the next drawing. After completing each complexity level, the participant will take a break of 2 to 3 min.

3. Methodology

The overall workflow of VMI evaluation is shown in Figure 3. First, the synchronised gaze and skeleton data of participants were captured by the camera and eye-tracker during the task. Then, after reconstruction of the hand and gaze behaviour to a categorical time-series sequence, we utilised CRQA to measure the system’s complexity of visual–motor behaviour. Moreover, the engagement was estimated based on drawing performance and hand–eye behaviour together.

3.1. Complexity of Visual–Motor Synchrony

During the participants’ hand drawing, their hand–eye coordination was measured based on the two-dimensional coordinates data collected by the eye tracker and camera. Based on the data, we apply cross-recurrence quantification analysis (CRQA) to quantify the assessment participant’s visual–motor system’s interaction complexity. CRQA is an analysis using a cross-recurrent plot (C-RP). It determines how often two systems demonstrate similar patterns of behaviour over time by taking as input two different sequences and testing the ’closeness’ of all points of the first sequence against all points of the second sequence. Firstly, we represent the 2D gaze and skeleton sequence to categorical time series based on customised hand and eye behaviour filters; then, we construct C-RP based on those hand and eye categorical time series. Finally, we apply CRQA measurements for the c-RP. The process was implemented using the pyRQA [41] toolbox in Python.

3.1.1. Categorisation of Visual–Motor Behaviour

Our aim is utilising CRQA to estimate the VMI ability through analysis of the synchrony between hand and eye behaviours. Under our task setup, the visual–motor behaviour can be decoupled to a series of hand and eye behaviour states/categories. Based on the collected skeleton and gaze data in 2D coordinates, to analyse visual–motor data in CRQA, each set of coordinates was subsequently translated into a categorical time series indicating the hand and eye behaviour state (e.g., gaze fixation, hand drawing).
For gaze behaviour, we implement a customised fixation filter with the threshold minimum during ( t h r 1 = 100  ms) and maximum distance ( t h 2 = 64  pixels) to determine the fixation behaviour. AOI is defined as the reference trajectory playing area on the screen with the threshold ( A O I t h r = 0.2 ). Following Algorithm 1, there are three different gaze behaviour states estimated, which include fixation not on AOI, fixation within AOI and no gaze behaviour on screen.
In our experiment, the hand behaviour is represented in the skeleton in Algorithm 2; after applying data normalisation, the skeleton sequences are filtered with two dimensionless distance thresholds ( t h m i n = 0.01 ) and t h m a x = 0.05 ) correspondingly to the hand-moving distance per frame (speed) and relevant distance with a hand-drawn reference. That threshold is optimised by a one-dimensional clustering method and Jenks natural breaks (classes = 3) based on the collected hand movement data. Through this distance filter, three different hand behaviour states are estimated, which are hand-drawing, hand-moving and stop.
Algorithm 1 Categorical Gaze Behaviour Sequence.
Input:  g n : The set of gaze sequence in 2D pixel coordinate.
f n : The set of fixation sequence in 2D pixel coordinate.
r n : The set of reference hand-drawn trajectory in 2D pixel coordinate.
A O I t h r : The distance threshold for determining AOI.
Output: G: Categorical Gaze Behaviour Sequence
for  i = 0 ; i < l e n g t h ( g n ) ; i + +  do
  if  a l l ( F n [ i ] ) i s   n o t n u l l  then
   if  d i s t a n c e ( F n [ i ] , r n [ i ] ) < t h r  then
    G  a p p e n d ( 1 )
   else
    G  a p p e n d ( 0 )
   end if
  else
   G  a p p e n d ( 2 )
  end if
end for
return  G ;
Algorithm 2 Categorical Hand Behaviour Sequence.
Input:  h n : The set of hand skeleton sequence in 2D pixel coordinate for the drawing finger.
t h m a x : The maximum distance threshold.
t h m i n : The minimum distance threshold.
Output: H: Categorical Hand Behaviour Sequence
for  i = 1 ; i < l e n g t h ( h n ) ; i + +  do
   d i s = d i s t a n c e ( h n [ i ] , h n [ i 1 ] )
  if  t h m i n < d i s < = t h m a x  then
   H  a p p e n d ( 1 )
  else if  d i s > t h m a x  then
   H  a p p e n d ( 2 )
  else
   H  a p p e n d ( 3 )
  end if
end for
return  H ;
Then, the hand and eye behaviour state is estimated from hand and eye data formed in a corresponding categorical time series, which is:
G = ( g 1 , g 2 , g 3 , g n ) , n ( 0 , 1 , 2 , 3 , N )
H = ( h 1 , h 2 , h 3 , h n ) , n ( 0 , 1 , 2 , 3 , N )
N is the maximum length of the categorical sequence. Then, C-RP was built based on those time series to measure the visual–motor synchrony.

3.1.2. Cross Recurrent Plot

C-RP is a matrix that visualises the time coupling between two time series. In definition, it requires that the data have the same unit and phase reconstruction for the states of the two time series to be compared. The phase reconstruction is calculated through the:
V = ( u 1 , u 2 , u i , , u n ( D 1 ) τ )
where u ( i ) is the time series, D is the embedding dimensional and τ is the time-delay, especially for categorical time-series D = 1 and τ = 1 after the phase reconstruction of gaze sequence G and hand sequence H. Then, the C-RP is calculated through the:
R P i j = Θ ( T G i H j )
where Θ is the Heaviside step function with threshold parameter T. The Heaviside step function converts pairs of coordinates whose distance is greater than T into 0 (non-recurrent values) and pairs of coordinates whose distance is less than T into 1 (dark dots in the C-RP plot). For the categorical time series, T is set to 0. The block structures in the C-RP reflect two different hand and eye joint behaviour states:
  • Fixation on AOI with hand drawing: refers to the nature of visual–motor behaviour: that is, the eye is guiding the hand movement following the reference video.
  • Hand moving with no fixation on screen: refers to the state in which the hand and eye are relocated (saccade, move), indicating the hand and gaze are preparing for the oncoming task properties.

3.1.3. Visual–Motor Complexity Score

We applied diagonal-wise CRQA to measure the visual–motor temporal coupling (synchrony) between different hand and eye behaviour states. In particular, we measured the complexity of the visual–motor synchrony between the hand and eye sequence using the Shannon entropy of the probability distribution of the diagonal line on the C-RP.
The Shannon entropy of frequency distribution of the size of diagonal lines of the block structures in the C-RP reflects the complexity of the deterministic structure in the system. The complexity (Shannon entropy) of the C-RP plot is:
C o m = l m i n N p ( l ) ln p ( l )
where P ( l ) is the probability of the diagonal lines reflex of the hand and eye repetitive properties and patterns of dynamic systems. Therefore, the visual–motor complexity score C o m is the result of the hand and eye system reacting to the hand-drawn task during the task. For the result, C o m is low if the diagonal lines tend to all have the same length, signifying that the hand and eye synchrony behaviour is more regular; otherwise, C o m is high if the hand–eye behaviour is more complex.

3.2. Engagement Score

In the hand-drawn task, engagement is defined as the level of participants engaging in drawing imitation, including the rate of gaze fixation on the area of interest (AOI) R f , hand-drawing ratio R d and hand-drawn performance estimated from hand-drawn similarity S i m .
  • Gaze fixation ratio R f : was defined as the ratio of the time the participant’s gaze was fixed on the AOI (reference video) to the total time spent in the experiment.
  • Hand-drawing ratio R d : was defined as the ratio of the time the participant’s hand was in the drawing state to the total time spent in the experiment.
  • Hand-drawn similarity S i m : The drawing performance score estimated from drawing similarity, as VMI had been operationally defined as the ability to copy geometric shapes. From recent research by Lewis et al. [42], they proved the log Hausdorff distance was moderately positively correlated with human judgements of visual dissimilarity. In definition, the Hausdorff distance measures how far two subsets of a metric space are from each other.
    h ( A , B ) = m a x d i s t ( A , B ) , d i s t ( B , A )
    where h ( A , B ) is the Hausdorff distance between two points: set A and B. d i s ( ) represents the Euclidean distance functions. Then, the hand-drawn similarity S i m is defined as the log Hausdorff distance between query trajectory and reference trajectory S i m = h ( q u e r y , r e f e r e n c e ) . Trajectory coordinates have been normalised to [ 0 , 1 ] for both axes.
Furthermore, as the outcome measure, the engagement score E n g is described as the average value of fixation ratio, hand-drawn ratio and hand-drawn, where:
E n g = a v e r a g e ( R f , R d , S i m )

3.3. Statistical Analysis

The engagement is measured through how gaze behaviour, hand movement and drawing outcome engaged with the task properties. In this state, as we only involve healthy participants, healthy adults are supposed to show high engagement. Therefore, our hypothesis is: firstly, there should not be a significant difference between different difficult-level tasks on the obtained drawing outcome score. Secondly, as the task level increased, it naturally needs more gaze and hand behaviour to succeed, so we expect an increase in both gaze and hand ratio.
The visual–motor complexity score uses CRQA to measure the repetitive properties and patterns that arise as a result of the interaction of the two information streams of the hand and eye over time. Hence, the visual–motor score is the reaction of task properties. Our hypothesis is that the easy task property visual–motor system will show lower complexity to finish the task. However, for the hard task, the visual–motor system should increase complexity to adapt to the task property. In other words, as hand–eye coordination adapts to different task demands, we expect a statistically significant difference in visual–motor complexity under different difficulty levels.
The statistical significance for task level differences in visual–motor complexity scores was examined using independent sample t-tests, using the SciPy [43] package. With the significant test alpha = 0.05, only those t-tests whose p-values were lower than the adjusted alpha level were considered significant.

4. Result and Discussion

4.1. Result Comparison of Visual–Motor Complexity Score

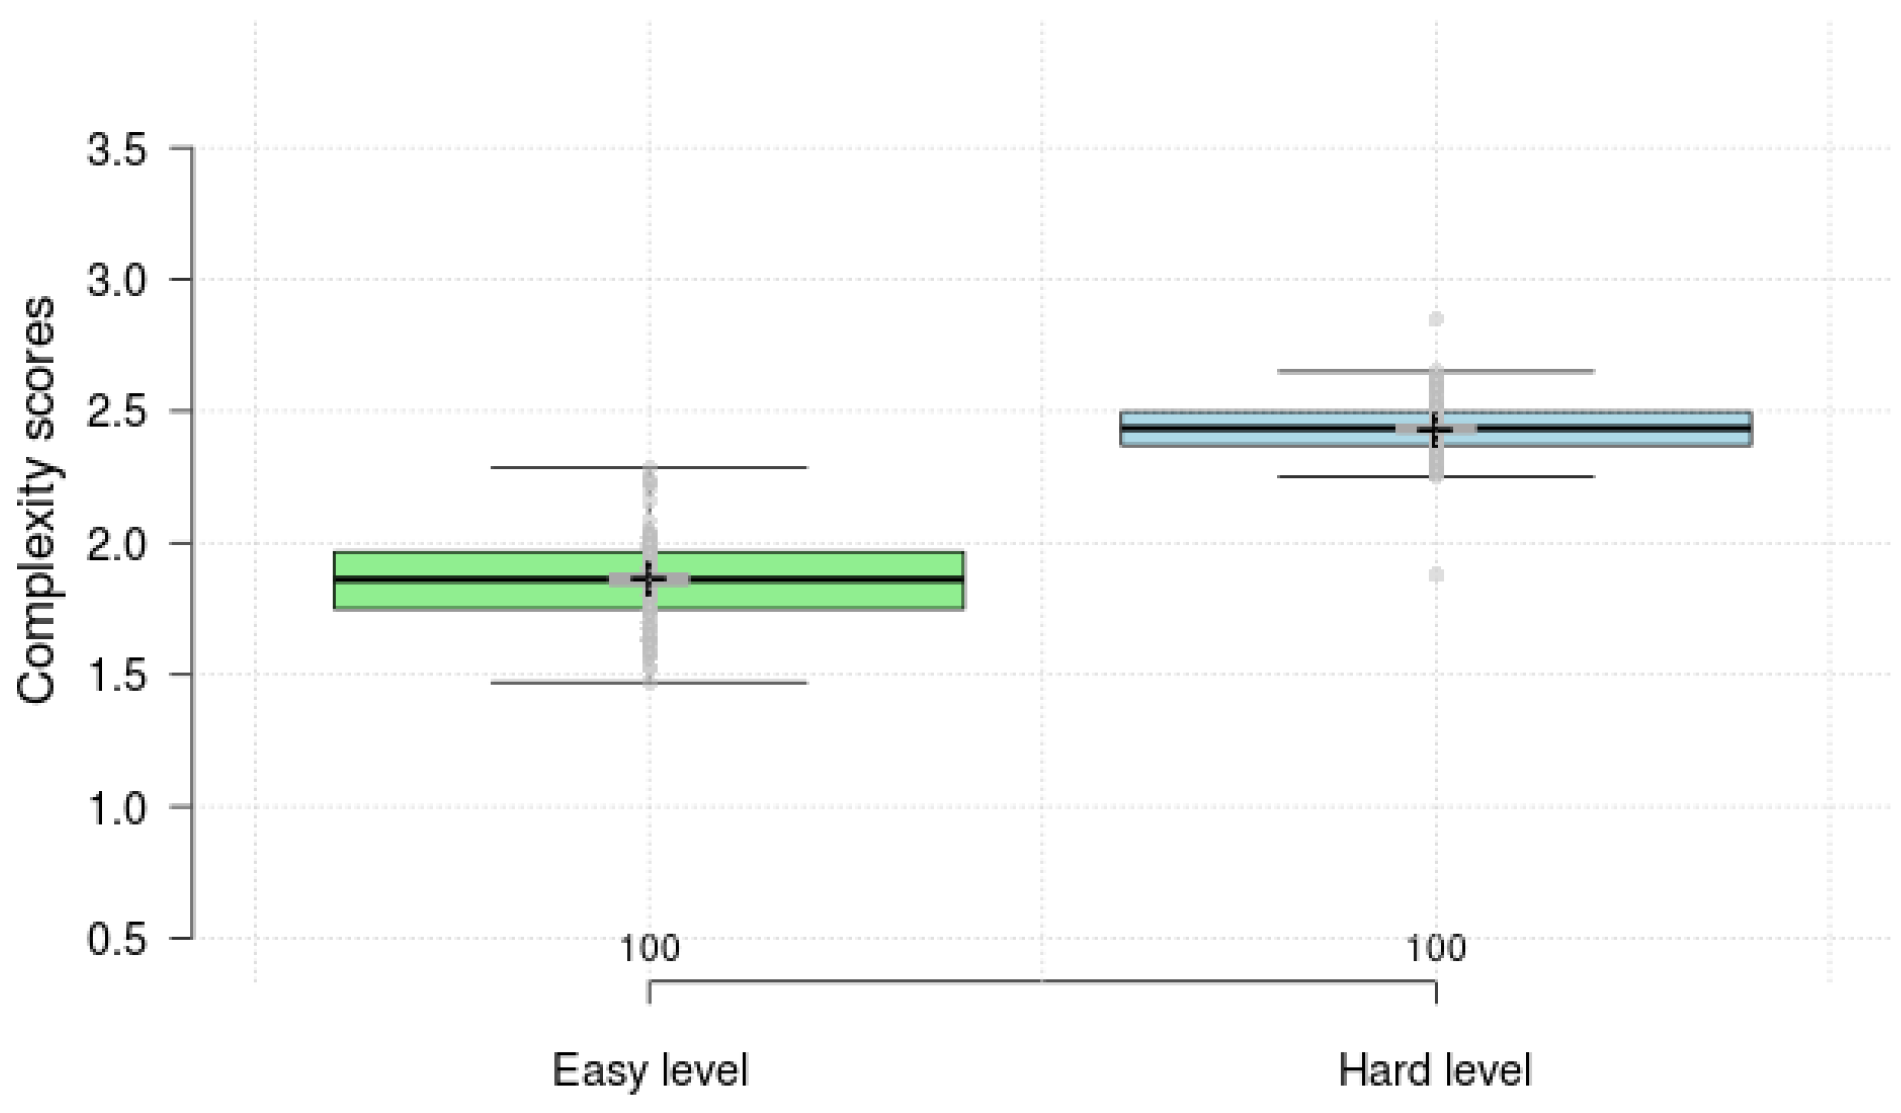
With the hand and eye data collected from the hand-drawn task, based on CRQA, the average complexity from 10 adult participants of easy-level drawing is 1.86, and the average complexity is 2.43 for hard-level drawing. Notably, in Figure 4, the trend over two difficulty groups is clearly illustrated by the box plot, which indicates that the estimated visual–motor complexity result for the hard task is clearly higher than that for the easy one. This also confirms our hypothesis: the interaction task becomes difficult, and the visual–motor complexity will also trend to become more complex to adapt to the interaction environment.
Furthermore, an independent samples t-test was performed to check for statistical significance in the two difficulty groups of visual–motor complexity. As a result, a statistical significance has been found [t-statistic = 28.16, p-value < 0.001] between those two levels of complexity result.
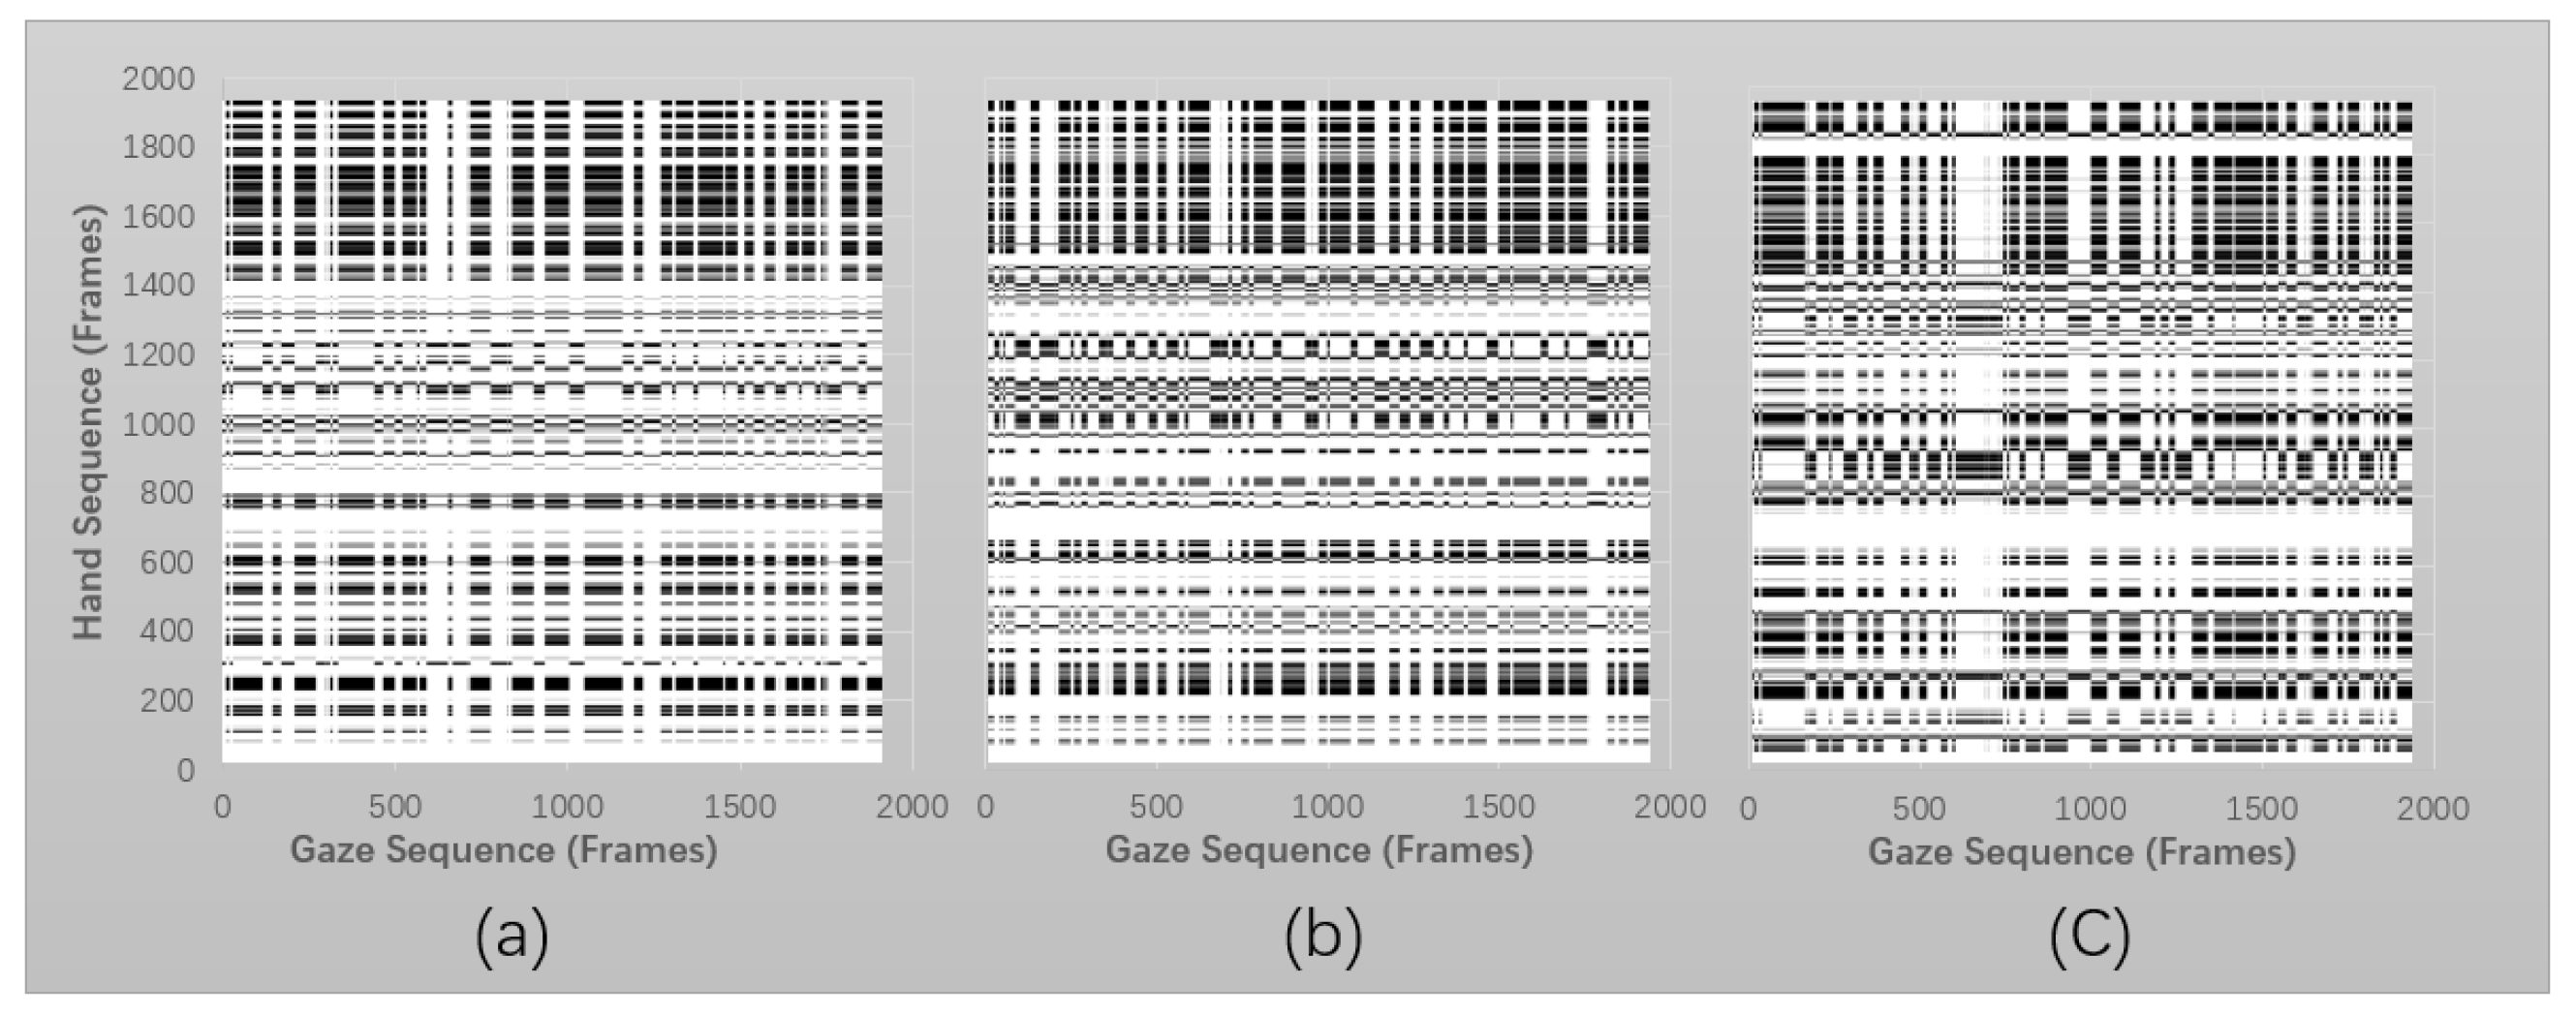
This statistical significance verified the validity of the proposed visual–motor complexity indicator. It suggests that the visual–motor behaviours will trend to more complexity when the interaction task or environment is causing visual–motor behaviours to react more randomly. In contrast, when the task is trending more regularly, the complexity will decrease because the categorised hand–eye sequence is also trending more regularly, resulting in more regular dotted structures in C-PR. Compared with the C-RP result from two levels of drawing (easy level: Figure 5) (hard level: Figure 6), intuitively, the result from the hard level is more complex because it includes more dotted structures, where each dot refers to a coupling that occurs alongside the hand and eye categorical time series. Regarding the result from easy-level drawing, the significant difference is that it has more blank structures, indicating the visual–motor behaviour state in which the gaze does not guide the hand that is drawing. Blank structures may refer to memory; i.e., when participants perform repeat drawing, it is very likely the shape has already been memorised, particularly for a simple task. As a result, we observed the correlated change with the interaction environment change and estimated complexity increase in hard level. That also refers to adaption ability; i.e., to be effective, the system must match (or exceed) the complexity of the environmental behaviours to which it must react with [44]. This means a potential use is when participants fail to perform a correlated change when changing the task demand; it may relate to difficulty with visual–motor skills. To prove that will need a redesigned motion protocol focus on refined task levels and involve hand–eye coordination participants and ASD participants.

4.2. Result Comparison of Engagement Score

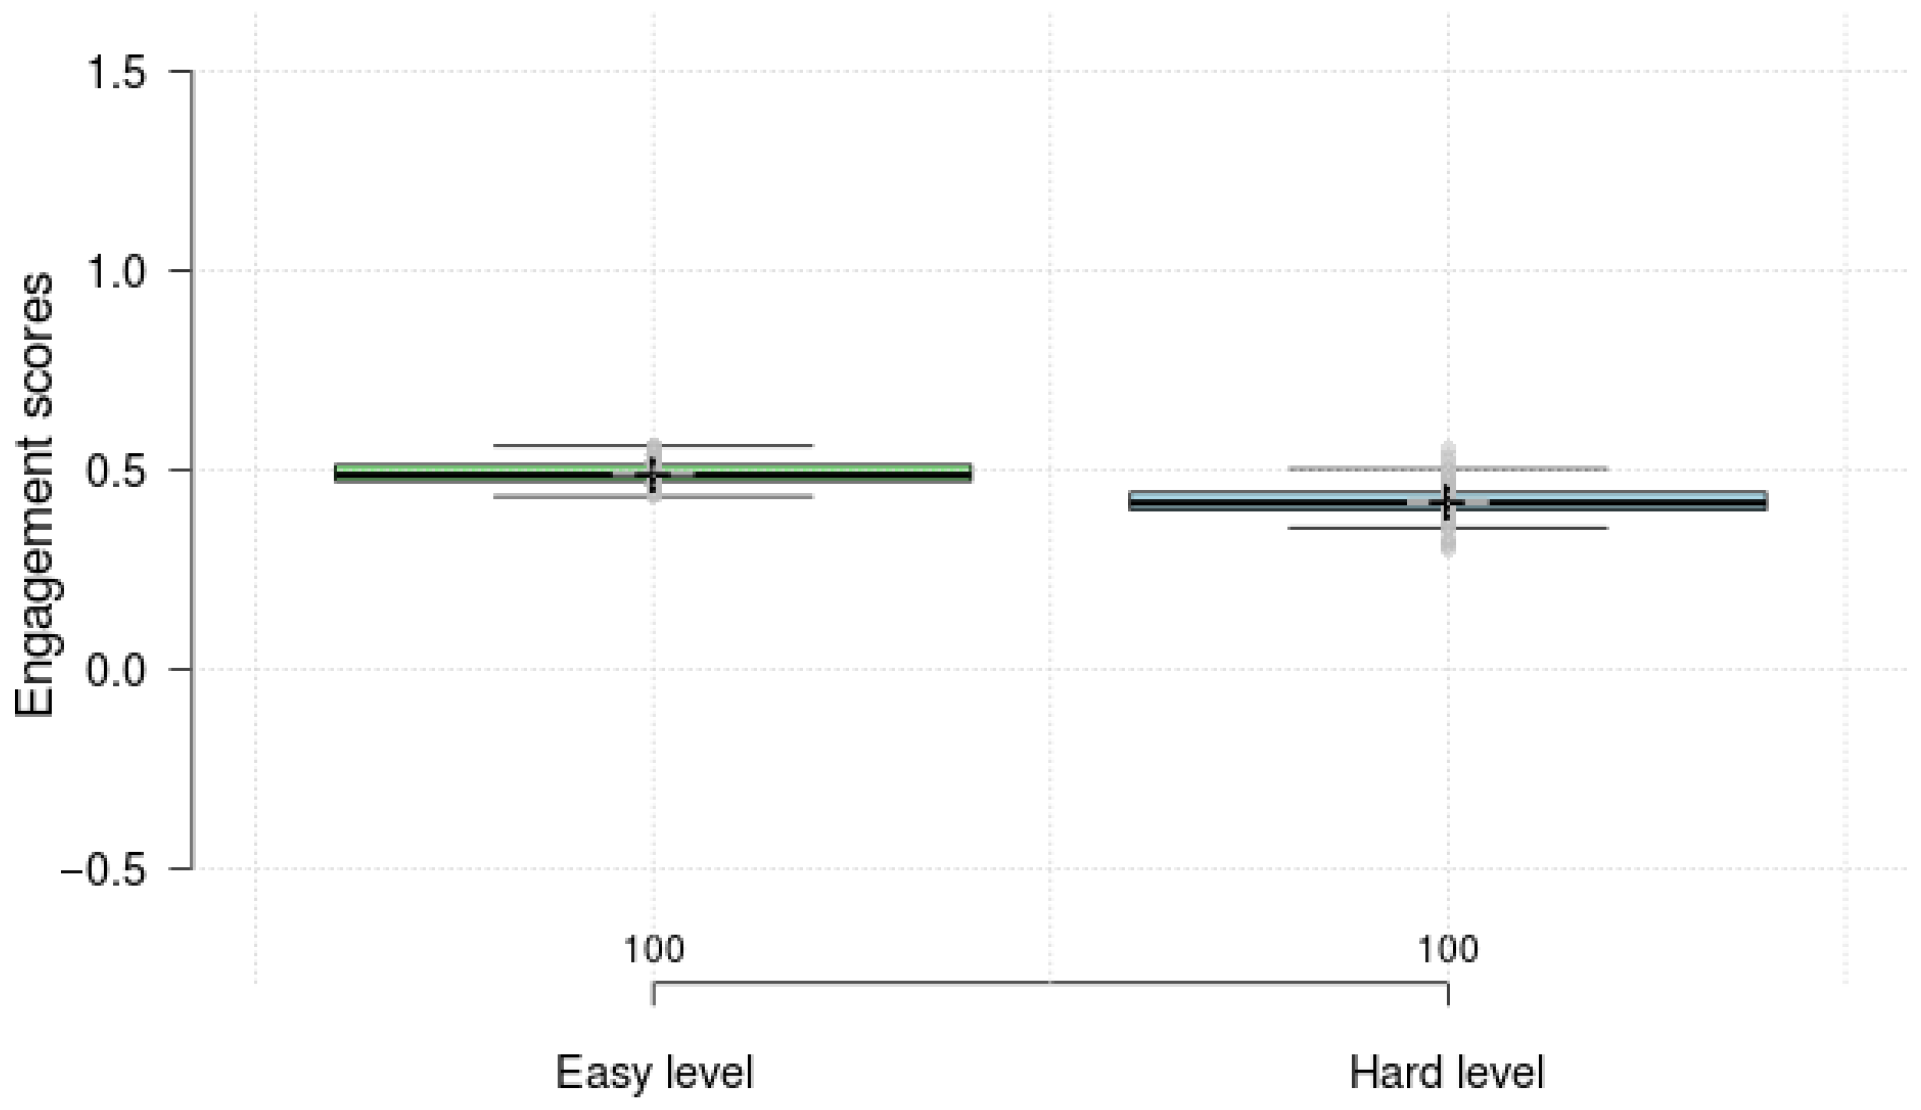
The estimated engagement scores of 10 adult participants are shown in Figure 7; the average value for the easy level is 0.49 and that for the hard level is 0.42. From the statistical t-test result over 10 healthy adults (t-statistic = 13.46 p-value < 0.001), this difference is considered to be statistically significant. Engagement is measured through gaze behaviour, hand movement, and drawing similarity. The drawing similarity negatively correlates with similarity, which measures the maximum difference between two sets of coordinates. The results in terms of engagement showed that the data for adults had higher results in the easy group than in the difficult group, and the distribution of the data showed a greater concentration of scores under the easy task. In contrast, when comparing only the similarity of the drawing results (t-statistic = −0.26, p-value > 0.05), the results were not significantly different between the two groups at different levels of difficulty. Therefore, a certain amount of hand–eye interaction is required to complete the drawing in the actual drawing. Under extreme conditions, fixation at the screen throughout the task indicates abnormal hand–eye interaction and low engagement; the opposite is true. Hence, healthy participants’ engagement should be in the similarity range.

4.3. VMI Evaluation

Based on the result from engagement and complexity, Figure 8 shows our 11 participants’ VMI scores for engagement and complexity from both levels of hand-drawn tasks. Our results show that the healthy adult participants’ scores were concentrated in the upper right region. A healthy child was recruited specifically to serve as a control group for the adult results of the VMI proficiency test. It is clear from the graph that the data from the child group have a lower complexity score than normal adults on both difficulty levels, and the same results can be observed on the engagement score. At the same time, there was no significant difference in the complexity scores on the two tasks for the children’s data compared to the adult data. We believe this is due to the different neurodevelopmental levels of children and adults and that simple tasks for healthy adults are too difficult for child participants. In terms of engagement, the child data showed higher scores on the simple task compared to the difficult task, which is in line with expectations for engagement ratings.
Thus, by comparing the healthy adult data with the healthy child data, our VMI evaluation approach allows for a division between the two groups of participants in terms of score intervals, which supports the feasibility of applying our evaluation metric to autism screening.

5. Conclusions

This study aimed to provide a framework for computer-assisted VMI evaluation based on a drawing imitation protocol. The proposed metrics showed promising results for use as a supplementary explanation for visual–motor ability, which not only helps provide a further understanding of the nature of visual–motor behaviour and social capabilities but also provides a potential biomarker for ASD diagnosis and interventions. Based on the study participants, we utilised statistical significance (t-test) to verify the validity of the proposed visual–motor evaluation method, which paved the way for future use in ASD children. Moreover, combined with different task protocols, this description indicator for visual–motor can provide a more comprehensive analysis of individual VMI ability by coupling social capability and hand and eye synchrony, potentially further revealing adaption ability.
While our study provides some essential considerations regarding motion protocol design, experiment setup, and quantified assessment method, it is important to note certain limitations. The first is the limited number and group of participants. Further studies with larger sample sizes include VMI-deficient participants, children, and ASD participants. Second, the gaze is obtained by a screen-mounted eye-tracker. It shows on-screen gaze behaviour only. Using a wearable eye-tracker or including head pose retrieval from images will improve the representation of categorical time series, which may reflex hand and eye synchrony behaviours more precisely. Finally, the drawing imitation task involves cognition, visual perception, fine motor control, and memory. As this study has only analysed one aspect of hand–eye behaviour synchrony, many other valuable biomarkers are waiting to be discovered.

Author Contributions

Conceptualization, D.Z. and B.L.; methodology, B.L.; software, D.Z.; hand-drawn design, J.G.; data collection, B.L.; validation, D.Z., B.L. and J.G.; writing—original draft preparation, D.Z.; writing—review and editing, B.L.; visualization, Y.H.; supervision, H.L. All authors have read and agreed to the published version of the manuscript.

Funding

This research was funded by China Scholarship Council grant number 202104910153.

Institutional Review Board Statement

The study was conducted in accordance with the Declaration of Helsinki and approved by the University of Portsmouth Ethics Committee (TECH2022-D.Z-02, 29 July 2022).

Informed Consent Statement

Informed consent was obtained from all subjects involved in the study.

Data Availability Statement

The data presented in this study are available on request from the corresponding author. The data are not publicly available due to privacy.

Conflicts of Interest

The authors declare no conflict of interest. The funders had no role in the design of the study; in the collection, analyses, or interpretation of data; in the writing of the manuscript; or in the decision to publish the results.

References

  1. Kaiser, M.L.; Albaret, J.M.; Doudin, P.A. Relationship between visual-motor integration, eye-hand coordination, and quality of handwriting. J. Occup. Ther. Sch. Early Interv. 2009, 2, 87–95. [Google Scholar] [CrossRef]
  2. Shin, S.; Crapse, T.B.; Mayo, J.P.; Sommer, M.A. Visuomotor Integration. Encycl. Neurosci. 2009, 4354–4359. [Google Scholar] [CrossRef]
  3. Licari, M.K.; Alvares, G.A.; Varcin, K.; Evans, K.L.; Cleary, D.; Reid, S.L.; Glasson, E.J.; Bebbington, K.; Reynolds, J.E.; Wray, J.; et al. Prevalence of motor difficulties in autism spectrum disorder: Analysis of a population-based cohort. Autism Res. 2020, 13, 298–306. [Google Scholar] [CrossRef]
  4. Bhat, A.N. Is motor impairment in autism spectrum disorder distinct from developmental coordination disorder? A report from the SPARK study. Phys. Ther. 2020, 100, 633–644. [Google Scholar] [CrossRef] [PubMed]
  5. Lloyd, M.; MacDonald, M.; Lord, C. Motor skills of toddlers with autism spectrum disorders. Autism 2013, 17, 133–146. [Google Scholar] [CrossRef] [Green Version]
  6. Patterson, J.W.; Armstrong, V.; Duku, E.; Richard, A.; Franchini, M.; Brian, J.; Zwaigenbaum, L.; Bryson, S.E.; Sacrey, L.A.R.; Roncadin, C.; et al. Early trajectories of motor skills in infant siblings of children with autism spectrum disorder. Autism Res. 2022, 15, 481–492. [Google Scholar] [CrossRef]
  7. Chukoskie, L.; Townsend, J.; Westerfield, M. Motor skill in autism spectrum disorders: A subcortical view. Int. Rev. Neurobiol. 2013, 113, 207–249. [Google Scholar] [PubMed]
  8. Zakaria, N.K.; Tahir, N.M.; Jailani, R. Experimental Approach in Gait Analysis and Classification Methods for Autism spectrum Disorder: A Review. Int. J. 2020, 9, 3995–4005. [Google Scholar] [CrossRef]
  9. Studenka, B.E.; Myers, K. Preliminary Evidence That Motor Planning Is Slower and More Difficult for Children with Autism Spectrum Disorder During Motor Cooperation. Mot. Control 2020, 24, 127–149. [Google Scholar] [CrossRef] [PubMed]
  10. Iverson, J.M.; Shic, F.; Wall, C.A.; Chawarska, K.; Curtin, S.; Estes, A.; Gardner, J.M.; Hutman, T.; Landa, R.J.; Levin, A.R.; et al. Early motor abilities in infants at heightened versus low risk for ASD: A Baby Siblings Research Consortium (BSRC) study. J. Abnorm. Psychol. 2019, 128, 69–80. [Google Scholar] [CrossRef]
  11. West, K.L. Infant motor development in autism spectrum disorder: A synthesis and meta-analysis. Child Dev. 2019, 90, 2053–2070. [Google Scholar] [CrossRef] [PubMed]
  12. Lim, Y.H.; Licari, M.; Spittle, A.J.; Watkins, R.E.; Zwicker, J.G.; Downs, J.; Finlay-Jones, A. Early motor function of children with autism spectrum disorder: A systematic review. Pediatrics 2021, 147, e2020011270. [Google Scholar] [CrossRef] [PubMed]
  13. Nebel, M.B.; Eloyan, A.; Nettles, C.A.; Sweeney, K.L.; Ament, K.; Ward, R.E.; Choe, A.S.; Barber, A.D.; Pekar, J.J.; Mostofsky, S.H. Intrinsic visual-motor synchrony correlates with social deficits in autism. Biol. Psychiatry 2016, 79, 633–641. [Google Scholar] [CrossRef] [Green Version]
  14. Craig, F.; Lorenzo, A.; Lucarelli, E.; Russo, L.; Fanizza, I.; Trabacca, A. Motor competency and social communication skills in preschool children with autism spectrum disorder. Autism Res. 2018, 11, 893–902. [Google Scholar] [CrossRef]
  15. Gandotra, A.; Kotyuk, E.; Szekely, A.; Kasos, K.; Csirmaz, L.; Cserjesi, R. Fundamental movement skills in children with autism spectrum disorder: A systematic review. Res. Autism Spectr. Disord. 2020, 78, 101632. [Google Scholar] [CrossRef]
  16. Lidstone, D.E.; Mostofsky, S.H. Moving toward understanding autism: Visual-motor integration, imitation, and social skill development. Pediatr. Neurol. 2021, 122, 98–105. [Google Scholar] [CrossRef] [PubMed]
  17. Lidstone, D.E.; Rochowiak, R.; Pacheco, C.; Tunçgenç, B.; Vidal, R.; Mostofsky, S.H. Automated and scalable Computerized Assessment of Motor Imitation (CAMI) in children with Autism Spectrum Disorder using a single 2D camera: A pilot study. Res. Autism Spectr. Disord. 2021, 87, 101840. [Google Scholar] [CrossRef]
  18. Vabalas, A.; Gowen, E.; Poliakoff, E.; Casson, A.J. Applying machine learning to kinematic and eye movement features of a movement imitation task to predict autism diagnosis. Sci. Rep. 2020, 10, 8346. [Google Scholar] [CrossRef]
  19. Carsone, B.; Green, K.; Torrence, W.; Henry, B. Systematic Review of Visual Motor Integration in Children with Developmental Disabilities. Occup. Ther. Int. 2021, 2021, 1801196. [Google Scholar] [CrossRef]
  20. Mazzolini, D.; Mignone, P.; Pavan, P.; Vessio, G. An easy-to-explain decision support framework for forensic analysis of dynamic signatures. Forensic Sci. Int. Digit. Investig. 2021, 38, 301216. [Google Scholar] [CrossRef]
  21. Whitten, P.; Wolff, F.; Papachristou, C. Explainable Neural Network Recognition of Handwritten Characters. In Proceedings of the 2023 IEEE 13th Annual Computing and Communication Workshop and Conference (CCWC), Las Vegas, NV, USA, 8–11 March 2023; pp. 176–182. [Google Scholar]
  22. Gozzi, N.; Malandri, L.; Mercorio, F.; Pedrocchi, A. XAI for myo-controlled prosthesis: Explaining EMG data for hand gesture classification. Knowl.-Based Syst. 2022, 240, 108053. [Google Scholar] [CrossRef]
  23. Lukos, J.R.; Snider, J.; Hernandez, M.E.; Tunik, E.; Hillyard, S.; Poizner, H. Parkinson’s disease patients show impaired corrective grasp control and eye–hand coupling when reaching to grasp virtual objects. Neuroscience 2013, 254, 205–221. [Google Scholar] [CrossRef] [Green Version]
  24. Ran, H.; Ning, X.; Li, W.; Hao, M.; Tiwari, P. 3D human pose and shape estimation via de-occlusion multi-task learning. Neurocomputing 2023, 548, 126284. [Google Scholar] [CrossRef]
  25. Tian, S.; Li, W.; Ning, X.; Ran, H.; Qin, H.; Tiwari, P. Continuous Transfer of Neural Network Representational Similarity for Incremental Learning. Neurocomputing 2023, 545, 126300. [Google Scholar] [CrossRef]
  26. Lee, K.; Junghans, B.M.; Ryan, M.; Khuu, S.; Suttle, C.M. Development of a novel approach to the assessment of eye–hand coordination. J. Neurosci. Methods 2014, 228, 50–56. [Google Scholar] [CrossRef]
  27. Dong, X.; Ning, X.; Xu, J.; Yu, L.; Li, W.; Zhang, L. A Recognizable Expression Line Portrait Synthesis Method in Portrait Rendering Robot. IEEE Trans. Comput. Soc. Syst. 2023, 1–11. [Google Scholar] [CrossRef]
  28. Casellato, C.; Gandolla, M.; Crippa, A.; Pedrocchi, A. Robotic set-up to quantify hand-eye behavior in motor execution and learning of children with autism spectrum disorder. In Proceedings of the 2017 International Conference on Rehabilitation Robotics (ICORR), London, UK, 17–20 July 2017; pp. 953–958. [Google Scholar]
  29. Valevicius, A.M.; Boser, Q.A.; Lavoie, E.B.; Murgatroyd, G.S.; Pilarski, P.M.; Chapman, C.S.; Vette, A.H.; Hebert, J.S. Characterization of normative hand movements during two functional upper limb tasks. PLoS ONE 2018, 13, e0199549. [Google Scholar] [CrossRef]
  30. Coco, M.I.; Dale, R. Cross-recurrence quantification analysis of categorical and continuous time series: An R package. Front. Psychol. 2014, 5, 510. [Google Scholar] [CrossRef] [Green Version]
  31. López Pérez, D.; Leonardi, G.; Niedźwiecka, A.; Radkowska, A.; Rączaszek-Leonardi, J.; Tomalski, P. Combining recurrence analysis and automatic movement extraction from video recordings to study behavioral coupling in face-to-face parent-child interactions. Front. Psychol. 2017, 8, 2228. [Google Scholar] [CrossRef] [Green Version]
  32. de Jonge-Hoekstra, L.; Van Der Steen, S.; Cox, R.F. Movers and shakers of cognition: Hand movements, speech, task properties, and variability. Acta Psychol. 2020, 211, 103187. [Google Scholar] [CrossRef]
  33. Fusaroli, R.; Konvalinka, I.; Wallot, S. Analyzing social interactions: The promises and challenges of using cross recurrence quantification analysis. In Translational Recurrences; Springer: Berlin/Heidelberg, Germany, 2014; pp. 137–155. [Google Scholar]
  34. Villamor, M.M.; Rodrigo, M.; Mercedes, T. Gaze collaboration patterns of successful and unsuccessful programming pairs using cross-recurrence quantification analysis. Res. Pract. Technol. Enhanc. Learn. 2019, 14, 25. [Google Scholar] [CrossRef] [Green Version]
  35. Liu, Q.; Wang, Q.; Li, X.; Gong, X.; Luo, X.; Yin, T.; Liu, J.; Yi, L. Social synchronization during joint attention in children with autism spectrum disorder. Autism Res. 2021, 14, 2120–2130. [Google Scholar] [CrossRef] [PubMed]
  36. Zhang, D.; Toptan, C.M.; Zhao, S.; Zhang, G.; Liu, H. ASD Children Adaption Behaviour Assessment via Hand Movement Properties: A RoadMap. In Proceedings of the UK Workshop on Computational Intelligence, Virtual Event, 22–23 June 2021; pp. 475–480. [Google Scholar]
  37. Englund, J.A.; Decker, S.L.; Allen, R.A.; Roberts, A.M. Common cognitive deficits in children with attention-deficit/hyperactivity disorder and autism: Working memory and visual-motor integration. J. Psychoeduc. Assess. 2014, 32, 95–106. [Google Scholar] [CrossRef]
  38. Green, R.R.; Bigler, E.D.; Froehlich, A.; Prigge, M.B.; Travers, B.G.; Cariello, A.N.; Anderson, J.S.; Zielinski, B.A.; Alexander, A.; Lange, N.; et al. Beery VMI performance in autism spectrum disorder. Child Neuropsychol. 2016, 22, 795–817. [Google Scholar] [CrossRef] [Green Version]
  39. Rosenblum, S.; Ben-Simhon, H.A.; Meyer, S.; Gal, E. Predictors of handwriting performance among children with autism spectrum disorder. Res. Autism Spectr. Disord. 2019, 60, 16–24. [Google Scholar] [CrossRef]
  40. Zhang, F.; Bazarevsky, V.; Vakunov, A.; Tkachenka, A.; Sung, G.; Chang, C.L.; Grundmann, M. Mediapipe hands: On-device real-time hand tracking. arXiv 2020, arXiv:2006.10214. [Google Scholar]
  41. Rawald, T.; Sips, M.; Marwan, N. PyRQA—Conducting recurrence quantification analysis on very long time series efficiently. Comput. Geosci. 2017, 104, 101–108. [Google Scholar] [CrossRef]
  42. Lewis, M.; Balamurugan, A.; Zheng, B.; Lupyan, G. Characterizing Variability in Shared Meaning through Millions of Sketches. In Proceedings of the Annual Meeting of the Cognitive Science Society, Vienna, Austria, 26–29 July 2021; Volume 43. Available online: https://escholarship.org/uc/item/702482s5 (accessed on 6 November 2022).
  43. Virtanen, P.; Gommers, R.; Oliphant, T.E.; Haberland, M.; Reddy, T.; Cournapeau, D.; Burovski, E.; Peterson, P.; Weckesser, W.; Bright, J.; et al. SciPy 1.0: Fundamental Algorithms for Scientific Computing in Python. Nat. Methods 2020, 17, 261–272. [Google Scholar] [CrossRef] [Green Version]
  44. Allen, B.; Stacey, B.C.; Bar-Yam, Y. Multiscale information theory and the marginal utility of information. Entropy 2017, 19, 273. [Google Scholar] [CrossRef] [Green Version]
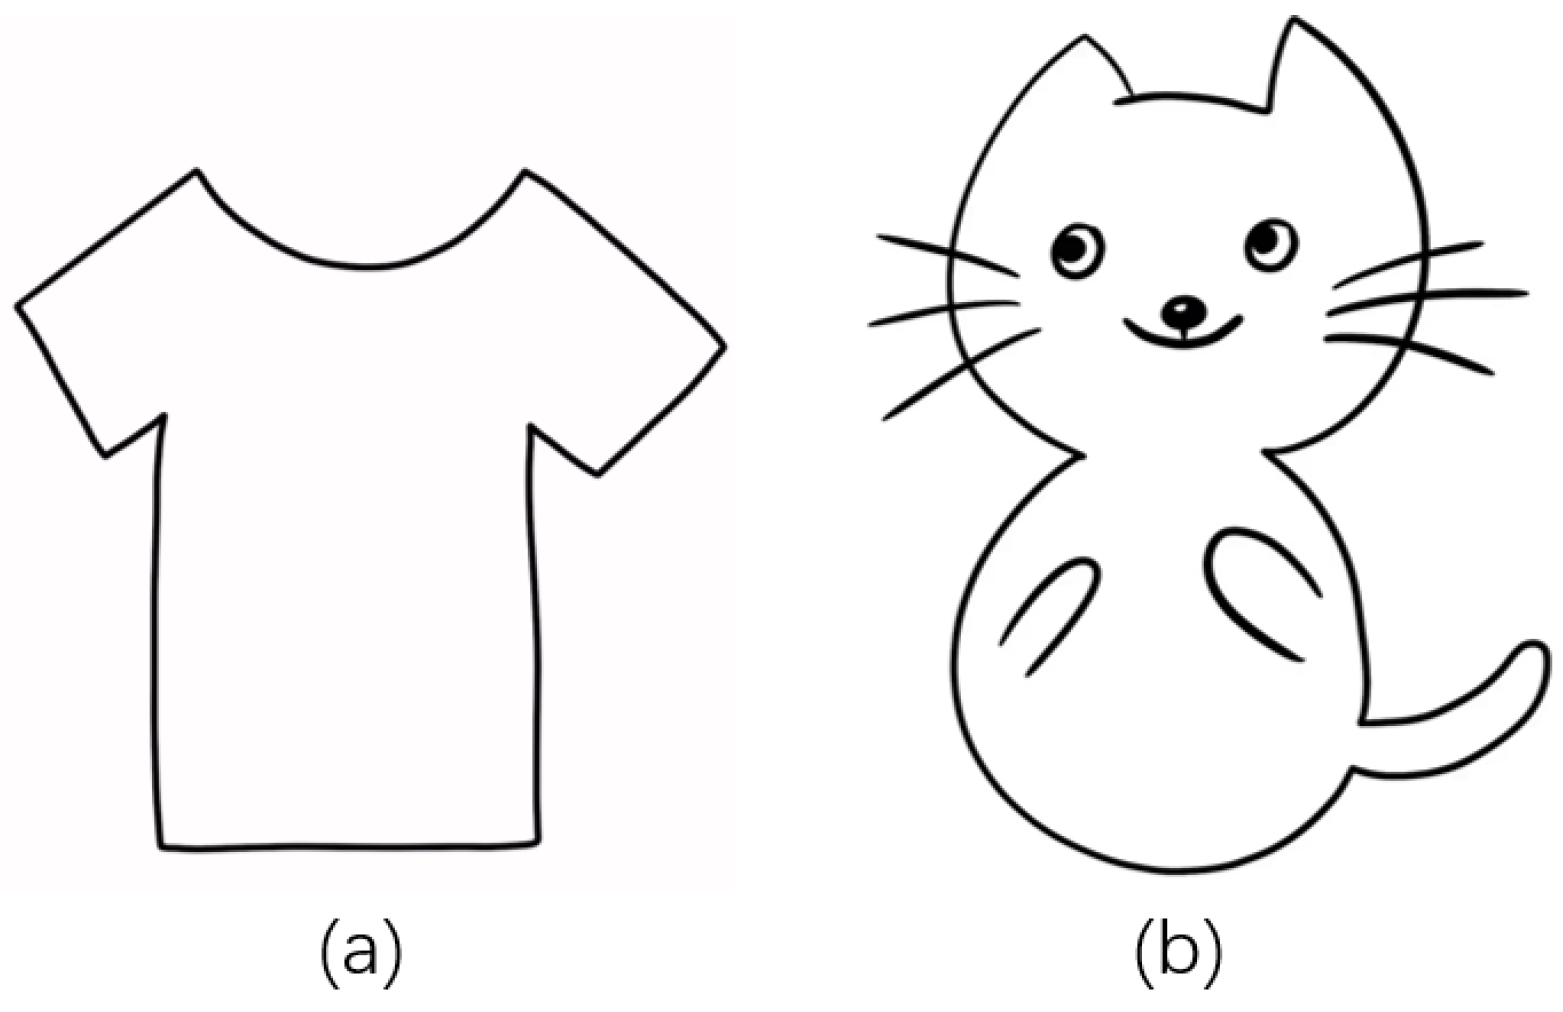
Figure 1. The two-level hand-drawn imitation references: (a) Easy level (T-shirt), (b) Hard level (Cat).
Electronics 12 02776 g001
Figure 2. (a) Skeleton estimate result from top-mounted camera view. (b) Mediapipe Hand 21 joint model; 0. wrist, 1. thumb base, 2. thumb first joint, 3. thumb second joint, 4. thumb tip, 5. index base, 6. index first joint, 7. index second joint, 8. index tip, 9. middle base, 10. middle first joint, 11. middle second joint, 12. middle tip, 13. ring base, 14. ring first joint, 15. ring second joint, 16. ring tip, 17. pinky base, 18. pinky first joint, 19. pinky second joint, 20. pinky tip.
Electronics 12 02776 g002
Figure 3. Workflow of the proposed VMI evaluation method.
Electronics 12 02776 g003
Figure 4. Box-plot for visual–motor complexity over two level hand-drawn tasks.
Electronics 12 02776 g004
Figure 5. Easy-level hand-drawn task C-RP visualisation from three participants. (a) Participant 1. (b) Participant 2. (c) Participant 3.
Electronics 12 02776 g005
Figure 6. Hard-level hand-drawn task C-RP visualisation from three participants. (a) Participant 1. (b) Participant 2. (c) Participant 3.
Electronics 12 02776 g006
Figure 7. Box plot for visual–motor engagement over two level hand-drawn tasks.
Electronics 12 02776 g007
Figure 8. VMI evaluation based on engagement and complexity.
Electronics 12 02776 g008
Disclaimer/Publisher’s Note: The statements, opinions and data contained in all publications are solely those of the individual author(s) and contributor(s) and not of MDPI and/or the editor(s). MDPI and/or the editor(s) disclaim responsibility for any injury to people or property resulting from any ideas, methods, instructions or products referred to in the content.