Article

Medical Image Fusion Using SKWGF and SWF in Framelet Transform Domain

1
School of Computer Science and Technology, Xi’an University of Posts and Telecommunications, Xi’an 710121, China
2
College of Cryptography Engineering, Engineering University of PAP, Xi’an 710018, China
*
Author to whom correspondence should be addressed.
Electronics 2023, 12(12), 2659; https://doi.org/10.3390/electronics12122659
Submission received: 17 April 2023 / Revised: 3 June 2023 / Accepted: 10 June 2023 / Published: 13 June 2023
(This article belongs to the Special Issue Modern Computer Vision and Image Analysis)

Abstract

:
Accurately localizing and describing patients’ lesions has long been considered a crucial aspect of clinical diagnosis. The fusion of multimodal medical images provides a feasible solution to the above problem. Unfortunately, the trade-off between the fusion performance and heavy computation overhead remains a challenge. In this paper, a novel and effective fusion method for multimodal medical images is proposed. Firstly, framelet transform (FT) is introduced to decompose the source images into a series of low and high frequency sub-images. Next, we utilize the benefits of both steering kernel weighted guided filtering and side window filtering to successfully fuse sub-images. Finally, the inverse FT is employed to reconstruct the final fused image. To verify the effectiveness of the proposed fusion method, we fused several pairs of medical images covering different modalities in simulation experiments. The experimental results demonstrate that the proposed method yields better performance than current representative ones in terms of both visual quality and quantitative evaluation.

1. Introduction

As imaging technology continues to advance, it is now possible to obtain a wider variety of medical images with diverse modalities. This enables us to provide and describe lesion information from multiple angles, enhancing our overall understanding. Specifically, common medical source images can be classified into two types, anatomical images and functional images [1]. As the representatives of the former, the computed tomography (CT) image is very sensitive to dense structures such as bones and implants, whereas the information of soft tissues cannot be visualized. The magnetic resonance image (MRI) does well in displaying the anatomical structure of soft tissues with a high spatial resolution. However, the description of the dense structure in the MRI is poor. Unlike the anatomical image, functional images such as the positron emission tomography (PET) and single-photon emission computed tomography (SPECT) images are applied to reveal the biological activity of cells and the metabolic activity of tissues or organs. They are, therefore, commonly used in characterizing tumor and organ blood flow. Due to the inherent advantages and disadvantages of each imaging modality, fusing medical images with multiple modalities can provide a feasible solution to merge representative and complementary information from different images into a single output. This can lead to improved visualization and more accurate diagnosis.
In the last few decades, a variety of fusion methods [2,3,4,5,6,7,8,9,10,11,12,13,14,15,16,17,18,19,20,21,22,23,24,25,26,27,28,29,30,31,32] on medical images have been proposed and manipulated, and these can be broadly classified into three levels, including pixel-level, feature-level and decision-level. Pixel-level fusion methods have become increasingly popular due to their simple implementation and relatively low computational complexity, among other advantages [2].
Often, the pixel-level fusion can be conducted in the spatial or transform domain. Spatial domain fusion focuses on the use of the local features of the image, and the common methods include simple averaging, maximum choosing, principal component analysis (PCA) [3,4] and so on. The spatial domain-based fused image, however, often suffers from contrast reduction and spectrum distortion. As a result, research has paid more attention to transform domain fusion.
Early classical transform domain schemes for image fusion include Laplacian pyramid transform and discrete wavelet transform (DWT) [5], among others. However, both methods have limitations in terms of directionality and contour representation. To address these issues, numerous enhanced versions have been introduced over the past decade. Li et al. [6] introduced Laplacian re-decomposition to complete the fusion of medical images. Some improved versions of DWT such as dual tree complex wavelet transform (DT-CWT) [7], nonsubsampled rotated complex wavelet transform (NSRCxWT) [8] and discrete stationary wavelet transform (DSWT) [9,10] were presented to complete the fusion of medical images. In comparison with DWT, these updated versions possess both the redundancy feature and the shift-invariance property, effectively preventing the Gibbs phenomenon found in DWT. To capture more detailed contour information, the contourlet and shearlet transforms were proposed sequentially. However, artifacts frequently occur in the fused image due to down-sampling. In order to overcome the above defect, the corresponding improved versions, namely non-subsampled contourlet transform (NSCT) [11] and non-subsampled shearlet transform (NSST) [12], were proposed. Owing to the simpler structure and lower computational cost, many recent fusion methods [13,14,15,16] on multimodal medical images are based on NSST rather than NSCT.
It is noteworthy that the fusion quality does not depend only on the fusion scheme, but also involves the fusion strategy. Take NSST for example. A low-frequency sub-image (LFI) and a series of high-frequency sub-images (HFIs) can be obtained via NSST. A reasonable strategy should ensure that the energy of LFI can be maximized, and the edges and details in HFIs are preserved as well. In the past decade, a great many representative fusion strategies, including the dictionary learning model [17,18], gray wolf optimization [19], fuzzy theory [20], pulse coupled neural network (PCNN) [21,22], sparse representation [23,24], guided filter (GF) [25,26], structure tensor [27] and so on, were successfully used to fuse medical images.
Further research has shown that both transform domain schemes and recent strategies are promising in the field of multimodal medical image fusion. Under this background, a series of hybrid fusion methods combining both advantages have been presented in the past several years. For example, Yin et al. [15] provided a novel fusion method based on NSST and parameter-adaptive PCNN. Zhu et al. [28] utilized NSCT and combined it with phase congruency and local Laplacian energy to fuse medical images. Modified choosing maximum, sum of modified Laplacian (SML) and NSST were combined to complete the fusion of medical images in [29]. Ullah et al. [30] successfully applied fuzzy theory and SML in the NSST domain for the fusion of medical images. Cao et al. [31] presented a fusion method that uses particle swarm optimization to optimize fuzzy logic in the NSST domain. An ensemble of GF and NSST was constructed to deal with the medical image fusion in [32].
Deep learning, an important branch of neural networks, has recently become a hotspot in the field of image fusion. It can be applied in the transform domain or combined with other schemes. However, the deep learning-based scheme commonly suffers from a complex framework and huge computational costs. Additionally, the scarcity of medical image datasets hinders its widespread application in the field of medical image fusion.
After conducting extensive research on recently published literature, we have concluded that transformed domain methods are still dominant in the field of medical image fusion. However, several significant issues have emerged and cannot be ignored. First, the current typical transform domain schemes such as NSCT and NSST both consume enormous computational resources, which directly limit their real-time application. Another significant factor that influences the final fusion performance is the current popular fusion strategies, which still have significant room for improvement. In this context, we desire to construct a new fusion method for medical images with novel transform domain fusion schemes and strategies.
Considering the presented literature review, the authors propose a novel fusion method to fuse multimodal medical images. Firstly, framelet transform is applied to decompose the source images into LFIs and HFIs. Secondly, an improved GF is employed to fuse LFIs. In addition, side window filtering (SWF) is used to complete the HFIs fusion. Finally, the inverse framelet transform is utilized to reconstruct the final fused image.
The remainder of this paper is structured as follows: In the Section 2, we will briefly review the preliminaries. Then, we will present the details of the proposed fusion method. Afterward, we will conduct a series of simulation experiments to verify the effectiveness of the proposed method. Finally, we will conclude this work.

2. Preliminaries

In this section, the basic models on which the proposed method is based are briefly reviewed, including framelet transform, guided filter and side window filter.

2.1. Framelet Transform

As mentioned in the Section 1, NSCT and NSST have been regarded as effective tools in fusing medical images. However, they both suffers from huge computational costs. To this end, we sought to achieve a trade-off between fusion performance and heavy computation overhead. In this paper, framelet transform (FT) [33], with a much simpler structure, is applied to replace NSCT or NSST.
Structurally, great similarities exist between FT and DWT, both of which have one scaling function denoted by φ(t) and much lower computational overheads. Unlike DWT, which has only one wavelet function ψ(t), FT owns two counterparts, namely ψ1(t) and ψ2(t). Therefore, if FT is applied to the field of 2D image fusion where x and y denote two directions, one scaling function and eight wavelet functions can be generated via the convolution between φ(t) and (ψ1(t), ψ2(t)) as follows. Obviously, FT also has the property of multi-scale and multi-direction similar to NSCT and NSST, which is helpful in representing and describing the main and detailed information from various angles.
φ ( x , y ) = φ ( x ) * φ ( y ) ψ 1 ( x , y ) = φ ( x ) * ψ 1 ( y ) , ψ 2 ( x , y ) = φ ( x ) * ψ 2 ( y ) ψ 3 ( x , y ) = ψ 1 ( x ) * φ ( y ) , ψ 4 ( x , y ) = ψ 1 ( x ) * ψ 1 ( y ) ψ 5 ( x , y ) = ψ 1 ( x ) * ψ 2 ( y ) , ψ 6 ( x , y ) = ψ 2 ( x ) * φ ( y ) ψ 7 ( x , y ) = ψ 2 ( x ) * ψ 1 ( y ) , ψ 8 ( x , y ) = ψ 2 ( x ) * ψ 2 ( y )

2.2. Guided Filter

As a representative of edge-preserving filtering models, guided filter (GF) [34] has been widely applied in the field of image processing. Unlike the traditional isotropic filters, GF adopts a guide image to filter the input image as follows.
Q i = j ω i W i j ( I ) P j
where I, P and Q denote the guide image, the input image and the output image, respectively. ωi is a square neighborhood centered at pixel i. Wij(I) represents the weights determined by the guide image I during the weighted calculation. Note that I = P is allowed.
There is a local linear relation between the guide image I and the output image Q, which is beneficial for the guide image I to keep the edge information. The linear relation can be described as
Q i = a k I i + b k ,     i ω k
where ak and bk are two variables in the neighborhood ω centered at pixel i.
For simplicity, the output image Q can be regarded as the degraded image resulting from the noise contamination N in the input image P, namely Q = PN. Thus, the optimization objective function can be expressed by
arg min i ω k ( Q i P i ) 2 = arg min i ω k ( a k I i + b k P i ) 2
Further, a regularization parameter ε is applied to indicate the blurring extent of GF. Therefore, Equation (4) can be rewritten as
E ( a k , b k ) = i ω k ( ( a k I i + b k P i ) 2 + ε a k 2 )
Based on Equation (3), the output image Q can be obtained as long as ak and bk are computed. From Equation (5), the above two variables can be estimated as
a k = 1 | ω | i ω k I i P i μ k P ¯ k σ k 2 + ε
b k = P ¯ k a k μ k
P ¯ k = 1 | ω | i ω k P i
where μk and σ k 2 denote the mean and the variance of the guide image I within the neighborhood ωk, respectively. |ω| indicates the number of pixels in ωk, and P ¯ k is the mean of the gray values within ωk.
Note that each pixel is commonly described by multiple linear functions, so the mean of ak and the mean of bk are both required, which can be denoted by a ¯ k and b ¯ k , respectively.
The output image Q can be obtained by
Q i = a ¯ k I i + b ¯ k ,     i ω k

2.3. Side Window Filter

Traditional filters often align the pixel to be processed with the center of a local window. Thus, the intensity of the central pixel can be approximated by the pixels in the window via certain rules. Although the above filters have several superiorities including simple implementation and low complexity, they often suffer from information loss especially when the pixel to be processed is located at the edge. To this end, Yin et al. [35] constructed a novel filter model called the side window filter (SWF), which consists of three parameters, namely θ, ρ and r. θ decides the angle between the local window and the horizontal direction, r represents the radius of the filter window and ρ takes the value in the set {0, r}. Compared with traditional filters, SWF can create multiple local windows with varying angles and radii, which helps to preserve the information of the pixel being processed, regardless of whether it is located on an edge or not.
For simplicity, the number of angles is commonly set as eight with an interval of 45 degrees. Here, the above eight angles are denoted by A1~A8, and the SWF function is supposed to be F. Accordingly, eight different outputs can be obtained as
Y i θ , ρ , r = F ( X i , θ , ρ , r )
where X and Y denote the input image and the output image filtered by SWF, respectively.
In order to preserve the pixel information as much as possible, the approximate angle requires to be decided from A1~A8. To this end, the objective function is set as
R = arg min Y i θ , ρ , r X i Y i θ , ρ , r 2 2
where R denotes the final result of SWF.

3. Proposed Method

In this section, the proposed method is presented in detail. Concretely, Section 3.1 overviews the overall framework, followed by the details of the proposed method in Section 3.2.

3.1. Overall Framework

Aiming to effectively fuse the medical images with various modalities, the overall framework of the proposed method is provided in this subsection, and the schematic illumination is shown in Figure 1. As can be observed, the proposed method consists mainly of three components, namely framelet transform, fusion strategies and inverse framelet transform. For simplicity, two preregistered multimodal medical images denoted by A and B are taken into account here. Note that the proposed method can also be extended to the fusion case of more than two source images.
The proposed method can be implemented via the following steps.
Step 1: The source images A and B are decomposed into a pair of low-frequency components expressed as (AL, BL) and a series of high-frequency ones denoted by (A(l, k), B(l, k)), respectively. L is the FT decomposition level, and Z(l, k) indicates the high-frequency component at the lth level and kth direction of image Z. Z = A or B, 1 ≤ lL, 1 ≤ k ≤ 8.
Step 2: The fusion strategies including SKWGF and SWF are employed to fuse the low-frequency and high-frequency coefficients, respectively, producing the fused low-frequency component FL and a series of fused high-frequency ones F(l, k).
Step 3: The inverse FT denoted by ~FT is performed on FL and F(l, k) to generate the final fused image F.

3.2. Details of Proposed Method

In the proposed method, when performing FT once, the source image can be converted into a low-frequency component and eight high-frequency components. As the FT decomposition level L increases, more high-frequency components can be obtained.
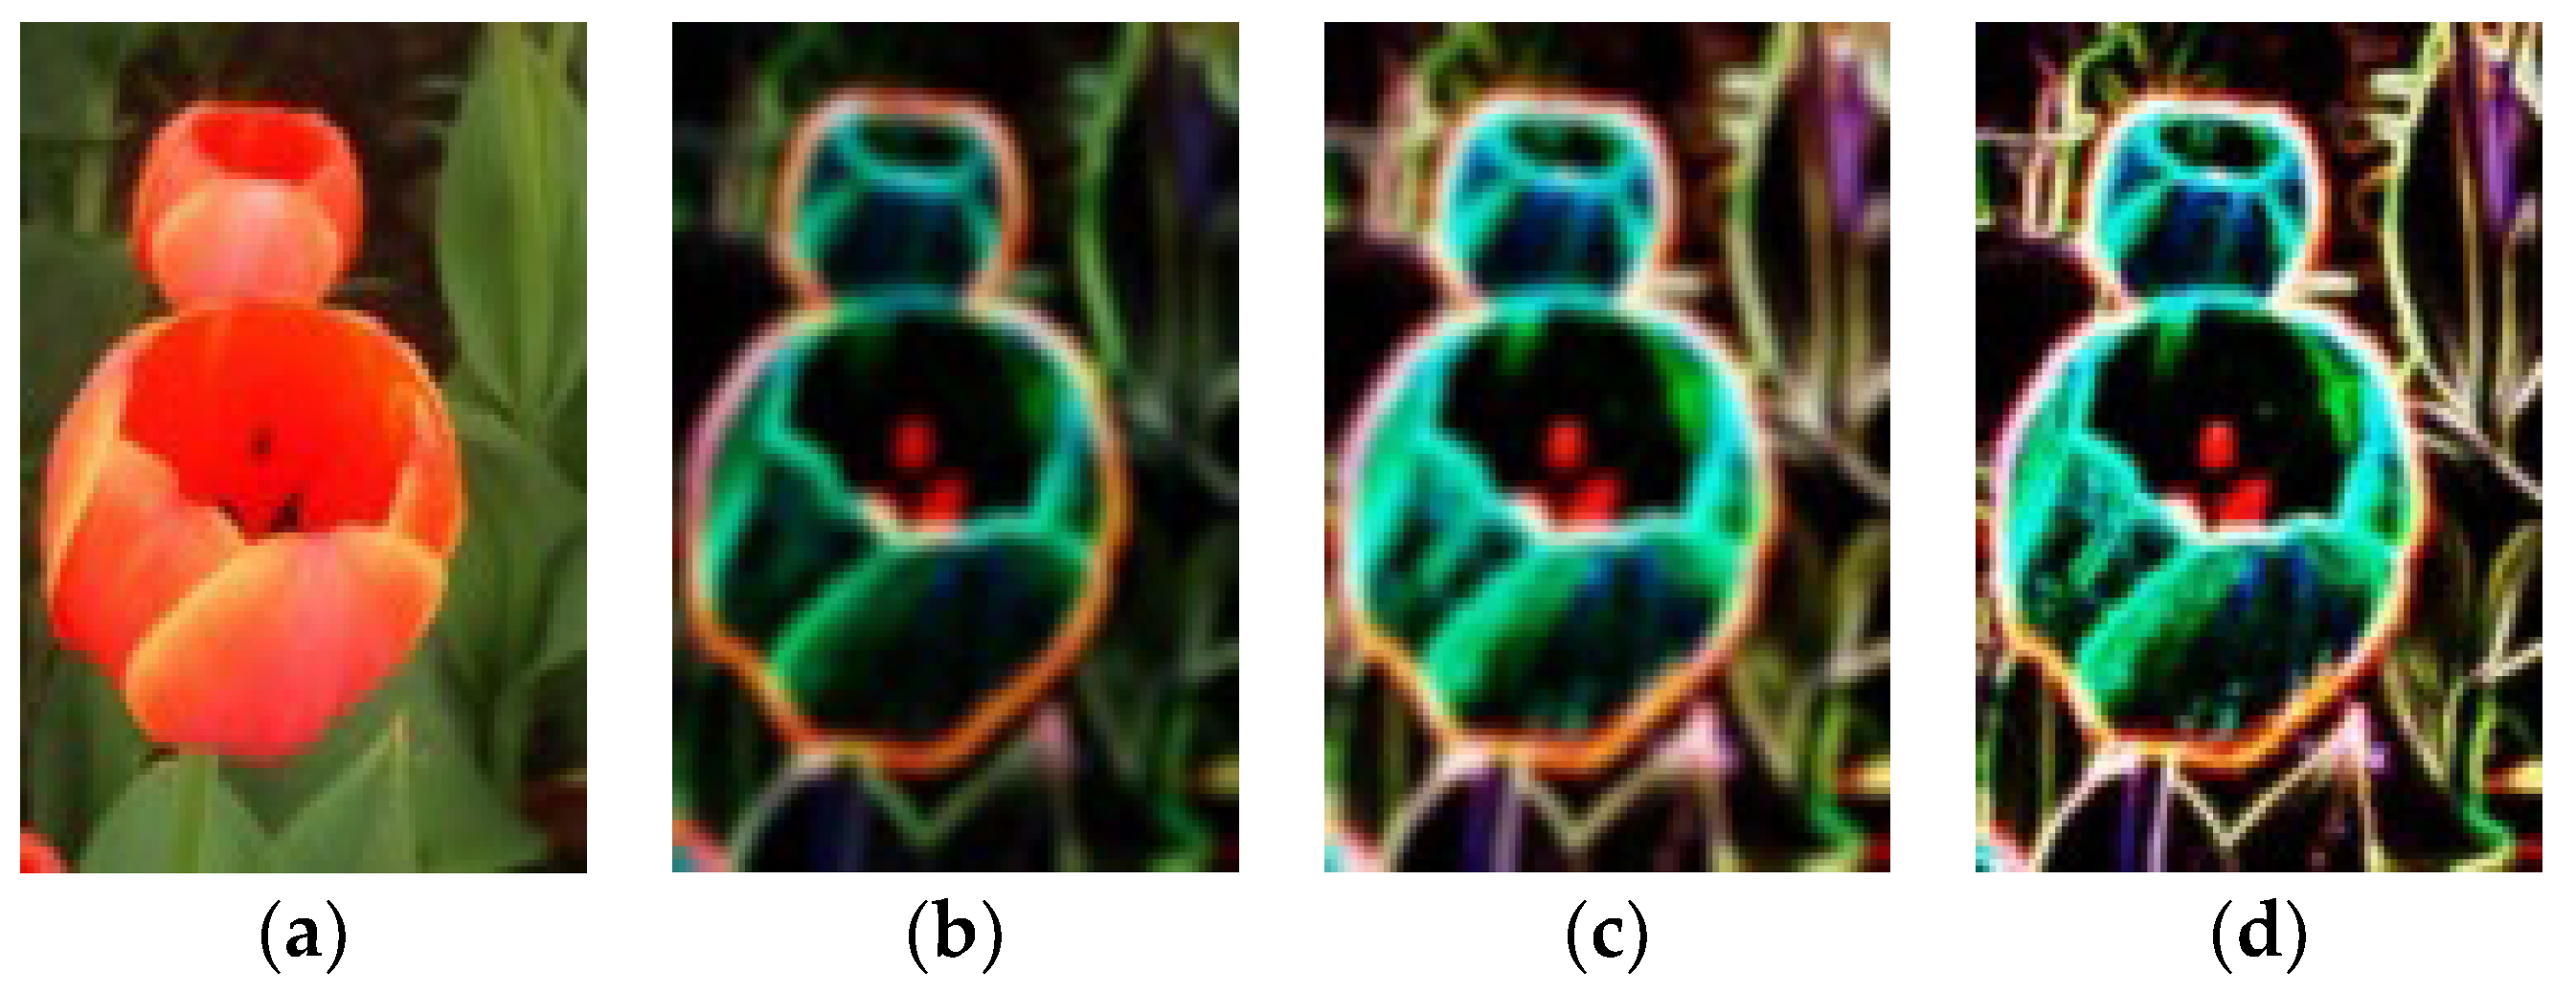
As is known to us, the low-frequency component describes the approximate information of the source image. Although GF manifested to be promising in terms of image information preservation, its unchanged regularization parameter ε leads to halo artifacts. To this end, an improved version of GF called weighted GF (WGF) appeared in which an edge-aware weighting was applied to adjust ε adaptively. Compared with GF, WGF reduces the halo artifacts a great deal, but the edges of the image are likely to be blurred. In order to overcome this defect, the steering kernel, which does well in edge detecting, was combined with WGF to generate steering kernel WGF (SKWGF) [36]. In order to indicate the superiority of SKWGF, a group of simulation experiments were conducted, and the relevant results are shown in Figure 2.
Obviously, the edge information detected by SKWGF is richer than that from GIF and WGIF. Motivated by the above superiority, SKWGF is employed in this paper to fuse the low-frequency components.
To begin with, the initial fusion map of low-frequency component denoted by IMap_low can be obtained as
I M a p _ l o w ( i , j ) = SKWGF ( A L ( i , j ) )
Next, IMap_low is refined to obtain the final fusion map FMap_low as
F M a p _ l o w ( i , j ) = { I M a p _ l o w ( i , j ) ,             i f     t h r e s * I M a p _ l o w ( i , j ) 1   1 I M a p _ l o w ( i , j ) ,     i f     0 I M a p _ l o w ( i , j ) t h r e s *   0 ,                                                         e l s e  
where thres* and thres* are two thresholds used for measuring the importance of the pixel. Large numbers of experiments suggest that the pixels distributed around two extremes often carry significant information. Here, thres* and thres* are set as 0.8 and 0.2, respectively.
The fused low-frequency component denoted by FL can be obtained as
F L ( i , j ) = A L ( i , j ) F M a p _ l o w ( i , j ) + B L ( i , j ) ( 1 F M a p _ l o w ( i , j ) )
Unlike the low-frequency component, the high-frequency component expresses much more information on the edge, texture and other details of the source image. In order to avoid the drawbacks of the conventional filters, the eight-direction SWF is employed in this paper, and the high-frequency components at different levels and directions are provided as inputs in SWF. Accordingly, the corresponding final results can be obtained as
I Z ( l , k ) ( i , j ) = arg min | | q Z ( l , k ) ( i , j ) I Z , n ( l , k ) ( i , j ) | | 2 2 ,   Z = A   o r   B
where n denotes the eight different angles in SWF.
The fused high-frequency component expressed by F(l, k) can be generated by
F ( l , k ) ( i , j ) = { A ( l , k ) ( i , j ) ,       i f     I A ( l , k ) ( i , j ) > I B ( l , k ) ( i , j ) B ( l , k ) ( i , j ) ,       i f     I B ( l , k ) ( i , j ) > I A ( l , k ) ( i , j )   ( A ( l , k ) ( i , j ) + B ( l , k ) ( i , j ) ) / 2 ,                         e l s e  

4. Experiment and Result Analysis

In this section, a series of simulation experiments have been conducted to verify the effectiveness of the proposed method. The structure of this paper is arranged as follows. Section 4.1 introduces the runtime environment and the data sets used in the experiments. Section 4.2 lists the applied objective evaluation metrics, followed by the representative contrast methods in Section 4.3. Section 4.4 reports the experimental results in terms of both subjective visual performance and objective statistics. More ablation experiments and further discussions are conducted in Section 4.5.

4.1. Data Sets

In this paper, a large number of medical source images were obtained from the Whole Brain Atlas website [37]. These images have all been preregistered and delivered in “tif” files with the size of 256 × 256. Due to limited space, the experimental results on four groups of medical images are given here, specifically two pairs of CT and MRI images (Pair I and Pair II) and two pairs of MRI and PET images (Pair III and Pair IV).
In addition, the details of the runtime environment are as follows. All simulation experiments are conducted on a PC equipped with Intel Core i7 CPU and 32 GB memory. The simulation software is MATLAB R2019a.

4.2. Objective Evaluation Metrics

In order to ensure fairness, the experimental performance is evaluated in terms of both subjective perception and objective assessment. As for the latter, four highly convictive objective evaluation metrics are selected here, including information fidelity for fusion (VIFF) [38], feature similarity (FSIM) [39], sum of the correlations of differences (SCD) [40], and spatial frequency (SF) [41]. VIFF is a multi-resolution metric used for evaluating the quality of the fused image based on the visual information fidelity. By combining phase congruency and gradient magnitude, FSIM does well in detecting and capturing the pixels of interest. SCD evaluates the sum of the correlation among the information amount transferred from each source image to the fused image. SF measures the change rate of the image grayscale. The above metrics have been widely used to compare the performance of different image fusion methods. The larger the index value, the better the fusion performance.

4.3. Contrast Methods

In this section, nine representative methods have been selected to be compared with the proposed one, including Laplacian re-decomposition (LRD) [6], parameter-adaptive PCNN (PAPCNN) [15], convolutional sparse representation (CSR) [23], convolutional sparsity based morphological component analysis (CSMCA) [24], NSCT phase congruency local Laplacian (NSCTPCLL) [28], structure-aware (SA) [42], cross bilateral filter (CBF) [43], adaptive sparse representation (ASR) [44] and contrast and structure extraction (CSE) [45]. There are several points that need to be explained in advance. Firstly, the above nine methods have all been publicly published in authoritative journals. Moreover, the MATLAB codes for the nine contrast methods used in this study are freely available on the Internet, which ensures the fairness and objectivity of the experimental results and statistics. More details on the contrast methods can be found in references [6,15,23,24,28,42,43,44,45].

4.4. Experimental Results

In this subsection, four pairs of brain medical images are selected as the source ones for simulation experiments. For simplicity, the four pairs of source images are termed as Pair I–Pair IV. Regarding Pair I and Pair II, each pair consists of two grayscale images: a CT image and an MRI image. Unlike the previous pairs, Pair III and Pair IV consist of a grayscale MRI image and a pseudo-color PET image. It is important to note that we applied a YUV color space transform to convert the pseudo-color image into three individual channels: one luminance channel Y and two chrominance channels U and V. The proposed method is then applied to fuse a grayscale MRI image with the aforementioned Y component. This produces an initial fused image, denoted as F’, which is treated as the new Y component. Finally, F’ and the original chrominance components U and V, are converted to the final fused image F with the RGB version.
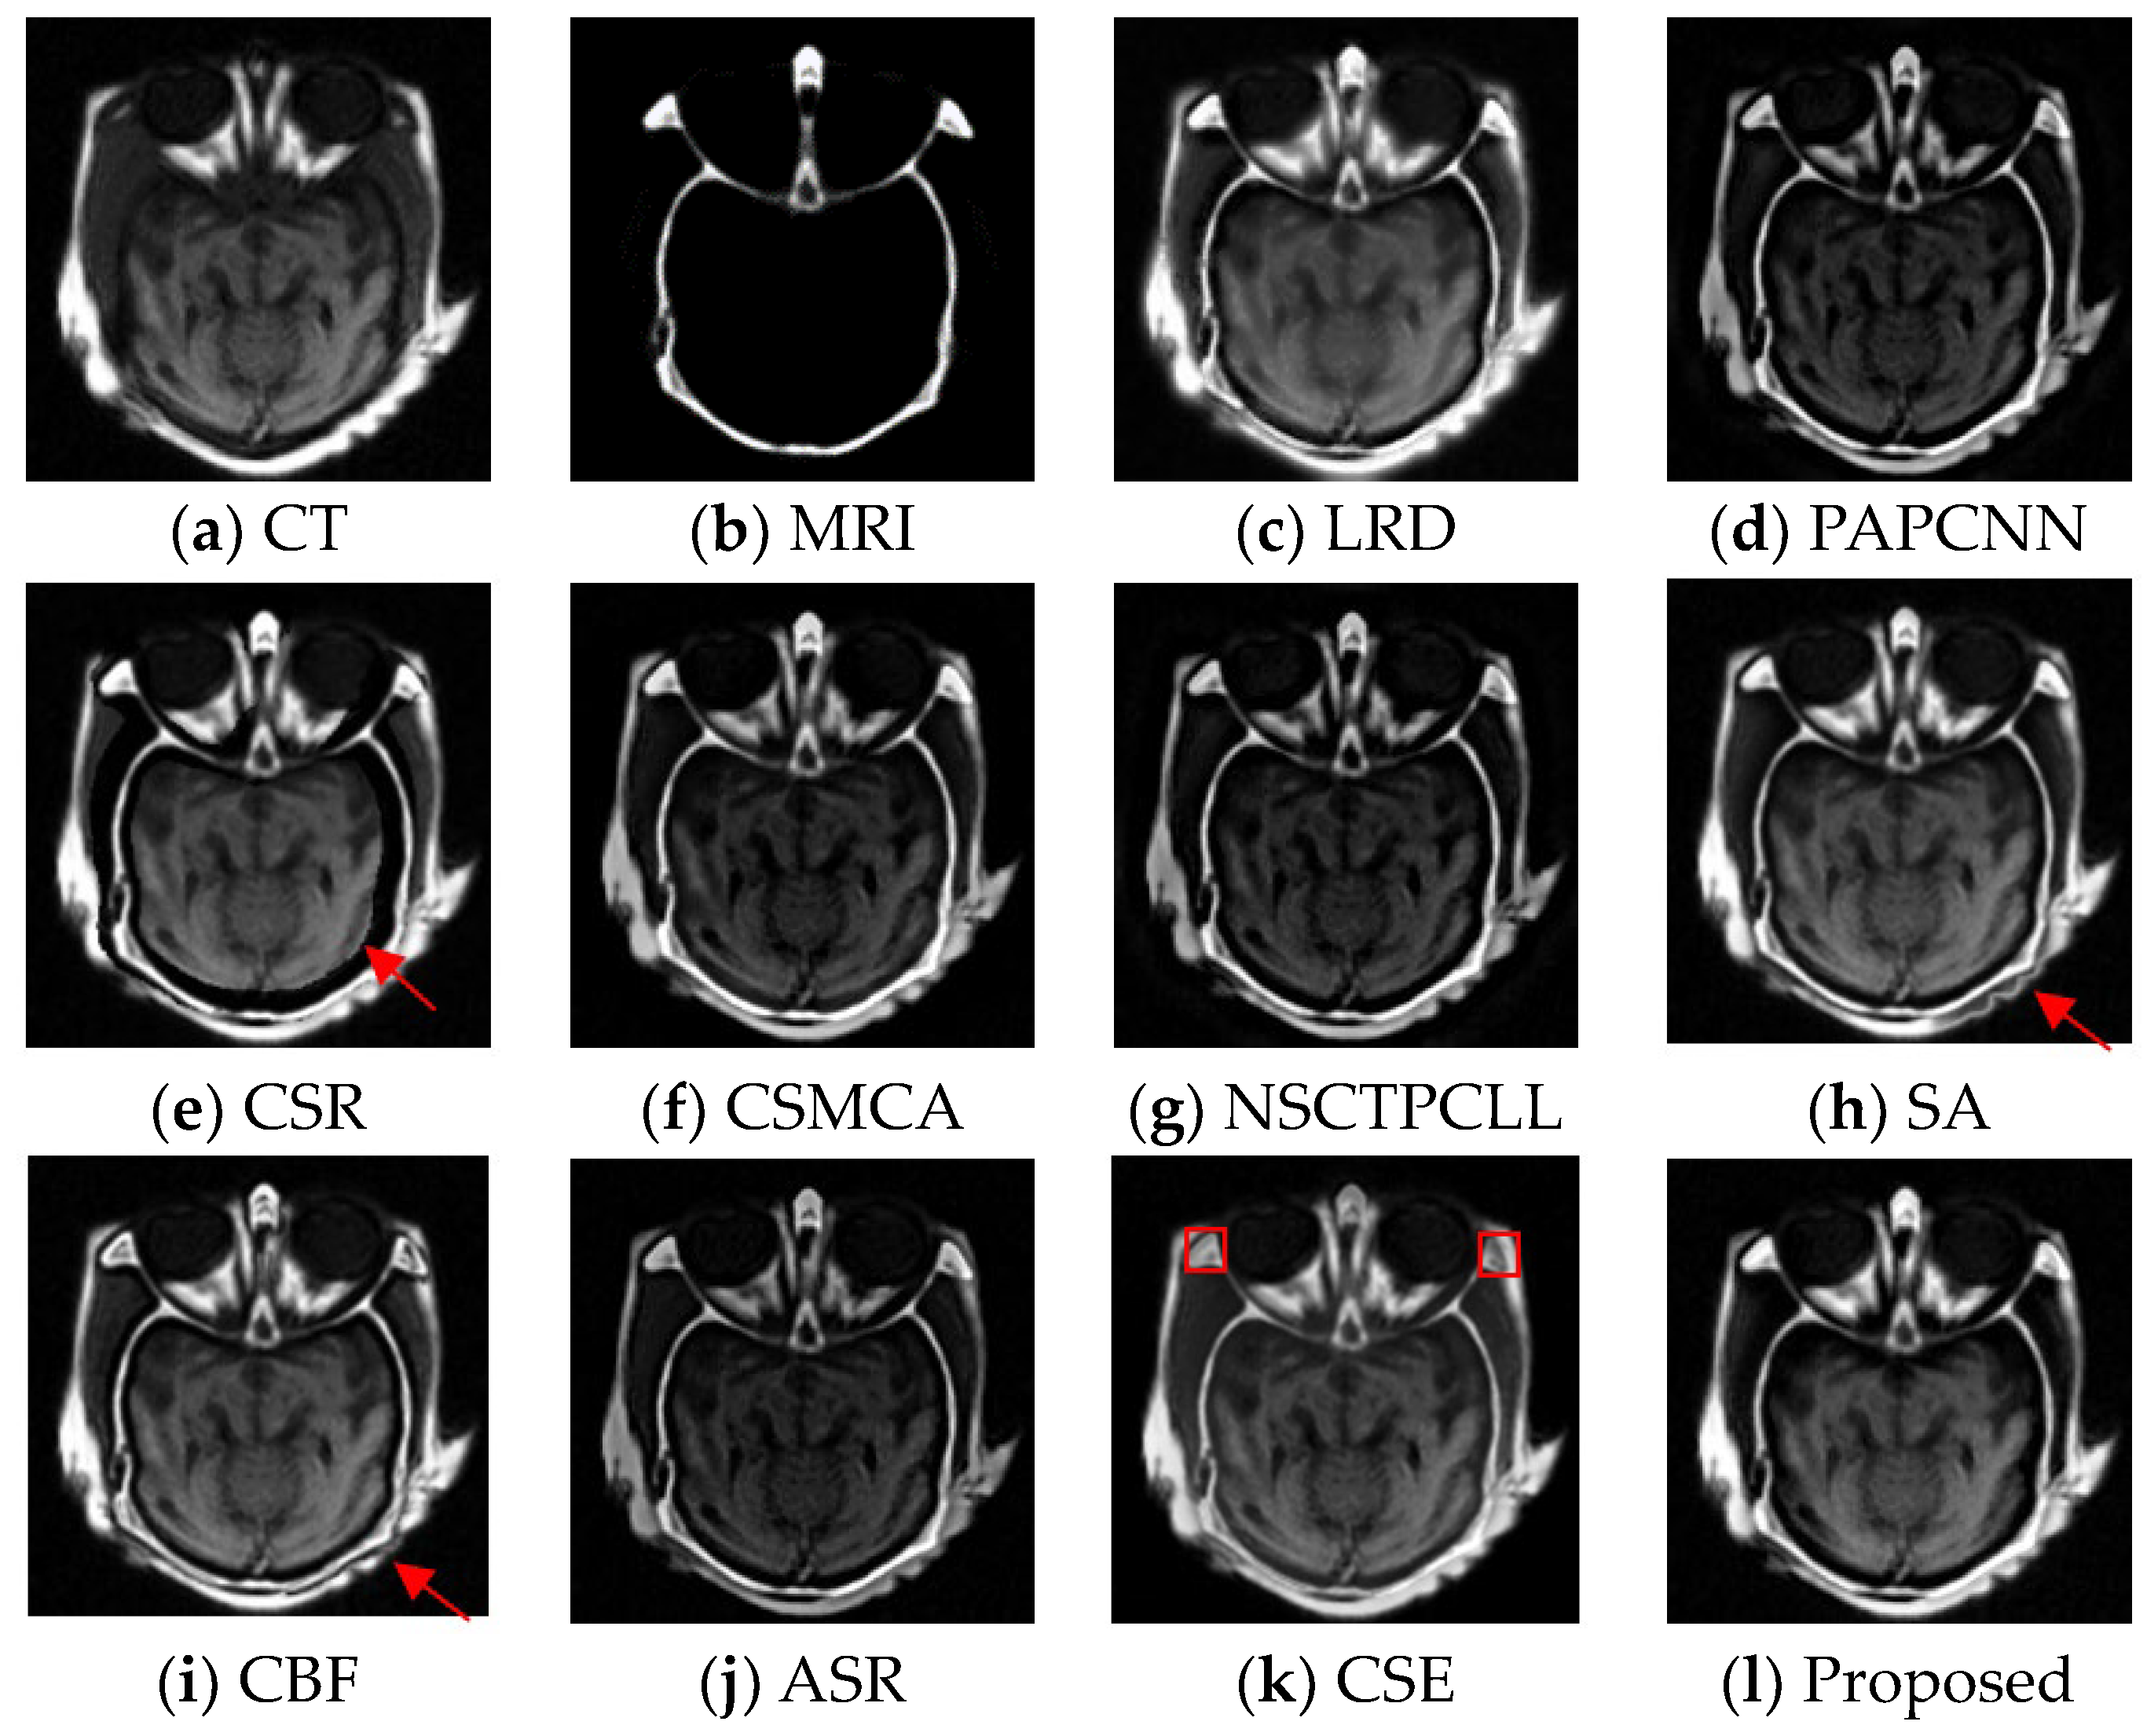
The first group of fused images based on ten different fusion methods is shown in Figure 3. As can be observed, the contour information with high brightness in the CT image (Figure 3a) is not well expressed in Figure 3d–k. In Figure 3e, although most information in the source images is extracted and fused into the result, the fused image still suffers information loss in the upper left region (please see the red arrow). In contrast, the fused images are based on LRD and the proposed method (Figure 3c,l) retains much more information than the other eight methods. However, it should be noted that LRD introduces the artifacts into the fused image (please see the red boxes). Therefore, the proposed method demonstrates the best subjective visual performance during the simulation experiments on Pair I.
Another group of common brain medial images are also used here, and the corresponding fused images based on ten different fusion methods are shown in Figure 4. From the contrast perspective, the fused images in Figure 4d,f,g,j all suffer insufficient image contrast level. The central region in Figure 4c is blurred, implying that part of the information in the original CT source image is lost. Similarly, the bilateral regions in Figure 4k are also blurred (please see the red boxes). In addition, the haloes located in the bottom-right regions can be clearly observed in both Figure 4h,i (please see the red arrows). The saw-like artifact is introduced in Figure 4e (please see the red arrow). In comparison, the fused image based on the proposed method has high quality in terms of both information preservation and clarity level.
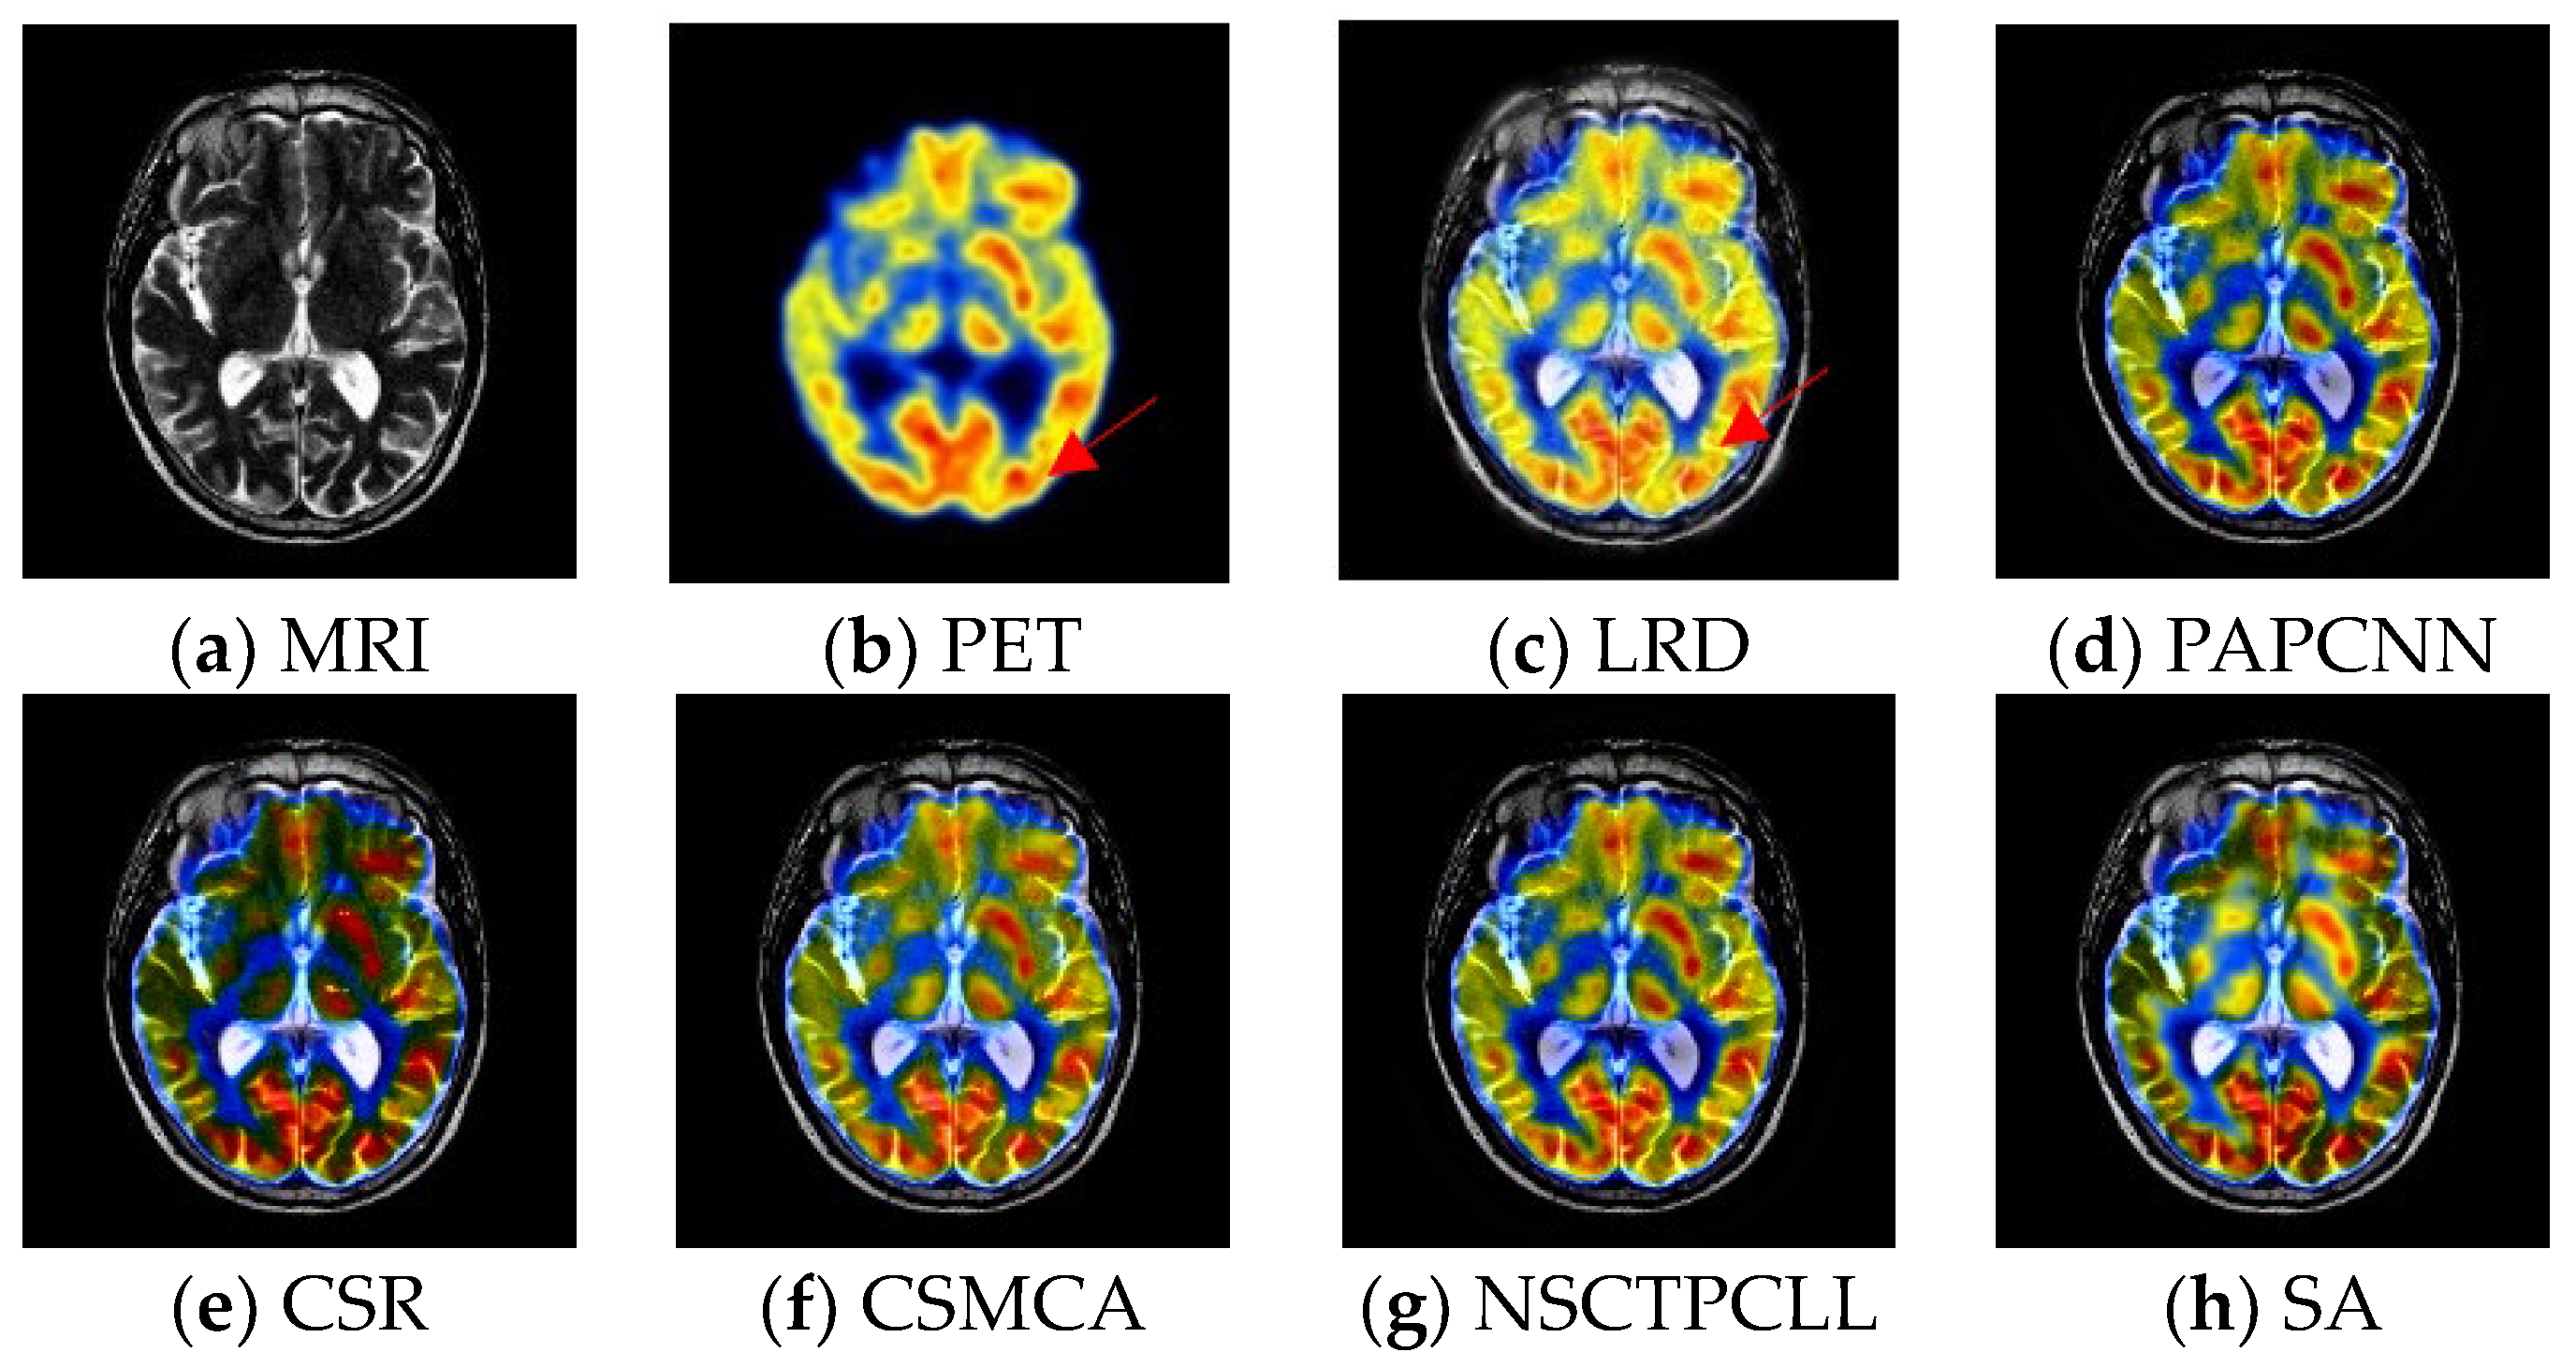
The third group of fused images based on ten different fusion methods is shown in Figure 5. Here, there is a gray-scale MRI image and a pseudo-color PET image. We can obviously find that the fused images in Figure 5d–k all suffer from varying degrees of color distortion. Compared with the other eight fusion methods, both LRD and the proposed method have a strong ability to express information. However, by careful comparison, we can observe that the dark blue region in the original PET image (Figure 5b) fades slightly in Figure 5c. The proposed method not only preserves the grayscale information in MRI but also retains the color information in PET effectively.
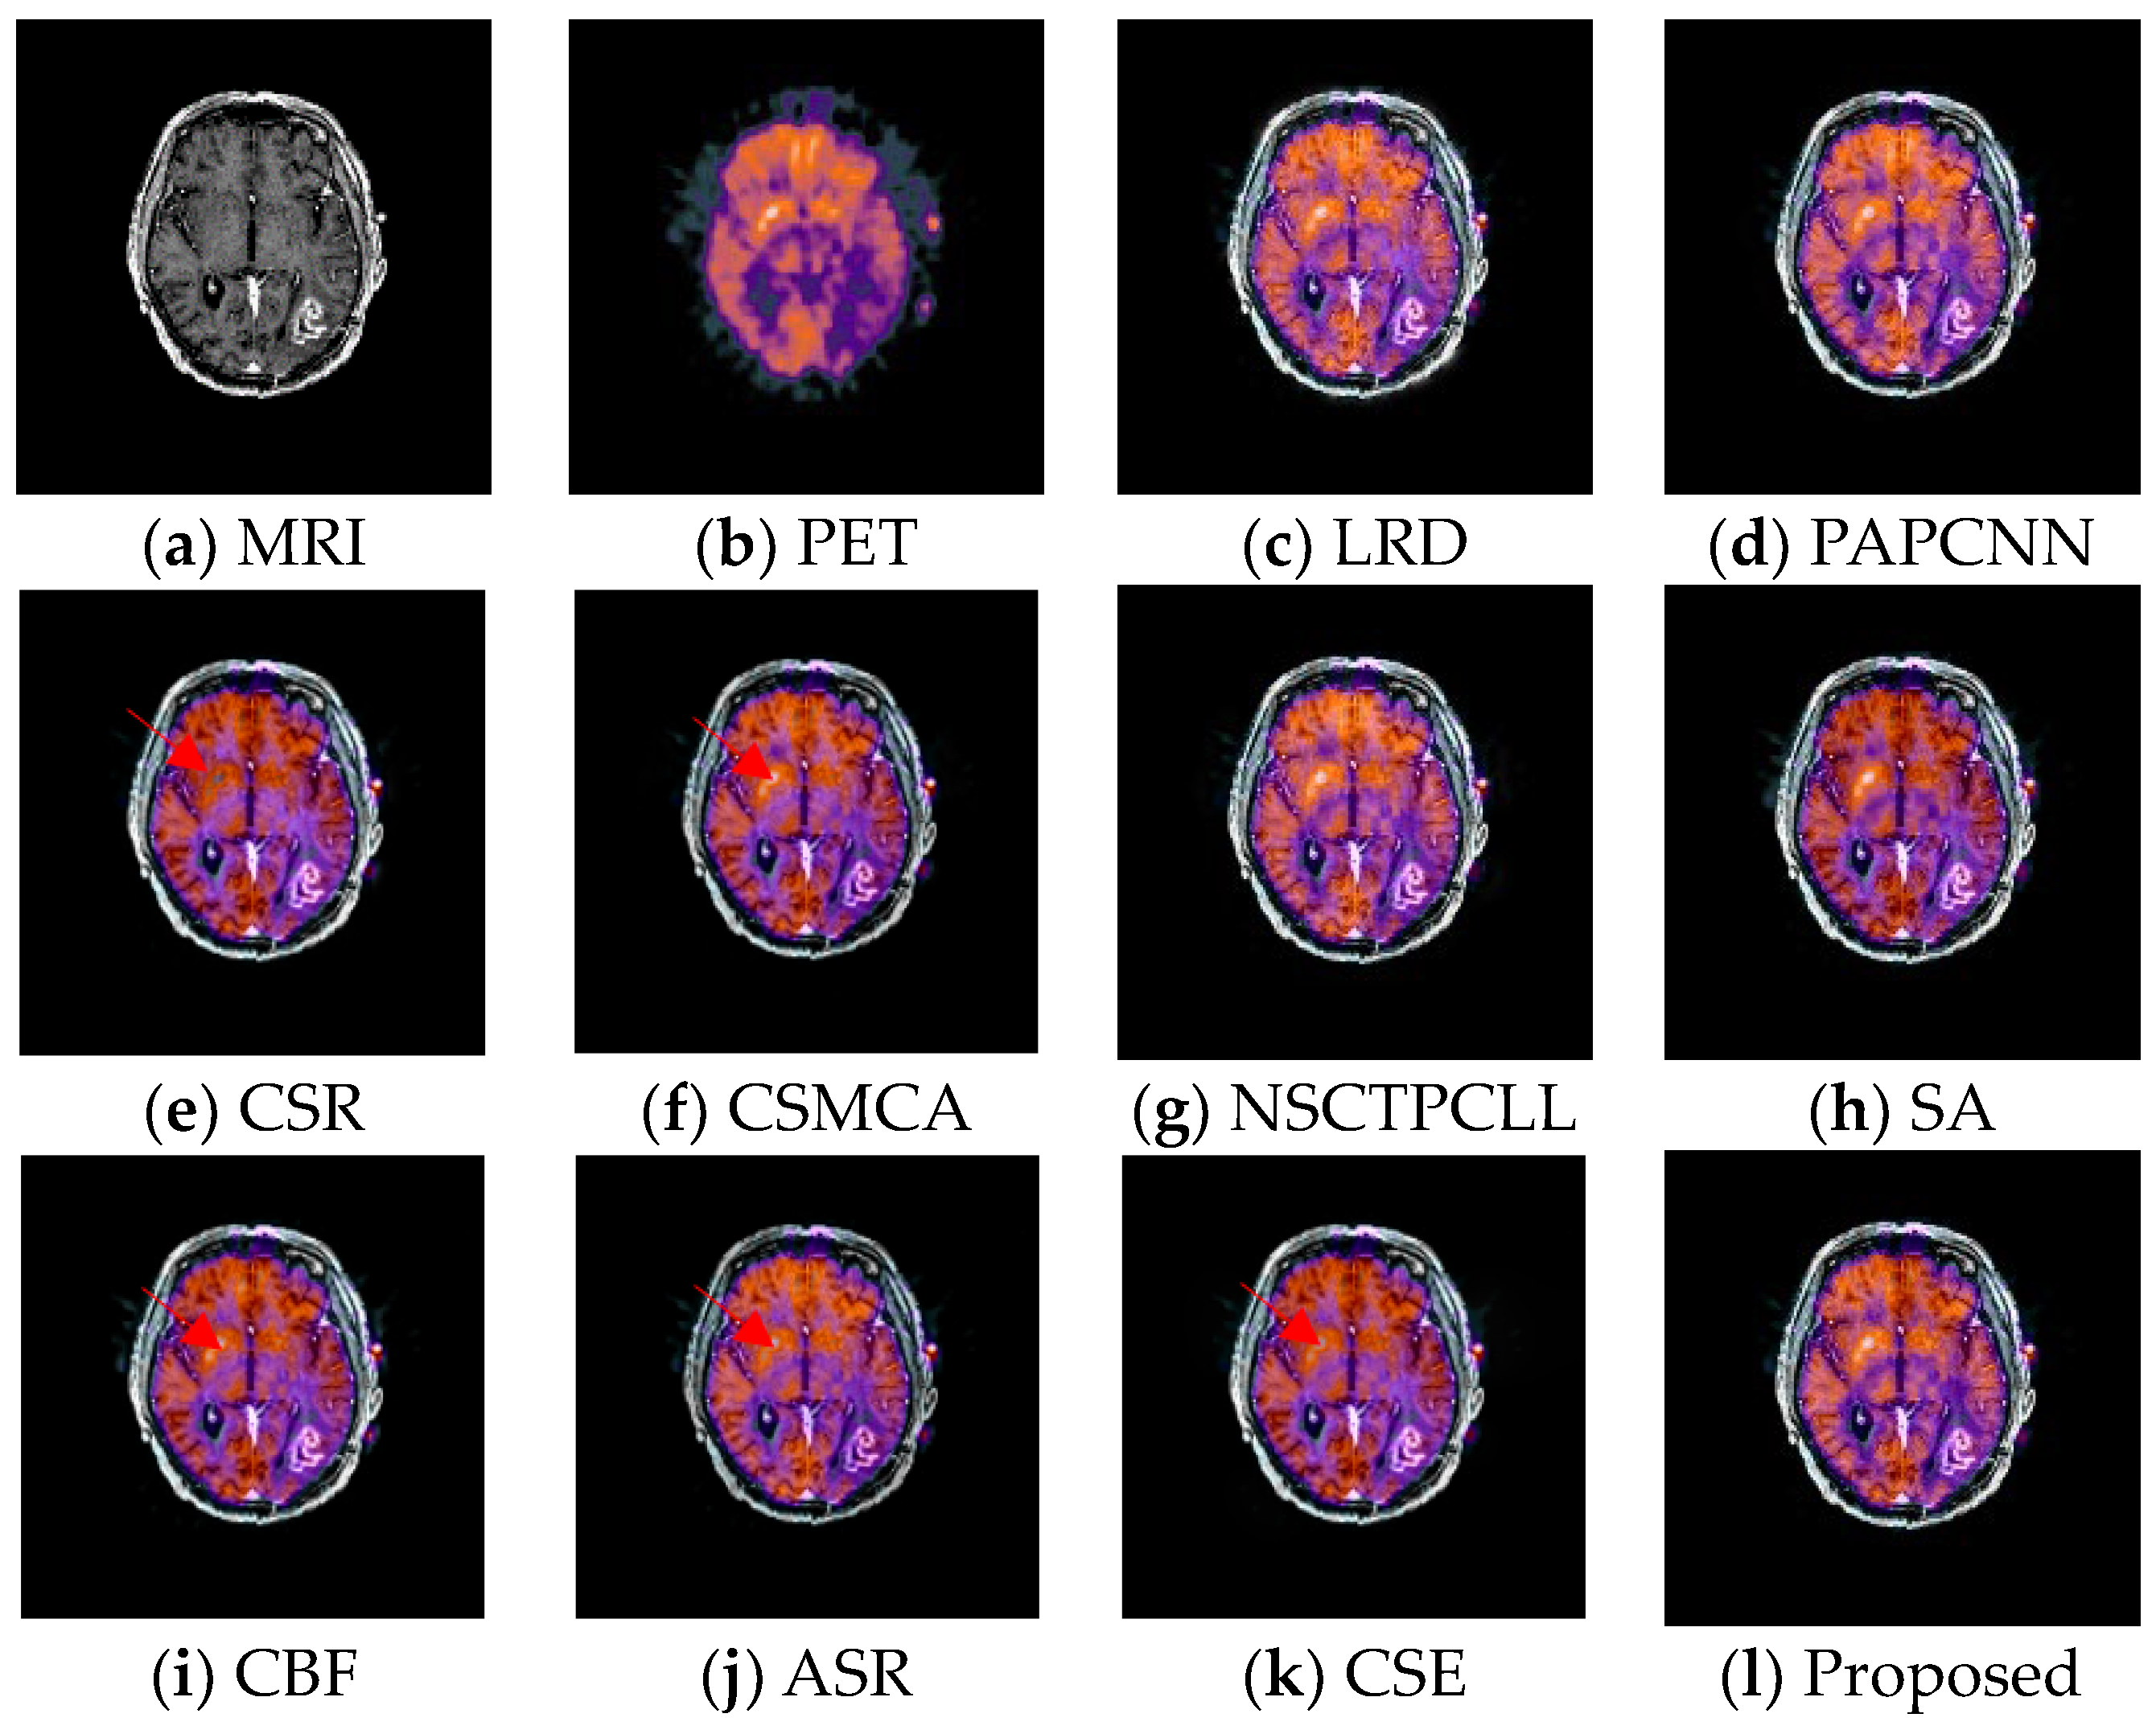
The last group of fused images based on ten different fusion methods is shown in Figure 6. From the point of the image intensity, the performance of the fused images in Figure 6e,f,i–k is not satisfactory, and the overall intensity level of the image is too low (please see the red arrows). In contrast, the visual performance of the other five fused images based on LRD, PAPCNN, NSCTPCLL, SA and the proposed method are approximate.
Through a number of simulation experiments, four groups of brain medical images have been fused by ten different fusion methods. On the whole, the proposed method has manifested great superiorities over the other nine in terms of subjective visual performance.
In order to verify the effectiveness of the proposed method from other aspects, the objective evaluation statistics on the ten methods are reported in Table 1. There are several points requiring further explanation, as follows. Firstly, what cannot be ignored is that any individual evaluation metric always has its own advantages and disadvantages. Therefore, it is unreasonable to judge the method via any single metric. To this end, the comprehensive consideration of multiple evaluation metrics provides a new feasible scheme. In this section, the ranks of each metric are all given, and the sum of ranks for each method is calculated. Thus, the smaller the sum is, the better the method’s performance. The red bold and blue bold indicate the best and suboptimal methods, respectively. Furthermore, in the objective evaluation statistics of the ten methods, the proposed method ranked first three times and second once, outperforming the other nine comparison methods. In addition, the objective statistics are basically consistent with the subjective visual performance. Here, we take LRD for instance. From the objective evaluation aspect, LRD achieves the second place four times, which is second only to the proposed method. As we can observe in Figure 3, Figure 4, Figure 5 and Figure 6, the subjective visual performance of LRD is relatively satisfactory.

4.5. More Ablation Experiments and Further Discussions

In the Section 4.4, we selected four different pairs of homogeneous or heterogenous medical source images to verify the effectiveness of the proposed method. In this subsection, more ablation experiments and further discussions are conducted in terms of performance on other types of source images and average running time.
In order to verify the fusion performance of the proposed method on other types of source images, another two groups of images are selected, including a pair of multi-focus source images and a pair of light and infrared source images. For simplicity, the above two pairs of source images are named Pair V and Pair VI, respectively, which are shown in Figure 7. Both pairs of images share the size of 256 × 256, and they have been registered in advance. In Figure 7a, the left area is in focus while the right area is out of focus; the opposite situation is shown in Figure 7b. Therefore, there is much complementary information between these two images. Figure 7c displays a visual light image with poor lighting, while the corresponding infrared version of Figure 7c is shown in Figure 7d. Clearly, the combination of both images mentioned above is highly likely to provide us with much richer information.
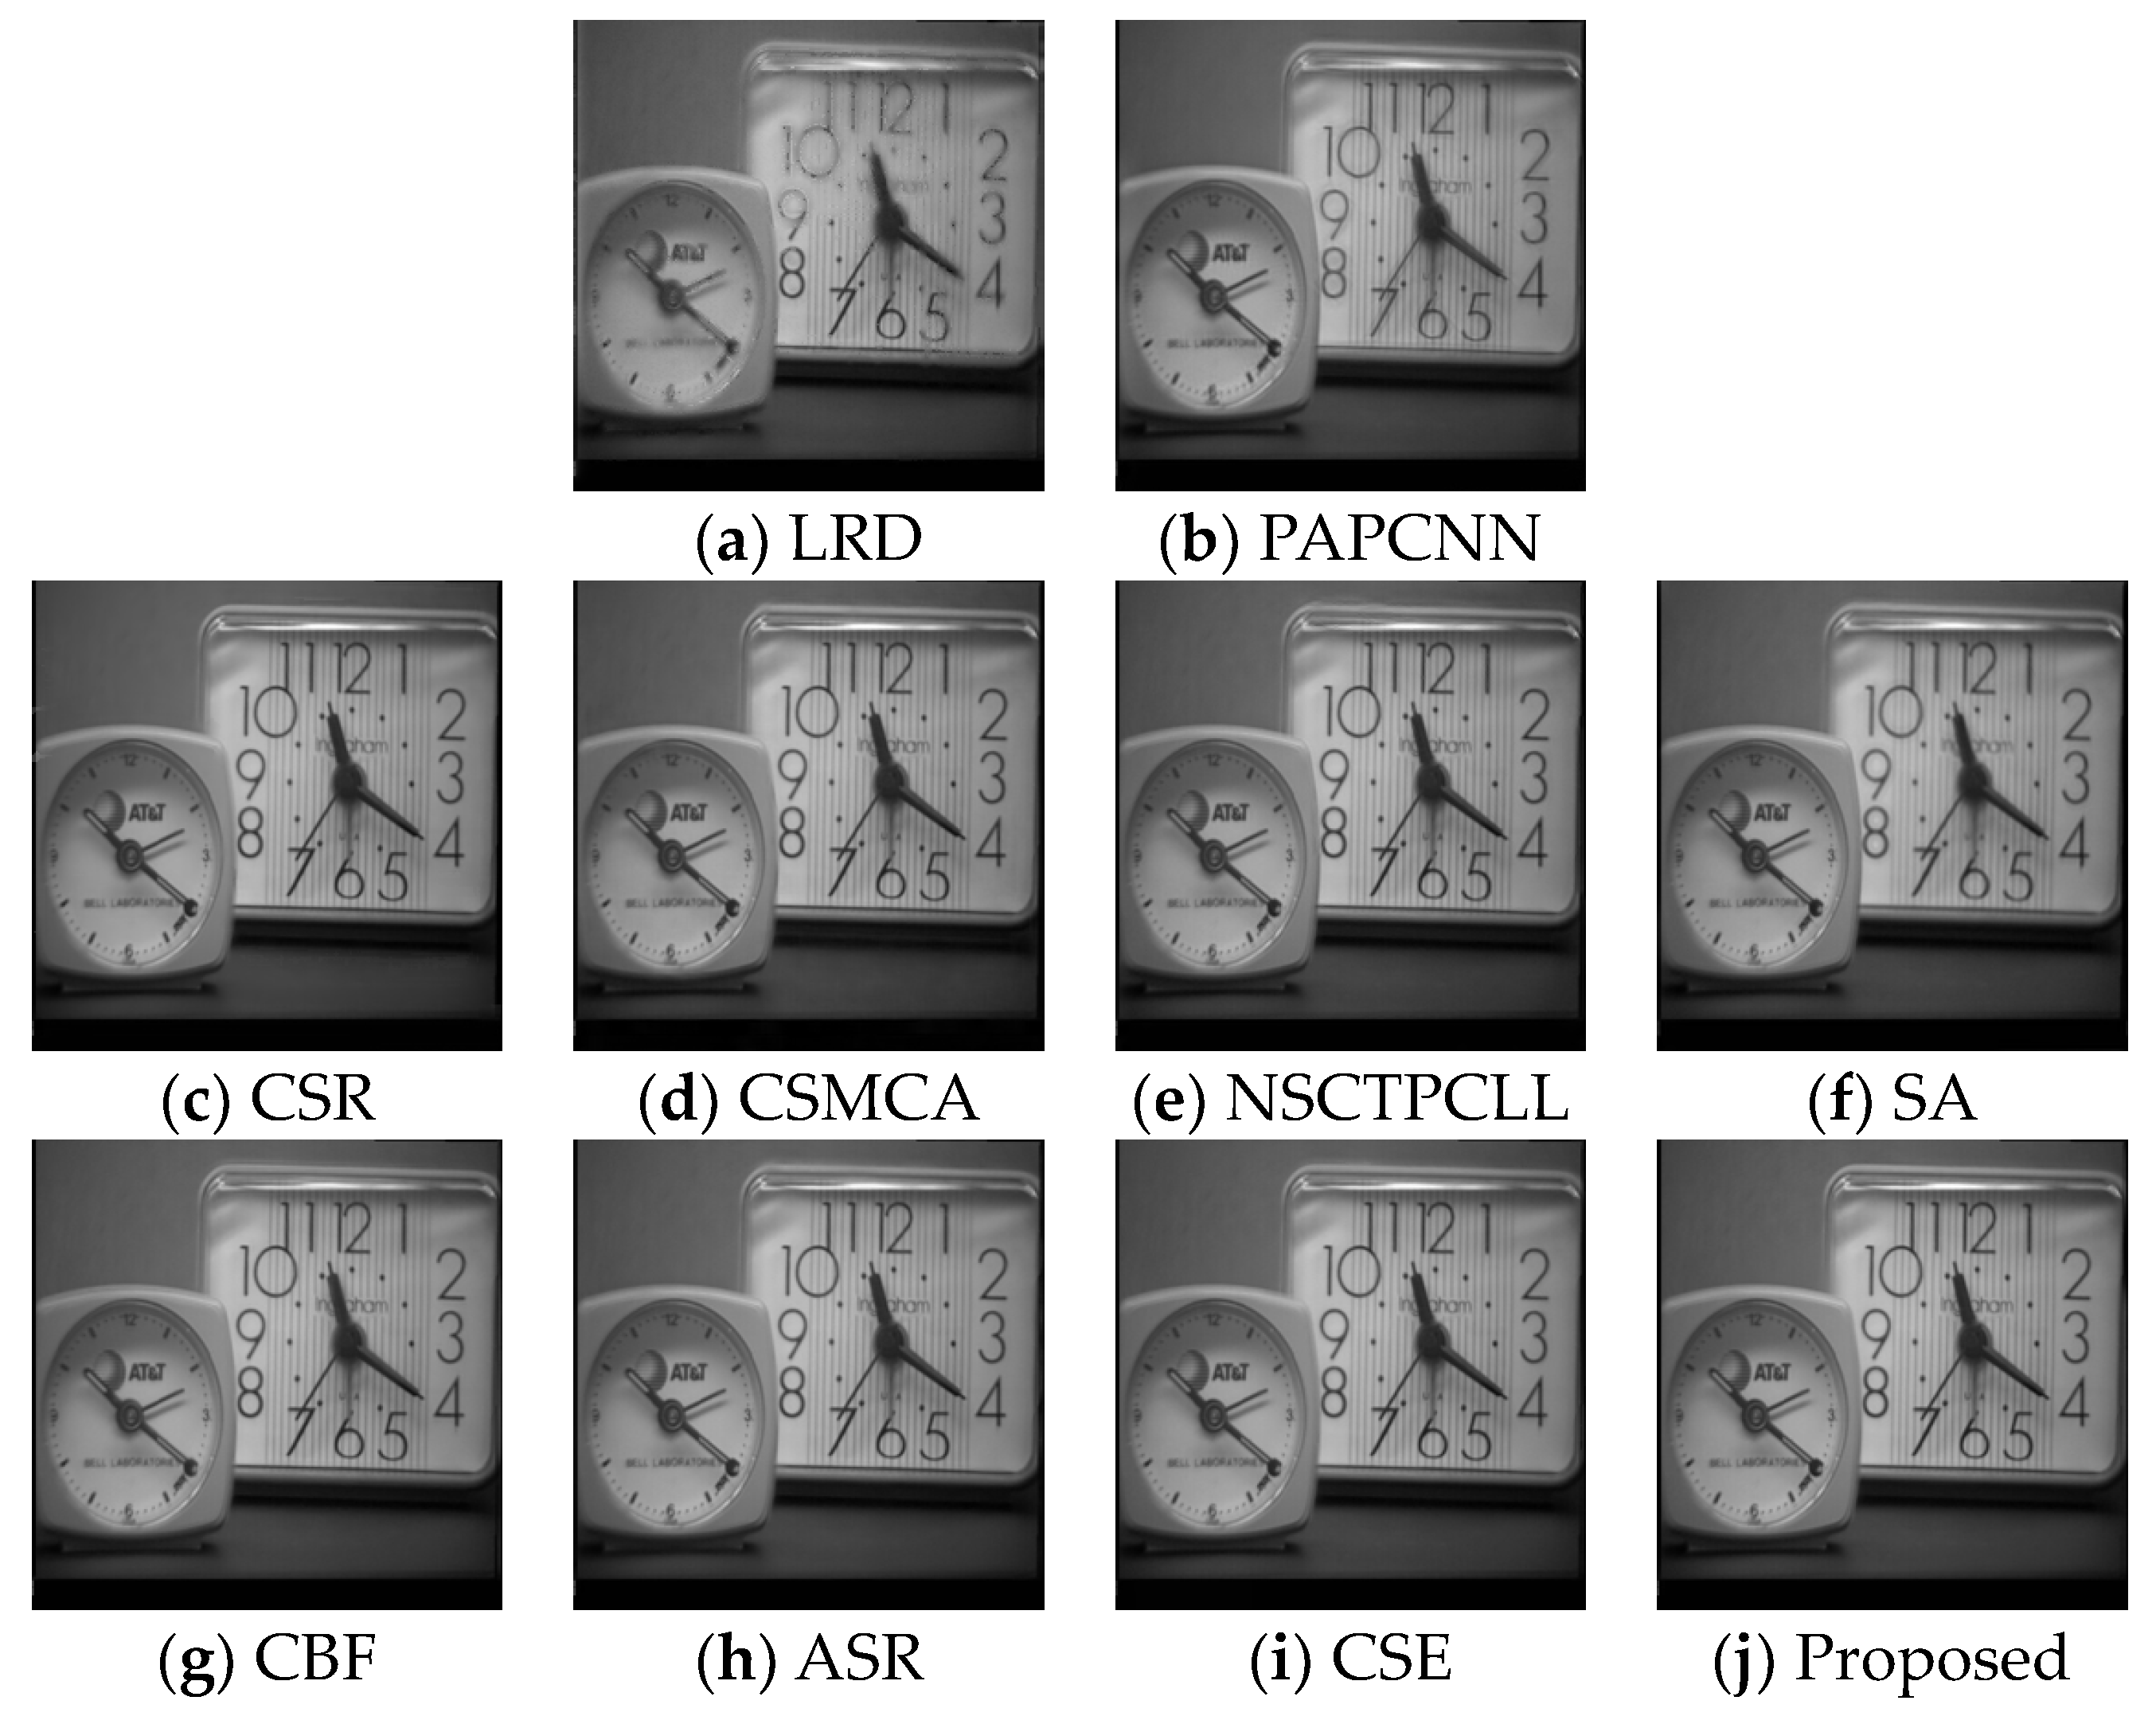
The fusion experiments on Pair V are conducted here, and the corresponding result images based on ten different fusion methods are shown in Figure 8. Generally speaking, the main information of the source images is extracted and fused by most fusion methods, except LRD. For comparison purposes, the enlarged close-ups of a representative region are also depicted in Figure 9. It is found that the fused image based on the proposed method is clearer than those of other methods.
The fusion results based on ten different methods are displayed in Figure 10. Obviously, the fused image based on CSR suffers information distortion. Some artifacts are introduced into the fused images based on LRD, PAPCNN, NSCTPCLL, SA and CBF, especially in regions around the person. In the result images produced by CSMCA and CSE, the individual’s contours appear blurred in both cases. Although ASR and the proposed method do well in describing the information of the person and the cars, the proposed method has superiority over the former in preserving and expressing the lighting information in the original source images (please see the red arrow).
In addition to the subjective visual evaluation, the objective evaluation statistics on the ten methods are reported in Table 2. With regard to the experimental results on the fusion of multi-focus images, three methods including SA, CSE and the proposed method achieve the top three places. Concerning the fusion of visual light and infrared images, the objective evaluation result is slightly inferior, and achieves fourth place.
In addition to comparing subjective visual performance and objective evaluation, running time is also an important metric for measuring method performance. Here, the average running time of the ten methods is discussed. To ensure fairness and objectivity of the comparison results, the average of the experimental results on six pairs of source images for each method is treated as the final average running time, and the corresponding results are reported in Table 3. Observed from Table 3, the statistics shows the trend of polarization. Compared with the other six methods, LRD, CSR, CSMCA and ASR all consume large computational resources, so that their average running time is very long. In comparison, SA and CSE are the most time-saving, and they only cost 0.489 s and 0.774 s, while the proposed method achieves third place. Although the proposed method is slightly more time-consuming than SA and CSE, it falls within the acceptable range. Moreover, the overall fusion performance based on the proposed method has much more significant superiorities over those of the other nine methods.

5. Conclusions

In this paper, a novel and effective fusion method is proposed to fuse the multimodal medical images. The proposed method mainly consists of two parts including fusion scheme and fusion strategy. As for the former, the current popular scheme such as NSCT and NSST are replaced by FT in this paper, which owns much better fusion performance and greatly lower computational costs. With regard to the fusion strategy, SKWGF and SWF are exploited to accomplish the fusion of low-frequency sub-image and a series of high-frequency sub-images, respectively. To verify the effectiveness of the proposed method, we compared it with nine representative fusion methods using several pairs of medical images with different modalities. The experimental results indicate that the proposed method outperforms the other nine methods in terms of both subjective visual performance and objective evaluation metrics.
Overall, the main contributions of the proposed method mainly manifest in the following four points. Firstly, compared with the popular transform domain methods such as NSCT and NSST, framelet transform results in much lower computation costs and better fusion performance. Secondly, the enhanced version of GF can overcome its structural limitations, allowing for a more effective extraction and representation of information in LFIs. Thirdly, SWF is more sensitive to the detail information in HFIs than the current representative models. Fourthly, the experimental results indicate that the proposed method outperforms the current representative methods in terms of both visual quality and quantitative evaluation.
Of course, it should be noted that, like all methods, the proposed method also has its own limitations. Firstly, according to the experimental results, the proposed method performs well in the fusion of homogeneous source images such as medical images and multi-focus images, while the corresponding performance is slightly inferior in the fusion experiments on heterogenous images such as visual light and infrared images. Secondly, while the proposed method has a much shorter average running time compared with most other methods, there is still room for further improvement. In the next step of our work, we will optimize the proposed method to further decrease its running time, in order to better meet the requirements of real-time applications.

Author Contributions

W.K.: Conceptualization, Software. Y.L. (Yiwen Li): Writing—original draft. Y.L. (Yang Lei): Methodology. All authors have read and agreed to the published version of the manuscript.

Funding

This work was supported in part by the National Natural Science Foundation of China under grant 61902296, and the Natural Science Basic Research Program of Shannxi Province of China under grant 2022JM-369.

Data Availability Statement

Data sets generated during the current study are not publicly available due to funding restrictions, but they are available from the corresponding authors upon reasonable request.

Conflicts of Interest

The authors declare no conflict of interest.

References

  1. Li, W.S.; Du, J.; Zhao, Z.M.; Long, J. Fusion of medical sensors using adaptive cloud model in local Laplacian pyramid domain. IEEE Trans. Biomed. Eng. 2019, 66, 1172–1183. [Google Scholar] [CrossRef] [PubMed]
  2. Zhang, S.Q.; Li, X.F.; Zhu, R.; Zhang, X.; Wang, Z.; Zhang, S. Medical image fusion algorithm based on L0 gradient minimization for CT and MRI. Multimed. Tools Appl. 2021, 80, 21135–21164. [Google Scholar] [CrossRef]
  3. Shahdoosti, H.R.; Ghassemian, H. Combining the spectral PCA and spatial PCA fusion methods by an optimal filter. Inf. Fusion 2016, 27, 150–160. [Google Scholar] [CrossRef]
  4. Vijayarajan, R.; Muttan, S. Spatial weighted fuzzy c-means clustering based principal component averaging image fusion. Int. J. Tomogr. Simul. 2016, 29, 104–113. [Google Scholar]
  5. Juneja, S.; Anand, R. Contrast enhancement of an image by DWT-SVD and DCT-SVD. In Data Engineering and Intelligent Computing; Satapathy, S., Bhateja, V., Raju, K., Janakiramaiah, B., Eds.; Advances in Intelligent Systems and Computing; Springer: Singapore, 2017; p. 542. [Google Scholar] [CrossRef]
  6. Li, X.X.; Guo, X.P.; Han, P.F.; Wang, X.; Li, H.; Luo, T. Laplacian re-decomposition for multimodal medical image fusion. IEEE Trans. Instrum. Meas. 2020, 69, 6880–6890. [Google Scholar] [CrossRef]
  7. Naveenadevi, R.; Nirmala, S.; Babu, G.T. Fusion of CT-PET lungs Tumor images using dual tree complex wavelet transform. Res. J. Pharm. Biol. Chem. Sci. 2017, 8, 310–316. [Google Scholar]
  8. Chavan, S.S.; Mahajan, A.; Talbar, S.N.; Desai, S.; Thakur, M.; D’Cruz, A. Nonsubsampled rotated complex wavelet transform (NSRCxWT) for medical image fusion related to clinical aspects in neurocysticercosis. Comput. Biol. Med. 2017, 81, 64–78. [Google Scholar] [CrossRef]
  9. Ganasala, P.; Prasad, A.D. Medical image fusion based on laws of texture energy measures in stationary wavelet transform domain. Int. J. Imaging Syst. Technol. 2020, 30, 544–557. [Google Scholar] [CrossRef]
  10. Chao, Z.; Duan, X.G.; Jia, S.F.; Guo, X.; Liu, H.; Jia, F. Medical image fusion via discrete stationary wavelet transform and an enhanced radial basis function neural network. Appl. Soft Comput. 2022, 118, 108542. [Google Scholar] [CrossRef]
  11. Da Cunha, A.L.; Zhou, J.; Do, M.N. The nonsubsampled contourlet transform: Theory, design, and applications. IEEE Trans. Image Process. 2006, 15, 3089–3101. [Google Scholar] [CrossRef] [Green Version]
  12. Easley, G.; Labate, D.; Lim, W.Q. Sparse directional image representation using the discrete shearlet transforms. Appl. Comput. Harmon. Anal. 2008, 25, 25–46. [Google Scholar] [CrossRef] [Green Version]
  13. Liu, X.B.; Mei, W.B.; Du, H.Q. Structure tensor and nonsubsampled shearlet transform based algorithm for CT and MRI image fusion. Neurocomputing 2017, 235, 131–139. [Google Scholar] [CrossRef]
  14. Liu, X.B.; Mei, W.B.; Du, H.Q. Multi-modality medical image fusion based on image decomposition framework and nonsubsampled shearlet transform. Biomed. Signal Process. Control 2018, 40, 343–350. [Google Scholar] [CrossRef]
  15. Yin, M.; Liu, X.N.; Liu, Y.; Chen, X. Medical image fusion with parameter-adaptive pulse coupled neural network in nonsubsampled shearlet transform domain. IEEE Trans. Instrum. Meas. 2019, 68, 49–64. [Google Scholar] [CrossRef]
  16. Jose, J.; Gautam, N.; Tiwari, M.; Tiwari, T.; Suresh, A.; Sundararaj, V.; Rejeesh, M.R. An image quality enhancement scheme employing adolescent identity search algorithm in the NSST domain for multimodal medical image fusion. Biomed. Signal Process. Control 2021, 66, 102480. [Google Scholar] [CrossRef]
  17. Li, H.; He, X.; Tao, D.; Tang, Y.; Wang, R. Joint medical image fusion, denoising and enhancement via discriminative low-rank sparse dictionaries learning. Pattern Recognit. 2018, 79, 130–146. [Google Scholar] [CrossRef]
  18. Zhu, Z.Q.; Chai, Y.; Yin, H.P.; Li, Y.; Liu, Z. A novel dictionary learning approach for multi-modality medical image fusion. Neurocomputing 2016, 214, 471–482. [Google Scholar] [CrossRef]
  19. Daniel, E. Optimum wavelet-based homomorphic medical image fusion using hybrid genetic-grey wolf optimization algorithm. IEEE Sens. J. 2018, 18, 6804–6811. [Google Scholar] [CrossRef]
  20. Manchanda, M.; Sharma, R. A novel method of multimodal medical image fusion using fuzzy transform. J. Vis. Commun. Image Represent. 2016, 40, 197–217. [Google Scholar] [CrossRef]
  21. Xu, X.Z.; Shan, D.; Wang, G.Y.; Jiang, X. Multimodal medical image fusion using PCNN optimized by the QPSO algorithm. Appl. Soft Comput. 2016, 46, 588–595. [Google Scholar] [CrossRef]
  22. Liu, X.B.; Mei, W.B.; Du, H.Q. Multimodality medical image fusion algorithm based on gradient minimization smoothing filter and pulse coupled neural network. Biomed. Signal Process. Control 2016, 30, 140–148. [Google Scholar] [CrossRef]
  23. Liu, Y.; Chen, X.; Ward, R.; Wang, Z.J. Image fusion with convolutional sparse representation. IEEE Signal Process. Lett. 2016, 23, 1882–1886. [Google Scholar] [CrossRef]
  24. Liu, Y.; Chen, X.; Ward, R.; Wang, Z.J. Medical image fusion via convolutional sparsity based morphological component analysis. IEEE Signal Process. Lett. 2019, 26, 485–489. [Google Scholar] [CrossRef]
  25. Li, J.; Peng, Y.X.; Song, M.H.; Liu, L. Image fusion based on guided filter and online robust dictionary learning. Infrared Phys. Technol. 2020, 105, 103171. [Google Scholar] [CrossRef]
  26. Zhang, S.; Huang, F.Y.; Liu, B.Q.; Li, G.; Chen, Y.; Chen, Y.; Zhou, B.; Wu, D. A multi-modal image fusion framework based on guided filter and sparse representation. Opt. Laser Eng. 2021, 137, 106354. [Google Scholar] [CrossRef]
  27. Li, X.S.; Zhou, F.Q.; Tan, H.S.; Zhang, W.; Zhao, C. Multimodal medical image fusion based on joint bilateral filter and local gradient energy. Inf. Sci. 2021, 569, 302–325. [Google Scholar] [CrossRef]
  28. Zhu, Z.Q.; Zheng, M.Y.; Qi, G.Q.; Wang, D.; Xiang, Y. A phase congruency and local Laplacian energy based multi-modality medical image fusion method in NSCT domain. IEEE Access 2019, 7, 20811–20824. [Google Scholar] [CrossRef]
  29. Zhu, R.; Li, X.F.; Zhang, X.L.; Wang, J. HID: The hybrid image decomposition model for MRI and CT fusion. IEEE J. Biomed. Health 2022, 26, 727–739. [Google Scholar] [CrossRef] [PubMed]
  30. Ullah, H.; Ullah, B.; Wu, L.W.; Abdalla, F.Y.; Ren, G.; Zhao, Y. Multi-modality medical images fusion based on local-features fuzzy sets and novel sum-modified-Laplacian in non-subsampled shearlet transform domain. Biomed. Signal Process. Control 2020, 57, 101724. [Google Scholar] [CrossRef]
  31. Cao, Y.; Ma, S.W.; Liu, J.J.; Liu, Y.; Zhang, X. Fusion of medical images based on salient features extraction by PSO optimized fuzzy logic in NSST domain. Biomed. Signal Process. Control 2021, 69, 102852. [Google Scholar]
  32. Ganasala, P.; Prasad, A.D. Contrast enhanced multi-sensor image fusion based on guided image filter and NSST. IEEE Sens. J. 2020, 20, 939–946. [Google Scholar] [CrossRef]
  33. Daubechies, I.; Han, B.; Ron, A.; Shen, Z. Framelets: MRA-based constructions of wavelet frames. Appl. Comput. Harmon. Anal. 2003, 14, 1–46. [Google Scholar] [CrossRef] [Green Version]
  34. He, K.M.; Sun, J.; Tang, X.O. Guided image filtering. IEEE Trans. Pattern Anal. Mach. Intell. 2013, 35, 1397–1409. [Google Scholar] [CrossRef]
  35. Yin, H.; Gong, Y.H.; Qiu, G.P. Side window filtering. In Proceedings of the IEEE Conference on Computer Vision and Pattern Recognition, Long Beach, CA, USA, 15–20 June 2019; Volume 1, pp. 8758–8766. [Google Scholar]
  36. Sun, Z.G.; Han, B.; Li, J.; Zhang, J.; Gao, X. Weighted guided image filtering with steering kernel. IEEE Trans. Image Process. 2020, 29, 500–508. [Google Scholar] [CrossRef]
  37. The Whole Brain Atlas. Available online: http://www.med.harvard.edu/AANLIB/home.htm (accessed on 16 March 2023).
  38. Han, Y.; Cai, Y.Z.; Cao, Y.; Xu, X. A new image fusion performance metric based on visual information fidelity. Inf. Fusion 2013, 14, 127–135. [Google Scholar] [CrossRef]
  39. Zhang, L.; Zhang, L.; Mou, X.Q.; Zhang, D. FSIM: A feature similarity index for image quality assessment. IEEE Trans. Image Process. 2011, 20, 2378–2386. [Google Scholar] [CrossRef] [PubMed] [Green Version]
  40. Aslantas, V.; Bendes, E. A new image quality metric for image fusion: The sum of the correlations of differences. AEU-Int. J. Electron. Commun. 2015, 69, 1890–1896. [Google Scholar] [CrossRef]
  41. Zheng, Y.F.; Essock, E.A.; Hansen, B.C.; Haun, A.M. A new metric based on extended spatial frequency and its application to DWT based fusion algorithm. Inf. Fusion 2007, 8, 177–192. [Google Scholar] [CrossRef]
  42. Li, W.; Xie, Y.G.; Zhou, H.L.; Han, Y.; Zhan, K. Structure-aware image fusion. Optik 2018, 172, 1–11. [Google Scholar] [CrossRef]
  43. Kumar, B.K.S. Image fusion based on pixel significance using cross bilateral filter. Signal Image Video Process. 2015, 9, 1193–1204. [Google Scholar] [CrossRef]
  44. Liu, Y.; Wang, Z.F. Simultaneous image fusion and denoising with adaptive sparse representation. IET Image Process. 2015, 9, 347–357. [Google Scholar] [CrossRef] [Green Version]
  45. Sufyan, A.; Imran, M.; Shah, S.A.; Han, Y.; Zhan, K. A novel multimodality anatomical image fusion method based on contrast and structure extraction. Int. J. Imaging Syst. Technol. 2022, 32, 324–342. [Google Scholar] [CrossRef]
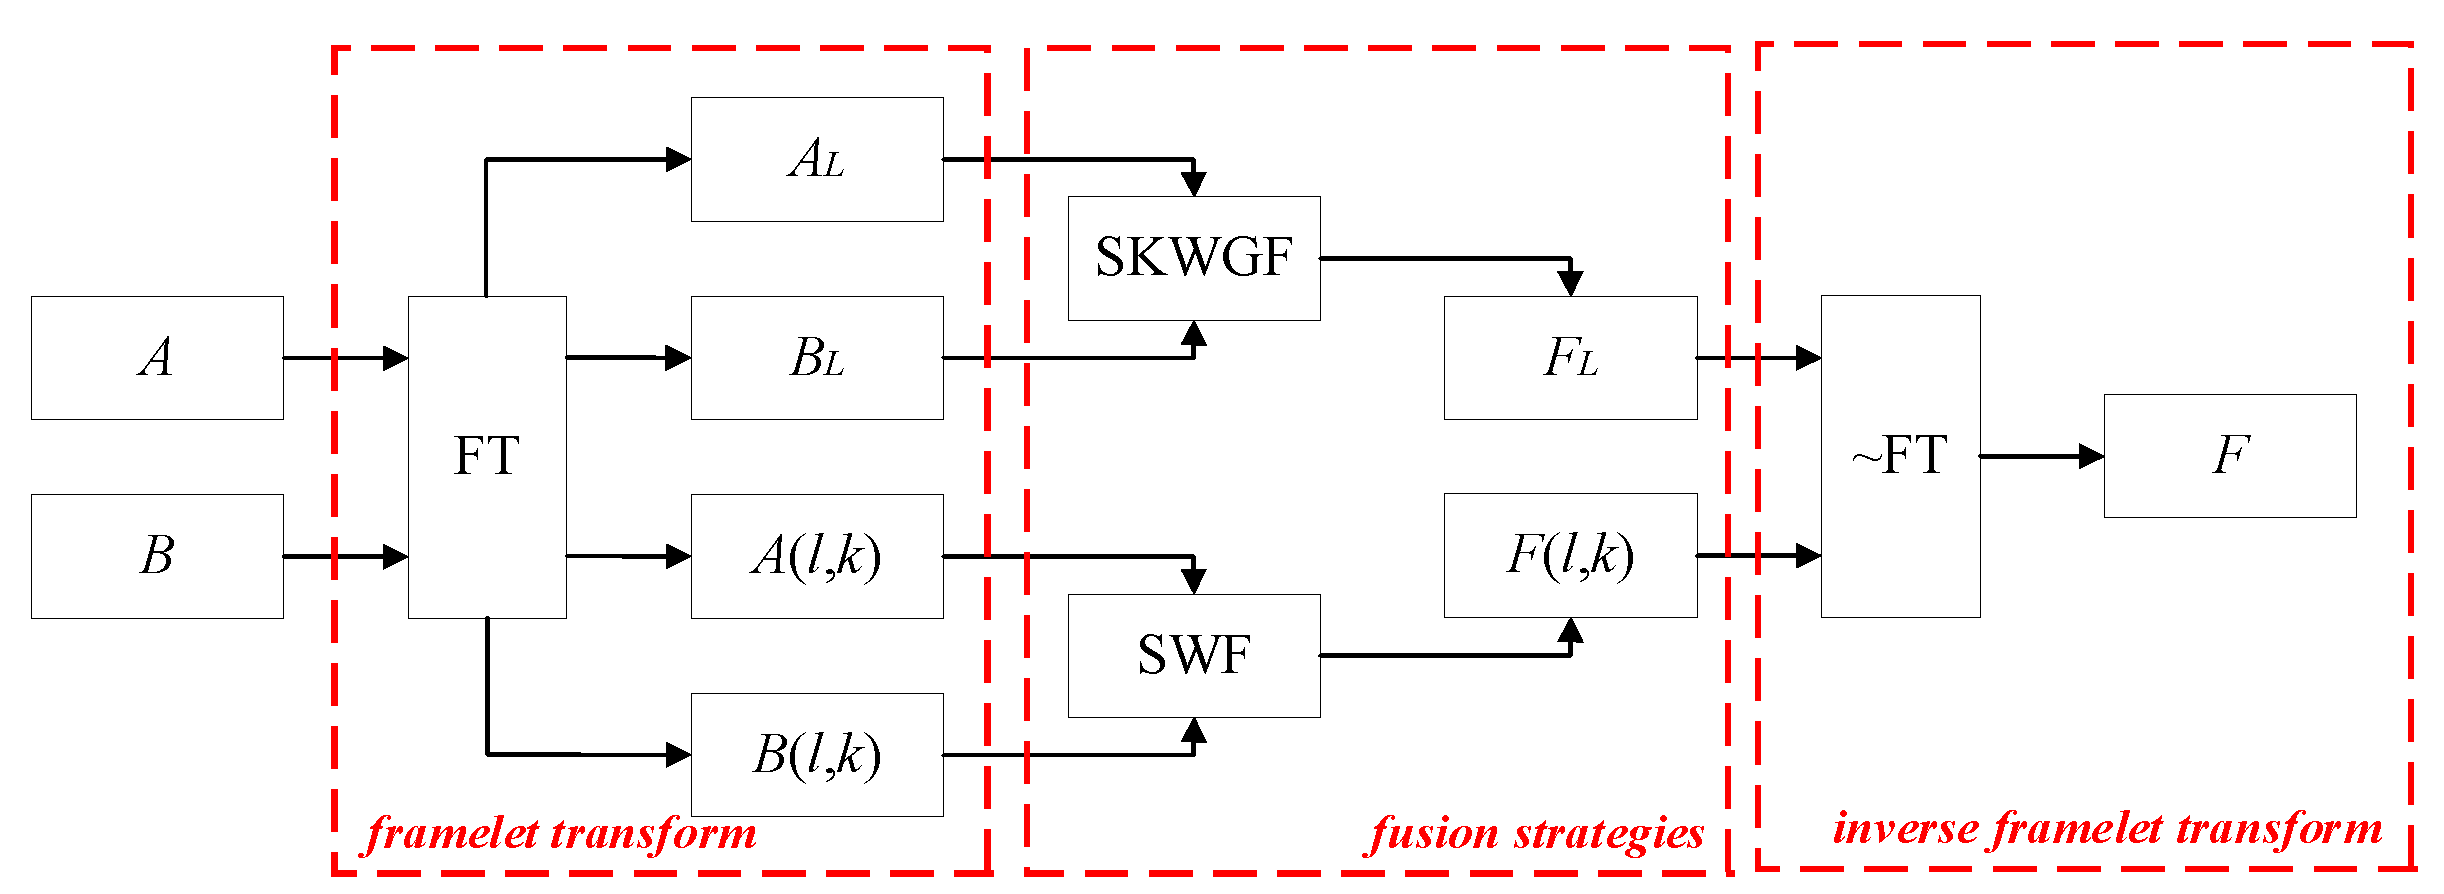
Figure 1. Schematic illustration of the proposed method.
Electronics 12 02659 g001
Figure 2. Schematic illustration of the proposed method. Comparative experimental results of GIF, WGIF and SKWGF for image edge detection. (a) Tulip color image. (b) Edge detection result based on GF. (c) Edge detection result based on WGF. (d) Edge detection result based on SKWGF.
Electronics 12 02659 g002
Figure 3. Source images of Pair I and corresponding fused images based on ten different fusion methods.
Electronics 12 02659 g003
Figure 4. Source images of Pair II and corresponding fused images based on ten different fusion methods.
Electronics 12 02659 g004
Figure 5. Source images of Pair III and corresponding fused images based on ten different fusion methods.
Electronics 12 02659 g005aElectronics 12 02659 g005b
Figure 6. Source images of Pair IV and corresponding fused images based on ten different fusion methods.
Electronics 12 02659 g006
Figure 7. Another two pairs of source images selected for further investigation.
Electronics 12 02659 g007
Figure 8. Fused images based on ten different fusion methods.
Electronics 12 02659 g008
Figure 9. Enlarged close-ups involved nine fusion methods on Pair V.
Electronics 12 02659 g009
Figure 10. Fused images based on ten different fusion methods.
Electronics 12 02659 g010
Table 1. Objective evaluation statistics of the ten different methods.
LRDPAPCNNCSRCSMCANSCT
PCLL
SACBFASRCSEProposed
Pair
I
SF26.8121
(9)
29.9538
(3)
34.6401
(1)
28.0534
(7)
30.0566
(2)
28.1254
(6)
29.7505
(4)
27.0640
(8)
25.1767
(10)
29.3681
(5)
FSIM0.9520
(2)
0.9416
(9)
0.9462
(6)
0.9563
(1)
0.9420
(8)
0.9476
(4)
0.9455
(7)
0.9466
(5)
0.9416
(9)
0.9513
(3)
SCD1.5737
(1)
1.0319
(5)
0.9752
(8)
1.1536
(3)
1.0360
(4)
0.8739
(9)
0.8270
(10)
1.0059
(6)
0.9889
(7)
1.4117
(2)
VIFF0.6033
(1)
0.4146
(6)
0.4240
(5)
0.4417
(3)
0.4251
(4)
0.2539
(8)
0.2238
(9)
0.3353
(7)
0.1860
(10)
0.5555
(2)
RANK13 (2nd)232014182730263612 (1st)
Pair IISF18.6469
(8)
19.7244
(4)
23.4363
(1)
19.5172
(6)
19.5219
(5)
19.8635
(3)
21.2294
(2)
18.6255
(9)
16.0243
(10)
18.9910
(7)
FSIM0.9317
(2)
0.9295
(4)
0.9252
(10)
0.9300
(3)
0.9292
(5)
0.9269
(7)
0.9253
(9)
0.9266
(8)
0.9347
(1)
0.9285
(6)
SCD1.7753
(3)
1.6007
(9)
1.6585
(6)
1.7815
(1)
1.6200
(8)
1.6759
(5)
1.6295
(7)
1.5430
(10)
1.7632
(4)
1.7776
(2)
VIFF0.5257
(3)
0.4287
(8)
0.5810
(2)
0.5103
(4)
0.4442
(7)
0.4953
(5)
0.4753
(6)
0.3444
(10)
0.4072
(9)
0.5821
(1)
RANK16 (2nd)251914 (1st)252024372416 (2nd)
Pair IIISF31.3911
(10)
32.1327
(8)
33.8108
(2)
32.7217
(5)
32.1942
(6)
34.2373
(1)
33.5904
(3)
32.0246
(9)
33.0751
(4)
32.1373
(7)
FSIM0.9005
(4)
0.8946
(9)
0.9088
(1)
0.9026
(3)
0.8943
(10)
0.8970
(7)
0.8989
(5)
0.8969
(8)
0.9046
(2)
0.8983
(6)
SCD1.7136
(1)
1.3566
(5)
0.4248
(10)
1.4074
(3)
1.3682
(4)
0.9932
(9)
1.0607
(8)
1.3235
(6)
1.0931
(7)
1.6352
(2)
VIFF0.4528
(2)
0.4040
(4)
0.2106
(10)
0.2774
(5)
0.4075
(3)
0.2364
(9)
0.2479
(7)
0.2658
(6)
0.2372
(8)
0.5098
(1)
RANK17 (2nd)262316 (1st)232623292116 (1st)
Pair IVSF33.7943
(6)
33.5398
(8)
34.0098
(3)
33.1408
(9)
33.6981
(7)
34.4743
(1)
33.8475
(5)
32.0853
(10)
33.8869
(4)
34.1113
(2)
FSIM0.9806
(7)
0.9813
(1)
0.9812
(2)
0.9807
(6)
0.9800
(9)
0.9809
(4)
0.9804
(8)
0.9809
(4)
0.9787
(10)
0.9810
(3)
SCD1.5594
(1)
1.5447
(2)
0.6316
(10)
0.9386
(6)
1.4146
(3)
0.7970
(9)
0.9291
(7)
0.9634
(5)
0.8268
(8)
1.2932
(4)
VIFF0.7715
(2)
0.7768
(1)
0.7028
(6)
0.5910
(9)
0.7369
(4)
0.7162
(5)
0.7022
(7)
0.5006
(10)
0.6815
(8)
0.7689
(3)
RANK16 (2nd)12 (1st)2130231927293012 (1st)
Table 2. Objective evaluation statistics of the ten different methods.
LRDPAPCNNCSRCSMCANSCT
PCLL
SACBFASRCSEProposed
Pair
V
SF12.7985
(10)
13.4532
(9)
15.8582
(4)
15.9873
(3)
16.0194
(2)
16.1320
(1)
15.2466
(7)
15.7746
(6)
15.7830
(5)
13.5003
(8)
FSIM0.9896
(2)
0.9885
(4)
0.9869
(8)
0.9865
(9)
0.9859
(10)
0.9872
(7)
0.9890
(3)
0.9884
(5)
0.9880
(6)
0.9908
(1)
SCD0.1550
(10)
0.2687
(9)
0.4864
(2)
0.4446
(6)
0.4572
(5)
0.4306
(7)
0.3798
(8)
0.4795
(3)
0.4677
(4)
0.5466
(1)
VIFF0.7818
(10)
0.8047
(9)
0.9391
(4)
0.9291
(5)
0.9394
(3)
0.9504
(1)
0.9041
(8)
0.9235
(6)
0.9473
(2)
0.9190
(7)
RANK323118232016 (1st)262017 (2nd)17 (2nd)
Pair VISF20.2025
(7)
20.6165
(6)
23.7851
(1)
20.8746
(5)
21.5583
(3)
20.9258
(4)
22.2221
(2)
19.9784
(8)
18.9172
(10)
19.4269
(9)
FSIM0.9392
(7)
0.9422
(3)
0.9387
(9)
0.9439
(2)
0.9490
(1)
0.9404
(6)
0.9335
(10)
0.9391
(8)
0.9419
(4)
0.9415
(5)
SCD1.3405
(3)
1.3159
(5)
0.9424
(10)
1.5042
(1)
1.0946
(8)
1.0309
(9)
1.1058
(7)
1.4101
(2)
1.3217
(4)
1.1503
(6)
VIFF0.4514
(8)
0.5622
(4)
0.5071
(6)
0.5910
(2)
0.5908
(3)
0.5461
(5)
0.4161
(9)
0.4134
(10)
0.4881
(7)
0.6608
(1)
RANK25182610 (1st)15 (2nd)2428282521
Table 3. Average running time of ten different fusion methods (unit: seconds).
LRDPAPCNNCSRCSMCANSCTPCLLSACBFASRCSEProposed
58.6937.90123.69576.5513.8130.489
1st
8.28768.5780.774
2nd
2.458
3rd
Disclaimer/Publisher’s Note: The statements, opinions and data contained in all publications are solely those of the individual author(s) and contributor(s) and not of MDPI and/or the editor(s). MDPI and/or the editor(s) disclaim responsibility for any injury to people or property resulting from any ideas, methods, instructions or products referred to in the content.