Article

Evolution towards Coordinated Multi-Point Architecture in Self-Organizing Networks for Small Cell Enhancement Systems

1
Department of Electronic Engineering, National Taipei University of Technology, Taipei 10608, Taiwan
2
Department of Electronic Engineering, National Quemoy University, Kinmen 89250, Taiwan
3
Department of Electrical Engineering, National Chin-Yi University of Technology, Taichung City 411030, Taiwan
*
Authors to whom correspondence should be addressed.
Electronics 2023, 12(11), 2473; https://doi.org/10.3390/electronics12112473
Submission received: 12 April 2023 / Revised: 10 May 2023 / Accepted: 26 May 2023 / Published: 30 May 2023
(This article belongs to the Section Microwave and Wireless Communications)

Abstract

:
This paper explores applications of the coordinated multi-point (CoMP) architecture operation of enhanced node B (eNB) in wireless communication networks featuring device-to-device (D2D) signaling. This is applied to cellular phone coverage for rapid mass transit systems, such as the Taiwan high speed rail transport system, and indoor public environments. The paper is based on formulas pertaining to the link between budget design and guidelines, as well as principles and theories of engineering practice, allowing designers to analyze and fully control the uplink and downlink signals and output power of fiber repeaters linking cellular phones to base stations. Finally, we employ easily installed cellular-over-fiber optic solutions for a small cell enhancement (SCE) system with novel architecture based on a leakage coaxial cable system using LTE-A technology. As a result, we successfully applied enhanced coverage designs for distributed antenna systems. These can be used to create self-organizing networks (SoN) for an Internet of Things.

1. Introduction

This paper investigates the small cell enhancement (SCE) [1] system, which applies radio frequencies over a coordinated multi-point architecture (CoMP) [2,3] for wireless small cellular communication based on Self-organizing network (SoN) operation scenarios [4,5], which play an important role in fulfilling the goals of operation in multi-radio access technology (Table 1). Important requirements for the goals of operation in multi-radio access technology (Multi-RAT) [6,7] include multi-Vendor devices and multi-Layer devices with an operating channel bandwidth ranging from 700 to 2350 MHz [8,9].
The convergence of small cell enhancement systems aligns with the adoption of NB-IoT/LTE/5G and the advantages of modularization and interoperability. The deployment of cellular-over-fiber optic solutions for multi-radio access technologies is becoming increasingly widespread.
Small Pico cell environments with minimal capital costs and risk enable operators to trial these systems. A coordinated multi-point architecture offers advantages such as enhanced transmission and improved reliability and compatibility, resulting in additional average revenue per user and reduced churn through indoor coverage of NB-IoT/LTE/5G.
Deploying these systems in large macro environments would incur significant costs and increase risk, which is why operators are attracted to the benefits of small cell enhancement solutions.
Based on CoMP use cases, which have been discussed in detail, various architecture options and tradeoffs relating to the implementation of SoN are solved. This helps meet capacity enhancement. The benefits include the CoMP convergence trend that integrates wireless small cellular adoption, along with modularization and interoperability technologies. SCE systems can effectively meet the reliability, compatibility, and performance needs of this infrastructure, and Telecomm operators believe this will address the question of the last mile transmission network.
Small cell enhancements (SCEs) have the unique advantage of improving capital expenditure (CAPEX) issues for operators due to low capital costs, the promise of a fast roll out of new services, and the low implementation risk associated with trying out these systems. Compared to employing equipment for a massive macro cell environment, which would require significant amounts of money and increase risk, operators enjoy the advantages of an evolution towards systems organized within the three quadrants shown in Figure 1. The CoMP architecture for incorporating SoN network solutions into SCE systems for IoT applications within the novel usage environment is shown in Figure 2.
The theory of SCE infrastructure includes a carrier transmission current line between the substation and the user end device. A SCE is a modularized flexible expansion of subsystems that transmit radio frequency energy via fiber conduction or spectrum radiation [10,11].
Operators would normally obtain these benefits by distributing responsibilities among several multi-operator indoor system projects. This thesis instead investigates SCE systems, applying multiple distribution points for remote radio technology in cellular communication systems within the Metro, High-Speed Railway, and Subway environments, to conduct an analysis of public coverage using a novel indoor transmission system.
Large public spaces such as airports, shopping malls, subways, and stadiums account for a large portion of the market size. These has mainly been serviced by passive distributed antenna systems (DAS). Large office spaces owned by a single enterprise have also been significant adopters of DAS solutions. Repeaters have been a signal source for many years, together with enhanced Node B, which, as of now, is the main signal source for any indoor distributed antenna system.
This structure of this paper is based on the hierarchy of Self-organizing Networks, as depicted in Figure 3. The design rules of SCE for SoN [12] are described in Section 2. Regarding subsequent sections, research into the key factors and solutions for the fiber optical repeater (FR) over the SCE system of D2D architecture for a SoN are described in Section 3 and Section 4, respectively. Lastly, conclusions are drawn in Section 5.

2. Design Rules of Small Cell Enhancement Systems

CoMP enables joint transmission to and/or reception from mobile devices. It also allows the coordinated optimization of transmission and reception from multiple distribution points (MDP). This can either consist of multiple cells or remote radio heads (RRHs).

2.1. Basic Theory

Based on CoMP scenarios, a diagram of the conceptual structure of radio frequency over SCE fiber optical repeater operation is shown in Figure 4. The fiber optical repeater consists of two modules. The first, which is the main distribution point, is the main unit (MU). The MU converts radio frequency signals in downlink (DL) to optical signals and converts optical signals to radio frequency signals in uplink (UL).
The second module is the remote unit (RU), which features RRHs and detects downlink signals and uplink signals.
A structure diagram of the MDP [13] system is illustrated in Figure 5. The radio frequency signals coming from the eNB’s downlink are roughly +13 dBm [14]; therefore, the signal level should be attenuated for optical module receiving. The optical signals are separated into multimode multi-channel signals by RUs. Consequently, the multimode radio frequency downlink consists of a splitter and an autotune-adjustable digital attenuator.
As the MDP receives optical signals through optical modules and directs them towards the RU, the conversion of radio frequency signals occurs via the uplink signal path’s radio frequency modules. Consequently, the radio frequency multimode consists of a combiner and an autotune-adjustable digital attenuator.
Its purpose is to distribute the uplink signal’s power, which manifests as an attenuated radio frequency signal level in the eNB (where the noise floor is ≦−120 dBm). The eNB caters to multiple cellular phones or IoT devices, thereby increasing the input noise to the signal level, which can surpass −120 dBm, subsequently disrupting the communication of weak-signal cell phones and impeding the quality of calls.
A structure diagram for a RRH [15] is displayed in Figure 6. The remote optical unit, housed within a wireless terminal, serves the cellular phone.
In the downlink signal path, the RRH’s optical module receives an optical signal from the MDP and converts it into a radio frequency signal. This radio frequency signal is then amplified by a power amplifier and transmitted through the antenna. Consequently, the fundamental downlink architecture of the RRH is composed of an optical module, IF filtering, a high-frequency conversion module, and a power amplifier module.
Similarly, in the UL part, the RRH’s antenna receives a mobile station signal, which is then modulated to an optical signal through an independent fiber and sent back to the MDP. Next, the MU functions of the UL of the optical signal from the optical module convert this signal into a radio frequency signal, which is sent back to the base station. Thus, the basic UL architecture of the RRH comprises a low-noise amplifier module, IF filtering, a frequency conversion module, and an optical module.
Finally, this study investigates SCE systems applied as multiple distribution points for remote radio head technology. Additionally, it examines experiences in designing, implementing, and managing multi-operator solutions and determines whether the operators’ concerns about sharing can be alleviated to the satisfaction of all participants and whether the cost/benefit ratio and profitability that results from sharing with other operators outweighs any limitations. This has largely been the case among DAS vendors that can support multiple services over novel high bandwidth cellular-over-fiber optic indoor transition systems, as shown in Figure 7.
The introduction of indoor multi-operator systems may satisfy many groups a with vested interest, such as the public, building owners, and various government authorities, as well as satisfy the common interest of mobile operators as it could reduce costs, enhance coverage, and ensure the rapid roll out of new services.
There is evidence to suggest that multi-operator solutions can provide tremendous benefits by allowing operators to share the costs of the SCE system analysis and infrastructure resources, equipment rooms, transmissions, power, leasing agreements, site acquisitions, civil works, and operation and maintenance of the indoor sites, as shown in Figure 7.

2.2. Channelization of Link Budget

Following on from previous discussions, the influence of UL output power can be determined by examining two aspects: noise figure and cellular phone output power. In cases where the fiber optical repeater gain control settings surpass the path loss, the noise figure of the fiber optical repeater for the eNB is comparably lower. If approximately 10 dB of margin are left on this basis, then the noise figure of the fiber optical repeater for the eNB will be less than 0.3 dB. The smallest possible fiber optical repeater noise figure should be selected, and reasonable adjustments should be made to the fiber optical repeater gain and efficiency control of fiber optical repeater transmitter power. By doing this, it is possible to avoid the adverse impacts of UL noise on the network.

2.2.1. Path Loss

The Friis free-space equation [16] can be seen in Equation (1):
P r d = P t G t G r ( λ / 4 π d ) 2 L
The formula under consideration is given by Pr(d) = Pt Gt Gr (λ/4πd)2 L, where Pr(d) represents the received power at a distance of d from the transmitter, Pt denotes the transmitter power, Gt and Gr stand for the respective antenna gains of the transmitter and receiver, λ is the wavelength of the signal, d represents the distance between the transmitter and receiver, and L represents the system loss factor.
Based on the Fraunhofer distance [17], this can be written as Equation (2):
d f = 2 D 2 / λ 2
Here, D is the largest physical linear dimension of the antenna. Additionally, in the far-field region, df is the Fraunhofer distance, which must meet the following two conditions:
  • df > D, df > λ.
It is clear that Equation (1) does not hold for d = 0. For this reason, the propagation mode for large-scale power reception uses a near-field distance d0 as the 20 to 30 λ reference.
  • d > d0 > df.
At any distance greater than d0, the received power, Pr(d), may be related to the power Pr at d0. The value of Pr(d0) predicted by Equation (1) can be determined by averaging the received power at multiple points located at a near-field radial distance of d0 from the transmitter. It is important to select a reference distance that lies in the far-field region, that is, d > df, and d0 should be smaller than any practical distance used in the wireless communication system. Hence, Equation (1) can be used to calculate the received power in free space at a distance d0, where the received power, Pr(d), is equal to Pr(d0) multiplied by (d0/d)2.
In wireless communication systems, it is not unusual for the received power, Pr, to vary by several orders of magnitude across a typical coverage area of several square kilometers, leading to a large dynamic range of received power levels that can be expressed in units of decibel-milliwatts. When these conditions are met, the received power can be written as Equation (3):
P r d dBm = P d 0 + 20 log ( d 0 / d )

2.2.2. Link Budget between eNB and Cellular Phone

The necessary factors for the calculation of the link budget parameter are shown in Table 2.
eNB and cellular phone sensitivity (S) is the sum of the minimum noise floor (Nmin), noise figure (NF), and minimum signal-to-noise ratio S N min. The sum can be expressed as Equation (4):
S = N m i n + N F + S N m i n
For work in the telecommunications field, the maximum radio frequency uplink path loss signal can be written as Equation (5):
P L U L , m a x = P O c e l l u l a r   p h o n e S e N B
In this equation, PLUL,max is the maximum radio frequency uplink path loss signal, POcellular phone is the output power of the Cellular Phone, and SeNB is the sensitivity of BTS.
The maximum radio frequency downlink path loss signal can be written as Equation (6):
P L D L , m a x = P O e N B S c e l l u l a r   p h o n e
In this equation, PLDL,max is the maximum downlink path loss, POeNB is the eNB output power, and Scellular phone is the cellular phone sensitivity.
Therefore, the highest path loss discrepancy of the bi-direction imbalance (Imb) can be expressed as Equation (7):
I m b = P L D L , m a x P L U L , m a x
According to the standard of 3GPP Technical Specification, the calculation of link budget processing can be divided as follows:
  • Determine the sensitivity of eNB and cellular phone:
    SeNB = (−120 dBm) + 10 dB + 9 dB = −101 dBm.
    Scellular phone = (−121 dBm) + 12 dB + 9 dB = −100 dBm.
  • Find the maximum radio frequency uplink path loss signal, PLUL,max:
    PLUL,max = POcellular phoneSeNB = 30 dBm − (−101 dBm) = 131 dB.
  • Find the maximum radio frequency downlink path loss signal, PLDL,max:
    PLDL,max = POeNBScellular phone = 44 dBm − (−102 dBm) = 146 dB.
  • Find the highest path loss discrepancy of the bi-direction imbalance, Imb:
    Imb = PLDL,maxPLUL,max = 146 dB − 131 dB = 15 dB.
In the greatest path loss of two directions, there is a clear unbalance. If the downlink output power of the higher signal is adjusted, there will be a very noticeable increase in unbalanced production. Therefore, increasing the downlink output power does not greatly help the system equilibrium.

3. Research of the Key Elements

In a small cell communication system with device-to-device architecture between eNB and cellular phone, the thermal noise signal produced by the added fiber optical repeater directly reduces the receiving sensitivity of eNB.

3.1. Calculating Gain of Fiber Optical Repeater

The use of an fiber optical repeater in a Self-organizing Networks causes leveling on eNB due to the fiber optical repeater receiving the radio frequency signal.
In the uplink, the communication service of the cellular phone is often constrained by the high power of interfering signals at the eNB receiver. To ensure the required Eb/No, where Eb represents the energy per bit and No represents the spectral noise density, the transmission power of the cellular phone must be carefully controlled.
In downlink, this effect will cause the same problem in the cellular phone receiver. The eNB of power thermal noise, Pth, can be expressed as Equation (8):
P th = 10 log [ K T B ]
where:
B is the signal bandwidth (200 kHz/channel).
K is Boltzmann’s constant (1.38 × 10⁻²³ J/K).
T is the absolute temperature (290 °K).
The noise power of the eNB receiver, PeNB, can be expressed as Equation (9):
P e N B = 10 log K T B + N F e N B  
In this equation, NFeNB is the noise figure of the eNB. If NFeNB is set to 2 dB, then the value of PeNB becomes −119 dBm.
When the fiber optical repeater injects and links between power sources and eNB, the noise power of the receiver is the sum of the noise power in the eNB and fiber optical repeater.

3.2. Injection of eNB Deviation by Fiber Optical Repeater

In the uplink, a high level of interfering signal power at the eNB receiver can pose a hindrance to communication services for cellular phones. The transmission power in a cellular phone is set to ensure the required Eb/No. Notably, the fiber optic repeater, being an active component, will powerfully amplify the transmission interfering signal energy level, which includes thermal noise power. Consequently, the output noise power of the fiber optic repeater, Prep, can be expressed as follows:
P r e p = 10 log K T B + P e N B + N F r e p + G r e p
Here, NFrep is the noise figure of the fiber optical repeater and Grep is the gain of the fiber repeater.
The propagation model of the path loss from eNB to fiber optical repeater is Lp. Therefore, the noise power signal injected by the fiber optical repeater in the eNB receiver, P′rep [17], can be written as Equation (11):
P r e p = P r e p L p = 10 log KTB + P th , e N B + N F r e p + G r e p L p = 119 dBm + P th , e N B + N F r e p + G r e p L p
When the fiber optical repeater is injected in the eNB receiver, the total noise power, PeNB,total [18], can be expressed as Equation (12):
P e N B , t o t a l = P e N B P r e p = 10 log [ 10 P e N B + 10 P r e p ] = P e N B + 10 log 1 + 10 N F r e p + N F e N B + L p 10 = P e N B + N e N B
where
N e N B + 10 log 1 + 10 N F r e p + N F e N B + L p 10
The above analysis demonstrates that an injected fiber optical repeater increases the noise power in the eNB receiver compared to one without a fiber optical repeater. Furthermore, there are many factors that may affect the noise floor of the eNB receiver.
Parameters related to the above include the noise figure of eNB, NFeNB the noise figure of the fiber optical repeater, NFrep the gain of the fiber optical repeater, Grep and Lp, the path lossfrom eNB to fiber optical repeater. The equation can be presented as Equation (13):
  • Case 1: When NFrepNFeNB + GrepLp = 0, by ΔNeNB, the noise floor has increased to 3 dB, in the receiver terminal of eNB.
  • Case 2: When NFrepNFeNB + GrepLp = −6, by ΔNeNB, the noise floor has increased to 0.97 dB, in the receiver terminal of eNB.
  • Therefore, in this case, the injected fiber optical repeater does not have an influence on the eNB receiver. Usually, the noise figure of eNB, NFeNB = 2 dB. According to Equation (10), the eNB noise power injected by the fiber optical repeater is Prep = −125 dBm.
That is why, in engineering practice, the noise figures of the eNB and fiber optical repeater are constant, the noise floor increase in eNB receives the port, and ΔNeNB influences the path loss of the eNB transmitter to fiber optical repeater and fiber optical repeater Grep.
The noise figure of eNB, NFeNB = 2 dB. The noise figure of fiber optical repeater, NFrep = 5 dB as usual. The gain of the fiber optical repeater, Grep, should be lower than the 8 dB path loss. By limiting Grep, the ΔNeNB would be controlled and kept to under 1 dB.
Since, in the network design, the hypothetical range of the objective coverage plane is relatively high, there is a need to connect parallel several fiber optical repeaters. In this case, the noise floor of the eNB receiver, PeNB,total is the noise figure and the thermal noise power signal injected by the fiber optical repeater to the eNB receiver port, Prep, is shown to be Prep,total = 10log [10PeNB + 10(Prep′)]. The quantity of fiber optical repeaters is given by n. For the purpose of controlling the Prep,total, the ΔNeNB must be under 1 dB. The eNB noise floor is increased by the fiber optical repeater, as shown in Table 3.
In the case that every one of the fiber optical repeaters has the same path loss Lp, then the fiber optical repeater gain in n fiber optical repeaters is smaller than that of one fiber optical repeater. In n fiber optical repeaters, the dropped value of fiber optical repeater gain is approximately 10logn. In standard practice, the uplink gain of a fiber optical repeater is set in the eNB receiver, following below considerations:
  • The path loss Lp from eNB transmitter to fiber optical repeater.
  • The number of fiber optical repeater in parallel to eNB receivers.
In standard use, the fiber optical repeater directly couples to the communication traffic signal, which comes from the eNB, and the path loss of the fiber optical repeater coupling to the coupler is Lp. Applying the same approach for the uplink of the fiber optical repeater gains gives a small coupling loss of approximately 8 dB.
Two parallel fiber optical repeaters would be needed in practice. In general, these can be chosen for a high coupling ratio coupler, where the input optical fiber traffic signal of fiber optical repeaters = 0 dBm. Therefore, the path loss Lp from eNB to the fiber optical repeater = 39 dB. The uplink gain of the fiber optical repeater = 27 dB, so the fiber optical repeater injects the eNB receiver port, whose sensitivity are not influenced. The calculation of uplink budget for the fiber optical repeater is shown in Table 4.

3.3. Calculation of Equilibrium between Fiber Optical Repeater and Cellular Phone

Implementation of the downlink gain in the fiber optical repeater involves controlling the output power of the fiber optical repeater. It is necessary to consider the upstream and downstream balance between the optical fiber optical repeater and the mobile station [18]. As an equilibrium guarantees the transmission power to UL and downlink, the fiber optical repeater should satisfy the following:
P o - r e p P o - c e l l u l a r   p h o n e + N F c e l l u l a r   p h o n e N F r e p
Here, Po-rep is the output power of the fiber optical repeater, Po-cellular phone is the MU of output power, NFcellular phone is the noise figure of the cellular phone, and NFrep is the noise figure of the fiber optical repeater. The maximum of the cellular phone output power is Po-cellular phone = 33 dBm, the noise figure of the cellular phone is NFcellular phone = 6 dBm, and the noise figure of FR is NFrep = 5 dBm. Therefore, the maximum fiber optical repeater output power is Po-rep = 33 + 6 − 5 = 34 dBm.
MDP–RRH latency introduced by the fiber optical repeater is not the only delay to take into account. In fact, delays introduced by coaxial cables and fiber optic links used in the application must be considered. The delays analyzed by the equipment are summarized as follows [19]:
  • Repeater absolute delay time, Td-Rep, is 6–8 μs.
  • Coaxial cable delay time, Td-Coax, is D/0.88 × C.
  • Optic fiber delay time, Td-Opt, is D/0.66 × C.
where:
C is the speed of light (m/s).
D is the length of the coaxial cable or of the optic fiber (m).
There are two types of delay time (absolute and relative) that need to be considered in the design. When an eNB or a MU receives both direct and through repeater paths, the relative time delay difference between the two paths will determine the correct functioning of the system. Relative delays larger than the searcher window will probably cause the call to drop when moving from the repeater coverage area to the eNB, since the system cannot handle the handover between the two paths.
The absolute repeater delay can cause positioning systems to not work correctly. This really depends on the type of positioning system employed. In the Cell ID method, the repeater delay will not affect the identification of the serving cell whose serving area is used to identify the MU location. In the round-trip time (RTT) method, the estimation of MU location strongly depends on the delay time between the MU and eNB.
Two examples of the signal path delay calculus are depicted in Figure 8 for eNB to FR and in Figure 9 for FR to FR:
(1)
One signal arrives directly from the eNB while the other is retransmitted via optical equipment. This can be expressed as Equations (15) and (16):
Time   Delay   eNB   is   T D e l a y   e N B = 3.3   μ s × L / 2
Time Delay FR is TDelay FR = 5 μs × L + 5 μs + 3.3 μs × L/2
where:
L is the distance between eNB and FR.
The first term represents the delay introduced by the fiber cable, the second term represents the delay introduced by the fiber optical repeater, and the third represents the RF propagation delay, as shown in Figure 8.
The upper limit is instead fixed by the system. It is represented by the specialist that actually looks for the signals with different paths with the aim to re-combine. The specialist has a scan window of approximately 20 μs.
Therefore, Equation (16) minus Equation (15) should be satisfied as:
P D e l a y   F R = P D e l a y   e N B < 20   μ s
Therefore, the maximum L is 3 km.
(2)
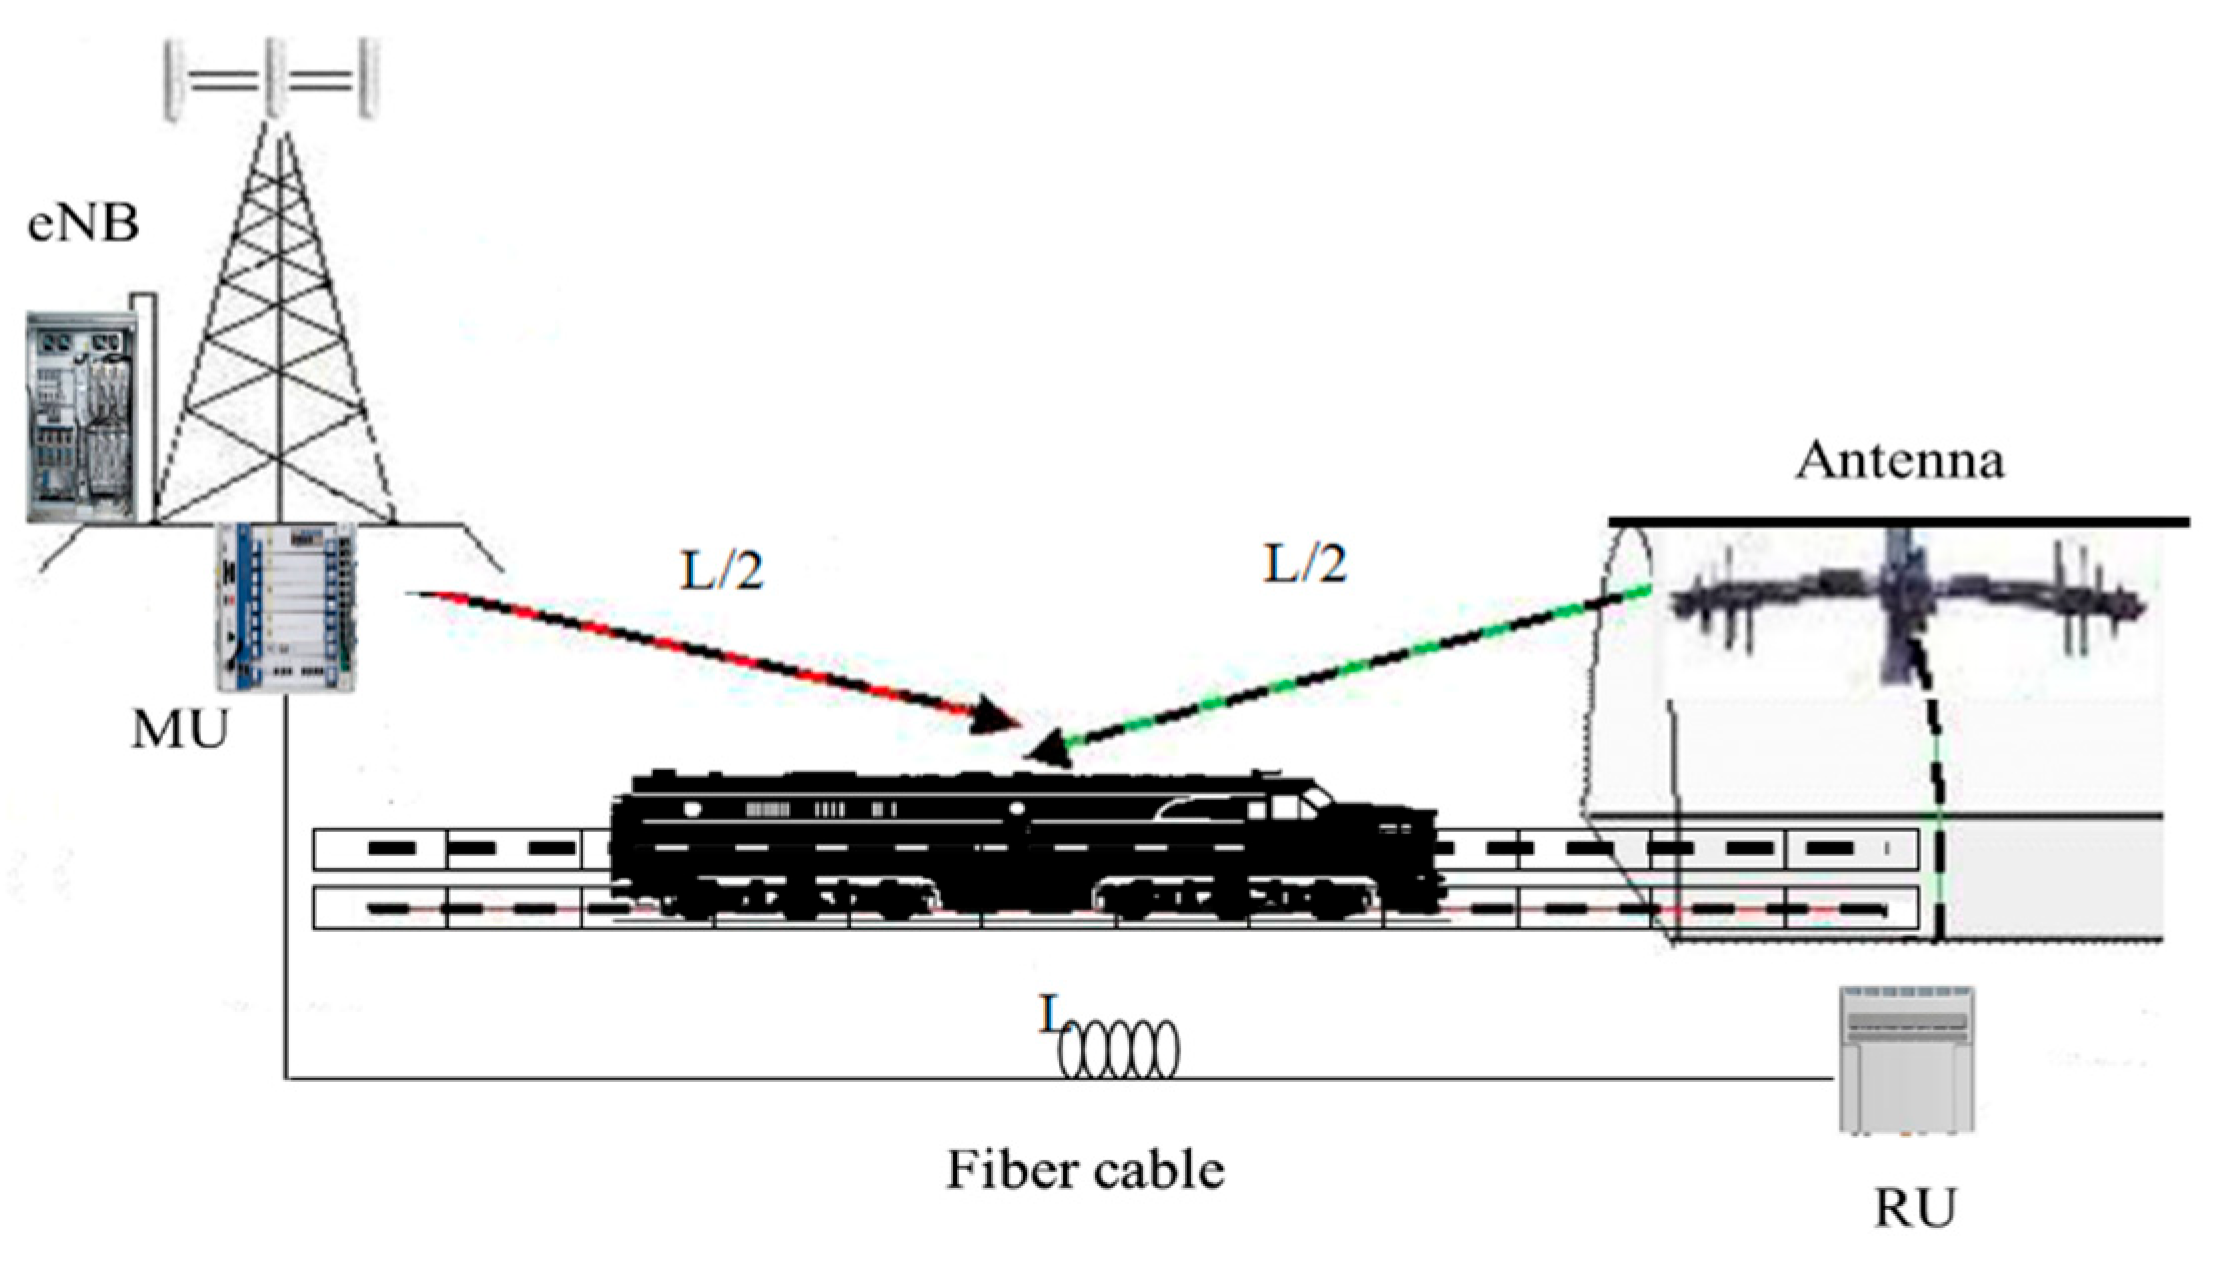
Two signals have been retransmitted from two different fiber optic RUs, as shown in Figure 9.
3.3 μs × L/2 +5 μs × L − 3.3 μs × L/2 < 20 μs
Therefore, the maximum distance S is 4 km.
Attention should be paid to the downlink budget of fiber optical repeaters. In the case of the fiber optical repeaters in practice, once the implementation of gain adjustment has been considered, isolating the fiber optical repeater and the antenna prevents local oscillations and localization in the fiber optical repeater.

4. Solution of the Fiber Optical Repeater

The task of MDP–RRH network planning in indoor environments presents a challenge due to the complexity of conducting accurate simulations. While macro, micro, and small cellular network planning may rely on propagation models, such as the Keenan–Motley model for steady state low mobility or the Okumura–Hata model for outdoor dynamic state height mobility, simple models may not suffice in indoor environments. The 3GPP propagation loss model may be used for indoor environments [20], but distributed antenna systems (DAS) are the most common approach for in-building coverage.
Typically, DAS employs small, discrete antenna elements, low-gain directional antennas, or omni-directional antennas designed specifically for indoor use. In a passive DAS implementation, the signal is transferred from the eNB through a network of feeder cables connected by splitters and couplers. While DAS offers advantages such as easy planning and good coverage, it also has drawbacks, such as high installation costs when compared to indoor small cells, micro cells, macro cells, and indoor-to-outdoor seamless solutions.

4.1. System Infrastructure and Link Budget

In the real-life deployment of Taiwan Railway Administration (TRA) mobile communication systems, leakage cables (Andrew Company) were used. The performance of a leakage cable is quantified by the attenuation loss and coupling loss.
The attenuation loss is determined in a similar manner to that of a traditional coaxial cable, while the coupling loss is defined as the difference in power between the transmission power inside the leakage cable and the received power with a standard dipole antenna positioned at a distance of 1 m from the leakage cable. The attenuation loss usually ranges from 2.1 to 4.87 dB/100 m, while the coupling loss ranges from 68 to 71 dB for the leakage cables at NBIoT/LTE-A and 5G frequency bands, as indicated in Table 5.
The TRA underground environment includes multi-layer services stations and dual parallel tunnels. The coverage of stations is realized using a hybrid antenna system approach. Hybrid solutions are used in two areas: 1. Tunnel coverage with active fiber optic distribution systems and passive leakage cables. 2. Station coverage with passive distributed antenna systems, as shown in Figure 10.
Real Case 1: TRA R4–R4A implementation and measurement practices.

4.1.1. Indoor Coverage Requirements and Inspection Methods

Measurements were made in three different areas. In the TRA underground environment, including multi-service stations and tunnels [21], the signal coverage should be above 95% in order to meet the acceptable requirements and conditions. These are listed in Table 6.

4.1.2. Link Budget and Novel System Network Structure

The SCE system self-organizing network with a coordinated multi-point infrastructure plan of the subway and tunnel environments, as well as the corresponding traffic data signal objective coverage, is shown in Figure 11 [22]. The purpose of the system is to improve the overall passive and massive data efficiency, as shown in Figure 12.

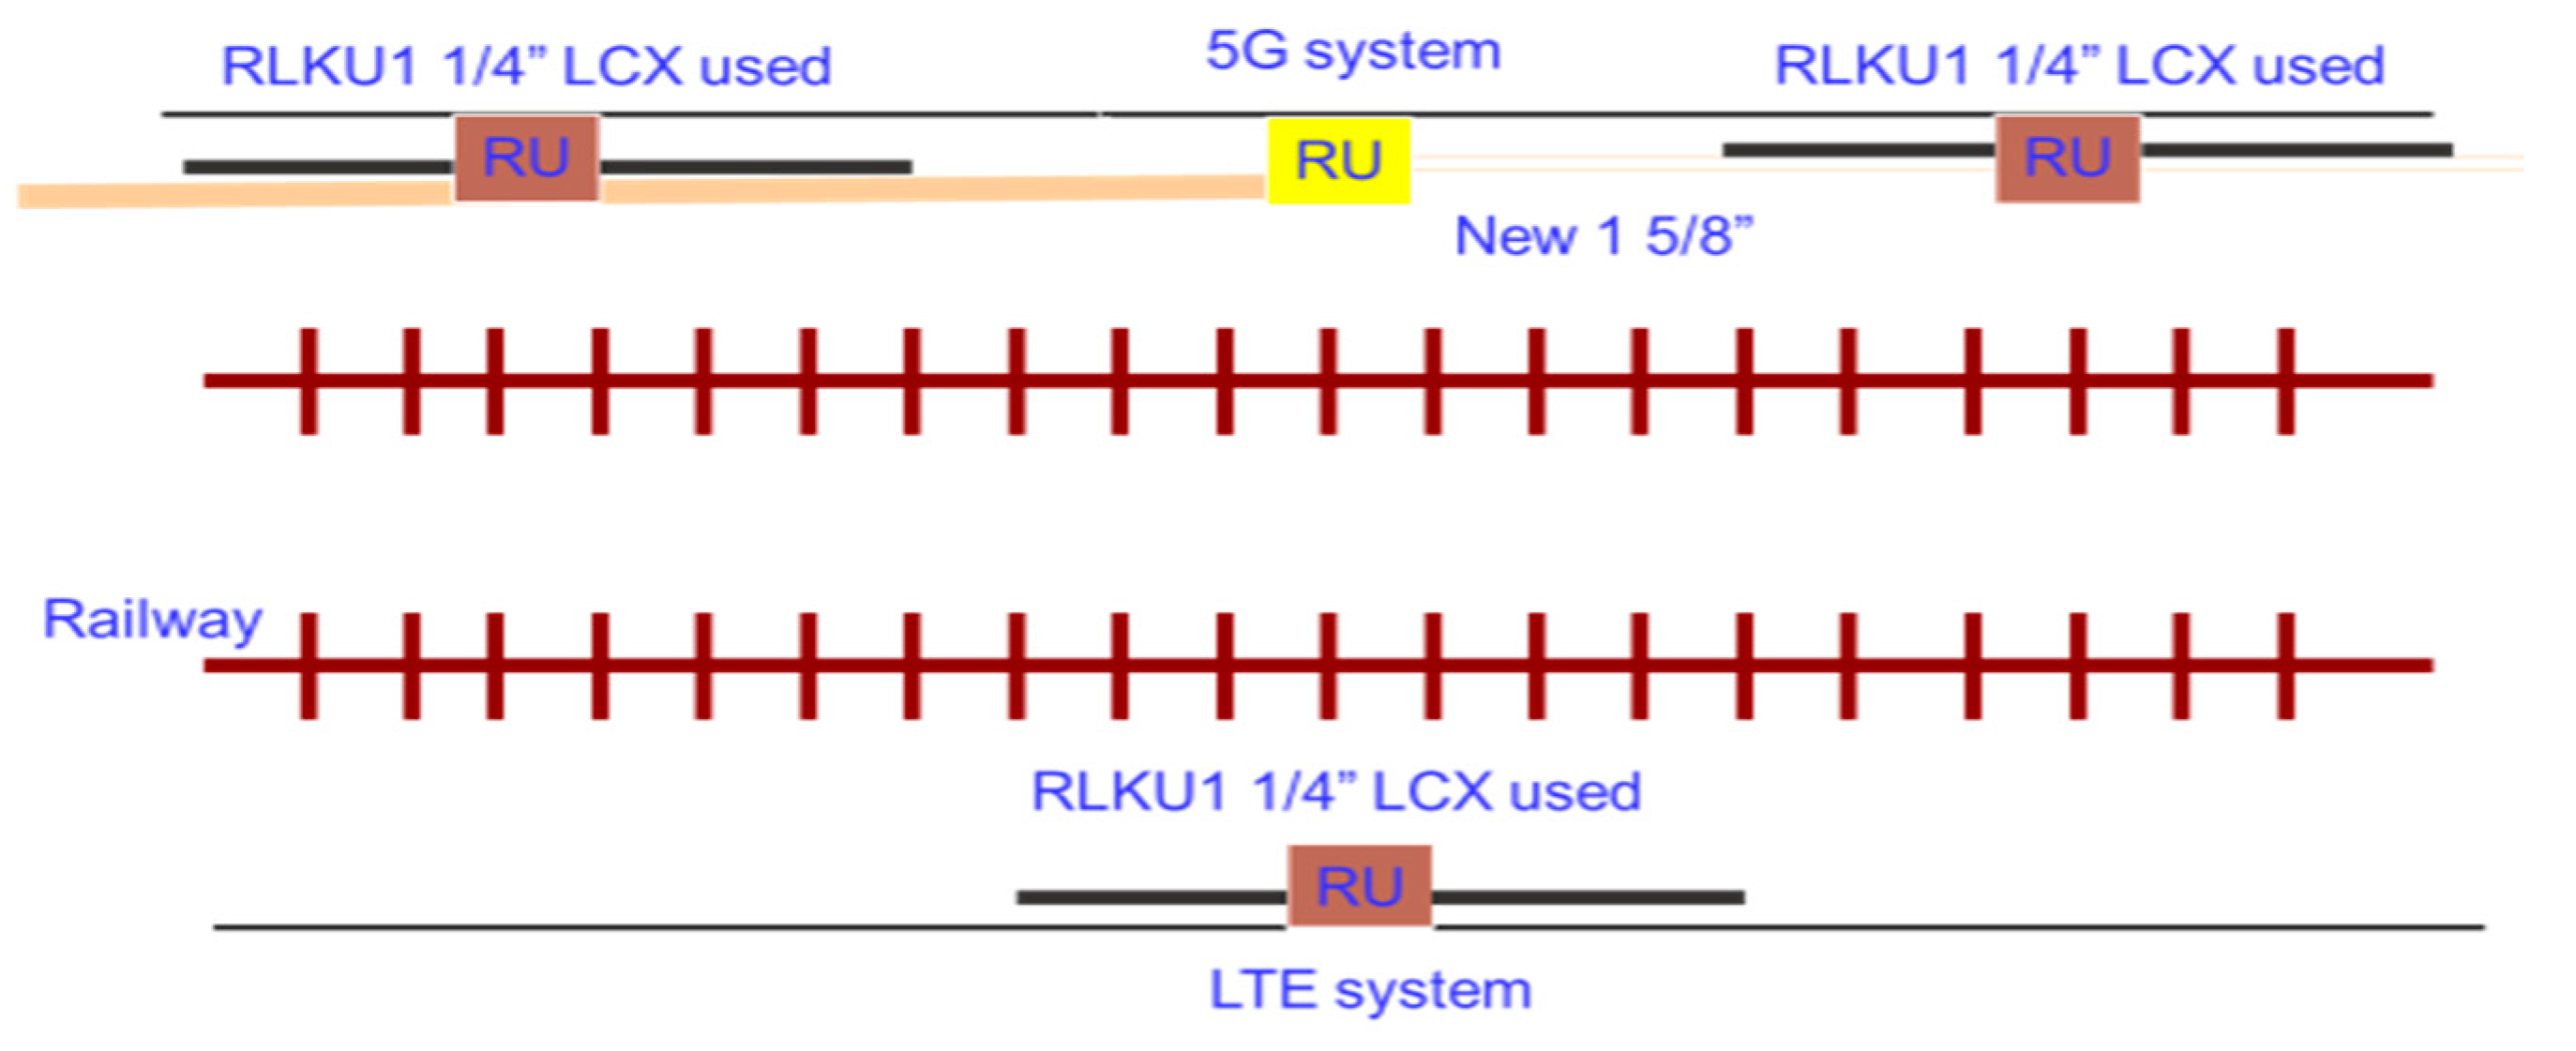
4.1.3. An Add-on Solution Consisting of a New 5G FR on the Empty Side

Add-on 5G fiber repeater products can be deployed with new 1-5/8 cables in tunnels, platforms, and buildings through combiner share antennas without disturbing the existing architecture, as shown in Figure 13.
For LTE TX/RX combined with add-on 5G products via TX/RX combining, new add-on antennas are located at the leakage end through existing 1-1/4 leakage cables, as shown in Figure 14.
The tunnel-centric coverage of LTE systems based on existing RFS leaky cables for DAS plans is described below:
We assume that output CPICH for LTE up to four carriers is +24 dBm (Composite + 34 dBm). The 250 m LCX 11/4: longitude loss is 20.4 dB.
If an 11.5 dB Yagi antenna is added at the end of 250 m LCX, the EIRP is 24 − 20.4 − 3.5 − 0.5 + 11.5 = 11.1 dBm.
We assume Wagon loss and crowd loss = 25 dB. The received signal inside Wagon from the Yagi antenna is shown in Table 7.
The use of multi-RAT to establish an automated neighbor relation function (ANRF) and the configuration of physical cell identity (PCI) for the optimization of mobility and data efficiency in multiple radio access and layer technology (Multi-RAT-Layer) [23,24,25] are shown in Figure 15.

4.1.4. Calculations of the Power Spectrum Density

R4/R4A station leakage coaxial cables installed at well number three of the south and north tunnels are connected to the RU output port [25,26]. For example, the R4/R4A station is as shown in Figure 16.
First, mobility robustness optimization (MRO) can improve the successful handover ratio of key factors and benefits, as shown in Figure 17.
Factor analysis is described below:
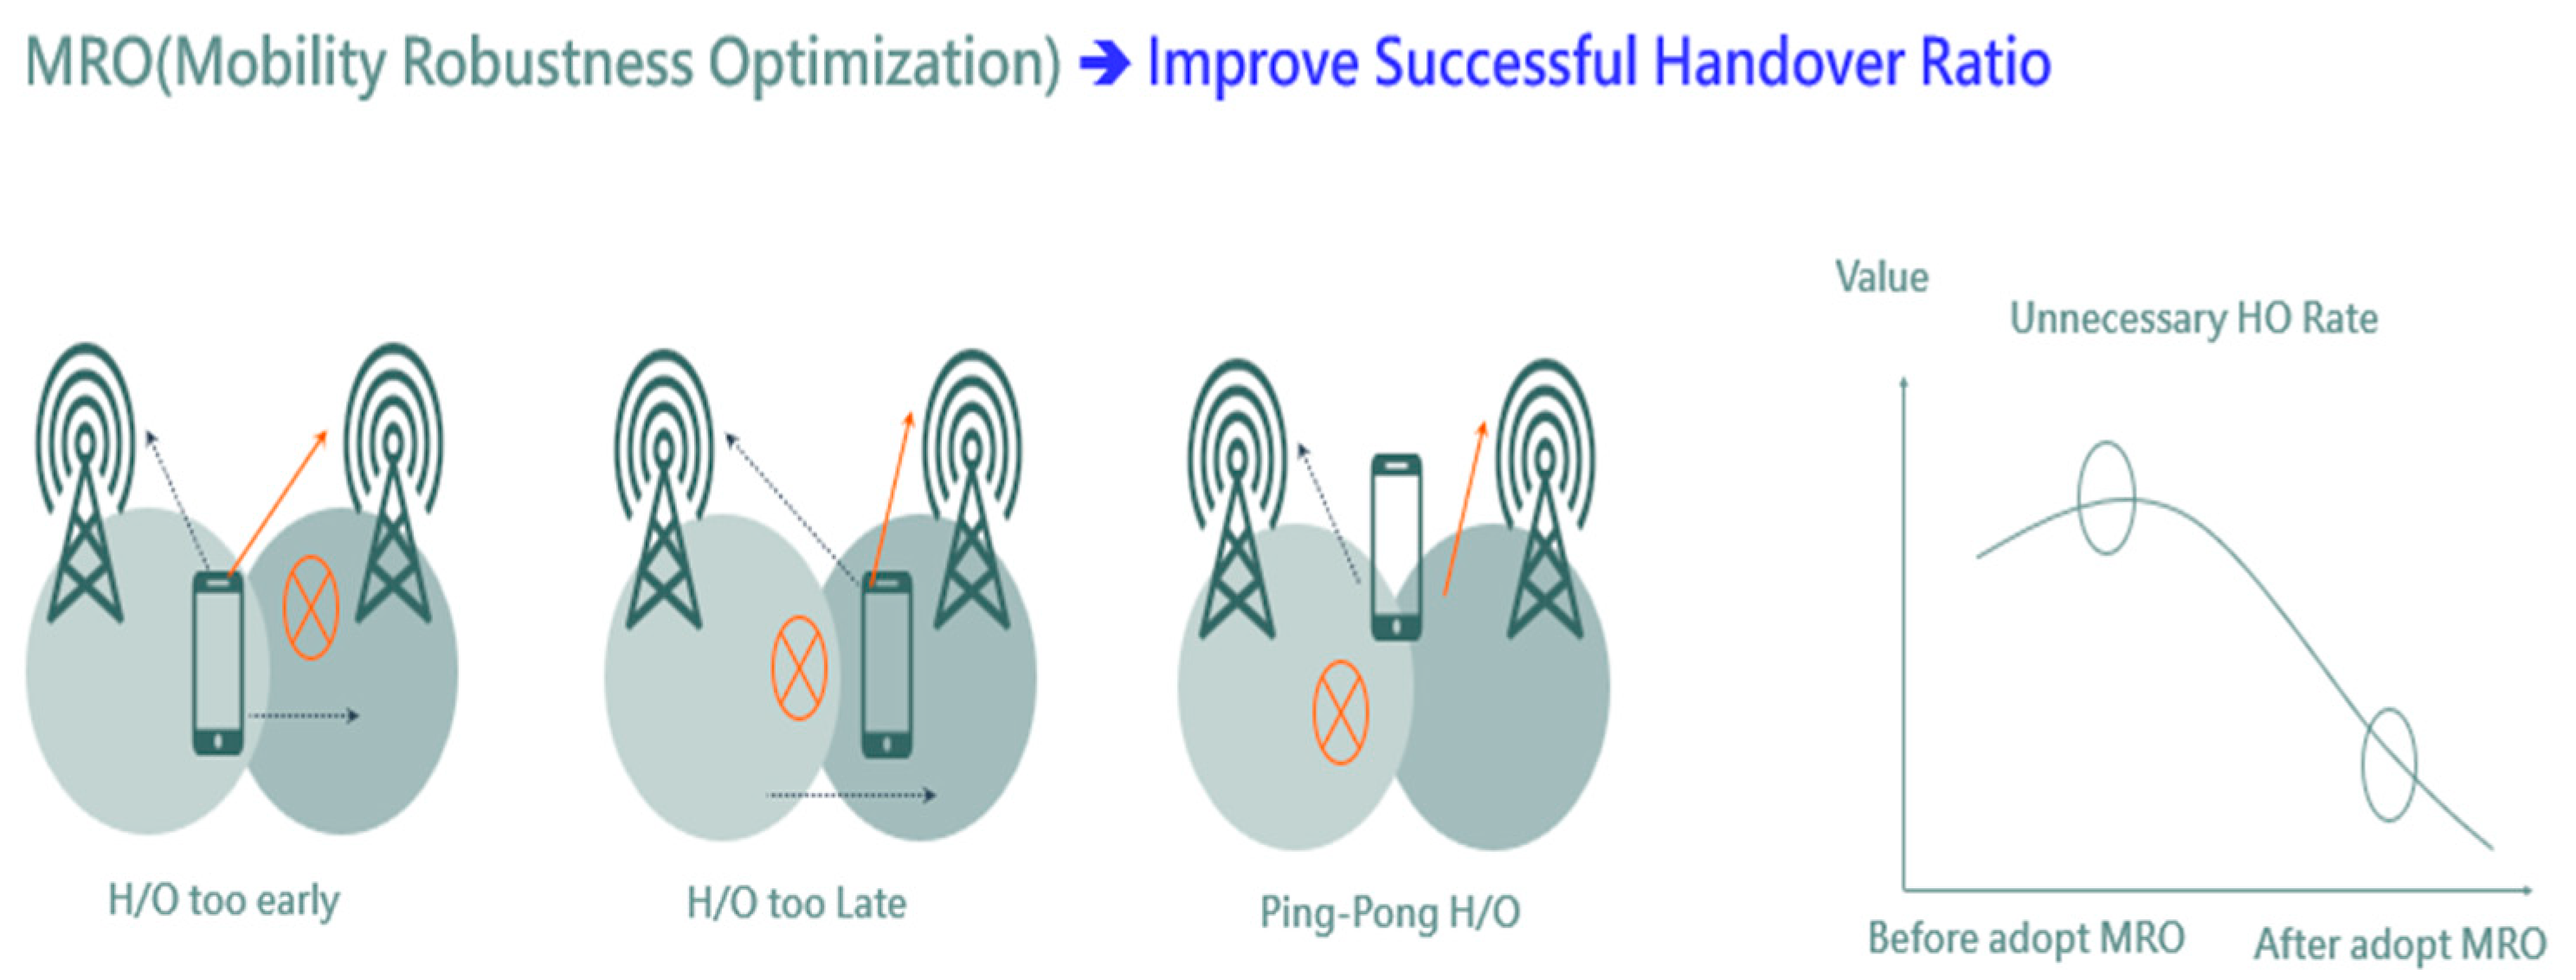
  • Handover parameters are optimized by identifying three handover scenarios: too early, too late, and ping-pong.
  • Parameters are adjusted according to handover statistics.
  • Evaluation of adjustment and punishment is supported.
Benefits analysis is described below:
  • MRO automatically resolves handover failures and optimizes mobility in a radio network.
  • Customer experience is improved by reducing drop call rate and handover failure rate.
  • Operators are assisted to optimize mobility by saving resources.
Second, mobility load balancing (MLB) can improve overall cell throughput, as shown in Figure 18.
Third, coverage and capacity optimization (CCO) improves system coverage and throughput to solve coverage holes, weak coverage, and overshooting problems [25], as shown in Figure 19.
While the remote electrical tilt optimization can provide larger gains in terms of cell-edge and cell-center performance, power optimization can improve coverage, throughput performance, and power efficiency to some extent. The radio frequency parameters that should be considered in order to improve the coverage and capacity performance optimization include the following:
  • Cell-edge performance, cell-center performance, intra- and inter-cell interference, and mobility load balancing distribution factors.
  • Antenna tilt, enhanced tilt, and total power.
Real Case 2: Station R4 to R4A, signal co-construction point of interconnection (POI) and MU × 1, RU × 2 in the south/north tunnel.
Figure 20 shows the co-construction machine room, intersection exit, and system network plan for the calculation of the link budget [26,27] of the device to device architecture.

4.1.5. R4/4A Stations Power Spectrum Density

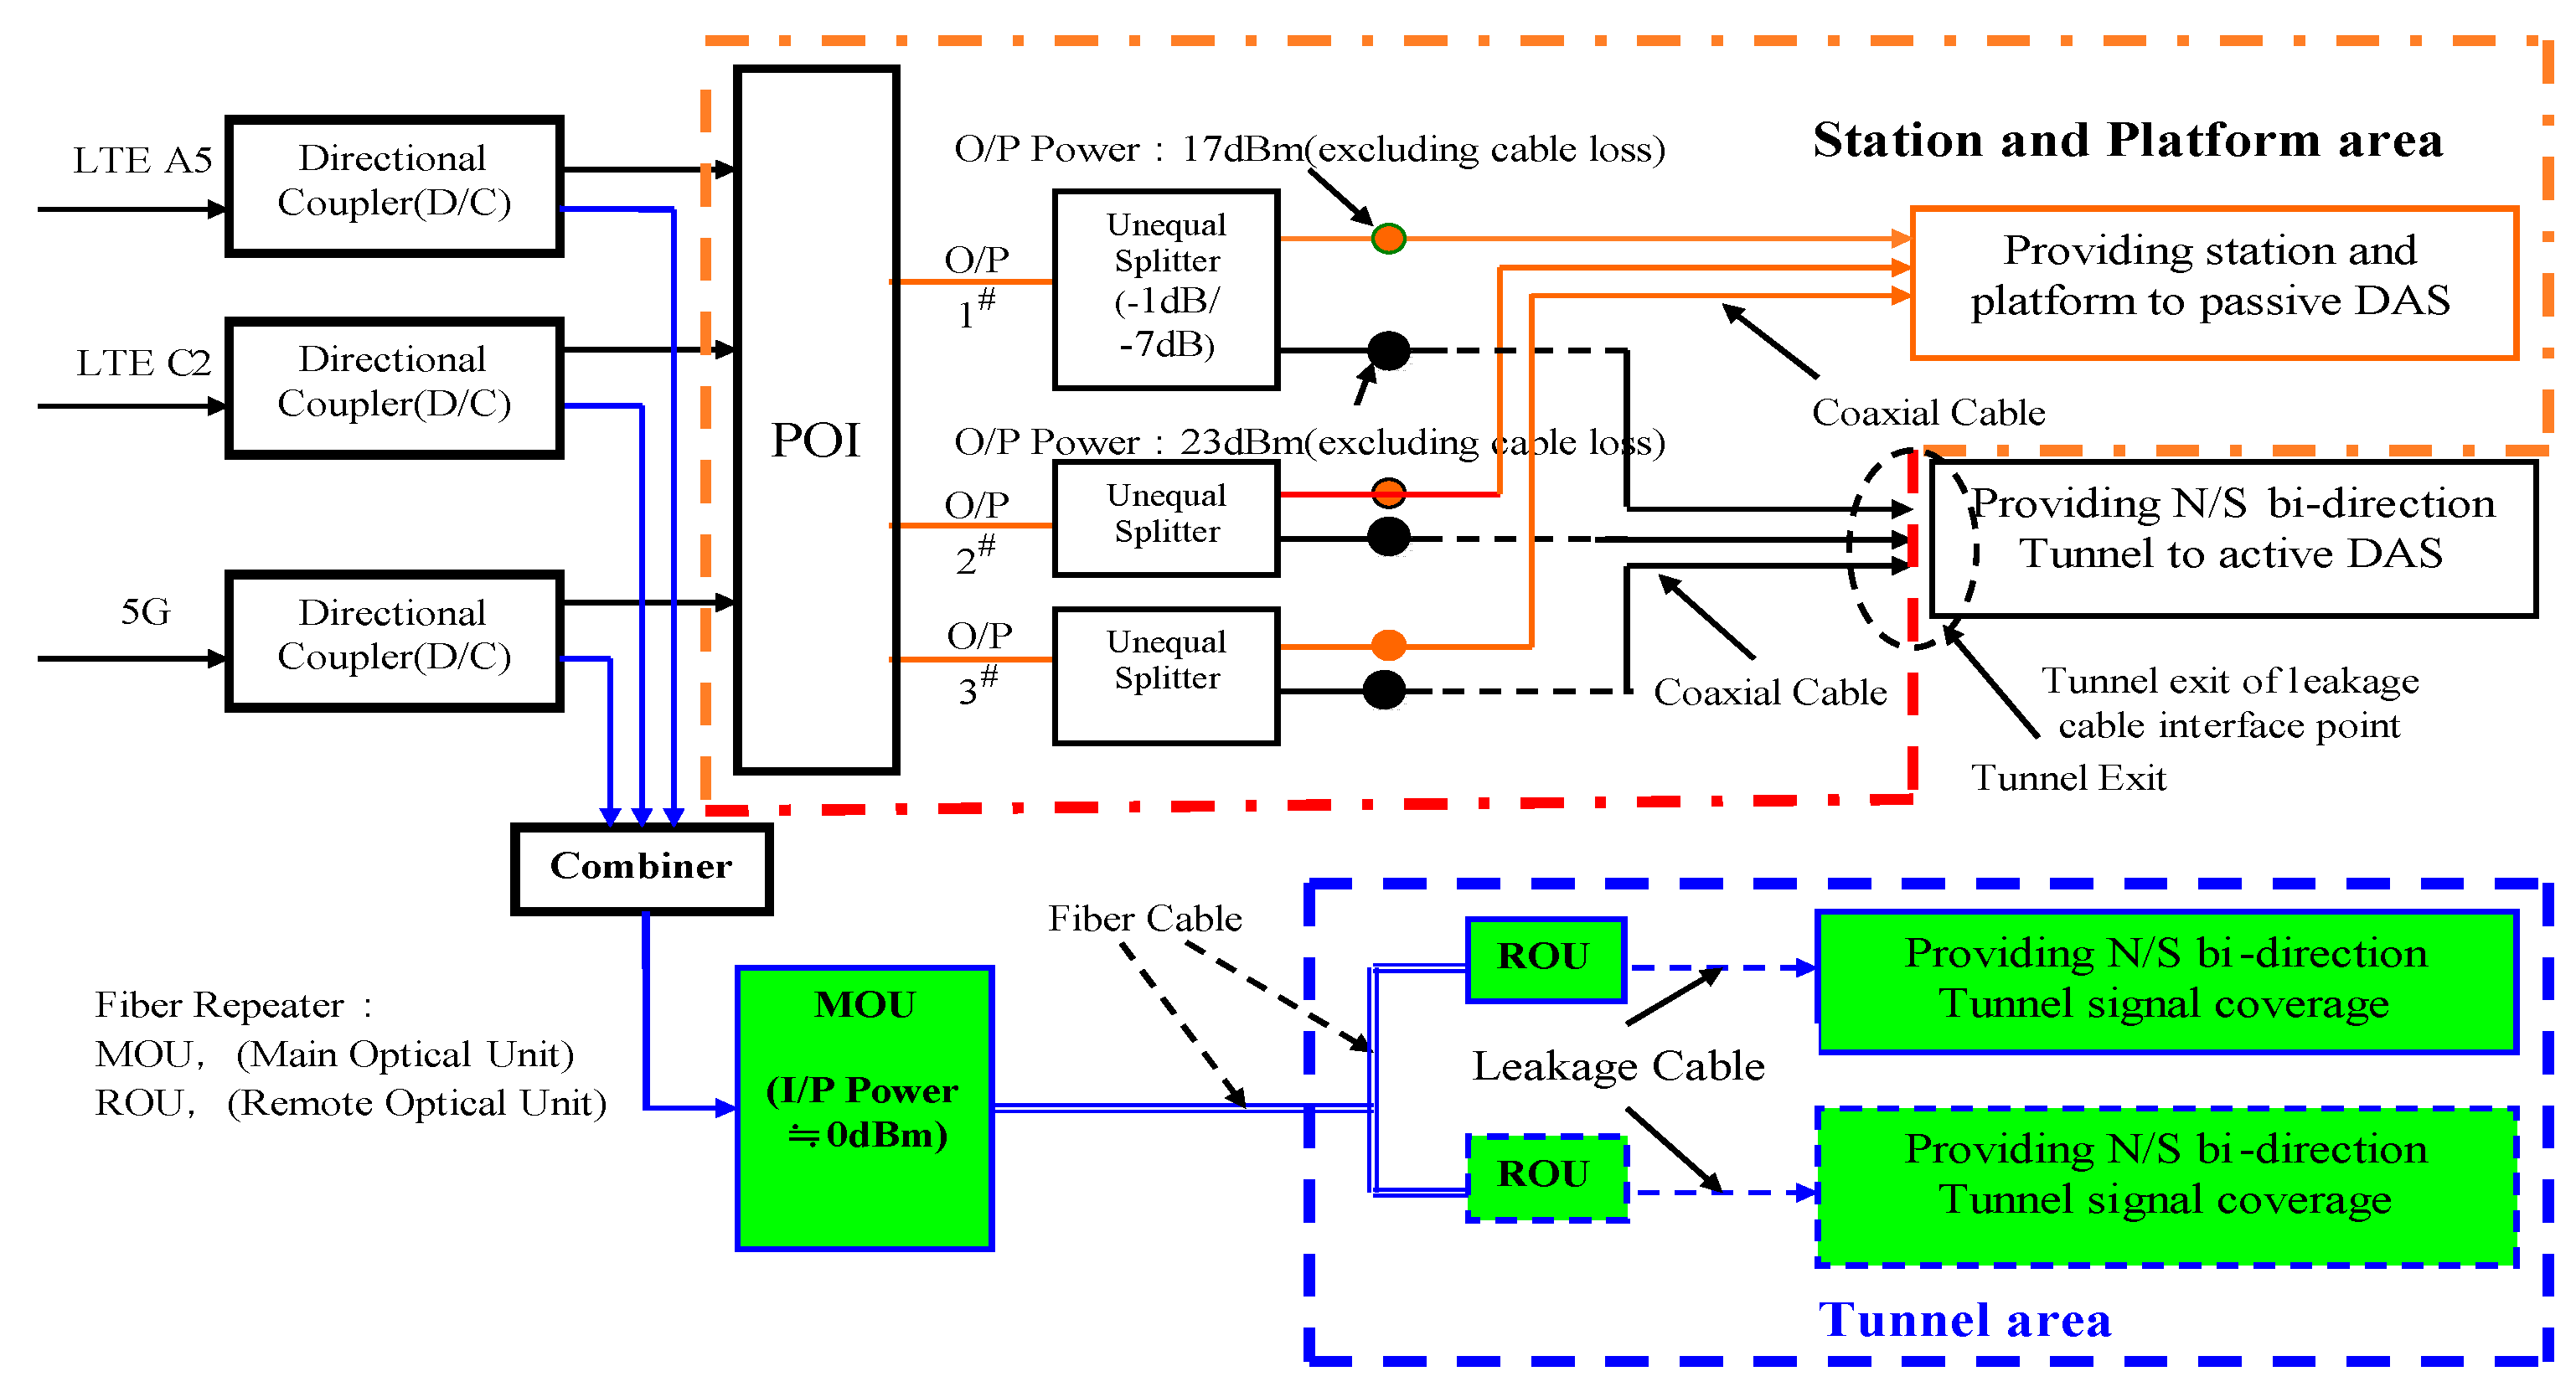
  • R4 Station body: At 195 m, R4 station eNB provides signals covering the tunnel from R4 to R4A. The machine control room to subway tunnel exit are 183 m, 1-7/8″, coaxial cable loss is 7 dB, and the subway tunnel length is 1800 m.
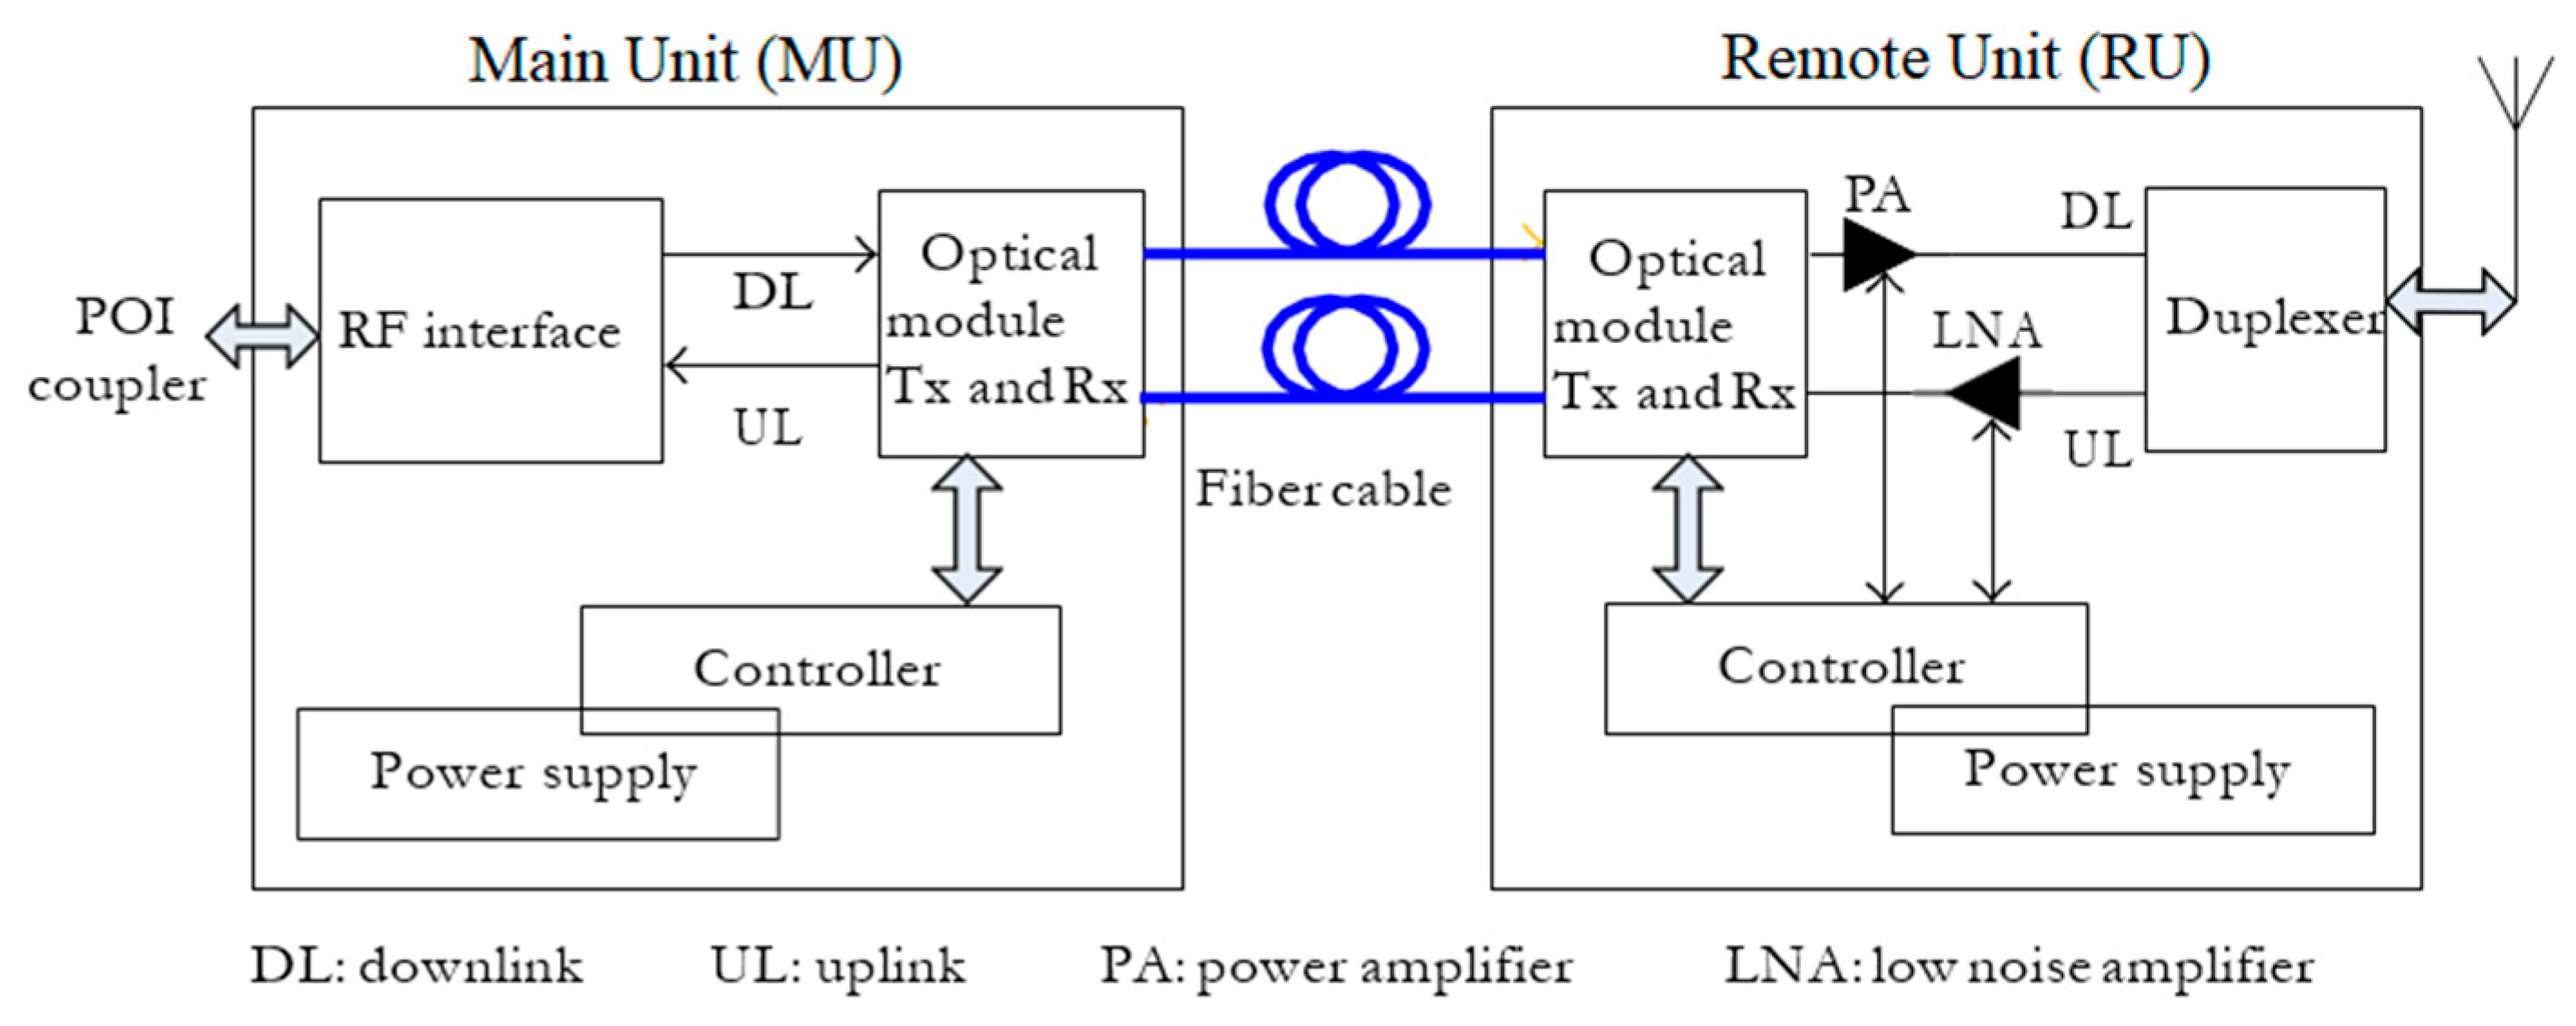
  • Intersection: Fiber optical repeaters are installed for two RUs (one each in the south and north tunnels). The POI output terminal connects to the MU, while the MU output terminals connect the fiber cable to the intersection RU input terminal.
  • A 1-7/8″ leakage coaxial cable is placed on the upper edge of the wall surface of the third track in the R4 to R4A south/north tunnel, and the leakage coaxial cable is connected to the output port of the RU.

4.1.6. R4/4A in Subway Tunnel for Traffic Data Signal Coverage Canalization

  • R4 subway tunnel entrance to tunnel, R4A subway tunnel entrance to tunnel, and Point Of Interconnection + 1-7/8″ leakage coaxial cable:
Equations for the practical analysis of the radio frequency signal coverage area from the Point Of Interconnection through a 1-7/8″ coaxial cable to the N/S tunnel intersection exit connected via 1-7/8″ leakage coaxial cable can be written as Equation (18):
P o R U = P t e N B L P O I L C C
Here, Po(RU) is the output power of RU to the leakage coaxial cable, Pt(eNB) is the output power of eNB, LPOI = the insertion loss of POI, LCC = the coaxial cable loss (~183 m), and Po(RU) = 33 − 9 − 7 = 17 (dBm). Subsequently, we generate Equation (19):
L T O T = P o R U S S r e q
Here, LTOT is the total of maximum allowed loss and SSreq is the signal strength requirement (−85 dB), LTOT (−85dB) =16 − (−85 dB) = 101 dB, which can be written as Equation (20):
L L L = L T O T L F L S L C L W
Here, LLL is longitudinal loss, LF is feeder loss (5 dB), LS is splitter loss (3.5 dB), LC is coupling loss (66 dB), LW is window loss (12 dB), giving LLL = 101 − 5 − 3.5 − 62 − 12 = 22 dB.
  • Interconnection exit to R4 tunnel and interconnection exit to R4A tunnel:
A practical analysis of the signal coverage area of the intersection exit RU connected to 1-7/8″ leakage coaxial cable is as follows, according to Equation (20):
First, intersection exit to R4 inside of tunnel:
Po(RU) = 27 dBm, splitter × 2 (1:4).
1-7/8″ leakage coaxial cable is 480 m.
LTOT (−85 dB) = 27 − (−85 dB) = 112 dB
LLL = 112 − 4 − 7 − 66 − 12 = 23 dB.
Second, intersection exit to R4A inside of tunnel:
1-7/8″ leakage coaxial cable is 600 m.
LLL = 112 − 4 − 1 − 66 − 12 = 29 dB

4.2. Measurement of Practice

4.2.1. System Structure and Cell Coverage Plan

The system network structure requires a subway tunnel environment factor and traffic data signal objective coverage plan, as shown in Figure 21.

4.2.2. Measurement Tools

Taking the R3 station as an example, the measurement method involves walking on foot, taking the red line train from the north line tunnel from the R3 station through four stations (R4–R7) to arrive at the R8 station. The train is attached to a high-load six-car carriage. Both side walls of the tunnel are fitted with leakage coaxial cables (Andrew Company). The cables are placed 3 m off the tunnel floor and fixed every 20 cm.
The measurements were made using Ericsson’s test mobile system (ETMS) [28]. This consists of an IBM portable computer, an ASUS/SONY cellular phone, and the ETMS investigation data collection software version 14.1.
When utilized in conjunction with ETMS, LTE/5G cellular communication performance can be measured in self-organizing networks [29]. ETMS mobile ensures accuracy, as specified in the 3GPP TS [30,31]. According to these specifications, it can measure within ±5 dB from −105 dBm to −40 dBm with absolute accuracy under normal conditions. The dynamic range for the measurement of received traffic data signal level is −110 to −35 dBm. In the dedicated mode, ETMS can measure a maximum received signal level of −13 dBm.

4.2.3. Results of Measurement

The measurements of acceptance entail the evaluation of a cell’s coverage, which is approximated by means of the common pilot channel (CPICH) and the reference signal receiving power (RSRP) for the primary common pilot channel. The standard deviation of RSRP, as caused by free-space attenuation and slow and fast fading, conveys the evenness of RSRP throughout the network. Large variations in RSRP necessitate greater margins for slow fading. The quality of the coverage is indicated by CPICH-Ec/No, which denotes the received energy per chip on CPICH divided by the power density in the band.
The CPICH-Ec/No is defined as the ratio between reference signal received quality (RSRQ) and the received signal strength indicator (RSSI) of the measured quality indicators for an SCE network system.
  • Station and platform
The CPICH-RSRP metric is employed to assess the signal strength of the SCE system. Nevertheless, it ought to be observed that a high recorded value of RSRP may not necessarily indicate the presence of a strong signal but instead may result from high levels of co-channel interference. The signal strength can be exceptionally high if the interference component is in phase with the carrier. In the absence of significant interference, RSRP values of between −75 dBm to −100 dBm are considered acceptable for achieving a satisfactory signal quality. Meanwhile, the CPICH-Ec/No is utilized to evaluate the transmission bit error rate of the cellular system. Table 8 demonstrates the relationship between CPICH-RSRP and CPICH-Ec/No for the R4A station.
Figure 22 shows RSRP on the second-level platform of the R4A station. The platform is covered by an antenna, which is placed downward in the center of the platform ceiling. Mobile units of RSRP and Ec/No are measured by walking around the platform on which the Multi-RAT-Layer is located in order to optimize the mobility and data efficiency [32,33].
CPICH-Ec/No is used to evaluate the transmission bit error rate of the SCE system. Table 9 shows the R3 to R4A N Tunnel relation between CPICH-RSRP and CPICH-Ec/No.
  • Tunnel
The tester’s seat was near the wall of the train, near a door located away from the leakage coaxial cable. Figure 23 depicts the tester’s seat and thus shows the N tunnel measurement position.
Figure 24 shows the RSRP on the second-level N Tunnel of the R3 to R4A station. The N Tunnel is covered by leakage coaxial cables, wherein a radiated-mode leakage coaxial cable (Andrew Company) was installed 25 cm from the southern wall of the tunnel and 3.5 m above the floor of the tunnel [34].
The conditions in the tunnel were as follows [35,36]:
  • When cross-connection followed standard regulation, then CCO improved system coverage, while the throughput performance function was excellent, as shown in Figure 25 and Figure 26.
  • Train tracking was carried out twice in both directions for the MLB and MRO function of each system.
  • Smooth signal handoff in the tunnel was observed, with there being no decline in call rate in the case of signal intensity.

5. Conclusions

This paper covered the design principles of a fiber repeater in detail and included the following:
The calculation of gain to solve implementation issues relating to the calculation of power balance between uplink and downlink for multiple distribution points (MDP) and remote radio heads (RRH).
In this paper, we also established the requirements and procedures for the acceptance testing of indoor coverage and measurement and demonstrated that Multi-RAT, Multi-Layer, mobility load balancing, mobility robustness optimization, and coverage and capacity optimization system operation scenarios can solve issues with self-organizing networks.
Additionally, we found that successful tunnel engineering enables indoor coverage via coordinated multi-point operation architecture in the small cell enhancement system, helping network planning engineers and system maintenance operation engineers to properly perform core network and radio frequency planning analysis and maintenance.
Following on from the abovementioned points, the evolution towards coordinated multi-point architecture can solve indoor open-area transmission problems, leading to the successful application of self-organizing networks to enhance coverage in small cell enhancement systems.
The next step is to enhance the intelligent low-power node’s adaptive optimization. For this, we propose a self-organization strategy based on a reinforcement learning algorithm. Our proposal has the potential to yield significant improvements in throughput and coverage while offering the additional benefits of flexibility and low complexity in the context of heterogeneous self-organizing networks.

Author Contributions

Conceptualization, C.-L.W., T.-T.L. and J.-S.S.; methodology, C.-L.W., T.-T.L. and C.-T.L.; Software, C.-L.W. and W.-T.S.; validation, H.-P.L., C.-L.W., T.-T.L. and C.-T.L.; formal analysis, H.-P.L., W.-T.S. and Y.-S.H.; writing—original draft preparation, C.-L.W., T.-T.L. and J.-S.S.; writing—review and editing, Y.-S.H., H.-P.L. and W.-T.S., All authors have read and agreed to the published version of the manuscript.

Funding

This research received no external funding.

Data Availability Statement

Data sharing does not apply to this article as no datasets were generated or analyzed during the current study.

Acknowledgments

We would like to thank David Yang for his assistance with this paper, and acknowledge the contribution of our colleagues at Ericsson, in particular Mike Chang and Taiwan Mobile Leon Hu. We would also like to thank our research teams. Writing this paper would not have been possible without their generosity and support throughout the process.

Conflicts of Interest

The authors declare no conflict of interest. The funders had no role in the design of the study; in the collection, analyses, or interpretation of data; in the writing of the manuscript; or in the decision to publish the results.

References

  1. JOINT NGMN/WBA RAN CONVERGENCE PAPER 2019. pp. 10–16. Available online: https://ngmn.org/wp-content/uploads/Publications/2019/190903-RAN-Convergence-Paper (accessed on 1 April 2023).
  2. 3rd Generation Partnership Project (3GPP). TR 36.742. Study on Self-Organizing Networks (SON) for Enhanced Coordinated Multi-Point (eCoMP) (Rel-15), Version 15.0.0. 2017. Available online: https://portal.3gpp.org/desktopmodules/Specifications/SpecificationDetails.aspx?specificationId=3084 (accessed on 1 April 2023).
  3. 3rd Generation Partnership Project (3GPP). TR36.746 Study on Further Enhancements to LTE Device to Device (D2D), UE to Network Relays for IoT (Internet of Things) and Wearables, V2.0.1. October 2017. Available online: http://www.3gpp.org/ftp//Specs/archive/36_series/36.746/36746-201.zip (accessed on 27 December 2017).
  4. 3rd Generation Partnership Project (3GPP). TR36.897 Study on Further Enhancements to LTE Device to Device (D2D), UE to Network Relays for Internet of Things (IoT) and Wearables, V.d.0.0. July 2015. Available online: https://www.3gpp.org/ftp/Specs/archive/36_series/36.897/36897-d00.zip (accessed on 3 July 2015).
  5. 3rd Generation Partnership Project (3GPP). TR36.897 Evolved Universal Terrestrial Radio Access (E-UTRA); LTE Advanced inter-band Carrier Aggregation (CA) Rel-15 for 5 Down Link (DL)/1 Up Link (UL) and Wearables, V.f.0.0. July 2018. Available online: https://www.3gpp.org/ftp/Specs/archive/36_series/36.715-05-01/36715-05-05-f00.zip (accessed on 12 July 2018).
  6. Koshy, B.J.; Shankar, P.M. Spread-Spectrum Techniques for Fiber-Fed Micro-cellular Networks. IEEE Trans. Veh. Technol. 1999, 48, 847–857. [Google Scholar] [CrossRef]
  7. Prasad, M.V.S.N.; Singh, R. Terrestrial mobile communications train measurements in Western India. IEEE Trans. Veh. Technol. 2003, 52, 671–682. [Google Scholar] [CrossRef]
  8. Briso-Rodríguez, C.; Cruz, J.M.; Alonso, J.I. Measurements and Modeling of Distributed Antenna Systems in Railway Tunnels. IEEE Trans. Veh. Technol. 2007, 56, 2870–2879. [Google Scholar] [CrossRef]
  9. Zhang, Y.P. Practical performance of digital cellular system in mass rapid transit environments. Int. J. Commun. Syst. 2004, 18, 143–157. [Google Scholar] [CrossRef]
  10. Raweshidy, H.A.; Komaki, S. Radio over Fiber Technologies for Mobile Communications Networks; Artech House: Norwood, MA, USA, 2002; pp. 183–214. [Google Scholar]
  11. Hwang, S.T.; Kim, B.G.; Lee, S.K.; Lee, J.H.; Kim, H.L.; Lee, Y.G.; Kim, G.W. ROF technologies for in-building wireless systems. IEICE Trans. Electron. 2012, 90, 345–350. [Google Scholar] [CrossRef]
  12. Alcatel-Lucent Company. From Macro to Small Cells: Enhancements for Small Cells in 3GPP TSG RAN WG1; Small Cells Summit: London, UK, 2013; Available online: https://dokumen.tips/download/link/enhancements-for-small-cells-in-3gpp-release-12.html (accessed on 1 April 2023).
  13. 3rd Generation Partnership Project (3GPP). TR36.819 Coordinated Multi-Point Operation for LTE Physical Layer Aspects; (CA) Rel-11, V.b.2.0. Sep. 2013. Available online: https://www.3gpp.org/ftp/Specs/archive/36_series/36.819/36819-b20.zip (accessed on 18 September 2013).
  14. Andrew Company. ION-M85/18/21 System Overview; Worldwide Headquarters: 3 Westbrook Corporate Center Suite 900/1800/2100/2300; Andrew Company: Westchester, IL, USA, 2016. [Google Scholar]
  15. 3rd Generation Partnership Project (3GPP). TS 25.143 Radio Access Network UTRA Repeater Conformance Testing (Rel-6), Version 6.4.0. Available online: https://www.3gpp.org/ftp/Specs/archive/25_series/25.143/b20.zip (accessed on 4 April 2022).
  16. Rappaport, T.S. Wireless Communication Principles and Practice; Prentice Hall: Hoboken, NJ, USA, 1996; Volume 2, pp. 300–320. [Google Scholar]
  17. Goodman, J.W. Introduction to Fourier Optics, 3rd ed.; Roberts & Company Publishers: Greenwood Village, CO, USA, 2004; p. 37. [Google Scholar]
  18. Su, S.F. The UMTS Air-Interface in RF Engineering: Design and Operation of UMTS Networks; McGraw Hill Professional: New York, NY, USA, 2007; pp. 317–319. [Google Scholar]
  19. Ericsson Telecommunication, S.P.A. Cell Planning Guideline for Tunnel Coverage; TEI/CC/P-99:0062 Rev A; Telefonaktiebolaget LM Ericsson: Stockholm, Sweden, 2023; pp. 18–22. [Google Scholar]
  20. 3rd Generation Partnership Project (3GPP). TR 25.942 Radio Access Networks Radio Frequency (RF) System Scenarios; (Rel-1999), Version h.0.0. Available online: https://www.3gpp.org/ftp/Specs/archive/25_series/25.942/h00.zip (accessed on 4 April 2022).
  21. Didascalou, D.; Maüer, J.; Wiesbeck, W. Subway tunnel guided electromagnetic wave propagation at mobile communications frequencies. IEEE Trans. Antennas Propag. 2001, 49, 1590–1596. [Google Scholar] [CrossRef]
  22. Lienard, M.; Degauque, P. Propagation in wide tunnels at 2 GHz: A statistical analysis. IEEE Trans. Veh. Technol. 1998, 47, 1322–1328. [Google Scholar] [CrossRef]
  23. Andrew Company. ION-M85/18/21 Design Principle; Worldwide Headquarters: 3 Westbrook Corporate Center Suite 900/1800/2100/2300; Andrew Company: Westchester, IL, USA, 2017. [Google Scholar]
  24. Persson, K.A.; Alping, A.; Wake, D. WCDMA radio-over-fiber transmission experiment using electro-absorption transceiver. Electron. Lett. 2005, 41, 512–514. [Google Scholar] [CrossRef]
  25. Mariage, P.; Lienard, M.; Degauque, P. Theoretical and experimental approach of the propagation of high frequency waves in road tunnels. IEEE Trans. Antennas Propag. 1994, 42, 75–81. [Google Scholar] [CrossRef]
  26. Holloway, C.L.; Hill, D.A.; Dalke, R.A.; Hufford, G.A. Radio wave propagation characteristics in lossy circular waveguides such as tunnels, mine shafts and boreholes. IEEE Trans. Antennas Propag. 2000, 48, 1354–1366. [Google Scholar] [CrossRef]
  27. 3GPP RP-122009; Study on LTE Device to Device Proximity. 2012. Available online: https://portal.3gpp.org/desktopmodules/Specifications/SpecificationDetails.aspx?specificationId=2544 (accessed on 1 April 2023).
  28. Cox, C.H. Analog Optical Links Theory and Practice; Cambridge University Press: Cambridge, UK, 2000; pp. 159–200. [Google Scholar]
  29. Ericsson Review. Signal Strength measurement in LTE TEMS Mobiles. 284 23-3026 Uen Rev AB, Taiwan; Telefonaktiebolaget LM Ericsson: Stockholm, Sweden, 2021; pp. 1–45. [Google Scholar]
  30. 3GPP TS 25.106. V6.4.0. Radio Access Network UTRA Repeater Radio Transmission and Reception (Release 15). 2016. Available online: https://portal.3gpp.org/desktopmodules/Specifications/SpecificationDetails.aspx?specificationId=1156 (accessed on 4 April 2022).
  31. 3rd Generation Partnership Project (3GPP). TR36.842 Study on Small Cell Enhancements for E-UTRA and E-UTRAN—Higher Layer Aspects; (Rel-12) Version c.0.0. Available online: https://www.3gpp.org/ftp/Specs/archive/36_series/36.842/36842/c00.zip (accessed on 7 January 2014).
  32. Isotalo, T.; Niemela, J.; Lempiainen, J. Measurements for Distributed Antennas in WCDMA Indoor Network. January 2008, pp. 1–5. Available online: https://trepo.tuni.fi/handle/10024/128736 (accessed on 1 April 2023).
  33. Ericsson Review. Summary of Downlink Performance Evaluation; 3GPP TSG RAN R1-072444; Technical Report; Telefonaktiebolaget LM Ericsson: Stockholm, Sweden, 2021. [Google Scholar]
  34. Furuskar, A.; Almgren, M.; Johansson, K. An infrastructure cost evaluation of single and multi-access networks with heterogeneous traffic density. In Proceedings of the Vehicular Technology Conference, Stockholm, Sweden, 30 May–1 June 2005. [Google Scholar]
  35. Guo, W.; O’Farrell, T. Relay Deployment in Cellular Networks: Planning and Optimization. IEEE J. Sel. Areas Commun. 2012, 31, 1597–1606. [Google Scholar] [CrossRef]
  36. Holland, O.; Friderikos, V.; Aghvami, A.H. Energy efficient cross band spectrum management for mobile operators. In Proceedings of the Global Communications Conference, Miami, FL, USA, 6–10 December 2010; pp. 202–204. [Google Scholar] [CrossRef]
Figure 1. Evolution towards systems of organization.
Electronics 12 02473 g001
Figure 2. CoMP architecture incorporating SoN networks solution into SCE system for IoT applications in a novel usage environment.
Electronics 12 02473 g002
Figure 3. Hierarchy of a Self-organizing Network.
Electronics 12 02473 g003
Figure 4. SCE structure diagram.
Electronics 12 02473 g004
Figure 5. MDP structure diagram.
Electronics 12 02473 g005
Figure 6. RRH structure diagram.
Electronics 12 02473 g006
Figure 7. DAS support by novel cellular-over-fiber optic indoor transition systems.
Electronics 12 02473 g007
Figure 8. The time delay in eNB to FR.
Electronics 12 02473 g008
Figure 9. Time delay from FR to FR.
Electronics 12 02473 g009
Figure 10. TRA-employed system scope overview.
Electronics 12 02473 g010
Figure 11. Building coverage in a TRA for SCE system novel network architecture.
Electronics 12 02473 g011
Figure 12. Improving overall passive and massive data efficiency in a TRA for SCE system novel network architecture.
Electronics 12 02473 g012
Figure 13. LTE solutions employed in a tunnel without disturbing the SCE system’s novel network architecture.
Electronics 12 02473 g013aElectronics 12 02473 g013b
Figure 14. Existing RFS leaky cable for DAS plan.
Electronics 12 02473 g014
Figure 15. Multi-RAT improvement of overall data efficiency.
Electronics 12 02473 g015
Figure 16. SCE system structure to optimize MLB and MRO.
Electronics 12 02473 g016
Figure 17. The MRO function improves the successful handover ratio.
Electronics 12 02473 g017
Figure 18. MLB function improves overall cell throughput.
Electronics 12 02473 g018
Figure 19. CCO improvements to system coverage and throughput.
Electronics 12 02473 g019
Figure 20. SCE system network plan and calculation of link budget for D2D architecture.
Electronics 12 02473 g020
Figure 21. Subway tunnel environment factor and traffic data signal objective coverage plan.
Electronics 12 02473 g021
Figure 22. RSRP on the second-level platform of the R4A station.
Electronics 12 02473 g022
Figure 23. N tunnel measurement position.
Electronics 12 02473 g023
Figure 24. RSRP on the second-level N Tunnel of the R3 to R4A station.
Electronics 12 02473 g024
Figure 25. CoMP architecture in the SCE system can solve issues with SoNs.
Electronics 12 02473 g025
Figure 26. Service requirements for the generation of a novel system to improve the quality of operation among Self-organizing Networks.
Electronics 12 02473 g026
Table 1. Important requirements for the operation of Multi-RAT.
Solve Problem
The Taiwan Railway Administration (TRA) must install simple and stable systems to improve signal intensity within high buildings and at stations, platforms, and underground tunnels to facilitate integration with and the extension of existing architecture, reserve active and passive equipment space necessary for a next-generation novel system, and improve the quality of the communication network.
TechnologiesBusiness Requirement
Multi-Radio Access Technology
Multi-Layer
Multi-Vender
Core NetworkModularization
Interoperability
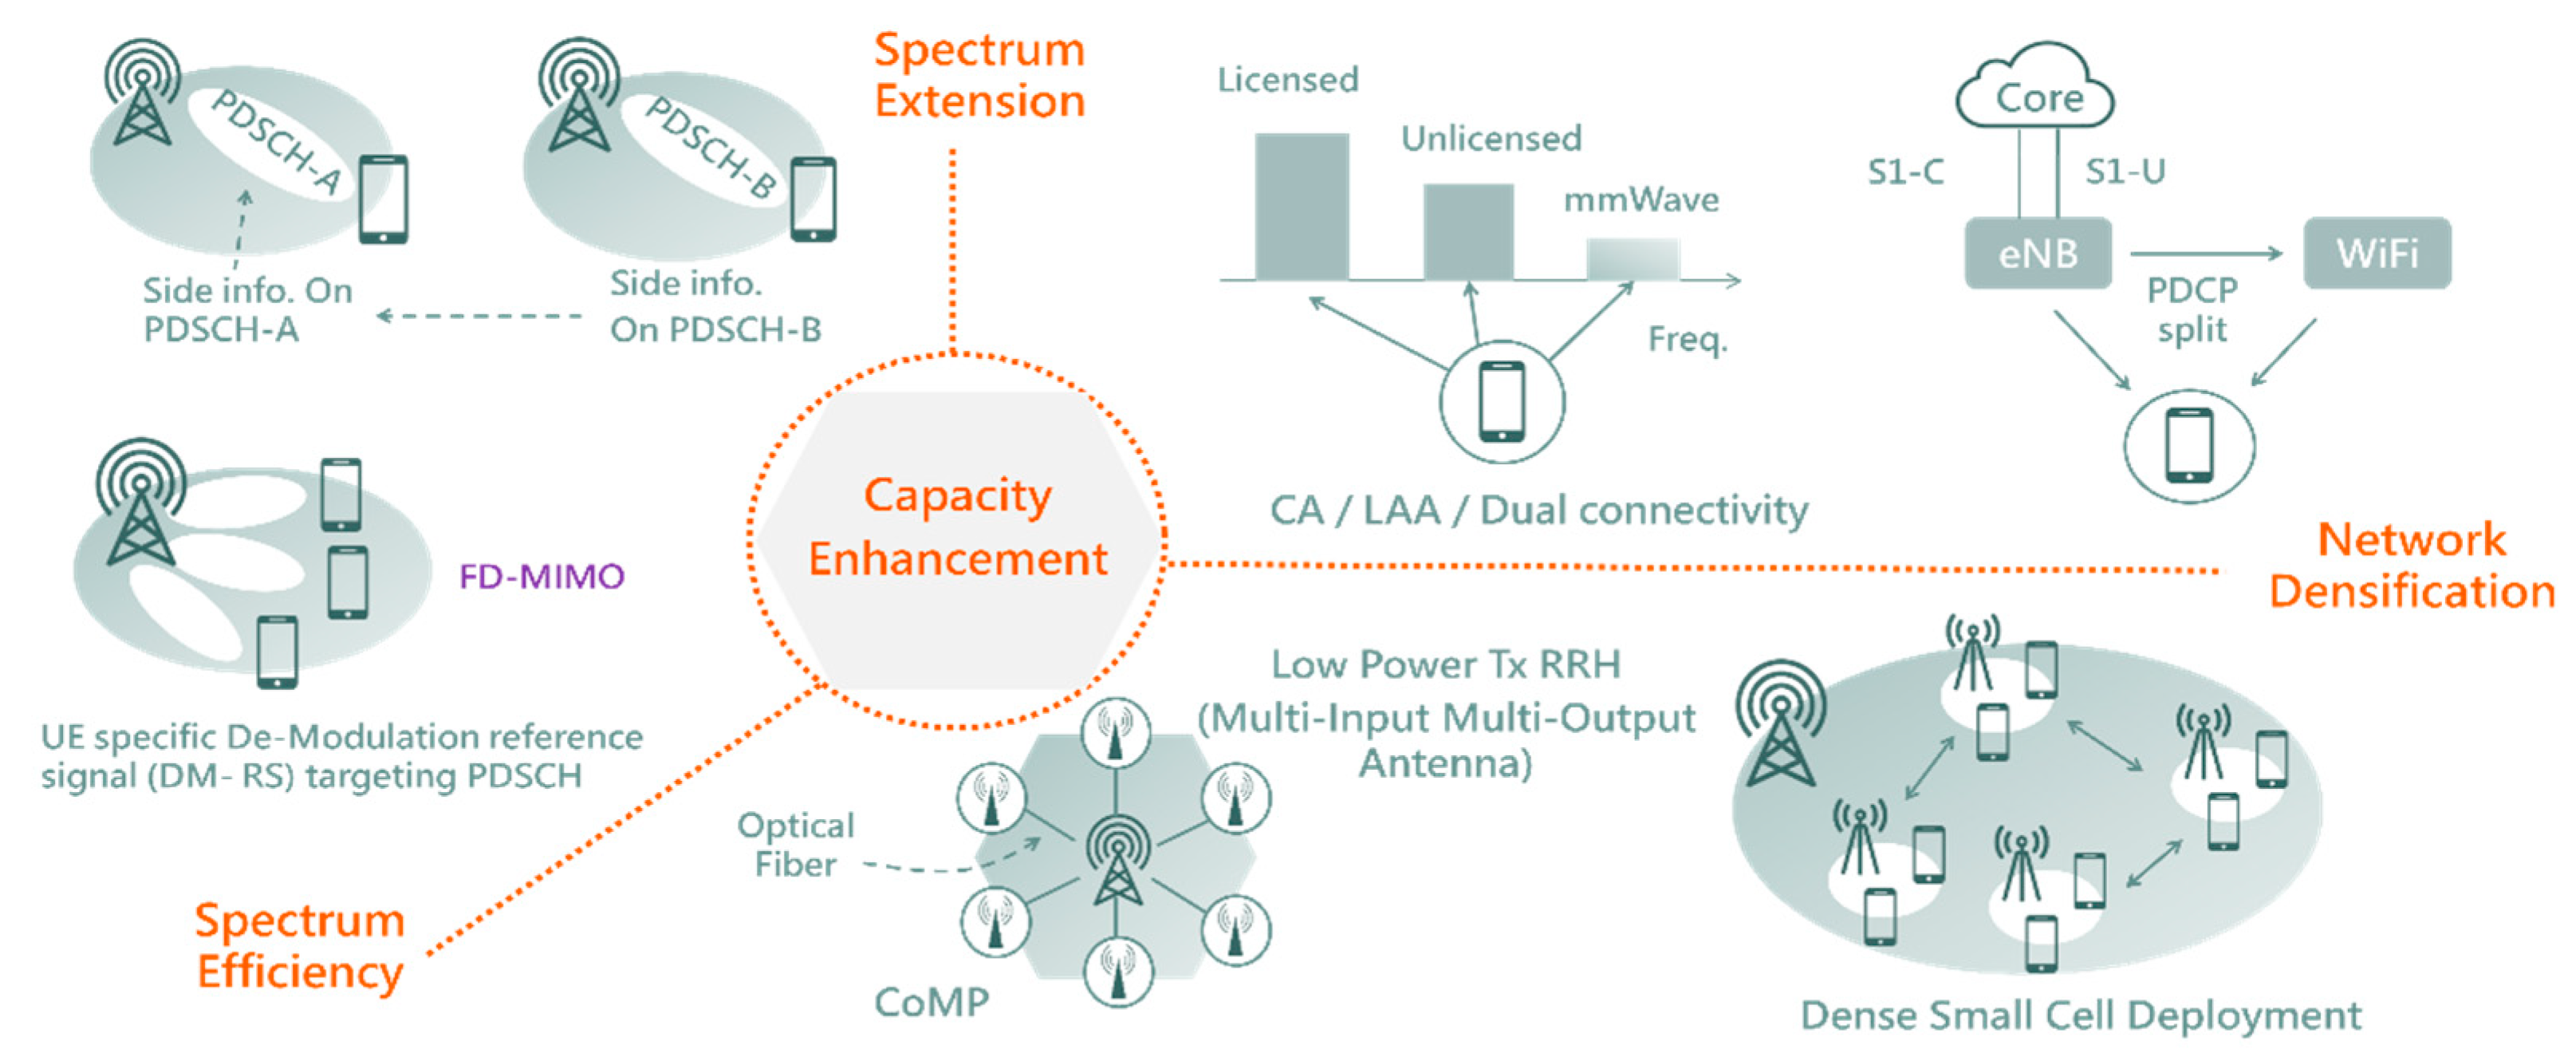
Capacity Enhancement (SCE)
Spectrum Extension
Spectrum Efficiency
Network Densification
Radio Access NetworkLow capital costs
Low implement risk
Fast Roll Out
Coordinated Multi-Point Architecture
Self-organizing Network
Small Cells Environment Systems
Distributed antenna systems (DAS)
Reliability
Performance
Compatibility
Table 2. The eNB noise floor increase by fiber optical repeater.
D2DOutput Power, Po (dBm)Sensitivity, S (dBm)Noise Floor, Nmin (dBm)Signal—Noise Ratio, S/Nmin(dB)Noise Figure, NF (dB)
eNB44−102−120910
cellular phone30−100−121912
Table 3. The eNB noise floor increases due to the fiber optical repeater.
10 log 1 + n 10 N F r e p + N F e N B + L p 10 d B
n Δ N eNB   n N F r e p N F e N B + G r e p L p ( dB ) PeNB: Thermal Noise Power of eNB Receiver (dB)
2−90.98
1−61.77
003
Table 4. Calculation of link budget for the fiber optical repeater.
ULΔNeNB U L   G r e p = L p + N F e N B N F r e p + N e N B
= 39 + 2 − 5 + (−9) (dB)
Uplink Grep (dB)
2Noise Floor, NFeNB
5Noise Floor, NFrep
Path Loss, Lp (dB) = Coupling Loss + Cable Loss + Combiner Loss = 39Path Loss, Lp (dB)
30Coupling Loss
7Combiner Loss
2Cable Loss
ΔNeNB: number of fiber optical repeaters (n)n
−92
−61
00
Table 5. Radiated-mode leakage coaxial cables at NBIoT/LTE-A and 5G.
Leaking Cable TypeDiameter (mm)Longitudinal Loss (dB/100 m)Coupling Loss (dB)
700 MHz2200 MHz700 MHz2200 MHz
1/4″7.523–3232–526971
3/8″9.512–1418–216874
1/2″13.79.5–1113–186873
7/8″24.95.5–68–116972
1−1/4″36.02.86–4.58.15–7.246871
1−7/8″46.52.14.80–4.877171
Table 6. Quality plan for acceptable indoor coverage requirements.
SystemArea ASSreq
dBm
Area BSSreq
dBm
Area CSSreq
dBm
Coverage (%)
LTE-ATunnel, Station, Platform, inbuilding≧−80Electric escalator, Parking area
Shopping mall, Ticket selling area,
Information service, Hall,
≧−85Elevator control room, THSR/METRO machine room, toilet, office, exit of tunnel≧−8595%
5G≧−93≧−92≧−9895%
LTE-A
5G
≧−85Tunnel and LaBa area≧−80
≧−93
97%
90%
Table 7. Summary of received LTE signal for Leaking cable and Yagi Antenna.
LTE Signal Level with Reference Distance from RU for 11/4″ LCX250 m200 m150 m100 m50 m5 m
Single Train on LCX side (Near side) dBm−89.4−85.3−81.2−77.2−73.1−69.4
Single Train on opposite LCX side (Far side) dBm−97.4−93.3−89.2−85.2−81.1−77.4
Double Train on opposite LCX side (Far side) dBm−121.4−117.3−113.2−109.2−105.1−101.4
LTE Signal Level with Reference Distance from Yagi Antenna for 11/4″ LCX5 m50 m100 m150 m200 m250 m
11dB Yagi Antenna @end of 250 m LCX (Near side) dBm−67.2−87.2−93.2−96.8−99.3−101.2
11 dB Yagi Antenna @end of 200 m LCX (Near side) dBm−63.1−83.1−89.1−92.7−95.2−97.1
5 m with EIRP 11.1 dBm = −67.2 dBm. 50 m with EIRP 11.1 dBm = −87.2 dBm. 100 m with EIRP 11.1 dBm = −93.2 dBm. 150 m with EIRP 11.1 dBm = −96.8 dBm. 200 m with EIRP 11.1 dBm = −99.3 dBm. 250 m with EIRP 11.1 dBm = −101.2 dBm.
Table 8. Relationship between CPICH-RSRP and CPICH-Ec/No for the R4A Station.
RSRP Signal LevelNumbersPercentageCumulativeCumulative Percentage
−35 ≤ x0000
−45 ≤ x ≤ −3512713.512713.5
−55 ≤ x < −4515329.928043.4
−65 ≤ x < −5526111.554154.9
−75 ≤ x < −6535333.889495.6
−85 ≤ x < −75332.392799
−95 ≤ x < −8580.8935100
−110 ≤ x < −95009350
Ec/No
Quality Index
NumbersPercentageCumulativeCumulative Percentage
00000
1–311412.111412.1
4–614027.125439.2
7–924814.450253.6
10–1239041.889295.4
13–15333.592598.9
16–18101.1935100
19–21009350
Table 9. Relationship between CPICH-RSRP and CPICH-Ec/No for the R4A Station.
RSRP
Signal Level
NumbersPercentageCumulativeCumulative Percentage
−35 ≤ x0000
−45 ≤ x ≤ −35922.9922.9
−55 ≤ x < −453211041312.9
−65 ≤ x < −5573022.8114335.7
−75 ≤ x < −65173654.2287995.9
−85 ≤ x < −753224320199.9
−95 ≤ x < −8530.13204100
−110 ≤ x < −95003204100
Ec/No
Quality Index
NumbersPercentageCumulativeCumulative Percentage
00000
1–3702.2702.2
4–635913.442918.9
7–960620.7103532.3
10–12206064.3309596.6
13–151053.3320099.9
16–1840.13204100
19–21003204100
Disclaimer/Publisher’s Note: The statements, opinions and data contained in all publications are solely those of the individual author(s) and contributor(s) and not of MDPI and/or the editor(s). MDPI and/or the editor(s) disclaim responsibility for any injury to people or property resulting from any ideas, methods, instructions or products referred to in the content.

