Article

Leading Logistics Firms’ Re-Engineering through the Optimization of the Customer’s Social Media and Website Activity

by
Damianos P. Sakas
,
Dimitrios P. Reklitis
* and
Marina C. Terzi
Business Information and Communication Technologies in Value Chains Laboratory (BICTEVAC LABORATORY), Department of Agribusiness and Supply Chain Management, School of Applied Economics and Social Sciences, Agricultural University of Athens, 11855 Athens, Greece
*
Author to whom correspondence should be addressed.
Electronics 2023, 12(11), 2443; https://doi.org/10.3390/electronics12112443
Submission received: 12 April 2023 / Revised: 26 May 2023 / Accepted: 26 May 2023 / Published: 28 May 2023
(This article belongs to the Special Issue Computational Intelligence in Social Big Data Analytics)

Abstract

:
To acquire competitive differentiation nowadays, logistics businesses must adopt novel strategies. Logistics companies have to consider whether redesigning their marketing plan based on client social media activity and website activity might increase the effectiveness of their digital marketing strategy. Insights from this study will be used to help logistics firms improve the effectiveness of their digital marketing as part of a marketing re-engineering and change management process. An innovative methodology was implemented. Collecting behavioral big data from the logistics companies’ social media and websites was the first step. Next, regression and correlation analyses were conducted, together with the creation of a fuzzy cognitive map simulation in order to produce optimization scenarios. The results revealed that re-engineering marketing strategies and customer behavioral big data can successfully affect important digital marketing performance metrics. Additionally, social media big data can affect change management and re-engineering processes by reducing operational costs and investing more in social media visibility and less in social media interactivity. The following figure presents the graphical presentation of the abstract.

1. Introduction

Digitalization has a disruptive transformation effect across industries, since businesses can leverage the dynamics of digital technologies to change existing business models and processes, adapting swiftly to unique cultures and redesign customer experiences [1]. With the advancement of new technologies, such as the Internet of Things (IoT), the world undergoes a radical technological revolution, allowing effective digital monitoring and control of business processes [2]. The increasingly important role of digital tools and technologies in building supply chain resilience becomes even more apparent as companies are doubling down on investments in advanced technologies [3]. This is further evident by digital transformation statistics, which imply that by 2026, global digital transformation spending is forecast to reach 3.4 trillion USD [4].
As supply chains become more digitized, new risks emerge from the imperative need for adopting advanced technologies, since supply chain resilience greatly depends on digital maturity [5]. According to Zouari et al. [6], the improvement of digital maturity incorporates all business processes, from new data gathering methods to profound change in organizational culture, toward a digital mindset. This change management is driven by the increasing need for logistics companies to transform traditional processes to digital, data-driven approaches [7]. As the industry is moving toward digital paths, companies constantly look for new ways to improve performance, seize opportunities, and improve upon best practices. By investing in new technologies, such as big data and IoT, logistics companies can transform their operations, solve the high cost vs. low efficiency problem, and improve their competitive advantage so as to outpace the competition [8,9]. The implementation of IoT turns big data analytics into value and enables the logistics sector to modify its modus operandi [10]. In order to better cater their services and respond to the new challenges imposed by digitalization and the explosion of Logistics 4.0 [11], logistics companies’ success lies in the efficient implementation of the change management process, which will ensure higher levels of digital maturity and corporate sustainability [12].
Change management is achieved through the understanding of the interrelationship between customers, employees, leadership, knowledge management, business processes, innovative technology, and overall business strategy [13,14,15,16,17,18]. Vasilyeva et al. [19] acknowledge the influence of rapid digitalization on changing business processes, introducing the concept of using the right digital marketing tools in favor of business success. Freihat [16] states that the concept of re-engineering revolves around change management and the idea of rethinking marketing strategies as an effective response to the current complex business environment. To this view, digitalization motivates companies to invest in re-engineering marketing activities in order to seize new business opportunities by leveraging the dynamics of immersive technologies [20]. Therefore, a high-level importance placed on how changes will incrementally happen over time acts as the main driving force for re-engineering communication tools and channels, by utilizing customer dynamics and tracking behaviors across multiple platforms [21].
Establishing a digital marketing ecosystem, completely intertwined with the needs of digitalization within the logistics sector, is of the essence for companies that aspire to improve their online visibility, and thus thrive in such a competitive marketplace. Conventional change management considers only marketing strategies based on customer feedback in the usage stage, which lacks real-time context awareness [22]. The authors further underline that this gap could be eliminated by efficiently merging processes, customer’s feedback, and web analytics, as an effective approach to produce near-instant insights. Moreover, an important study has been carried out by Giakomidou et al. [23] in the energy market, in which the authors state that increased business opportunities would arise by leveraging the dynamics of customer behavioral data, as a novel marketing re-engineering process. The authors further welcome the implementation of future research in different fields in order to discover new potentials. Motivated by the vast research on web analytics [24,25,26] that could fill the gap in real-time context awareness [22], this paper investigates the impact of social media and website behavioral analytics on re-engineering the marketing activities of logistics companies.
The paper’s structure is organized as following: Section 1 includes a literature review and the hypotheses; Section 2 analyzes the methodology; and Section 3 demonstrates the outcomes of the regression and correlation analysis, and a fuzzy cognitive mapping (FCM) model that was developed for supporting the study’s findings. Lastly, Section 4 presents the discussion of the research’s results and Section 4 elaborates on the research conclusions.

1.1. Impact of Digitalization on Innovations and Customers’ Behavior

Digitalization acts as the main catalyst for innovations, since most companies almost operate entirely digitally, using advanced technologies to create value, evolve, and grow [27]. Furthermore, digital technologies (DT) are linked with the improvement in customer experiences and the development of new business models, making fundamental changes in organizations [28]. Hanelt et al. [18] define DT as “organizational change that is triggered and shaped by the widespread diffusion of digital technologies”. Thus, the displacement and deep transformation of business activities lead to driving technological changes within firms [29].
One major challenge of DT is the evolving change in customers’ online behavior, which pressures companies to balance their online experiences, making drastic organizational changes [30]. While it is argued that DT shapes consumer behavior [31], the opposite is markedly true as well. In essence, online users constantly look for technological innovations in order to satisfy their needs, which have been the impetus behind all technological advances [32]. COVID-19 has further accelerated customers’ digital shift, making them more demanding, enlightened, and empowered to demand for and adopt digital solutions that offer seamless and convenient shopping experiences [33]. Since the application of technology influences the development of digital innovations, able to solve existing problems and provide efficient business processes, the employment of customer-driven innovations is considered a viable channel within the overall company’s strategy.
Companies are under enormous pressure to innovate and introduce new products and services, as product lifecycles shrink [34], a rather challenging process since turning customers’ expectations into tangible products greatly depends on focusing on customers’ input [35]. Hence, companies should strike a balance between DT and customers’ needs in order to provide successful innovations that will enhance their digital maturity levels, and thus drive business performance. However, innovation comes along with both opportunities and challenges [36]. In short, innovations alter and expand the logistics ecosystem and challenges organizations’ process innovation capabilities [37] and investments, which mean taking greater risks. In turn, they offer opportunities for business performance and resilience [38].

1.2. Digitalization and Change Management

The proliferation of DT demands organizational changes in order for companies to achieve resilience and sustainability [39,40]. Sadeghi et al. [41] acknowledge the importance of absorptive capacity in successful change management, as a means to build organizational resilience to disaster immunity. Phillips and Klein [42] state five common change management strategies: communicate about the change, involve stakeholders at all levels of the organization, focus on organizational culture, consider the organization’s mission and vision, and provide encouragement and incentives to change. To this end, the turmoil that usually accompanies change management demands the development of a structured and holistic approach to ensure digital transaction and maturity in the logistics sector, while mitigating disruptions [43].
Changes are inevitable in this increasingly digitalized business environment. Alsamydai et al. [44] state that organizational change is the process in which companies move from their current state to a more efficient state, with the intention to build a competitive advantage. The authors further acknowledge five marketing strategies of change, with “routine strategy of change” to signify customary changes in the organization’s work methods, including marketing methods to attract customers. Reaching out, influencing, and understanding the mindset of customers is the lifeblood for companies to survive, although in a cost-effective, scalable, and measurable way [45]. That said, how can logistics companies understand online customer behavior, identify trends, and evaluate digital marketing performance metrics? What is the contribution of advanced technologies in smoothing organizational changes, in the context of developing novel digital marketing activities?
Digital disruptions may occur in all aspect of logistics companies, including the marketing department. Freihat [16] states that one of the contemporary problems in organizations is the focus on production, neglecting the issue of marketing. As markets and consumer behavior change, companies need to identify those changes and adapt their level of organizational information technology (IT), so as to efficiently develop marketing strategies in favor of business performance [46]. The starting point in innovations is to identify what motivates customers and agilely adapt their needs to an efficient marketing strategy [47]. Cloud-based analytics provide helpful insights on tracking customers’ online behavior [48]. The development of advanced technologies, such as big data, establish the way for enriched insights into online customer behavior, in a way that allows marketers to directly measure the effectiveness of digital marketing campaigns [28]. In other words, it becomes a necessity to unite and integrate digitalization in marketing processes with the overall objective of change management.

1.3. Re-Engineering Marketing during Radical Business Transformation

Technological innovations have shifted companies’ focus from the selling process to the buying process [49]. Therefore, there is a strategic refocus on understanding the crucial impact that customers’ online buying journey has, through all of its channels and touch-points, on gathering and turning business insights into long-term improvement strategies [50]. Strengthening the end-to-end customer journey is a dynamic business strategic approach for online visibility, meaningful customer engagement, and heightened customer experience [51]. As digitalization is rapidly evolving, growing digital footprints are constantly being created [52], altering the marketing ecosystem toward the utilization of real-time insights, enabling business digital transformation [53].
Taraniuk et al. [54] underscore the importance of organizations’ marketing activity throughout a period of transformational changes, based on marketing trends and innovations, as an adaptation factor that ensures their sustainability during the re-engineering of business processes. Business process re-engineering (BPR) refers to the redesign of business processes, which impacts the overall business rethinking, and plays a major role in business performance improvement in terms of quality, service, cost, and global competition [55]. Similarly, Melnyk et al. [56] suggest that re-engineering business processes in marketing activity should be perceived as an innovation, able to efficiently respond in radical business transformation. Re-engineering marketing is a necessity for logistics that strikes to balance the optimization of business process with novel digital marketing activities [21,57]. In this line, logistics companies need to focus on the digital customer journey, across all channels, to explore, discover, and test the optimal marketing strategies that best co-align with the organizational change.
The entire re-engineering marketing process open new vistas of opportunity where digital customer journeys, business processes, and DT collaborate to develop key digital pathways [58]. To this end, companies have to embrace the concept of strategic thinking in business re-engineering processes [59], with the development of digital marketing strategies, relevant with the objectives of companies’ management change strategy. By doing so, the reduction in information asymmetries between companies and online users will be achieved, leading to an improvement in overall business performance [60].
As business processes need to be re-engineered for big data analytics [61], so does marketing re-engineering. Identifying when the buying process is triggered and facilitating users’ experience through optimal marketing activities, which respects organizational changes, is the key factor for business performance in the digital age. Harnessing digital marketing to transform business effectiveness includes big data and web and social media analytics as the starting point to develop new strategies, since they are able to provide useful insights into the evolving customer journey [62,63,64,65,66,67,68,69,70].

1.4. Digitalization in Logistics: The Big Data Concept

The supply chain market undergoes a radical digital transformation in all aspects of its business due to the rapid and massive technological advancements that continue to proportionally grow in this dynamic business environment [71]. However, digitalization in the logistics industry happens at a slower pace [72,73]. Despite the industry’s conservative mindset, the Transparency Market Research report [74] underscores that the global digital transformation spending in the logistics market is anticipated to reach 94.972,3 million USD by 2026 at a CAGR of 10,7% during the forecast period, a fact that showcases the value of digital acceleration in the industry. The immense growth in e-commerce [75] coupled with the increased number of Internet and social media users [76] and the COVID-19 pandemic [77] has forced the industry to adopt innovative digital solutions and platforms, so as to increase efficiency in logistics service and reach greater customer awareness and business productivity.
Big data in the logistics industry has been extensively researched in academia [78]. The logistic industry’s need for cutting-edge technologies is imprinted in several aspects of business activities, including real-time control, execution, reconfiguration, and process synchronization of logistics assets [79]. For instance, critical issues on error reduction [80], enhanced productivity [81], organizational performance [82], shipment location tracking [83], and time- and cost-efficiency [84] have been the focal point of several studies. Kodym et al. [85] argued that the use of smart technologies, such as big data, could make the supply chain smarter, more efficient, and more transparent in every stage of logistics and manufacturing. Research by Dai et al. (2019) on manufacturing data reveals the contribution of using cutting-edge technologies toward performance improvement, cost reduction, and process optimization [86]. In the same vein, Bag et al. [87] highlight the effect of big data on quick and quality logistics decisions, at strategic, tactical, and operational level, which are sustainable for the firm. Furthermore, Li et al. [88] conclude that big data analytics lead to disaster immunity that allowed firms to survive during COVID-19 and improve supply chain performance.
With this in mind, capitalizing the dynamics of big data and web analytics seems to have a tremendous impact on digital marketing, since specific behavioral metrics greatly affect branding preferences [24,68] while reducing marketing costs [89]. Sakas et al. [24] demonstrate the efficiency of customers’ online behavioral attitude, through specific website and social media metrics, toward the re-engineering of digital marketing activities within the hospitality sector. To this end, the challenge for logistics companies is to monitor and measure the effectiveness of change management, caused by the digitalization of logistics business processes and operations, through the employment of web and social media analytics. Harvesting customer behavioral data, in favor of developing optimal digital marketing activities, constitutes a novel re-engineering approach that impacts the performance and online visibility of logistics companies [90,91,92].
Customers’ website behavior and social media metrics have been researched in many sectors, including energy, transportation, and the centralized payment network [24,68]. Recently, customers’ website behavior metrics were examined within the supply chain for the optimization of their digital marketing activities [93]. Therefore, the current research aims at investigating the effectiveness of a consistent set of web and social media behavioral KPIs in order to enhance digital marketing efficiency and business maturity. This paper further develops agent-based modeling to run iconic simulations, since big data and dynamic simulation modeling (DSM) are synergistic, having a bidirectional power flow in quality and value assessment [94]. Dynamic simulation provides fruitful insights for businesses, as it decomposes business processes and trends to make reliable forecasting and facilitate the decision-making process [10].

1.5. Social/Web Analytics and Hypotheses Formulation

Social analytics and web analytics are key elements in a successful digital marketing strategy [95,96]. Social media generates a large quantity of quantifiable valuable data for researchers and managers who want to track and assess users’ behavior and engagement, brand awareness, and other key performance indicators (KPIs) to make these data more successful [96,97]. To do this, certain marketing objectives must be explicitly specified. Due to the lack of a precise plan, including the selection of accurate KPIs, marketers struggle to convert social media big analytics into usable information for businesses [97,98]. Companies must specifically develop the correct questions and seek for responses from social media web analytics in order to convert the unstructured data into an efficient social media marketing strategy. As a result, social media analysis entails gathering, assessing, and eventually interpreting data. Web analytics follow the same logic with data extracted from the user’s activity on corporate websites [24]. The combination of both social media and web analytics can provide a solid marketing strategy [67]. Table 1 presents the analysis of the social media and web analytics KPIs as extracted from corporate websites and social media. The tools that are used are explained in the methodology section.
The extraction of these KPIs from corporate websites leads to the formulation of the following research hypotheses. Specific website and social media metrics were employed for the formulation of the research hypotheses. In order to fulfill the purpose of the current study, the authors use organic traffic, social traffic, paid traffic, bounce rate, average visit duration, and pages per visit. The social media behavioral metrics include follower growth and total reactions, comments, and shares. The app ratings and the advertisements cost include organic traffic cost and paid traffic cost.
The results of this study can provide tangible outcomes on the re-engineering marketing process of logistics web pages, social media, and apps in order to measure and optimize interactivity, digital marketing costs, and digital brand name.
Hypothesis 1 (H1). 
The “Social Media Traffic” metric is affected by the “Logistics App Rating” metric, the “Total Reactions, Comments, Shares” metric, and the “Follower Growth” metric.
The rationale behind this hypothesis is to evaluate if the total number of social media users that are redirected to the logistics website is affected by social media behavioral metrics and the app rating. According to previous research in libraries, these social media behavioral metrics positively affect social media traffic [97]. However, since in the logistics industry customers have strongly different characteristics, the connection between these metrics and logistics social media traffic remains unknown.
Hypothesis 2 (H2). 
The “Bounce Rate” metric is affected by the “Pages per Visits” metric, and the “Follower Growth” metric.
The second hypothesis attempts to investigate if the percentage of customers that exit the website without taking further action is affected by the total time spent on the website and the follower growth in social media. The rationale behind this hypothesis is to investigate if logistics social media and logistics websites work synergistically or separately. Previous research in the hospitality sector revealed that the synergetic function between the corporate website and social media can build a huge competitive advantage [103].
Hypothesis 3 (H3). 
The “Paid Traffic” is affected by the “Social Media Traffic” metric, the “Organic Traffic” metric, and the “Follower Growth” metric.
The rationale of the third hypothesis is to investigate if the users that entered the logistics websites through a paid source are affected by the social media users, social media growth rate, and organic traffic. Previous research revealed that the two main factors that affect a website’s brand name are the global ranking in correlation to the organic traffic [24,99,100].
Hypothesis 4 (H4). 
The “Global Ranking” is affected by the “Social Media Traffic” metric, the “Total Visitor’s” metric, the “Logistics App Rating” metric, and the “average visit duration” metric.
The fourth hypothesis attempts to examine the effects that logistics app rating and website behavioral metrics have on the website’s digital brand name and digital marketing re-engineering activities. This research hypothesis will reveal if, in the era of “4.0 industry” logistics, companies need to invest more in website optimization or in app optimization. According to previous research in the luxury clothing industry both parameters (website and app) need to be optimized [104].
Hypothesis 5 (H5). 
The “Paid Traffic cost” is affected by the “Social Media Traffic” metric, the “Organic Traffic cost” metric, and the “Social media engagement” metric.
The final hypothesis is designed to reveal the optimal digital marketing re-engineering strategies. Since one of the main elements of change management in digital marketing is cost reduction [24,105,106], this hypothesis examines if the traffic cost is affected by social media visibility and interactivity. Figure 1 illustrates the graphical representation of the research hypotheses.

2. Materials and Methods

In this study, the authors utilize a combined methodology to measure the impact of digital marketing re-engineering on logistics firms’ digital brand name and social media. This combined methodology is proposed because the raw and unstructured big data are not influenced by any potential cognitive bias [67]. The authors extracted monitoring data from each company on a daily basis for 365 days. Ten world-leading 3pl logistics companies were selected based on their brand name and revenue [107,108]. In this stage, it needs to be mentioned that the study is limited to global companies with Facebook, Instagram, and Twitter profiles, together with a dedicated app in Google Play.
In the first phase of the study, social media and web analytics were extracted. The web analytics KPIs extracted through the “SEMrush” tool [99] from the corporate websites were organic traffic, social media traffic, paid traffic, bounce rate, average visit duration, pages per visit, total visitors, organic traffic cost, and paid traffic cost. The social media KPIs were extracted through the “Fanpagekarma” tool [100] from corporate social media, namely follower growth, total reactions, comments and shares per post, and the total social media engagement. Finally, with the assistance of a web scrapping tool, the authors extracted last year’s logistics rating app from Google Play. In the second phase of the study, a statistical analysis was performed, including correlation and regression. Finally, a fuzzy cognitive map was created to examine the interconnected effects of the analyzed metrics. Following this, four digital marketing optimization scenarios were created. The first scenario presents social media engagement optimization, the second demonstrates the app rating optimization scenario, whereas the third and fourth scenarios demonstrate digital brand-name optimization and cost allocation optimization, respectively. This combined methodology was adopted since it can provide tangible outcomes for optimal marketing re-engineering strategies that could be used by managers, marketers, and developers [24,93,109,110,111].

2.1. Statistical Analysis

As described in Section 2, in this section the statistical analysis is presented, which includes the Pearson’s correlations and regression analysis. Table 2 and Table 3 illustrate the correlations and regression analysis for H1.
More specifically, a positive significant correlation can be identified between “social media traffic” and “logistics app rating” metrics with ρ = 0.300 . This result indicates that a well-designed app provides added value to the social media traffic. Negative significant correlations are also visible between “social media traffic”, “total reactions, comments, and shares” and “follower growth” metrics with ρ = 0.325 and ρ = 0.301 , respectively. The interesting outcome of these correlations relies on the fact that social media interactivity has a negative impact on the website’s social media traffic for the logistics websites. Additionally, nonsignificant correlations can be found between the logistics “app rating” and the “social media analytics” metrics. The regression analysis is significant with values less than 0.05. In this model, for every 1% increase in the “social media traffic” metric, an increase of 27.4% can be observed in the “logistics app rating” metric, whereas a decrease of 18.2% can be observed in the “total reactions, comments, and shares” and 13.4% in the “follower growth” metrics. However, since R 2 = 0.177 any generalization must be made carefully.
Table 4 and Table 5 present the correlations and regression analysis for H2. Negative correlations can be identified between the “bounce rate” and “pages per visits” and “follower growth” metrics with ρ = 0.886 and ρ = 0.321 . This outcome indicates that when the follower growth in social media increases, fewer people will exit the corporate website. It is clear that logistics companies need to invest more in their social media. Additionally, nonsignificant correlation exists between the “pages per visits” and the “follower growth” metrics. Finally, the regression is significant with R 2 = 0.792 . In this model, for every 1% increase in the “bounce rate” metric, a decrease can be observed in the “pages per visits” (8.9%) and “follower growth” (86.2%) metrics.
Table 6 and Table 7 present the correlations and regression analysis for H3. More specifically, a negative significant correlation can be identified between the “paid traffic” and the “follower growth rate” metrics with ρ = 0.338 . This result indicates that the total paid traffic of the logistics websites has a negative effect on the growth of social media. Additionally, a positive significant correlation can be identified between “paid traffic” with “organic traffic” and “social media traffic” metrics with ρ = 0.786 and ρ = 0.937 , respectively. Finally, the regression analysis is significant with values less than 0.05. In this significant model with R 2 = 0.952 , for every 1% increase in paid traffic, an increase of 167.9% can be observed in social media traffic. Additionally, a decrease of 1.1% in the “follower growth” metric and a 79.4% decrease in “organic traffic” metric is further observed.
Table 8 and Table 9 illustrate the correlations and the regression analysis for H4. More specifically, a negative significant correlation can be identified between the “global ranking” metric and the “total visitors” metric with ρ = 0.569 . Additionally, two more negative significant correlations can be observed between the “global ranking” metric, the “social media traffic” metric, and the “average visit duration” metric with ρ = 0.345 and ρ = 0.521 , respectively. This result highlights the positive effect of the website’s user experience on the corporate brand name, which is beneficial for logistics websites since, while engagement takes higher values, the global ranking receives lower values, and thus it moves higher in the website’s ranking. Furthermore, no significant correlation was observed between global ranking and app rating, which is an interesting outcome. As it can be observed in general, the logistics apps rating has no significant effect on website user experience and vice versa. Finally, positive significant correlations can be identified between the “social media traffic” metric with the “average visit duration” and the “total visitor” metrics with ρ = 0.928 and ρ = 0.931 , respectively. This result indicates a positive effect of the website’s user experience to the corporate social media. The regression analysis is significant with values less than 0.05. In this model, for every 1% increase in digital brand name (global ranking), decreases can be observed to social media traffic, average visit duration, and total visitors, at 133.8%, 343.7%, and 523.2%, respectively. This regression can be described as significant with R 2 = 0.724 .
Table 10 and Table 11 illustrate the correlations and the regression analysis for H5.
More specifically, a positive significant correlation can be observed between the “paid traffic cost” and the “organic traffic cost” metrics with ρ = 0.908 . This result can safely indicate the interconnection of these two parameters. When marketing managers have to re-engineer their digital marketing strategy, they have to take this result into consideration. Additionally, nonsignificant correlations can be observed between “paid traffic cost”, “social media traffic”, and “social media engagement” metrics with ρ = 0.177 and ρ = 0.040 , respectively. The same logic can be observed between “organic traffic cost”, ”social media traffic”, and “social media engagement” metrics with ρ = 0.080 and ρ = 0.024 , respectively. This result highlights that social media interactivity has an imperceptible effect on the re-engineering strategy. The regression analysis is significant with values less than 0.05. In this model, for every 1% increase in the “paid traffic cost” metric, increases can be observed in both “organic traffic cost” and “social media traffic” metrics, at 83.9% and 4.9%, respectively. Moreover, a decrease can be observed in the “social media engagement” metrics at 0.7%. This regression can be described as significant with R 2 = 0.713 .

2.2. Fuzzy Cognitive Map

A fuzzy cognitive map (FCM) was constructed utilizing the abovementioned statistics. An FCM shows the fundamental features within a system and the degree of linkages (−1,1) between the variables [24,110,111]. Because of the very extensive nature of big data, the representation of the cause-and-effect relationships in a system on an FCM is extremely advantageous for the creation of accurate digital marketing [24,109,111]. Figure 2 displays the FCM, where the thicker the line, the greater the relationship. The standardization of the procedure and the inclusion of statistical data into the FCM are critical for model building and analysis. The first phase entails “objective clarification” [111,112], the next is “calibration” [104,105], which is followed by “interpretation” [111,112]. In this article, the first step is to create four scenarios that will have a direct impact on the re-engineering of logistics websites, social media, and applications by assessing the existing paid commercials, social media interaction, and visibility, together with the digital brand name. Specifically, the statistical correlations utilized to highlight the relationships prompted the development of this stage in this research. Lastly, in order to provide a clearer presentation of the results [24,111,112], the hyperbolic tangent was employed. This method, that is, incorporating statistical analysis into the FCM, has been frequently used in earlier research to provide static findings of several metrics to the required variables of research [24,111,112].
Figure 3 illustrates the social media engagement optimization scenario. In this scenario, if the logistics companies need to improve social media engagement by 10%, they need to reduce the website’s activity in several parameters. Firstly, logistics companies need to invest less in Google advertisements by 20%, which will lead to fewer visitors (30%) and less organic traffic (5%). Interestingly, the global ranking will be improved with this process by 8%, which is rather contradicting but can be explained by previous research [24,67]. Finally, the “follower growth” metric will increase (5%), which is highly expected.
Figure 4 illustrates the brand-name optimization scenario. According to research reported from previous studies, the two main parameters of brand name are global ranking and organic traffic [66,71]. In this scenario, if the logistics companies need to improve their digital brand name by 10%, they need to invest more in paid advertisements by 8%, which will lead to an increase in total visitors by 10%. This result is expected and highlighted from previous research [69].
Figure 5 illustrates the logistics applications rating optimization scenario. In order to optimize the “logistics app rating” metric by 10%, logistics companies need to decrease their global ranking by 8%. This seems rather contradicting. According to previous research, this is highly expected because nowadays customers desire a well-designed and user-friendly app with detailed instructions on how to track a parcel [24,113]. In this industry, consumers give their focus on usability, in contrast to the clothing or hospitality industry, which focuses on engaging content and experiencing various emotions [67,114]. Additionally, negative reviews relate to delays on a tracking number search since customers desire an app that can satisfy their needs as fast as possible [114,115].
Finally, Figure 6 illustrates the cost optimization scenario, which is highly linked to the digital marketing re-engineering process [16,19,21,23]. If logistics companies reduce total paid and organic costs by 10%, the global ranking will be increased by 7%, and the follower growth in social media by 3%. This result makes clear that companies need to invest much more in social media visibility rather than social media engagement, which is not affected at all. This result aligns with previous research [16,19,21]. Other behavioral parameters will also increase, such as the “pages per visit” and ”average visit duration” metrics, while others will decrease, such as the “total website visitors” metric, which is expected.

3. Discussion

The purpose of the paper is to highlight the importance of employing re-engineering marketing activities that are based on customers’ website behavior and social media metrics, during periods of radical transformational changes within the logistics sector. The primary aim of this study is to analyze the effects of social media and website behavioral aspects on one hand, while on the other hand it offers marketing optimization scenarios to improve the digital re-engineering process.
  • The first hypothesis (H1) suggests investing more in social media in order to improve visibility. This hypothesis is accepted and supported by previous research; however, generalizations must be made carefully since R2 = 0.177 [24,67].
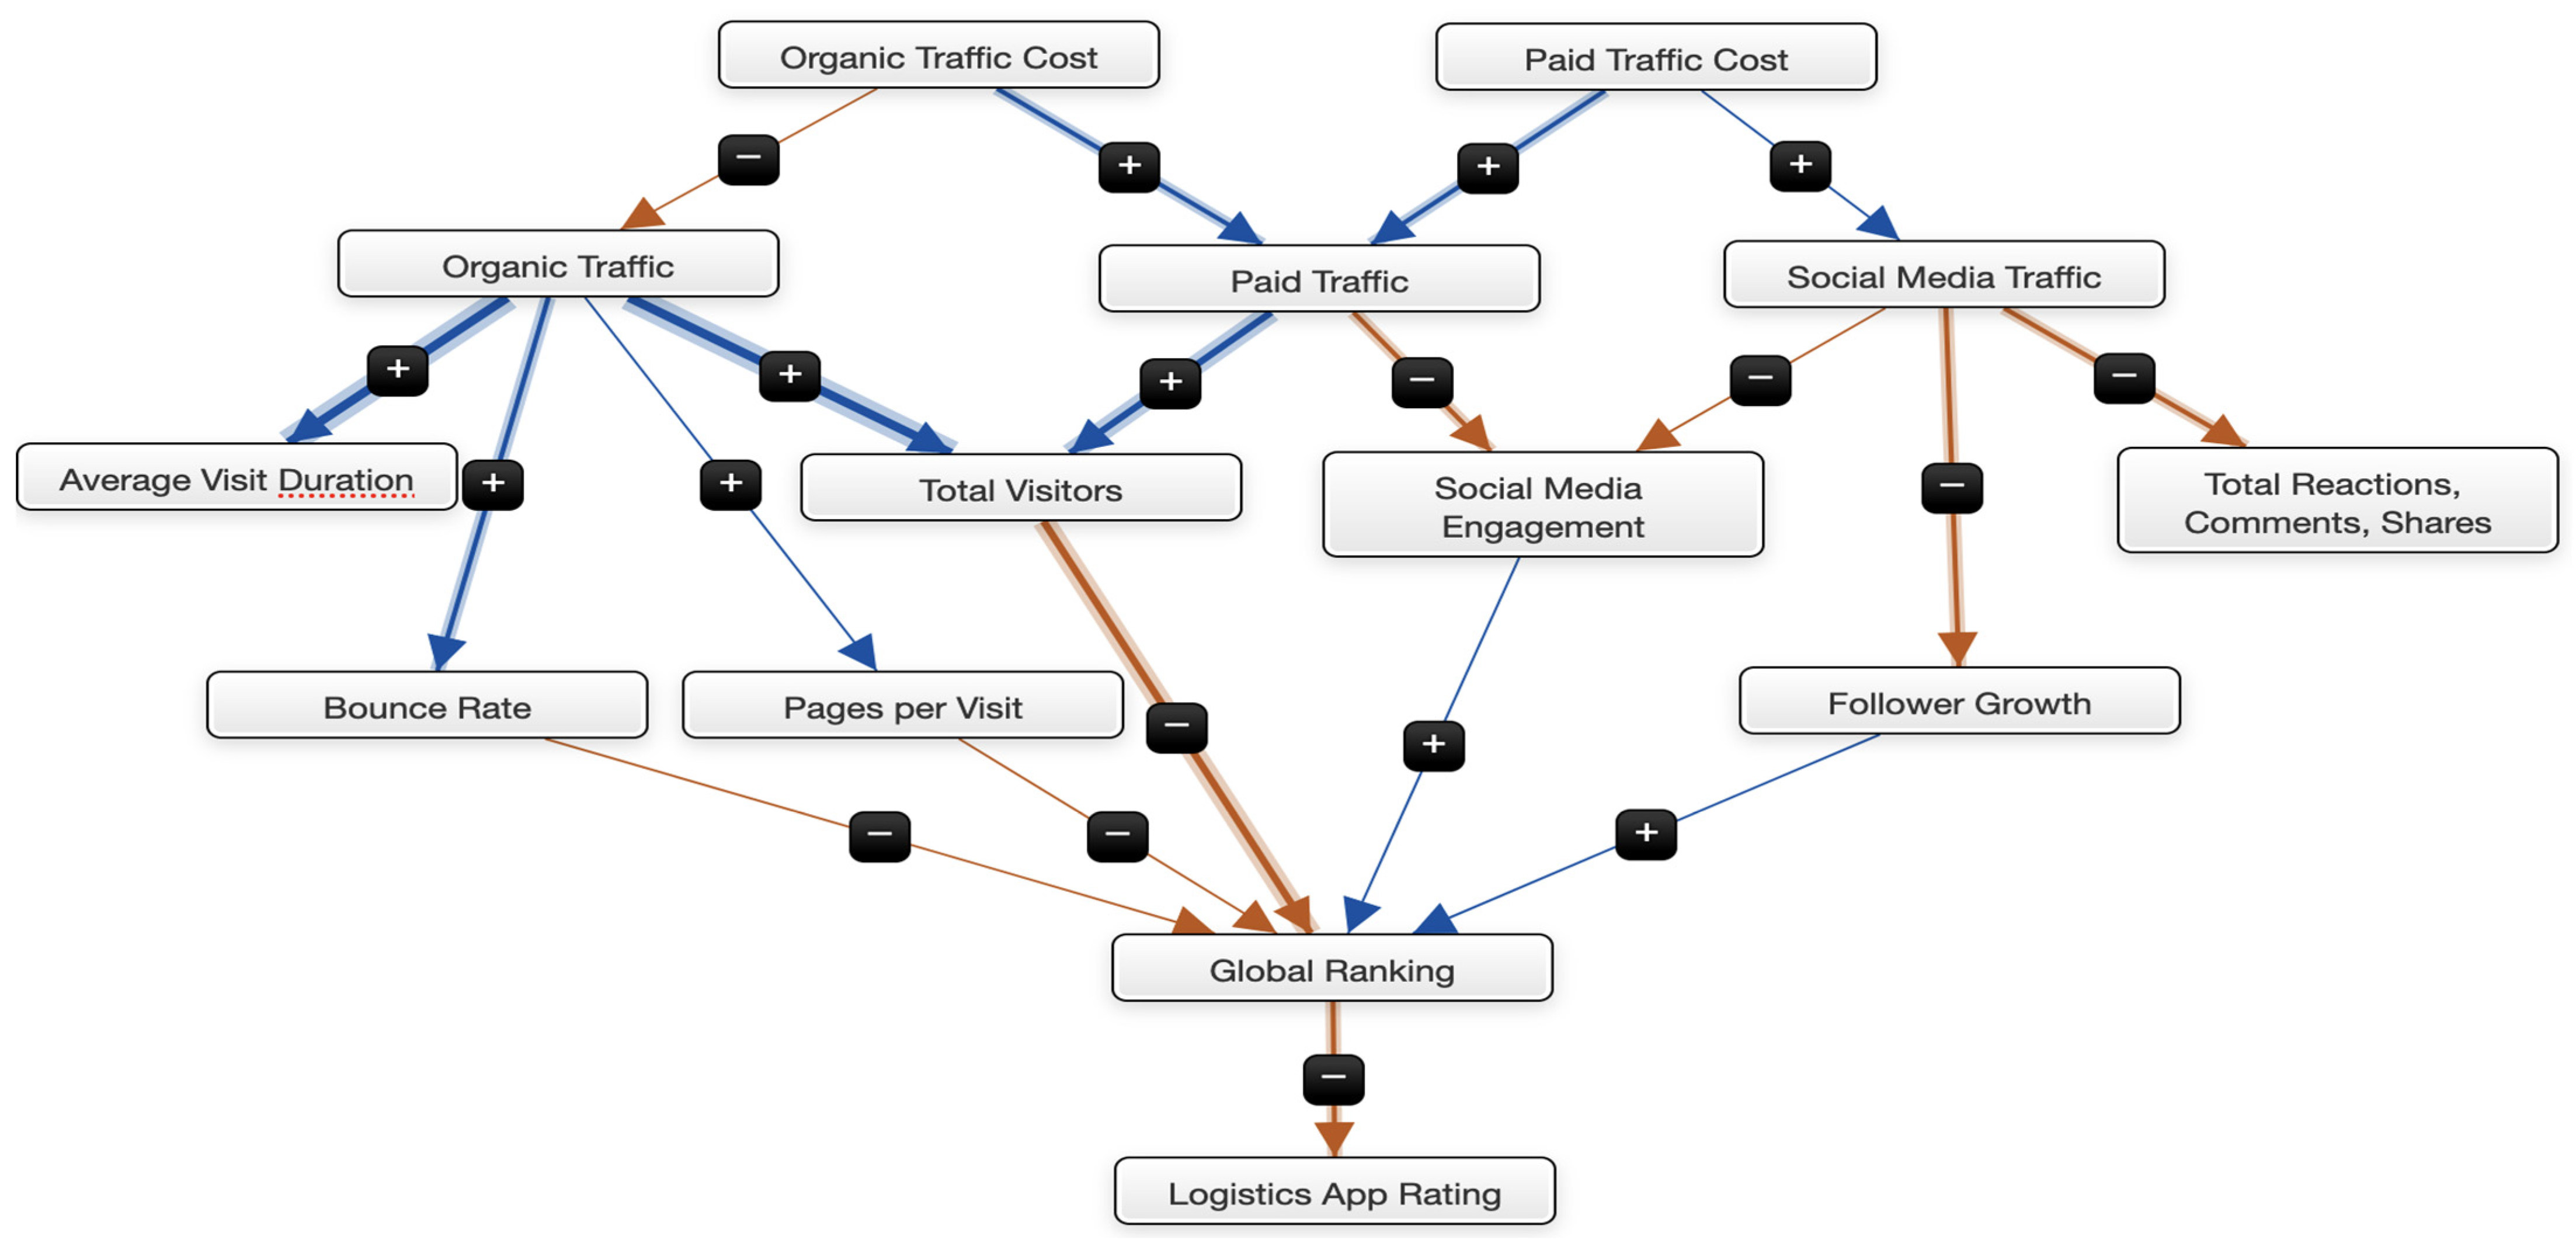
  • H2 is accepted, which highlights that the bounce rate (visitors that exit the websites) has positive effects on social media visibility. This is an interesting result which highlights that users turn their focus more on social media than on logistics websites and further promotes better market segmentation, as indicated by previous research [116,117,118,119]. H3 is also accepted. This hypothesis, which is also supported by the FCM’s findings, suggests that the paid traffic in Google advertisements has negative effects on social media visibility. Therefore, logistics companies need to invest more in social media advertisements as advised from previous research in other industries [21,120].
  • H4 is also accepted and supported by previous research. The results highlight that the digital brand name of corporate websites is highly affected by the website’s user activity [23,67]. However, it has no effect on the logistics app rating. This is an interesting outcome that has never been studied before, and therefore future research is welcomed.
  • H5 is also accepted. This finding illustrates that social media interactivity has an imperceptible effect on the re-engineering strategy. Additionally, due to the high correlation between the paid traffic cost and the organic traffic cost, marketing managers are advised to equally reduce the amount of both social media ads and Google ads in order to produce an effective re-engineering process. This is an outcome that comes in contradiction with other industry digital entities, such as energy retail providers, and therefore logistics companies are highly suggested to use and create buyer personas so as to develop customized advertisements [121,122].
Predictive analytics and simulation modeling manage to continuously monitor customers’ online behavior, across social media platforms and websites, and provides opportunities for real-time market insights with the intention to remove digital marketing inefficiencies and improve customers’ engagement. For example, marketing performance metrics (global ranking and logistics app rating metrics) positively affect traffic-related KPIs (social media traffic) and customer behavior-related KPIs (average visit duration). With this in mind, marketing activities should be re-engineered toward investing in paid advertisements and keyword targeting to increase social media traffic and visibility. Moreover, resources should be allocated in developing consistent, unique, and relevant content to increase customers’ readability. Trigger-based customer journeys, powered by big data, enable companies to identify future trends and focus on delivering outstanding digital experiences [123,124].

4. Conclusions

In logistics, digital transformation is driven by the need for companies to adjust to fast-changing economic environments and growing customer demands, through digital maturity heightening, customer service improvements, and business performance optimization [125]. In order to achieve digital transformation and remain competitive in the current tumultuous business landscape, logistics companies need to invest in change management so as to minimize potential disruptions. Change management greatly impacts the culture and mindset of companies, implying that people, processes, and technology should alter their mindset toward adopting a digital identity [125]. The outcomes clearly demonstrate the value in analyzing and capitalizing website and social media behavioral data in order to achieve company sustainability and resilience, through online visibility, which co-aligns with the research outcomes of Sivarajah et al. (2020) [126].
The authors further provide evidence for the lack of real-time context awareness in engineering change management, as indicated by Zheng et al.’s research (2019) [22]. To wit, Zheng et al. (2019) place great concern on the reasons that impact the successful adaptation to organizational changes, implying that solely relying on customers’ feedback, such as reviews and comments, lead to failure [22]. Understanding customers’ context incorporates not only static and conventional variables, but also dynamic data, such as app rating metrics, total reactions, share metrics, followers, bounce rate, paid traffic, and others. Leveraging this ocean of data improves customer experience and engagement and provides a true picture of the user’s context, and leads to efficient re-engineering marketing strategies and overall digital marketing optimization for logistics companies.

4.1. Theoretical Implications

An important outcome of the current research is the urgent need for logistics companies to create buyer personas in order to meet their audience needs and behaviors. This market segmentation will allow companies to release efficient re-engineering marketing activities, based on social media paid advertisements. By doing so, the market landscape will become clear, attracting fewer visitors, however, high-valued and more likely to be retained through time. As the marketing funnel moves from the awareness to the purchase stage, logistics companies will gain a better understanding of what levels of interest the target audience has in their mind, giving the impetus for efficient content creation across each stage that will improve social media interactivity. Logistics companies need to ensure that their brand remains relevant by targeted the right audience, building stronger connections, while simultaneously saving marketing costs [127,128,129].
The findings of this study provide support to several studies on big data, regarding the marketing process of logistics companies. Recently, a study by Suoniemi et al. (2020) stated valued potentials of big data on marketing capabilities, in favor of the firm’s performance [128]. The authors underline the gap in big data skills that diminish the efficiency of a big data-driven marketing strategy. Sestino et al. (2020) denote big data as predominantly re-engineering factors and highlight the lack of widespread knowledge and adoption [129]. Likewise, Johnson et al. (2019) underscore big data analytics as a brand defender against emerging risks [130]. Under the same scope, Vollrath and Villegas (2022) state that re-evaluating the customer journey could prevent digital marketing analytics myopia [131]. Moreover, the present research comes to terms with Roumeliotis et al. (2022), where important key marketing metrics are investigated, leading to efficient digital marketing strategies through increased conversion rates and website/social visibility [24,132]. That said, customers’ web and social media behavior metrics provide actionable insights on business transformation changes.

4.2. Practical Implications

In particular, this study reveals that the employment of social media web analytics can contribute to effective marketing re-engineering processes by investing more in social media visibility. Since social media visibility refers to the frequency that online users digitally interact with a specific brand [133], logistics companies should allocate more resources on content development, so as to develop marketing activities that better respond to organizational changes [134]. According to Choi et al. (2020), social media web analytics reflect customer-driven information without any censorship [135]. That said, the development of marketing activities based on social media KPIs and marker segmentation is critical for enhancing digital business performance. Often called as the new gold for companies, big data offers tremendous opportunities for the logistics sector [136], allowing companies to plan and forecast efficiently, while simultaneously automate decision-making. In the narrow sense of the phrase, big data simplifies the gathering and analysis of the large, unstructured, and complex available data, in the direction of highlighting relations, relationships, rules, and logic, so as to predict future demand, trends, and user behavior [137]. Owing to the rapid acceleration of technological developments, logistics companies adopt the latest trends in technology so as to improve business processes and cost saving [90]. This is further supported by previous research [81], in which the authors state that Logistics 4.0 leverages digital technologies, such as big data, to provide solutions on current vulnerabilities, drive efficiencies, and improve performance.
The evolution of DT leads to the employment of an effective change management strategy so as to achieve higher levels of digital maturity. Investing in digital maturity is the first step in driving value, allowing logistics companies to quickly respond to shifting trends in technology advancement in order to fulfill customers’ expectations. Potential lack in reaching high levels of digital maturity may lead to unexpected roadblocks that, unless they balance the maturity curve quickly, can disrupt companies’ operations, leading to low levels of business performance. Likewise, investing in accomplishing high digital maturity levels without data-driven insights may result in employing incorrect transformational changes, with the risk that the company may become irrelevant to customers.
Furthermore, customers have gradually shifted toward purchasing online. In fact, online consumers’ expectations for more customized and personalized online services continue to grow at multiple touch-points across the customers’ purchase journey [138]. This new digital landscape has changed the way companies effectively engage with customers. In a market as saturated as logistics, with signs of increasingly competition, companies constantly look for new application areas to open market potential and ensure sustainable growth [139]. Therefore, for logistics companies that embark toward digital resilience, and thus searching for new ways to strengthen their brand, foster their differentiation, and enhance their online visibility, re-engineering marketing through the development of optimization scenarios becomes a necessity.
To summarize, this current research contributes to the marketing re-engineering field of logistics companies under radical change transformation by highlighting the valuable influence of customers’ behavioral data and simulation modeling on change management. DT constitutes the base for innovations within the logistics sector that goes through radical organization changes. Logistics companies should embrace progress in most aspects of their business, including the neuralgic domain of re-engineering marketing, and work in the direction toward developing novel big data and simulation modeling skills.

4.3. Global Implications and Market Forces

Logistics is a driver in sustainable economic growth [140] and plays an important role on countries and firms’ international trade and competitiveness [141]. The logistics industry ensures that the economy of countries moves smoothly, securing the transportation and delivery of goods, without disruption. However, due to the COVID-19 pandemic, the industry faced major challenges, revealing multiple gaps in supply chain performance and resilience [142]. A diverse set of market forces, such as shifting customers’ expectations, technology advancement, new entrants to the industry and new business models, has further widened the gap and put several constrains to the efficient resilience of the sector [142]. Therefore, the logistics sector is currently confronting immense change, due to the advancement of DT, forcing the industry to become smarter, transparent, and efficient. As a response to mitigate current disruptions, governments and companies should harness the potentials of big data analytics, so as to redesign business policies and processes [143]. Understanding and responding to future crises and market trends, through various web analytics techniques, could provide fruitful insights on contemporary organizational issues [144]. Securing the digital resilience of the supply chain requires new approaches and marketing strategies, employing the dynamic of real-time data, so as to control and monitor customer behavior and individual links. In order to effectively meet the new challenges in the most revolutionary way, companies should invest in change management through the employment of big data analytics, so as to achieve superiority in re-engineering marketing activities. Mastering data exchange and evaluation, without jeopardizing the profitability of logistics companies, is crucial to achieving logistics industry sustainability and resilience.

4.4. Limitations and Future Recommendations

Despite the applied methodical rigor, the study is subject to several limitations that offer potential for future research. The authors developed an innovative methodology on re-engineering marketing based on 10 leading logistics companies, based on their brand name and annual revenue. These companies typically have the know-how in facing organizational changes. It would be interesting for future research to employ the same methodology in small and medium logistics companies and confirm or reject the outcomes of the current study. Moreover, the methodology of the current study could be used as the motivation of implementing website and social media analytics in other fields. Therefore, more testing should be conducted in different sectors so as to develop a unique agenda based on marketing KPIs, which correspond to the requirements of the sector under investigation.
An interesting approach would be to expand the dynamics of the current methodology by implementing qualitative research on the digital marketing strategy adopted by logistics companies. By doing so, the marketing department of logistics companies would gather fruitful insights on the effectiveness and resonance of the company’s marketing activities. Moreover, the embedment of qualitative features would offer valuable information on customers’ online purchasing patterns in an attempt to minimize the gap between customers’ expectations and the overall perceived satisfaction from the company’s marketing activities.
In addition, future studies should focus on the connection between digital branding and rating applications that emerge from the outcomes of the present study. Last, future studies on customer behavior modeling are welcomed in order to highlight its importance on the contribution to the optimization scenarios. The application of deep learning in smart logistics is further recommended as a novel research approach, so as to identify IoT device data integrity and device behavior, with the ultimate purpose in gaining a better understanding of users’ complex behavioral patterns.

Author Contributions

Conceptualization, D.P.R., D.P.S. and M.C.T.; methodology, D.P.R. and D.P.S.; software, D.P.R. and D.P.S.; validation, D.P.R., D.P.S. and M.C.T.; formal analysis, D.P.R.; investigation, D.P.R., D.P.S. and M.C.T.; resources, D.P.R. and D.P.S.; data curation, D.P.R., D.P.S. and M.C.T.; writing—original draft preparation, D.P.R. and M.C.T.; writing—review and editing, D.P.R. and M.C.T.; visualization, D.P.R., D.P.S. and M.C.T.; supervision, D.P.S.; project administration, D.P.R., D.P.S. and M.C.T. All authors have read and agreed to the published version of the manuscript.

Funding

Funded form the Editorial office of the “Electronics” Journal.

Institutional Review Board Statement

Not applicable.

Informed Consent Statement

Not applicable.

Data Availability Statement

The datasets used in this study are available in Zenodo: https://zenodo.org/record/7971998. Accessed on 25 May 2023.

Conflicts of Interest

The authors declare no conflict of interest.

References

  1. Büyüközkan, G.; Göçer, F. Digital Supply Chain: Literature Review and a Proposed Framework for Future Research. Comput. Ind. 2018, 97, 157–177. [Google Scholar] [CrossRef]
  2. Tran-Dang, H.; Krommenacker, N.; Charpentier, P.; Kim, D.-S. The Internet of Things for Logistics: Perspectives, Application Review, and Challenges. IETE Tech. Rev. 2022, 39, 93–121. [Google Scholar] [CrossRef]
  3. Yin, W.; Ran, W. Supply Chain Diversification, Digital Transformation, and Supply Chain Resilience: Configuration Analysis Based on fsQCA. Sustain. Sci. Pract. Policy 2022, 14, 7690. [Google Scholar] [CrossRef]
  4. Statista (2022). Spending on Digital Transformation Technologies and Services Worldwide from 2017 to 2026. Available online: https://www.statista.com/statistics/870924/worldwide-digital-transformation-market-size/ (accessed on 30 March 2023).
  5. García-Reyes, H.; Avilés-González, J.; Avilés-Sacoto, S.V. A Model to Become a Supply Chain 4.0 Based on a Digital Maturity Perspective. Procedia Comput. Sci. 2022, 200, 1058–1067. [Google Scholar] [CrossRef]
  6. Zouari, D.; Ruel, S.; Viale, L. Does Digitalising the Supply Chain Contribute to Its Resilience? Int. J. Phys. Distrib. Logist. Manag. 2020, 51, 149–180. [Google Scholar] [CrossRef]
  7. Parviainen, P.; Tihinen, M.; Kääriäinen, J.; Teppola, S. Tackling the Digitalization Challenge: How to Benefit from Digitalization in Practice. IJISPM 2017, 5, 63–77. [Google Scholar] [CrossRef]
  8. Bellantuono, N.; Nuzzi, A.; Pontrandolfo, P.; Scozzi, B. Digital Transformation Models for the I4.0 Transition: Lessons from the Change Management Literature. Sustain. Sci. Pract. Policy 2021, 13, 12941. [Google Scholar] [CrossRef]
  9. Song, Y.; Yu, F.R.; Zhou, L.; Yang, X.; He, Z. Applications of the Internet of Things (IoT) in Smart Logistics: A Comprehensive Survey. IEEE Internet Things J. 2021, 8, 4250–4274. [Google Scholar] [CrossRef]
  10. Chen, Y.-T.; Sun, E.W.; Chang, M.-F.; Lin, Y.-B. Pragmatic Real-Time Logistics Management with Traffic IoT Infrastructure: Big Data Predictive Analytics of Freight Travel Time for Logistics 4.0. Int. J. Prod. Econ. 2021, 238, 108157. [Google Scholar] [CrossRef]
  11. Glistau, E.; Coello Machado, N.I. Industry 4.0, Logistics 4.0 and Materials—Chances and Solutions. Mater. Sci. Forum 2018, 919, 307–314. [Google Scholar] [CrossRef]
  12. Irimiás, A.; Mitev, A. Change Management, Digital Maturity, and Green Development: Are Successful Firms Leveraging on Sustainability? Sustainability 2020, 12, 4019. [Google Scholar] [CrossRef]
  13. Saputra, D.A.; Handayani, P.W.; Satria, R. Customer Relationship Management (CRM) Implementation Evaluation Using Maturity Assessment in Telecommunication Industry: Case Study of an Indonesian Company. In Proceedings of the 2019 International Conference on Advanced Computer Science and information Systems (ICACSIS), Nusa Dua, Indonesia, 12–13 October 2019; pp. 513–518. [Google Scholar]
  14. Archibong, U.; Ibrahim, U.A. Assessing the Impact of Change Management on Employee Performance: Evidence from Nile University of Nigeria. IJRBS 2021, 10, 525–534. [Google Scholar] [CrossRef]
  15. Kumar, M. Knowledge Management: Process and Challenges. IOSR J. Bus. Manag. 2021, 23, 56–59. [Google Scholar]
  16. Freihat, S. The Role of Transformational Leadership in Reengineering of Marketing Strategies within Organizations. Probl. Perspect. Manag. 2020, 18, 364–375. [Google Scholar] [CrossRef]
  17. Baiyere, A.; Salmela, H.; Tapanainen, T. Digital Transformation and the New Logics of Business Process Management. Eur. J. Inf. Syst. 2020, 29, 238–259. [Google Scholar] [CrossRef]
  18. Hanelt, A.; Bohnsack, R.; Marz, D.; Antunes Marante, C. A Systematic Review of the Literature on Digital Transformation: Insights and Implications for Strategy and Organizational Change. J. Manag. Stud. 2021, 58, 1159–1197. [Google Scholar] [CrossRef]
  19. Vasilyeva, T.; Us, Y.; Lyulyov, A.; Pimonenko, T. Business process reengineering: From traditional to digital marketing. Vìsnik Sums’kogo Deržavnogo Unìversitetu 2020, 309–318. [Google Scholar] [CrossRef]
  20. Alsamydai, M.J. Marketing Engineering and Making Marketing Decisions. Int. J. Sci. Technol. Res. 2019, 8, 352–358. [Google Scholar]
  21. Chaikovska, M.; Shkeda, O. Reengineering Brand Communication with the Consumer by Integrating Pop Cultural Influencer Marketing Tools into Traditional Marketing Components. Mаркетинг I Цифрoві Технoлoгії 2021, 5, 63–71. [Google Scholar] [CrossRef]
  22. Zheng, P.; Chen, C.-H.; Shang, S. Towards an Automatic Engineering Change Management in Smart Product-Service Systems—A DSM-Based Learning Approach. Adv. Eng. Inform. 2019, 39, 203–213. [Google Scholar] [CrossRef]
  23. Giakomidou, D.S.; Kriemadis, A.; Nasiopoulos, D.K.; Mastrakoulis, D. Re-Engineering of Marketing for SMEs in Energy Market through Modeling Customers’ Strategic Behavior. Energies 2022, 15, 8179. [Google Scholar] [CrossRef]
  24. Sakas, D.P.; Reklitis, D.P.; Trivellas, P.; Vassilakis, C.; Terzi, M.C. The Effects of Logistics Websites’ Technical Factors on the Optimization of Digital Marketing Strategies and Corporate Brand Name. Processes 2022, 10, 892. [Google Scholar] [CrossRef]
  25. Nasiopoulos, D.Κ.; Sakas, D.P.; Trivellas, P. The Role of Digital Marketing in the Development of a Distribution and Logistics Network of Information Technology Companies. In Proceedings of the Business Intelligence and Modelling; Springer International Publishing: New York, NY, USA, 2021; pp. 267–276. [Google Scholar]
  26. Liu, C.; Feng, Y.; Lin, D.; Wu, L.; Guo, M. Iot Based Laundry Services: An Application of Big Data Analytics, Intelligent Logistics Management, and Machine Learning Techniques. Int. J. Prod. Res. 2020, 58, 5113–5131. [Google Scholar] [CrossRef]
  27. Agostini, L.; Galati, F.; Gastaldi, L. The Digitalization of the Innovation Process: Challenges and Opportunities from a Management Perspective. Eur. J. Innov. Manag. 2020, 23, 1–12. [Google Scholar] [CrossRef]
  28. Zaki, M. Digital Transformation: Harnessing Digital Technologies for the next Generation of Services. J. Prof. Serv. Mark. 2019, 33, 429–435. [Google Scholar] [CrossRef]
  29. Ciarli, T.; Kenney, M.; Massini, S.; Piscitello, L. Digital Technologies, Innovation, and Skills: Emerging Trajectories and Challenges. Res. Policy 2021, 50, 104289. [Google Scholar] [CrossRef]
  30. Hoyer, W.D.; Kroschke, M.; Schmitt, B.; Kraume, K.; Shankar, V. Transforming the Customer Experience through New Technologies. J. Interact. Mark. 2020, 51, 57–71. [Google Scholar] [CrossRef]
  31. Lee, S.M.; Lee, D. “Untact”: A New Customer Service Strategy in the Digital Age. Serv. Bus. 2020, 14, 1–22. [Google Scholar] [CrossRef]
  32. Keiningham, T.; Aksoy, L.; Bruce, H.L.; Cadet, F.; Clennell, N.; Hodgkinson, I.R.; Kearney, T. Customer Experience Driven Business Model Innovation. J. Bus. Res. 2020, 116, 431–440. [Google Scholar] [CrossRef]
  33. Srisathan, W.A.; Naruetharadhol, P. A COVID-19 Disruption: The Great Acceleration of Digitally Planned and Transformed Behaviors in Thailand. Technol. Soc. 2022, 68, 101912. [Google Scholar] [CrossRef]
  34. Oberoi, S.S. Modeling of the Shrinking Product Life Cycle. Theor. Econ. Lett. 2019, 9, 234–239. [Google Scholar] [CrossRef]
  35. Melander, L. Customer Involvement in Product Development: Using Voice of the Customer for Innovation and Marketing. Benchmarking Int. J. 2019, 27, 215–231. [Google Scholar] [CrossRef]
  36. Frishammar, J.; Richtnér, A.; Brattström, A.; Magnusson, M.; Björk, J. Opportunities and Challenges in the New Innovation Landscape: Implications for Innovation Auditing and Innovation Management. Eur. Manag. J. 2019, 37, 151–164. [Google Scholar] [CrossRef]
  37. Parveen, T.F.; Nadarajah, D.; Ismawati, J.N.; Sulaiman, A. The Impact of Digitalisation Vision and Information Technology on Organisations’ Innovation. Eur. J. Innov. Manag. 2021, 25, 607–629. [Google Scholar]
  38. Casalino, N.; Żuchowski, I.; Labrinos, N.; Munoz Nieto, Á.L.; Martín-Jiménez, J.A. Digital Strategies and Organizational Performances of SMEs in the Age of Coronavirus: Balancing Digital Transformation with An Effective Business Resilience. 2019. Available online: https://papers.ssrn.com (accessed on 21 May 2023).
  39. Al-Haddad, S.; Kotnour, T. Integrating the Organizational Change Literature: A Model for Successful Change. J. Organ. Chang Manag. 2015, 28, 234–262. [Google Scholar] [CrossRef]
  40. Sakas, D.P.; Reklitis, D.P.; Trivellas, P. European Logistics Firms’ digital Transformation through Social Media Analytics and Customer Reviews. In Proceedings of the Economic and Social Development: Book of Proceedings; Varazdin Development and Entrepreneurship: Varazdin, Croatia, 2023; pp. 88–95. [Google Scholar]
  41. Sadeghi, J.K.; Struckell, E.; Ojha, D.; Nowicki, D. Absorptive Capacity and Disaster Immunity: The Mediating Role of Information Quality and Change Management Capability. J. Knowl. Manag. 2020, 25, 714–742. [Google Scholar] [CrossRef]
  42. Phillips, J.; Klein, J.D. Change Management: From Theory to Practice. TechTrends 2023, 67, 189–197. [Google Scholar] [CrossRef] [PubMed]
  43. Van Hoek, R. Responding to COVID-19 Supply Chain Risks—Insights from Supply Chain Change Management, Total Cost of Ownership and Supplier Segmentation Theory. Logistics 2020, 4, 23. [Google Scholar] [CrossRef]
  44. Alshurideh, M.; Al Kurdi, B.H.; Alzoubi, H.M.; Salloum, S. The Effect of Information Technology on Business and Marketing Intelligence Systems; Springer Nature: New York, NY, USA, 2023; ISBN 9783031123825. [Google Scholar]
  45. Asamoah, D.; Nuertey, D.; Agyei-Owusu, B.; Akyeh, J. The Effect of Supply Chain Responsiveness on Customer Development. Int. J. Logist. Manag. 2021, 32, 1190–1213. [Google Scholar] [CrossRef]
  46. Thordsen, T.; Bick, M. Towards a Holistic Digital Maturity Model. In Proceedings of the ICIS 2020 Proceedings; Association for Computing Machinery: New York, NY, USA, 2020. Available online: https://web.archive.org/web/20220803135014id_/https://aisel.aisnet.org/cgi/viewcontent.cgi?article=1208&context=icis2020 (accessed on 1 April 2023).
  47. Yeh, T.-M.; Chen, S.-H.; Chen, T.-F. The Relationships among Experiential Marketing, Service Innovation, and Customer Satisfaction—A Case Study of Tourism Factories in Taiwan. Sustain. Sci. Pract. Policy 2019, 11, 1041. [Google Scholar] [CrossRef]
  48. Liu, Y.; Soroka, A.; Han, L.; Jian, J.; Tang, M. Cloud-Based Big Data Analytics for Customer Insight-Driven Design Innovation in SMEs. Int. J. Inf. Manag. 2020, 51, 102034. [Google Scholar] [CrossRef]
  49. Steward, M.D.; Narus, J.A.; Roehm, M.L.; Ritz, W. From Transactions to Journeys and beyond: The Evolution of B2B Buying Process Modeling. Ind. Mark. Manag. 2019, 83, 288–300. [Google Scholar] [CrossRef]
  50. Holmlund, M.; Van Vaerenbergh, Y.; Ciuchita, R.; Ravald, A.; Sarantopoulos, P.; Ordenes, F.V.; Zaki, M. Customer Experience Management in the Age of Big Data Analytics: A Strategic Framework. J. Bus. Res. 2020, 116, 356–365. [Google Scholar] [CrossRef]
  51. Terho, H.; Mero, J.; Siutla, L.; Jaakkola, E. Digital Content Marketing in Business Markets: Activities, Consequences, and Contingencies along the Customer Journey. Ind. Mark. Manag. 2022, 105, 294–310. [Google Scholar] [CrossRef]
  52. Bushuyev, S.; Bushuieva, V.; Bushuyeva, N.; Bushuiev, D. Conceptual Model of Project Digital Footprint. In Proceedings of the 2021 IEEE 16th International Conference on Computer Sciences and Information Technologies (CSIT), Lviv, Ukraine, 22–25 September 2021; Volume 2, pp. 327–332. [Google Scholar]
  53. Miklosik, A.; Evans, N. Impact of Big Data and Machine Learning on Digital Transformation in Marketing: A Literature Review. IEEE Access 2020, 8, 101284–101292. [Google Scholar] [CrossRef]
  54. Taraniuk, L.; Kobyzskyi, D.S.; Thomson, M. Estimation of the marketing potential of industrial enterprises in the period of re-engineering of business processes. Probl. Perspect. Manag. 2018, 16, 412–423. [Google Scholar] [CrossRef]
  55. Shukla, V.; Miri, R. Analysis of User Behavior in Social Media Using Business Process Re- Engineering and Learning Technique. Available online: https://www.webology.org/data-cms/articles/20220716045515pmwebology%2018%20(6)%20-%20533.pdf (accessed on 26 May 2023).
  56. Melnyk, L.H.; Derykolenko, O.M.; Matsenko, O.M.; Pasyevin, O.O.; Khymchenko, Y.V. Organizational and Economic Potential of Joint Engagement of Venture Capital and Business Process Re-Engineering in the Marketing Activities of Industrial Enterprises. Mech. Econ. Regul. 2019, 17–29. [Google Scholar] [CrossRef]
  57. Romanovskaya, E.V.; Garina, E.P.; Andryashina, N.S.; Kuznetsova, S.N.; Artemyeva, M.V. Studying the Experience of Reengineering Business Processes in the Practice of Domestic Enterprises: Problems and Prospects of Application. In Growth Poles of the Global Economy: Emergence, Changes and Future Perspectives; Popkova, E.G., Ed.; Springer International Publishing: Cham, Switzerland, 2020; pp. 517–524. ISBN 9783030151607. [Google Scholar]
  58. Venkateswaran, J. Establishing a Strong Digital Foundation for a 150-Year-Old Building Society with Business Process Re-Engineering and RPA. J. Digit. Bank. 2022, 7, 129–141. [Google Scholar]
  59. Shahira, S.H.N.; Salamzadeh, Y.; Fareen, A.R.N.; Salamzadeh, A. The Impact of Business Process Reengineering on Organizational Performance during the Coronavirus Pandemic: Moderating Role of Strategic Thinking. Foresight 2021, 24, 637–655. [Google Scholar]
  60. Wedel, M.; Kannan, P.K. Marketing Analytics for Data-Rich Environments. J. Mark. 2016, 80, 97–121. [Google Scholar] [CrossRef]
  61. Jha, M.; Jha, S.; O’Brien, L. Combining Big Data Analytics with Business Process Using Reengineering. In Proceedings of the 2016 IEEE Tenth International, Laguna Hills, CA, USA, 1–3 June 2016. [Google Scholar]
  62. Pandey, N.; Nayal, P.; Singh, R.A. Digital Marketing for B2B Organizations: Structured Literature Review and Future Research Directions. J. Bus. Ind. Mark. 2020, 35, 1191–1204. [Google Scholar] [CrossRef]
  63. Gour, A.; Aggarwal, S.; Erdem, M. Reading between the Lines: Analyzing Online Reviews by Using a Multi-Method Web-Analytics Approach. Int. J. Contemp. Hosp. Manag. 2021, 33, 490–512. [Google Scholar] [CrossRef]
  64. Ponzoa, J.M.; Erdmann, A. E-Commerce Customer Attraction: Digital Marketing Techniques, Evolution and Dynamics across Firms. J. Promot. Manag. 2021, 27, 697–715. [Google Scholar] [CrossRef]
  65. Sakas, D.P.; Kamperos, I.D.G.; Terzi, M.C. The Long-Term Risk Familiarity Effect on Courier Services’ Digital Branding during the COVID-19 Crisis. J. Theor. Appl. Electron. Commer. Res. 2022, 17, 1655–1684. [Google Scholar] [CrossRef]
  66. Sakas, D.P.; Reklitis, D.P.; Terzi, M.C.; Vassilakis, C. Multichannel Digital Marketing Optimizations through Big Data Analytics in the Tourism and Hospitality Industry. J. Theor. Appl. Electron. Commer. Res. 2022, 17, 1383–1408. [Google Scholar] [CrossRef]
  67. Reklitis, P.; Trivellas, P.; Mantzaris, I.; Mantzari, E.; Reklitis, D. Employee Perceptions of Corporate Social Responsibility Activities and Work-Related Attitudes: The Case of a Greek Management Services Organization. In Sustainability and Social Responsibility; Springer: Singapore, 2018. [Google Scholar]
  68. Sakas, D.P.; Giannakopoulos, N.T.; Terzi, M.C.; Kamperos, I.D.; Nasiopoulos, D.K.; Reklitis, D.P.; Kanellos, N. Social media strategy processes for centralized payment network firms after a war crisis outset. Processes 2022, 10, 1995. [Google Scholar] [CrossRef]
  69. Sakas, D.P.; Reklitis, D.P. Predictive Model for Estimating the Impact of Technical Issues on Consumers Interaction in Agri-Logistics Websites. In Technologies for Agriculture—Theme IV: Actions; Springer International Publishing: Cham, Switzerland, 2022. [Google Scholar]
  70. Sakas, D.P.; Reklitis, D.P. The Impact of Organic Traffic of Crowdsourcing Platforms on Airlines’ Website Traffic and User Engagement. Sustainability 2021, 13, 8850. [Google Scholar] [CrossRef]
  71. Tavana, M.; Shaabani, A.; Raeesi Vanani, I.; Kumar Gangadhari, R. A Review of Digital Transformation on Supply Chain Process Management Using Text Mining. Processes 2022, 10, 842. [Google Scholar] [CrossRef]
  72. Sandberg, E.; Hemilä, J. Digitalization in Industrial Logistics and Supply Chains: The Contemporary Situation in Sweden and Finland. In Proceedings of the 23rd International Symposium on Logistics, ISL, Bali, Indonesia, 8–11 July 2018. [Google Scholar]
  73. Preindl, R.; Nikolopoulos, K.; Litsiou, K. Transformation Strategies for the Supply Chain: The Impact of Industry 4.0 and Digital Transformation. Supply Chain. Forum Int. J. 2020, 21, 26–34. [Google Scholar] [CrossRef]
  74. Transparency Market Research (2018). Digital Transformation Spending in Logistics Market. Available online: https://www.transparencymarketresearch.com/digital-transformation-spending-logistics-market.html (accessed on 30 March 2023).
  75. Mashalah, H.A.; Hassini, E.; Gunasekaran, A.; Bhatt (Mishra), D. The Impact of Digital Transformation on Supply Chains through E-Commerce: Literature Review and a Conceptual Framework. Transp. Res. Part E Logist. Trans. Rev. 2022, 165, 102837. [Google Scholar] [CrossRef]
  76. Statista (2023). Number of Internet and Social Media Users Worldwide as of January 2023. Available online: https://www.statista.com/statistics/617136/digital-population-worldwide/ (accessed on 30 March 2023).
  77. Zondervan, N.A.; Tolentino-Zondervan, F.; Moeke, D. Logistics Trends and Innovations in Response to COVID-19 Pandemic: An Analysis Using Text Mining. Processes 2022, 10, 2667. [Google Scholar] [CrossRef]
  78. Wang, G.; Gunasekaran, A.; Ngai, E.W.T.; Papadopoulos, T. Big Data Analytics in Logistics and Supply Chain Management: Certain Investigations for Research and Applications. Int. J. Prod. Econ. 2016, 176, 98–110. [Google Scholar] [CrossRef]
  79. Kong, X.T.R.; Zhong, R.Y.; Zhao, Z.; Shao, S.; Li, M.; Lin, P.; Chen, Y.; Wu, W.; Shen, L.; Yu, Y.; et al. Cyber Physical Ecommerce Logistics System: An Implementation Case in Hong Kong. Comput. Ind. Eng. 2020, 139, 106170. [Google Scholar] [CrossRef]
  80. Winkelhaus, S.; Grosse, E.H. Logistics 4.0: A Systematic Review towards a New Logistics System. Int. J. Prod. Res. 2020, 58, 18–43. [Google Scholar] [CrossRef]
  81. Maheshwari, S.; Gautam, P.; Jaggi, C.K. Role of Big Data Analytics in Supply Chain Management: Current Trends and Future Perspectives. Int. J. Prod. Res. 2021, 59, 1875–1900. [Google Scholar] [CrossRef]
  82. Gunasekaran, A.; Papadopoulos, T.; Dubey, R.; Wamba, S.F.; Childe, S.J.; Hazen, B.; Akter, S. Big Data and Predictive Analytics for Supply Chain and Organizational Performance. J. Bus. Res. 2017, 70, 308–317. [Google Scholar] [CrossRef]
  83. Yang, D.; Wu, L.; Wang, S.; Jia, H.; Li, K.X. How Big Data Enriches Maritime Research—A Critical Review of Automatic Identification System (AIS) Data Applications. Transp. Rev. 2019, 39, 755–773. [Google Scholar] [CrossRef]
  84. Chen, S.-H.; Venkatachalam, R. Agent-Based Modelling as a Foundation for Big Data. J. Econ. Methodol. 2017, 24, 362–383. [Google Scholar] [CrossRef]
  85. Kodym, O.; Kubáč, L.; Kavka, L. Risks Associated with Logistics 4.0 and Their Minimization Using Blockchain. Open Eng. 2020, 10, 74–85. [Google Scholar] [CrossRef]
  86. Dai, H.-N.; Wang, H.; Xu, G.; Wan, J.; Imran, M. Big Data Analytics for Manufacturing Internet of Things: Opportunities, Challenges and Enabling Technologies. Enterp. Inf. Syst. 2020, 14, 1279–1303. [Google Scholar] [CrossRef]
  87. Bag, S.; Gupta, S.; Luo, Z. Examining the Role of Logistics 4.0 Enabled Dynamic Capabilities on Firm Performance. Int. J. Logist. Manag. 2020, 31, 607–628. [Google Scholar] [CrossRef]
  88. Li, L.; Gong, Y.; Wang, Z.; Liu, S. Big Data and Big Disaster: A Mechanism of Supply Chain Risk Management in Global Logistics Industry. Int. J. Oper. Prod. Manag. 2022, 43, 274–307. [Google Scholar] [CrossRef]
  89. Peter, M.K.; Dalla Vecchia, M. The Digital Marketing Toolkit: A Literature Review for the Identification of Digital Marketing Channels and Platforms. In New Trends in Business Information Systems and Technology: Digital Innovation and Digital Business Transformation; Dornberger, R., Ed.; Springer International Publishing: Cham, Switzerland, 2021; pp. 251–265. ISBN 9783030483326. [Google Scholar]
  90. Susanto, H.; Sari, A.; Leu, F.-Y. Innovative Business Process Reengineering Adoption: Framework of Big Data Sentiment, Improving Customers’ Service Level Agreement. Big Data Cogn. Comput. 2022, 6, 151. [Google Scholar] [CrossRef]
  91. Dubolazov, V.; Tayushev, S.; Gabdrakhmanova, I.; Simakova, Z.; Leicht, O. Re-Engineering of Logistics Business Processes Influenced by the Digitalization. In Proceedings of the XIV International Scientific Conference “INTERAGROMASH 2021”, Rostov-on-Don, Russia, 24–26 February 2021; Springer International Publishing: New York, NY, USA, 2022; pp. 539–547. [Google Scholar]
  92. Ge, J.; Wang, F.; Sun, H.; Fu, L.; Sun, M. Research on the Maturity of Big Data Management Capability of Intelligent Manufacturing Enterprise. Syst. Res. Behav. Sci. 2020, 37, 646–662. [Google Scholar] [CrossRef]
  93. Nasiopoulos, D.K.; Mastrakoulis, D.M.; Arvanitidis, D.A. The Contribution of Digital Technology to the Forecasting of Supply Chain Development, in IT Products, Modeling and Simulation of the Problem. Forecasting 2022, 4, 1019–1037. [Google Scholar] [CrossRef]
  94. Marshall, D.A.; Burgos-Liz, L.; Pasupathy, K.S.; Padula, W.V.; IJzerman, M.J.; Wong, P.K.; Higashi, M.K.; Engbers, J.; Wiebe, S.; Crown, W.; et al. Transforming Healthcare Delivery: Integrating Dynamic Simulation Modelling and Big Data in Health Economics and Outcomes Research. Pharmacoeconomics 2016, 34, 115–126. [Google Scholar] [CrossRef] [PubMed]
  95. Misirlis, N.; Vlachopoulou, M. Social Media Metrics and Analytics in Marketing—S3M: A Mapping Literature Review. Int. J. Inf. Manag. 2018, 38, 270–276. [Google Scholar] [CrossRef]
  96. Saura, J.R.; Palos-Sánchez, P.; Cerdá Suárez, L.M. Understanding the Digital Marketing Environment with KPIs and Web Analytics. Future Internet 2017, 9, 76. [Google Scholar] [CrossRef]
  97. Drivas, I.C.; Kouis, D.; Kyriaki-Manessi, D. Social Media Analytics and Metrics for Improving Users Engagement. Knowledge 2022, 2, 225–242. [Google Scholar] [CrossRef]
  98. Kaplan, A.M.; Haenlein, M. Users of the World, Unite! The Challenges and Opportunities of Social Media. Bus. Horiz. 2010, 53, 59–68. [Google Scholar] [CrossRef]
  99. Semrush. Traffic Analytics Overview Report Manual. Available online: https://www.semrush.com/kb/895-trafficanalyticsoverview-report (accessed on 9 April 2023).
  100. Academy.fanpagekarma. Available online: https://academy.fanpagekarma.com (accessed on 9 April 2023).
  101. Picoto, W.N.; Duarte, R.; Pinto, I. Uncovering Top-Ranking Factors for Mobile Apps through a Multimethod Approach. J. Bus. Res. 2019, 101, 668–674. [Google Scholar] [CrossRef]
  102. Byun, D.-H.; Yang, H.-N.; Chung, D.-S. Evaluation of Mobile Applications Usability of Logistics in Life Startups. Sustain. Sci. Pract. Policy 2020, 12, 9023. [Google Scholar] [CrossRef]
  103. Leung, D.; Law, R.; van Hoof, H.; Buhalis, D. Social Media in Tourism and Hospitality: A Literature Review. J. Travel Tour. Mark. 2013, 30, 3–22. [Google Scholar] [CrossRef]
  104. Kim, A.J.; Ko, E. Impacts of Luxury Fashion Brand’s Social Media Marketing on Customer Relationship and Purchase Intention. J. Glob. Fash. Mark. 2010, 1, 164–171. [Google Scholar] [CrossRef]
  105. Morais, E.P.; Cunha, C.R.; Santos, A. Understanding the Value of Digital Marketing Tools for SMEs. In Proceedings of the Marketing and Smart Technologies; Springer: Singapore, 2021; pp. 769–779. [Google Scholar]
  106. Cunha, C.R.; Carvalho, A.; Esteves, E. Reengineering the Way Tourists Interact with Heritage: A Conceptual IoT Based Model. In Proceedings of the 4th International Conference on Tourism Research ICTR 2021, Porto, Portugal, 20–21 May 2021; pp. 166–173. [Google Scholar]
  107. Armstrong & Associates, Inc. A&A’s Top 50 Global Third-Party Logistics Providers (3PLs) List Largest 3PLs Ranked by 2021 Gross Logistics Revenue/Turnover. Available online: https://www.3plogistics.com/3pl-market-info-resources/3pl-market-information/aas-top-50-global-third-party-logistics-providers-3pls-list/ (accessed on 10 April 2023).
  108. Top 100 3PL Providers. Available online: https://www.inboundlogistics.com/top-100-3pls/ (accessed on 10 April 2023).
  109. Giabbanelli, P.J.; Gray, S.A.; Aminpour, P. Combining Fuzzy Cognitive Maps with Agent-Based Modeling: Frameworks and Pitfalls of a Powerful Hybrid Modeling Approach to Understand Human-Environment Interactions. Environ. Model. Softw. 2017, 95, 320–325. [Google Scholar] [CrossRef]
  110. Son, C.; Kim, J.; Kim, Y. Developing Scenario-Based Technology Roadmap in the Big Data Era: An Utilisation of Fuzzy Cognitive Map and Text Mining Techniques. Technol. Anal. Strateg. Manag. 2020, 32, 272–291. [Google Scholar] [CrossRef]
  111. Kokkinos, K.; Lakioti, E.; Papageorgiou, E.; Moustakas, K.; Karayannis, V. Fuzzy Cognitive Map-Based Modeling of Social Acceptance to Overcome Uncertainties in Establishing Waste Biorefinery Facilities. Front. Energy Res. 2018, 6, 112. [Google Scholar] [CrossRef]
  112. Nuanmeesri, S. Mobile Application for the Purpose of Marketing, Product Distribution and Location-Based Logistics for Elderly Farmers. Appl. Comput. Inform. 2023, 19, 2–21. [Google Scholar] [CrossRef]
  113. Tadejko, P. Application of Internet of Things in Logistics -Current Challenges. Ekon. I Zarządzanie 2015, 7, 54–64. [Google Scholar]
  114. Dela Cruz, D.R.; Mendoza, D.M.M. Milktrack: Design and Development of Mobile Application and Logistics System in Empowering Breastfeeding Practice in the Philippines. In Proceedings of the TENCON 2017—2017 IEEE Region 10 Conference, Penang, Malaysia, 5–8 November 2017; pp. 2242–2246. [Google Scholar]
  115. Simkin, L.; Dibb, S. Social Media’s Impact on Market Segmentation and CRM. J. Strateg. Mark. 2013, 21, 391–393. [Google Scholar] [CrossRef]
  116. Pridmore, J.; Hämäläinen, L.E. Market Segmentation in (in)action: Marketing and “yet to Be Installed” Role of Big and Social Media Data. Hist. Soc. Res. 2017, 42, 103–122. [Google Scholar]
  117. Constantinides, E.; Zinck Stagno, M.C. Potential of the Social Media as Instruments of Higher Education Marketing: A Segmentation Study. J. Mark. High. Educ. 2011, 21, 7–24. [Google Scholar] [CrossRef]
  118. Vinerean, S.; Cetina, I.; Dumitrescu, L.; Tichindelean, M. The Effects of Social Media Marketing on Online Consumer Behavior. Int. J. Indian Cult. Bus. Manag. 2013, 8, 66. [Google Scholar] [CrossRef]
  119. Hanaysha, J. The Importance of Social Media Advertisements in Enhancing Brand Equity: A Study on Fast Food Restaurant Industry in Malaysia. Int. J. Innov. Technol. Manag. 2016, 7, 46–51. [Google Scholar] [CrossRef]
  120. Misra, A.K.; Rai, R.K.; Takeuchi, Y. Modeling the Control of Infectious Diseases: Effects of TV and Social Media Advertisements. Math. Biosci. Eng. 2018, 15, 1315–1343. [Google Scholar] [CrossRef]
  121. Akre, V.; Rajan, A.; Ahamed, J.; Al Amri, A.; Al Daisi, S. Smart Digital Marketing of Financial Services to Millennial Generation Using Emerging Technological Tools and Buyer Persona. In Proceedings of the 2019 Sixth HCT Information Technology Trends (ITT), Ras Al Khaimah, UAE, 20–21 November 2019; pp. 120–125. [Google Scholar]
  122. Cruz, A.; Karatzas, S. Understanding Your Buyer Persona. In Digital and Social Media Marketing; Routledge: Milton Park, UK, 2020. [Google Scholar]
  123. Terragni, A.; Hassani, M. Optimizing Customer Journey Using Process Mining and Sequence-Aware Recommendation. In Proceedings of the 34th ACM/SIGAPP Symposium on Applied Computing; Association for Computing Machinery: New York, NY, USA, 2019; pp. 57–65. [Google Scholar]
  124. Cichosz, M.; Marcus, W.C.; Knemeyer, A.M. Digital Transformation at Logistics Service Providers: Barriers, Success Factors and Leading Practices. Int. J. Logist. Manag. 2020, 31, 209–238. [Google Scholar] [CrossRef]
  125. Krauss, J.; Vanhove, A.J. Organizational Culture Perceptions and Change Frequency: The Moderating Effect of Members’ Hierarchical Level in the Organization. Leadersh. Organ. Dev. J. 2022, 43, 302–314. [Google Scholar] [CrossRef]
  126. Sivarajah, U.; Irani, Z.; Gupta, S.; Mahroof, K. Role of Big Data and Social Media Analytics for Business to Business Sustainability: A Participatory Web Context. Ind. Mark. Manag. 2020, 86, 163–179. [Google Scholar] [CrossRef]
  127. Serbetcioglu, C.; Göçer, A. Examining Social Media Branding Profiles of Logistics Service Providers. J. Bus. Ind. Mark. 2020, 35, 2023–2038. [Google Scholar] [CrossRef]
  128. Suoniemi, S.; Meyer-Waarden, L.; Munzel, A.; Zablah, A.R.; Straub, D. Big Data and Firm Performance: The Roles of Market-Directed Capabilities and Business Strategy. Inf. Manag. 2020, 57, 103365. [Google Scholar] [CrossRef]
  129. Sestino, A.; Prete, M.I.; Piper, L.; Guido, G. Internet of Things and Big Data as Enablers for Business Digitalization Strategies. Technovation 2020, 98, 102173. [Google Scholar] [CrossRef]
  130. Johnson, D.S.; Muzellec, L.; Sihi, D.; Zahay, D. The Marketing Organization’s Journey to Become Data-Driven. J. Res. Interact. Mark. 2019, 13, 162–178. [Google Scholar] [CrossRef]
  131. Vollrath, M.D.; Villegas, S.G. Avoiding Digital Marketing Analytics Myopia: Revisiting the Customer Decision Journey as a Strategic Marketing Framework. J. Mark. Anal. 2022, 10, 106–113. [Google Scholar] [CrossRef]
  132. Roumeliotis, K.I.; Tselikas, N.D.; Nasiopoulos, D.K. Airlines’ Sustainability Study Based on Search Engine Optimization Techniques and Technologies. Sustainability 2022, 14, 11225. [Google Scholar] [CrossRef]
  133. Qalati, S.A.; Yuan, L.W.; Khan, M.A.S.; Anwar, F. A Mediated Model on the Adoption of Social Media and SMEs’ Performance in Developing Countries. Technol. Soc. 2021, 64, 101513. [Google Scholar] [CrossRef]
  134. Arriagada, A.; Ibáñez, F. “You Need At Least One Picture Daily, If Not, You’re Dead”: Content Creators and Platform Evolution in the Social Media Ecology. Soc. Media Soc. 2020, 6, 2056305120944624. [Google Scholar] [CrossRef]
  135. Choi, J.; Yoon, J.; Chung, J.; Coh, B.-Y.; Lee, J.-M. Social Media Analytics and Business Intelligence Research: A Systematic Review. Inf. Process. Manag. 2020, 57, 102279. [Google Scholar] [CrossRef]
  136. Espinosa, J.A.; Armour, F. The Big Data Analytics Gold Rush: A Research Framework for Coordination and Governance. In Proceedings of the 2016 49th Hawaii International Conference on System Sciences (HICSS), Koloa, HI, USA, 5–8 January 2016; pp. 1112–1121. [Google Scholar]
  137. Radivojević, G.; Milosavljević, L. The concept of logistics 4.0. In Proceedings of the 4th Logistics International Conference, Belgrade, Serbia, 23–25 May 2019; pp. 23–25. Available online: https://logic.sf.bg.ac.rs/wp-content/uploads/LOGIC_2019_ID_32.pdf (accessed on 31 March 2023).
  138. Schweidel, D.A.; Bart, Y.; Inman, J.J.; Stephen, A.T.; Libai, B.; Andrews, M.; Rosario, A.B.; Chae, I.; Chen, Z.; Kupor, D.; et al. How Consumer Digital Signals Are Reshaping the Customer Journey. J. Acad. Mark. Sci. 2022, 50, 1257–1276. [Google Scholar] [CrossRef] [PubMed]
  139. König, C.; Caldwell, N.D.; Ghadge, A. Service Provider Boundaries in Competitive Markets: The Case of the Logistics Industry. Int. J. Prod. Res. 2019, 57, 5624–5639. [Google Scholar] [CrossRef]
  140. Khan, S.A.R.; Zhang, Y.; Kumar, A.; Zavadskas, E.; Streimikiene, D. Measuring the Impact of Renewable Energy, Public Health Expenditure, Logistics, and Environmental Performance on Sustainable Economic Growth. Sustain. Dev. 2020, 28, 833–843. [Google Scholar] [CrossRef]
  141. Wang, C.; Kim, Y.-S.; Kim, C.Y. Causality between Logistics Infrastructure and Economic Development in China. Transp. Policy 2021, 100, 49–58. [Google Scholar] [CrossRef]
  142. Fayez, A.O.; Mahjoub, D.M.; Najaf, K.; Francisco, F.G. Impact of COVID-19 on Financial Performance of Logistics Firms: Evidence from G-20 Countries. J. Glob. Oper. Strateg. Sourc. 2021, 15, 172–196. [Google Scholar]
  143. Pwc.com. Shifting Patterns: The Future of the Logistics Industry. Available online: https://www.pwc.com/sg/en/publications/assets/future-of-the-logistics-industry.pdf (accessed on 25 May 2023).
  144. Sheng, J.; Amankwah-Amoah, J.; Khan, Z.; Wang, X. COVID-19 Pandemic in the New Era of Big Data Analytics: Methodological Innovations and Future Research Directions. Br. J. Manag. 2021, 32, 1164–1183. [Google Scholar] [CrossRef]
Figure 1. Conceptual framework on the research hypotheses H1-H5. The Figure represents the logical sequence of the hypotheses.
Electronics 12 02443 g001
Figure 2. Fuzzy cognitive map.
Electronics 12 02443 g002
Figure 3. Social media engagement scenario.
Electronics 12 02443 g003
Figure 4. Brand name optimization scenario.
Electronics 12 02443 g004
Figure 5. Logistics applications rating optimization scenario.
Electronics 12 02443 g005
Figure 6. Cost optimization scenario.
Electronics 12 02443 g006
Table 1. Presentation of the extracted web analytics KPIs.
Web Analytics KPIsDescription of the Web Analytics KPIs
Websites’ Organic TrafficOrganic traffic refers to people who come to the corporate site in an unpaid way [24,99].
Websites’ Social Media TrafficVia links or adverts, social media networks such as Twitter redirect consumers to the corporate website [99].
Websites’ Paid TrafficIt refers to a web analytic that is calculated using paid procedures. When consumers click on ads in Google or other websites, customers are redirected to the logistics websites [99].
Websites’ Total VisitorsThis web analytic monitors the number of users daily that visit a logistic website [99].
Websites’ Global RankWebsites’ global rank is calculated based on the overall platform traffic, which takes into consideration the organic traffic, the social media traffic, and the total paid traffic; the smaller the global rank, the more famous the website. For example, a website in 7th place is more famous and visible than a website in the 117th place [24,99].
Websites’ Bounce RateThis web analytic calculates how many visitors exit the logistic website without taking further action [99].
Websites’ Average Time on SiteThis web analytic tracks how much time a user remains on a logistics website [99].
Websites’ Pages per VisitThe number of pages that a user browses in a logistics website [99].
Organic Traffic CostThis web analytic calculates the cost to place organic keywords by using Google advertisements [99].
Paid Traffic CostThis web analytic calculates the cost to place corporate advertisements in social media, search engines, and mobile applications [99].
Follower GrowthFollower growth measures the number of new followers on the corporate social media account per week [100].
Total Reactions, Comments, and SharesThis social media analytic indicates the number of interactions on posts that were published at a specific time [100].
Total Social Media EngagementThis web analytic shows an average amount of how much a fan interacts with the posts of a brand [100].
Logistics App RatingApp rating is a score given to a mobile app based on user comments and reviews in order to represent its overall quality, based on the users’ experience. The rating scale is 1 to 5 stars, with 5 being the highest rating [101,102].
Table 2. Pearson’s correlation between the metrics for H1.
CorrelationsSocial Media TrafficLogistics App RatingTotal Reactions, Comments, SharesFollower Growth
Social Media Traffic1
Logistics App Rating0.300 *1
Total Reactions, Comments, Shares−0.325 *−0.0581
Follower Growth−0.301 *0.0040.718 *1
* Correlation is significant at the 0.01 level (1-tailed).
Table 3. H1 regression.
VariablesStandardized CoefficientR2Fp Value
Constant (Social Media Traffic)0.1772.8700.048
Logistics App Rating0.274 0.068
Total Reactions, Comments, Shares−0.182 0.425
Follower Growth−0.134 0.553
Table 4. Pearson’s correlations between the metrics for H2.
CorrelationsBounce RatePages per VisitsFollower Growth
Bounce Rate1
Pages per Visits−0.886 **1
Follower Growth−0.321 *0.2691
* Correlation is significant at the 0.05 level (2-tailed). ** Correlation is significant at the 0.01 level (1-tailed).
Table 5. H2 Regression.
VariablesStandardized CoefficientR2Fp Value
Constant (Bounce Rate)0.79287,4110.000
Pages per Visits
Follower Growth
−0.089
−0.862
0.000
0.207
Table 6. Pearson’s correlations between the metrics for H3.
CorrelationsPaid TrafficFollower GrowthOrganic TrafficSocial Media Traffic
Paid Traffic1
Follower Growth−0.338 *1
Organic Traffic0.786 **−0.2261
Social Media Traffic0.937 **−0.301 *0.939 **1
* Correlation is significant at the 0.05 level (2-tailed). ** Correlation is significant at the 0.01 level (1-tailed).
Table 7. H3 Regression.
VariablesStandardized CoefficientR2Fp Value
Constant (Paid Traffic)0.952300,3410.000
Follower Growth
Organic Traffic
−0.011
−0.794
0.748
0.000
Social Media Traffic1.679 0.000
Table 8. Pearson’s correlations between the metrics for H4.
CorrelationsGlobal RankingTotal VisitorsLogistics Apps RatingSocial Media TrafficAverage Visit Durations
Global Ranking1
Total Visitors−0.569 **1
Logistics Apps Rating0.088−0.1231
Social Media Traffic−0.345 *0.931 **−0.0091
Average Visit Duration−521 **0.994 **−0.0640.928 **1
* Correlation is significant at the 0.05 level (2-tailed). ** Correlation is significant at the 0.01 level (1-tailed).
Table 9. H4 regression.
VariablesStandardized CoefficientR2Fp Value
Constant (Global Ranking)0.72428.9090.000
Total Visitors−5.232 0.000
Logistics Apps Rating0.001 0.993
Social Media Traffic−1.338 0.000
Average Visit Duration−3.437 0.000
Table 10. Pearson’s correlations between the metrics for H5.
CorrelationsPaid Traffic CostOrganic Traffic CostSocial Media TrafficSocial Media Engagement
Paid Traffic Cost1
Organic Traffic Cost0.908 **1
Social Media Traffic0.1770.0801
Social Media Engagement−0.040−0.024−0.1351
** Correlation is significant at the 0.01 level (1-tailed).
Table 11. H5 Regression.
VariablesStandardized CoefficientR2Fp Value
Constant (Paid Traffic Cost)0.71331.5040.000
Organic Traffic Cost0.839 0.000
Social Media Traffic0.049 0.000
Social Media Engagement−007 0.933
Disclaimer/Publisher’s Note: The statements, opinions and data contained in all publications are solely those of the individual author(s) and contributor(s) and not of MDPI and/or the editor(s). MDPI and/or the editor(s) disclaim responsibility for any injury to people or property resulting from any ideas, methods, instructions or products referred to in the content.

