
Covert Channel Based on Quasi-Orthogonal Coding


Abstract
1. Introduction
- (a)
- In [3], quadrature amplitude modulation (QAM) covert information constellation points are distributed around the QAM cover constellation points, forming the so-called dirty constellation. Thus, an additional constellation is formed based on the cover constellation.
- (b)
- (c)
- Hiding the data by moving the constellation points by a given angle (right or left) is shown in [1]. In this case, binary PSK (BPSK) modulation was used for practical implementation.
- (d)
- In [6], the use of 8 frequency-shift keying (8FSK) modulation to embed information in QAM constellation points is presented. In this case, artificial neural networks were used to extract hidden data.
- (e)
- The authors [7] noted that PSK modulations do not use the channel fully in terms of Shannon capacity. Therefore, the so-called residual capacity can be used to hide information. In order to hide this emission from potential observers, pseudo-noise asymmetric shift keying (PN-ASK) modulation is proposed.
- (f)
- (g)
- (h)
- The transmission of stealth information in the form of noise on a QAM basis is presented in [10]. In this case, the cover’s signal is not used to carry information.
2. Radio Physical Layer Steganography
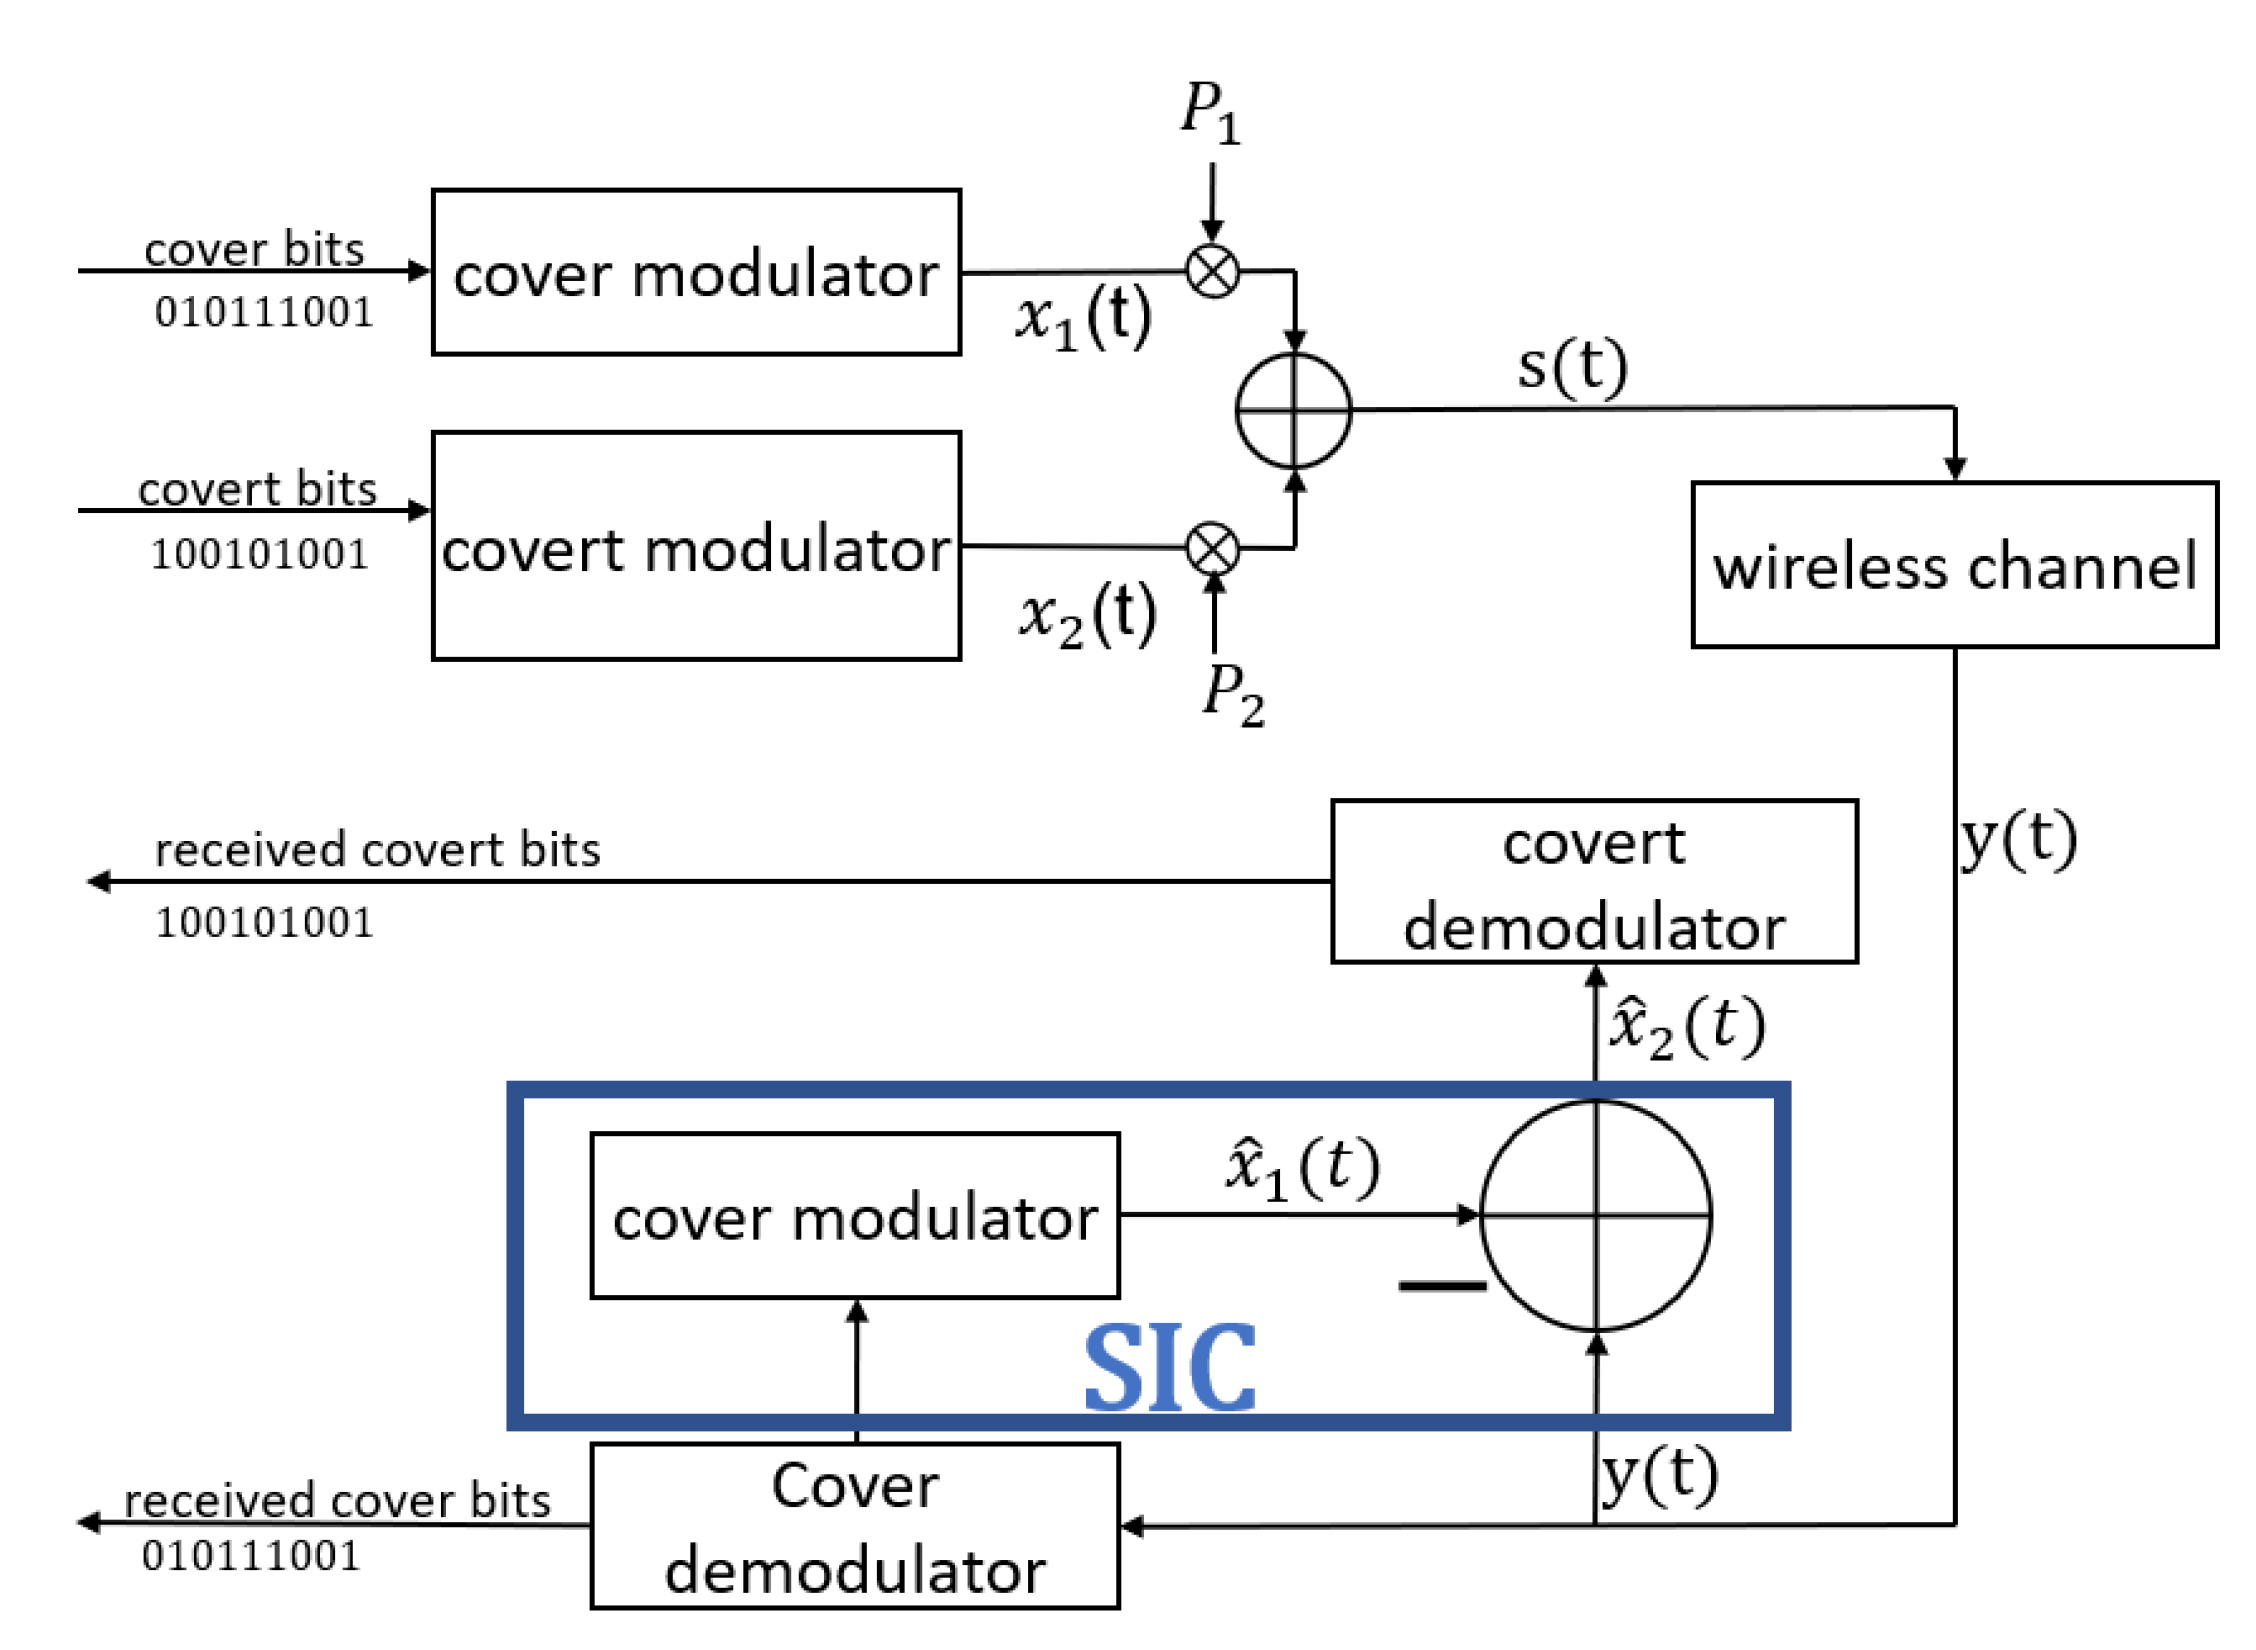
2.1. Creating a Covert Channel
- (a)
- the covert signal power should be significantly less than the cover signal ().
- (b)
- constellation points of the covert signal should have a pseudo-random (noise) characteristic.
2.2. Channel Estimation Error
2.3. Quasi-Orthogonality
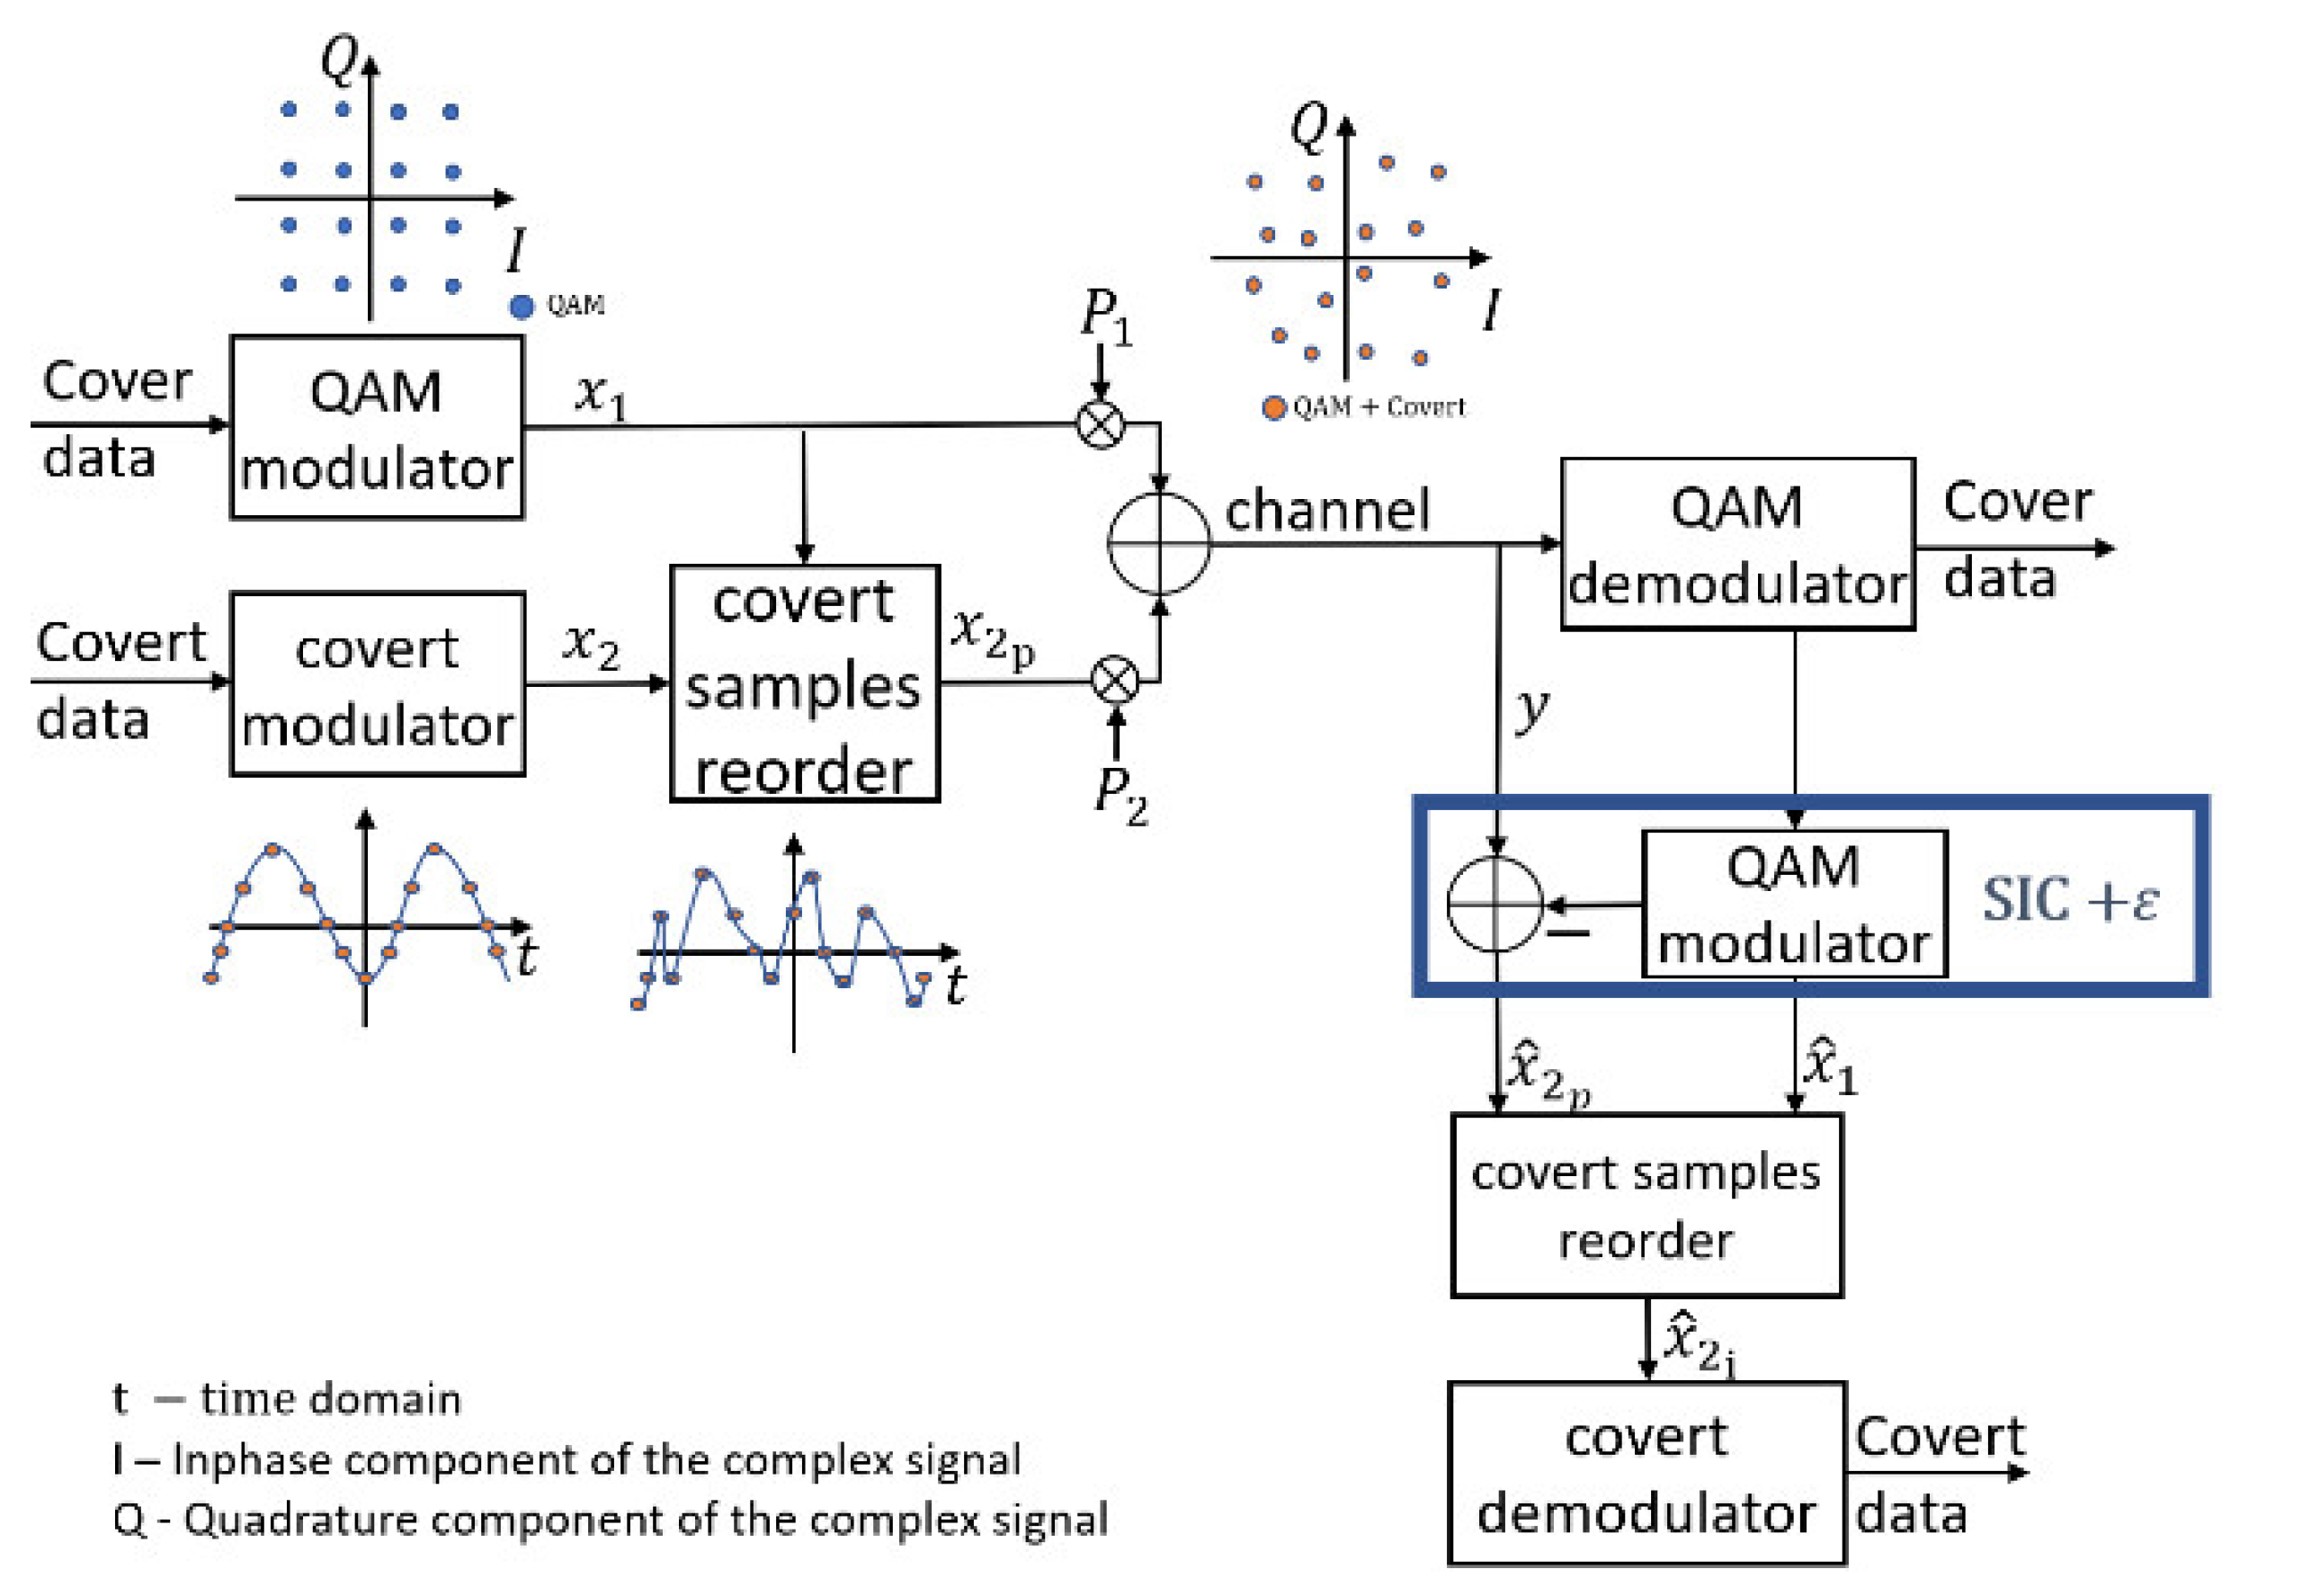
3. Proposed Model
3.1. Basic Assumptions
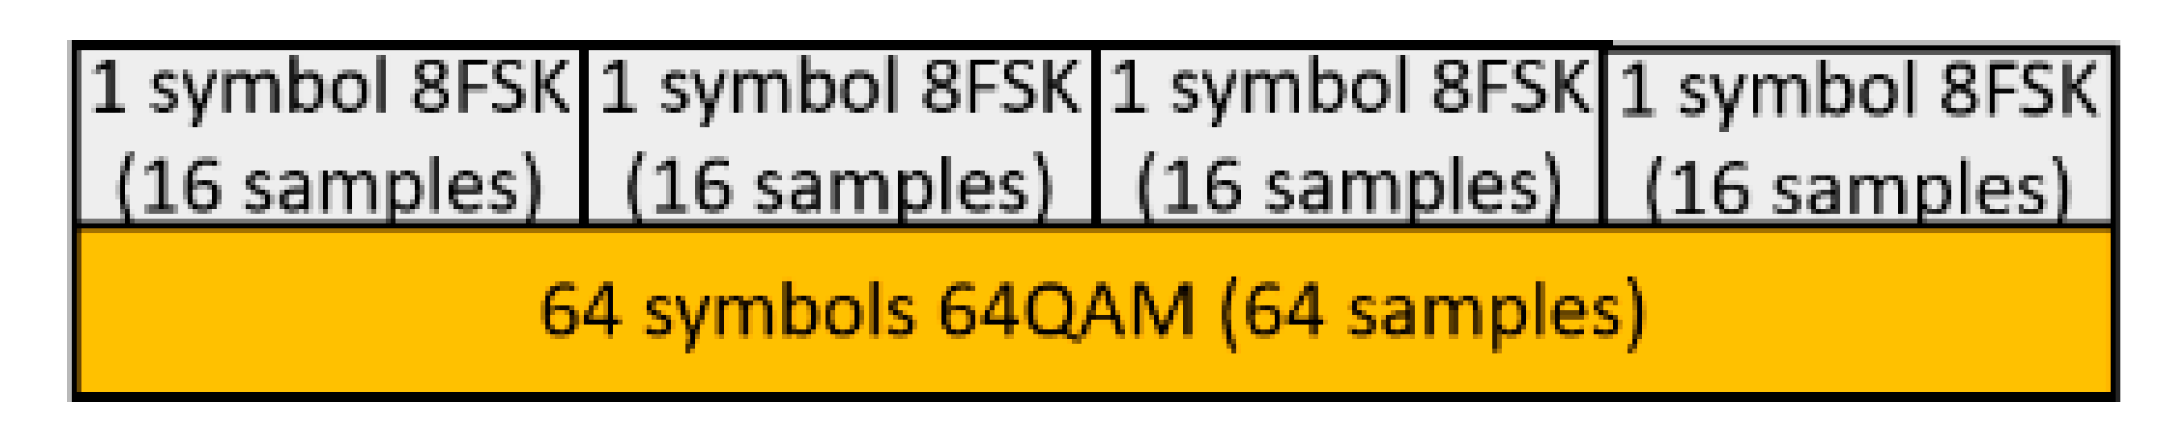
- At the transmitter, samples of the covert signal are sorted based on a given sequence of the cover (QAM modulation) signal . In this way, the sorted signal has a pseudo-random (noise) form.
- At the receiver, the signal re-sorting is performed after the SIC operation. Sorting in the receiver aims to:
- (a)
- restore the original sample order of the covert signal after the SIC operation to the original order (in an ideal case )
- (b)
- restoring the original order of is followed by a simultaneous change in the sample order of the residual signal associated with Thus, the residual signal becomes orthogonal (quasi-orthogonal) to the covert signal.
- (c)
- The covert signal is fed to the input of the covert channel demodulator
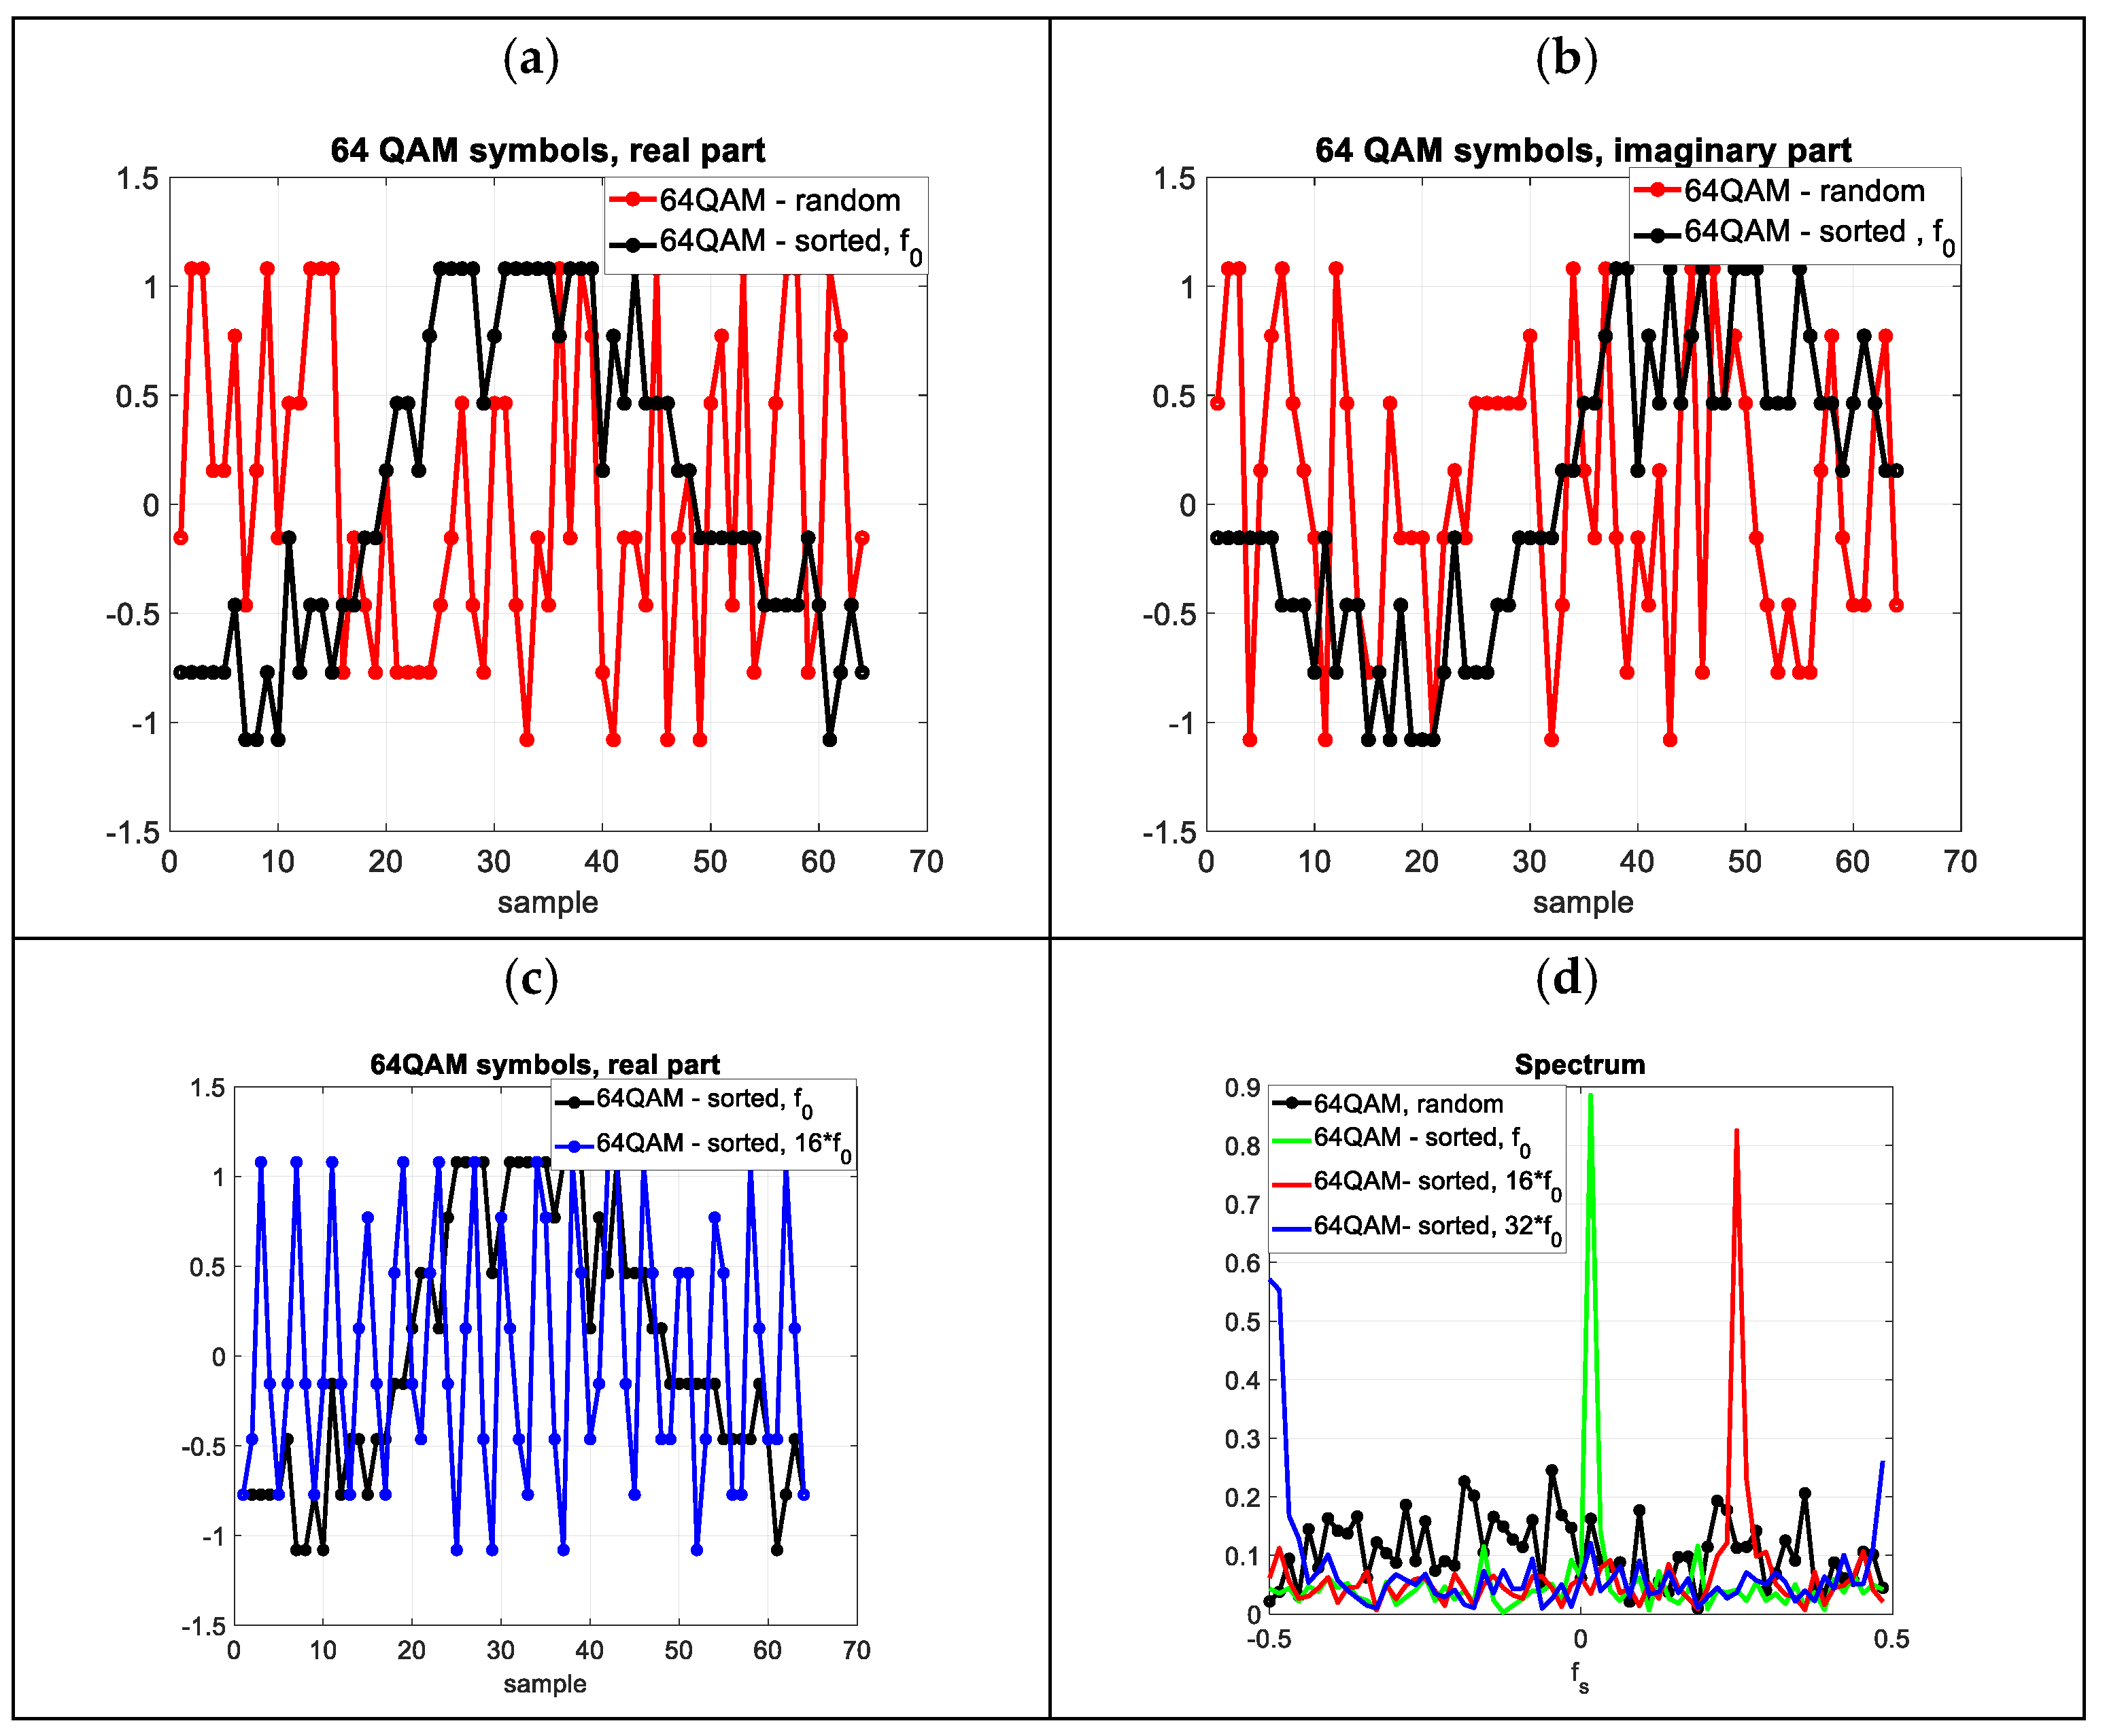
3.2. Cover Signal Sorting
4. Simulation Tests
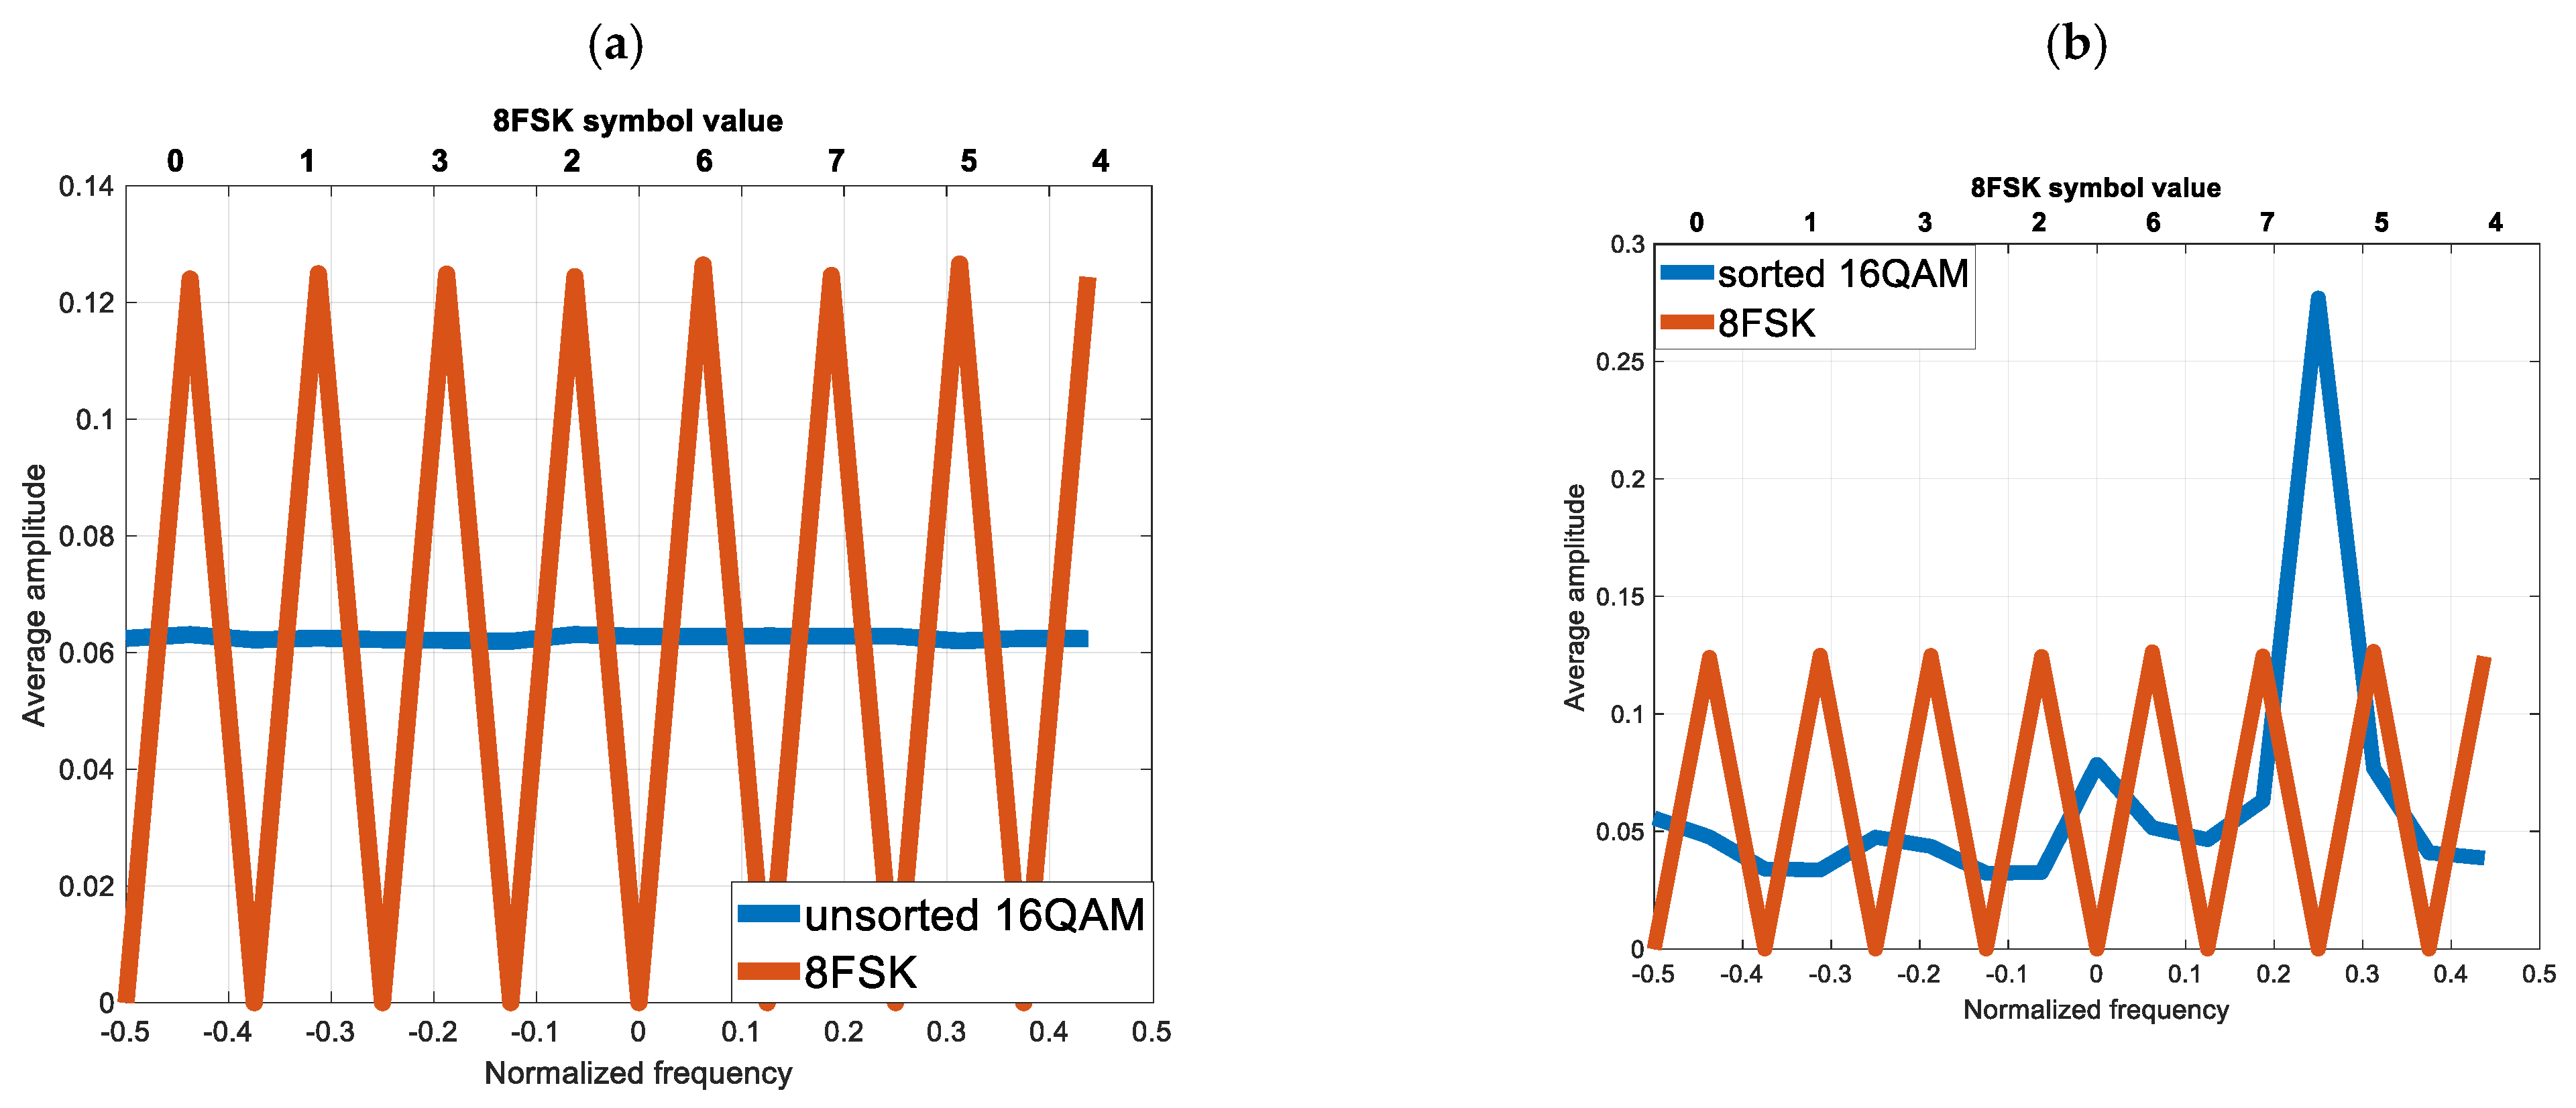
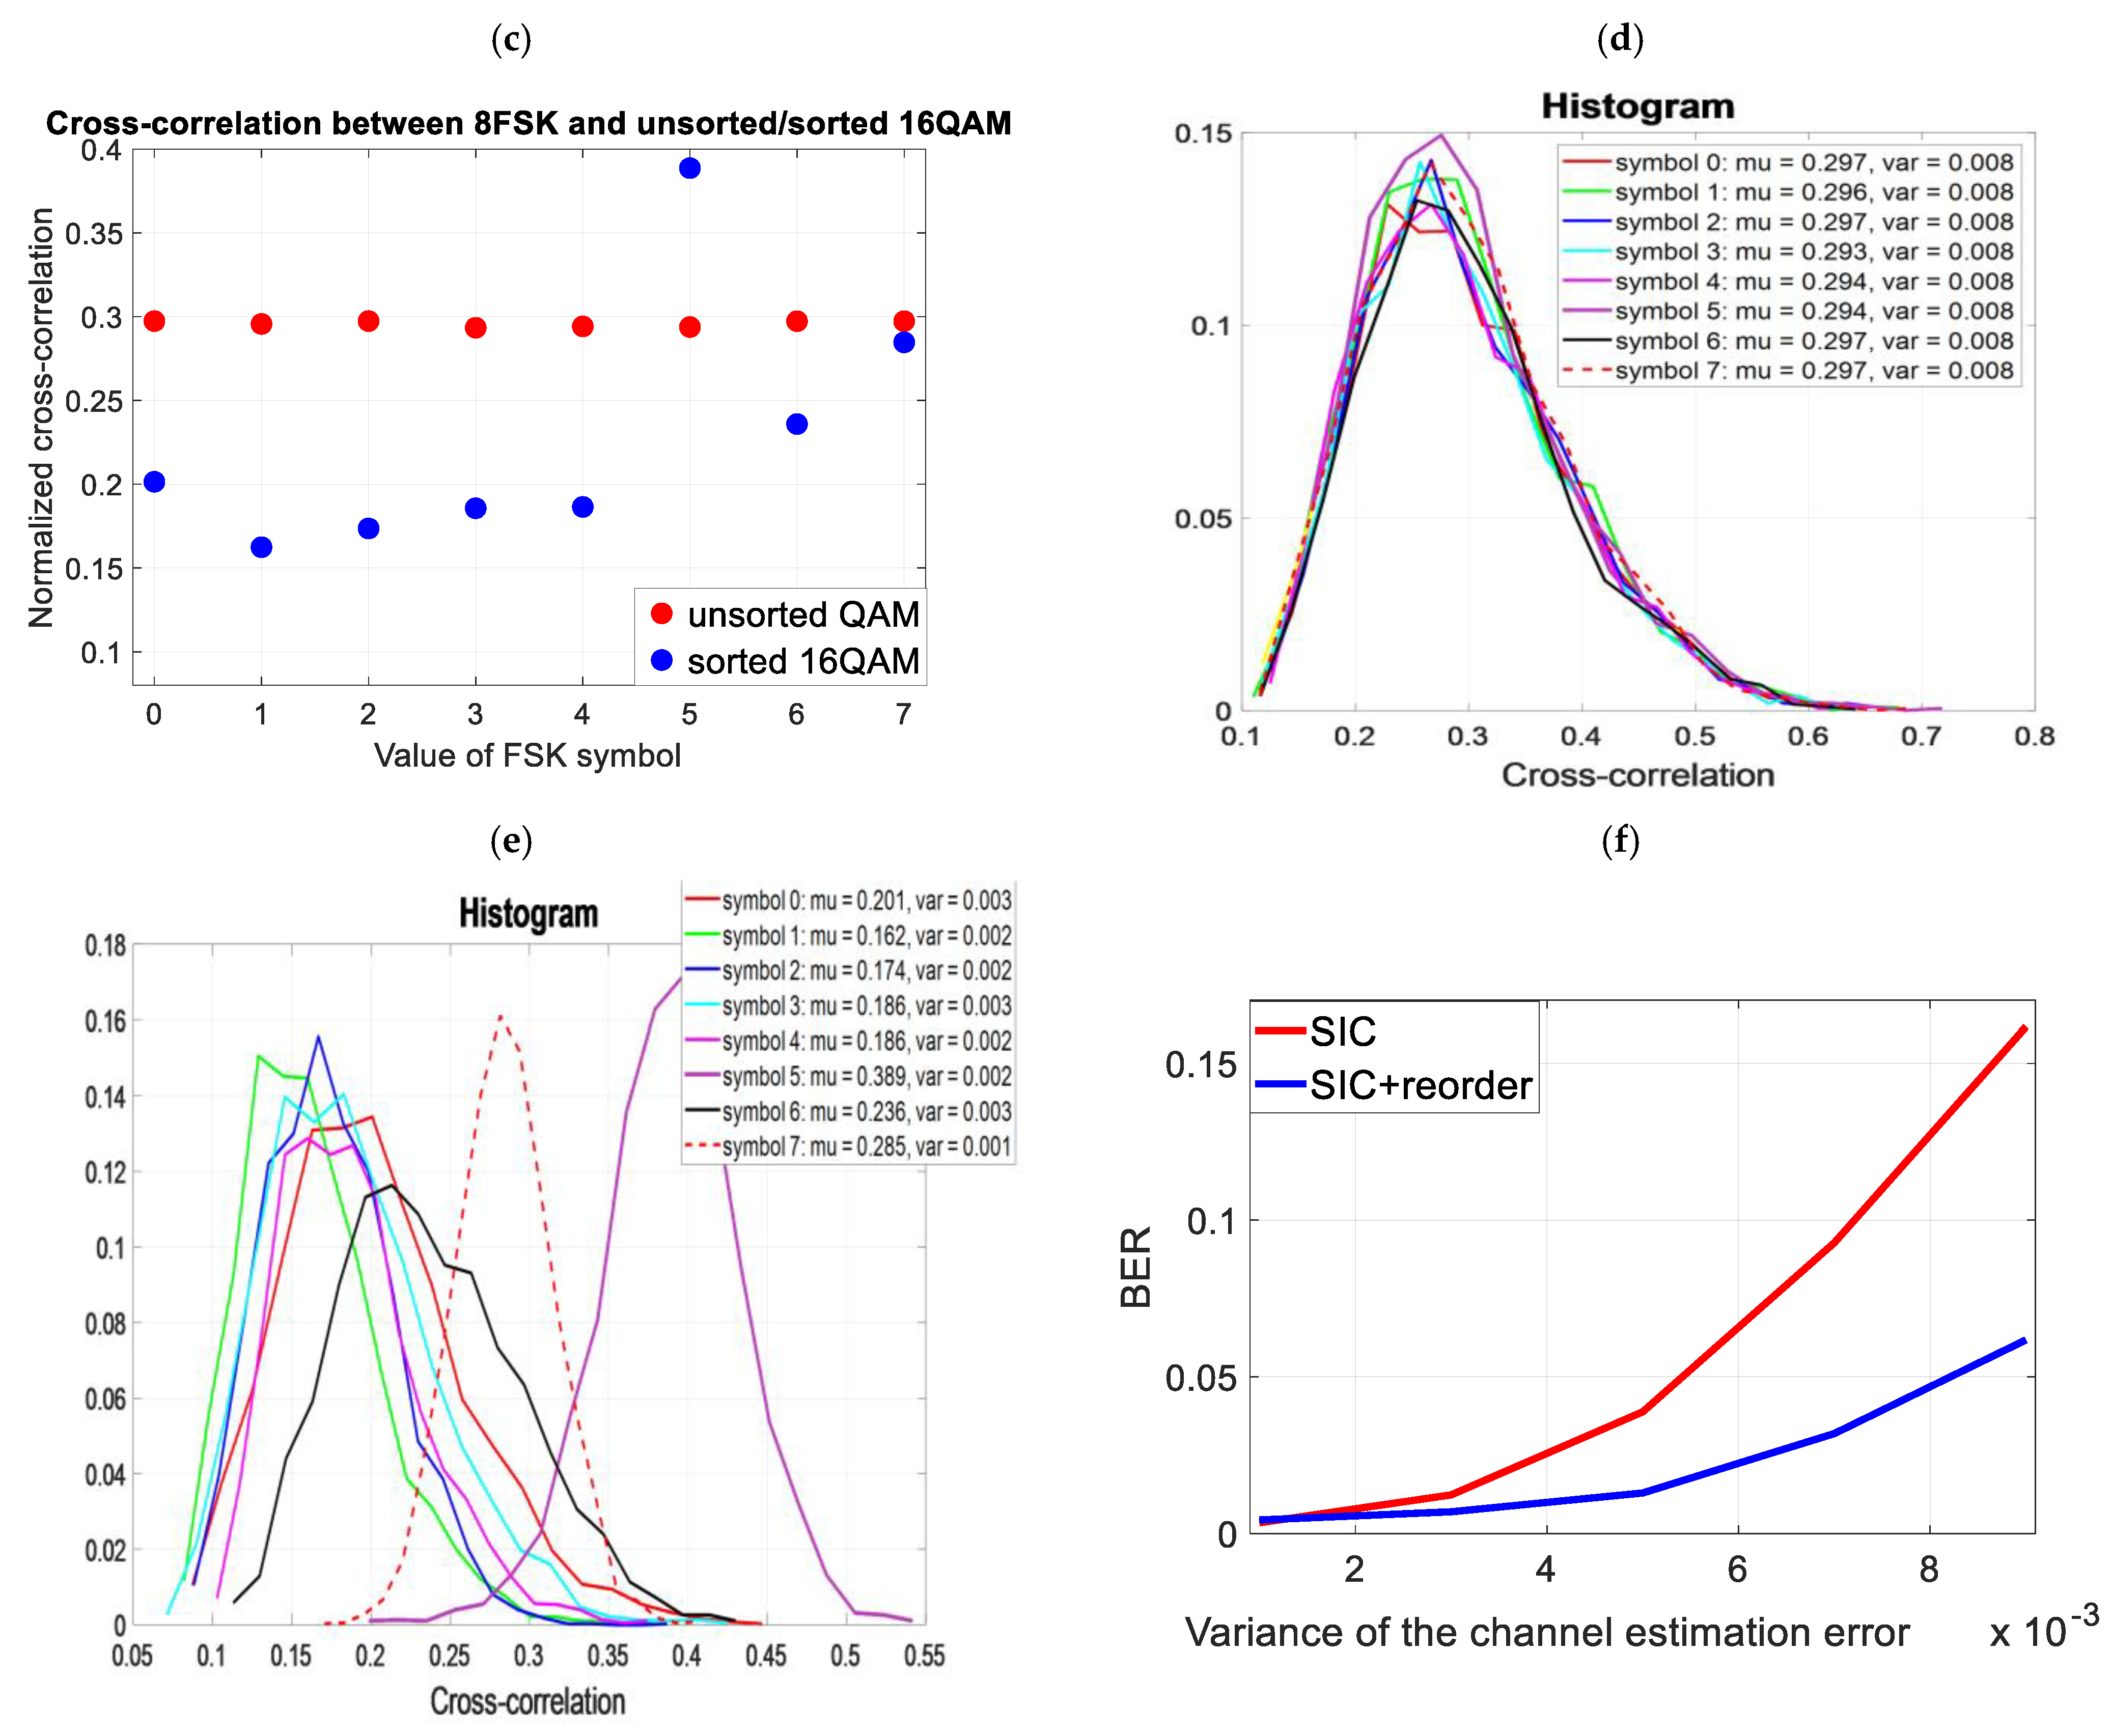
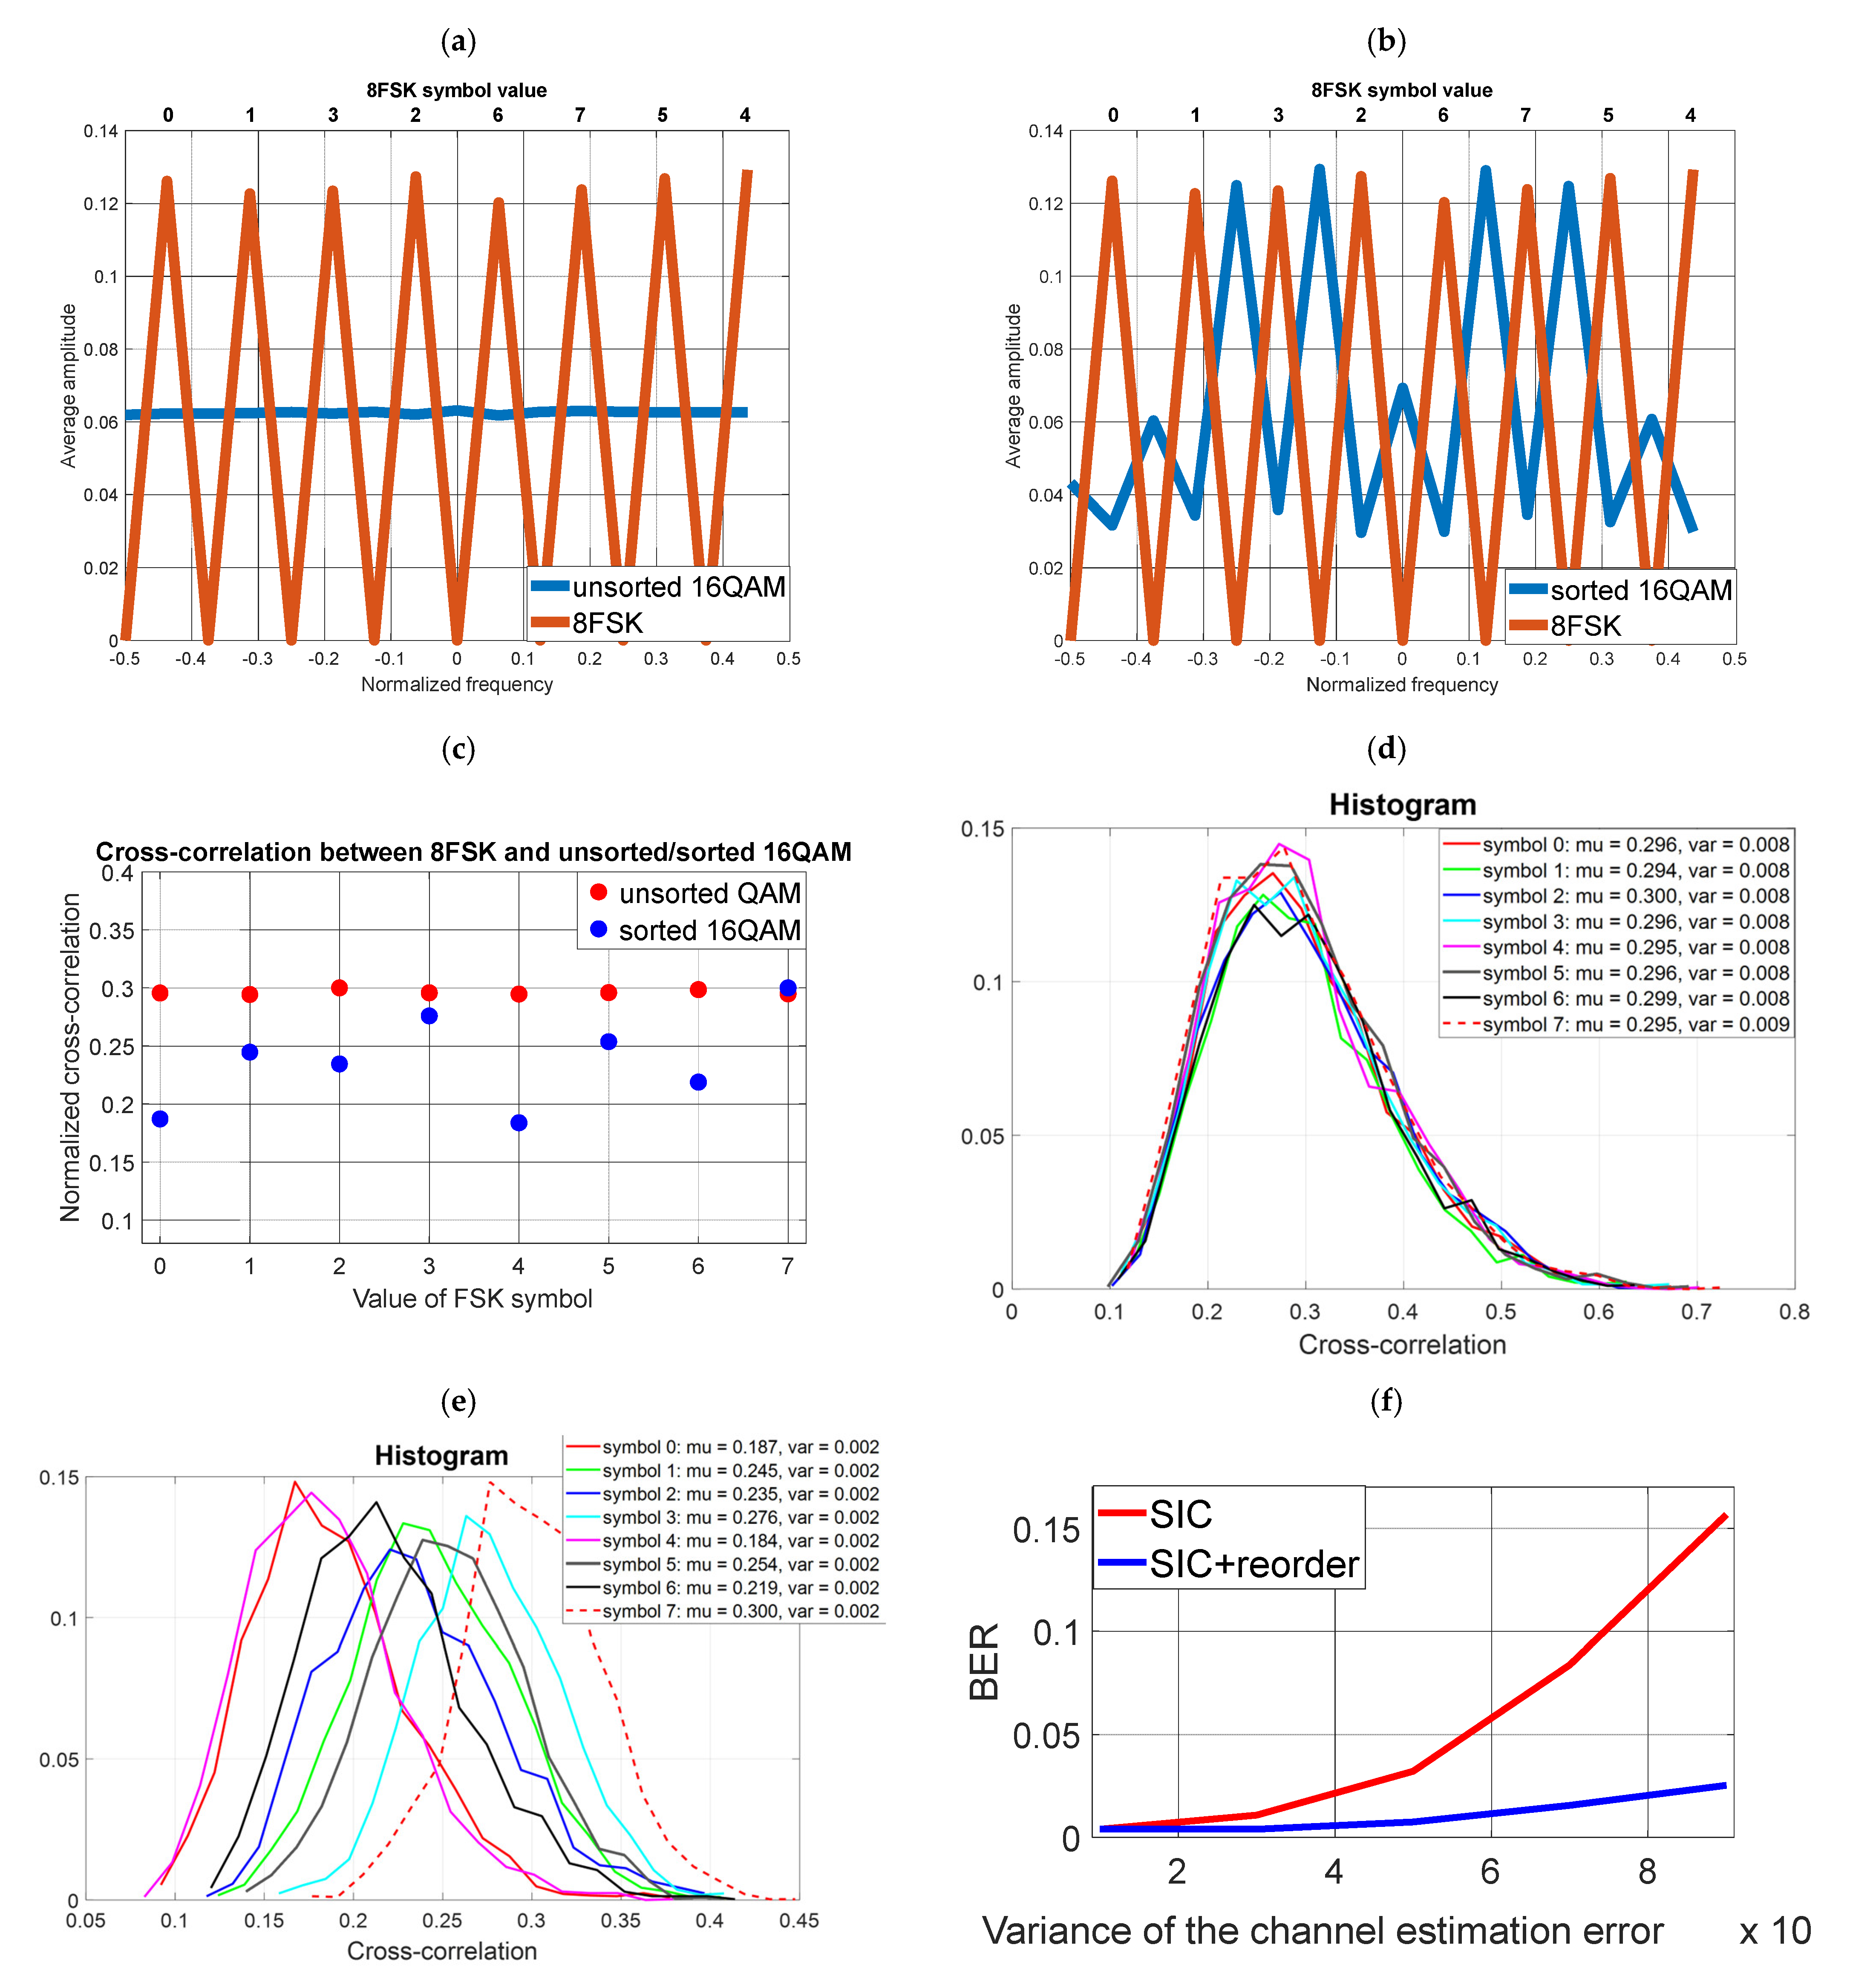
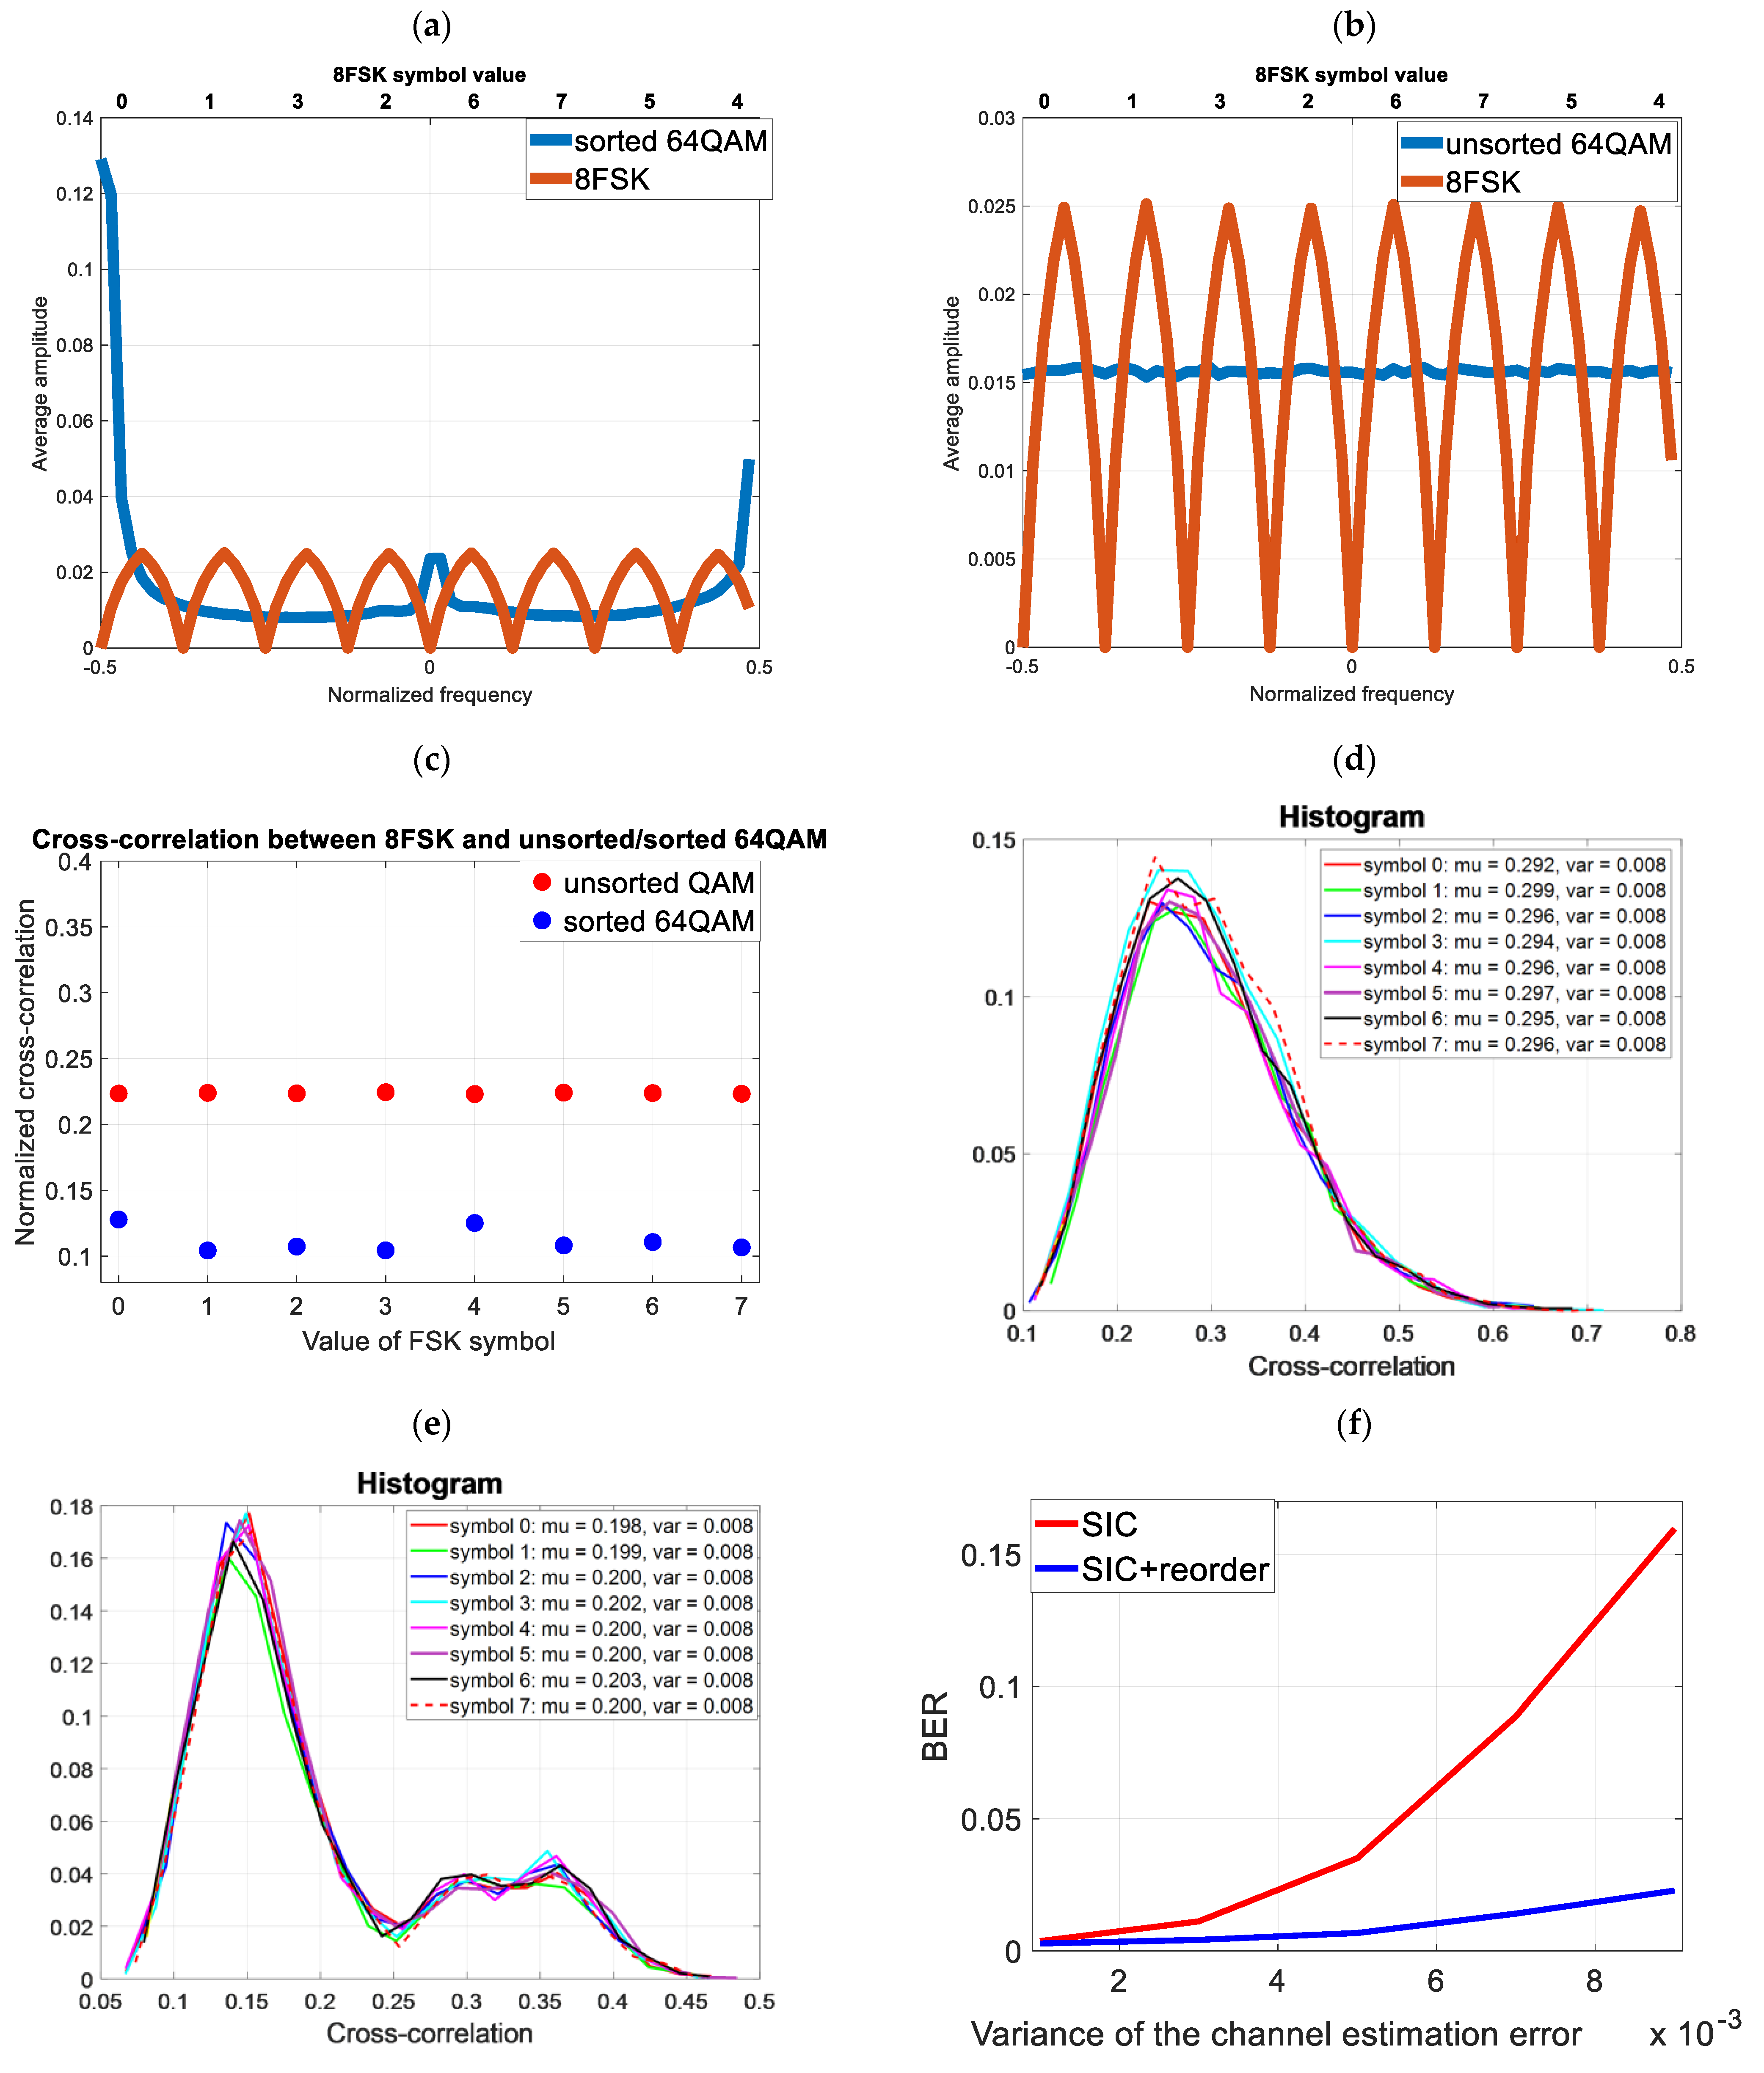
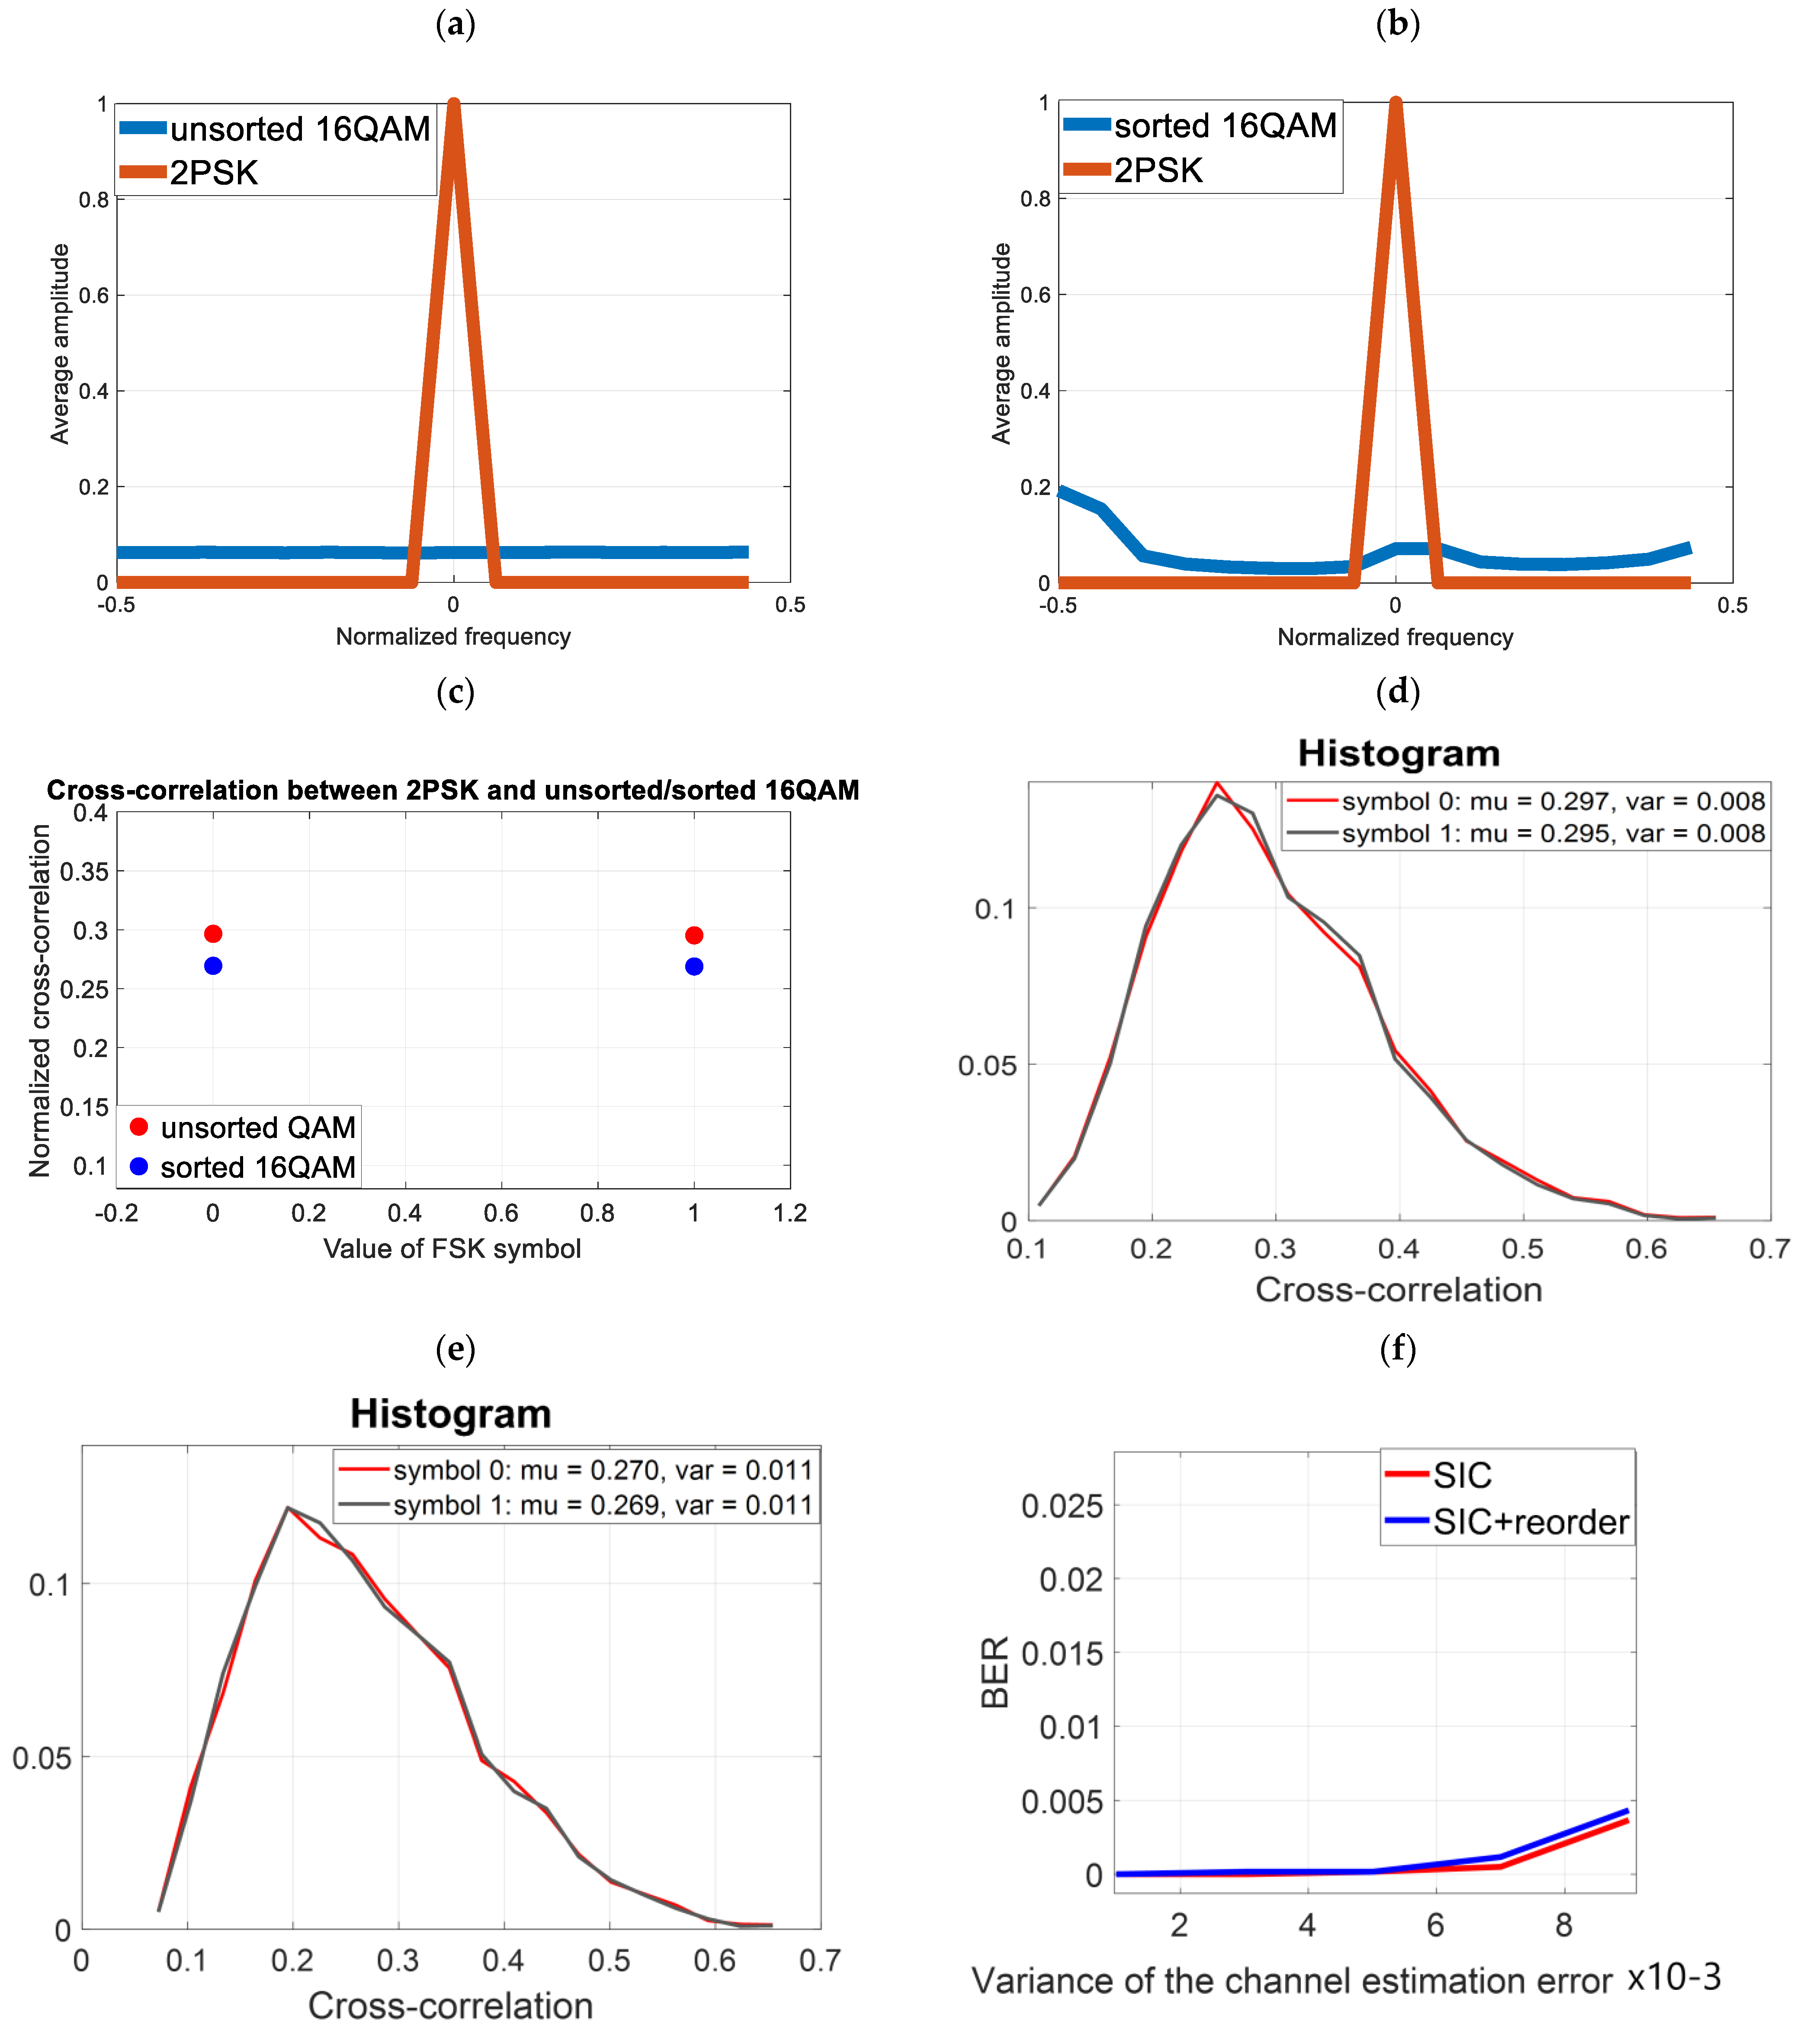
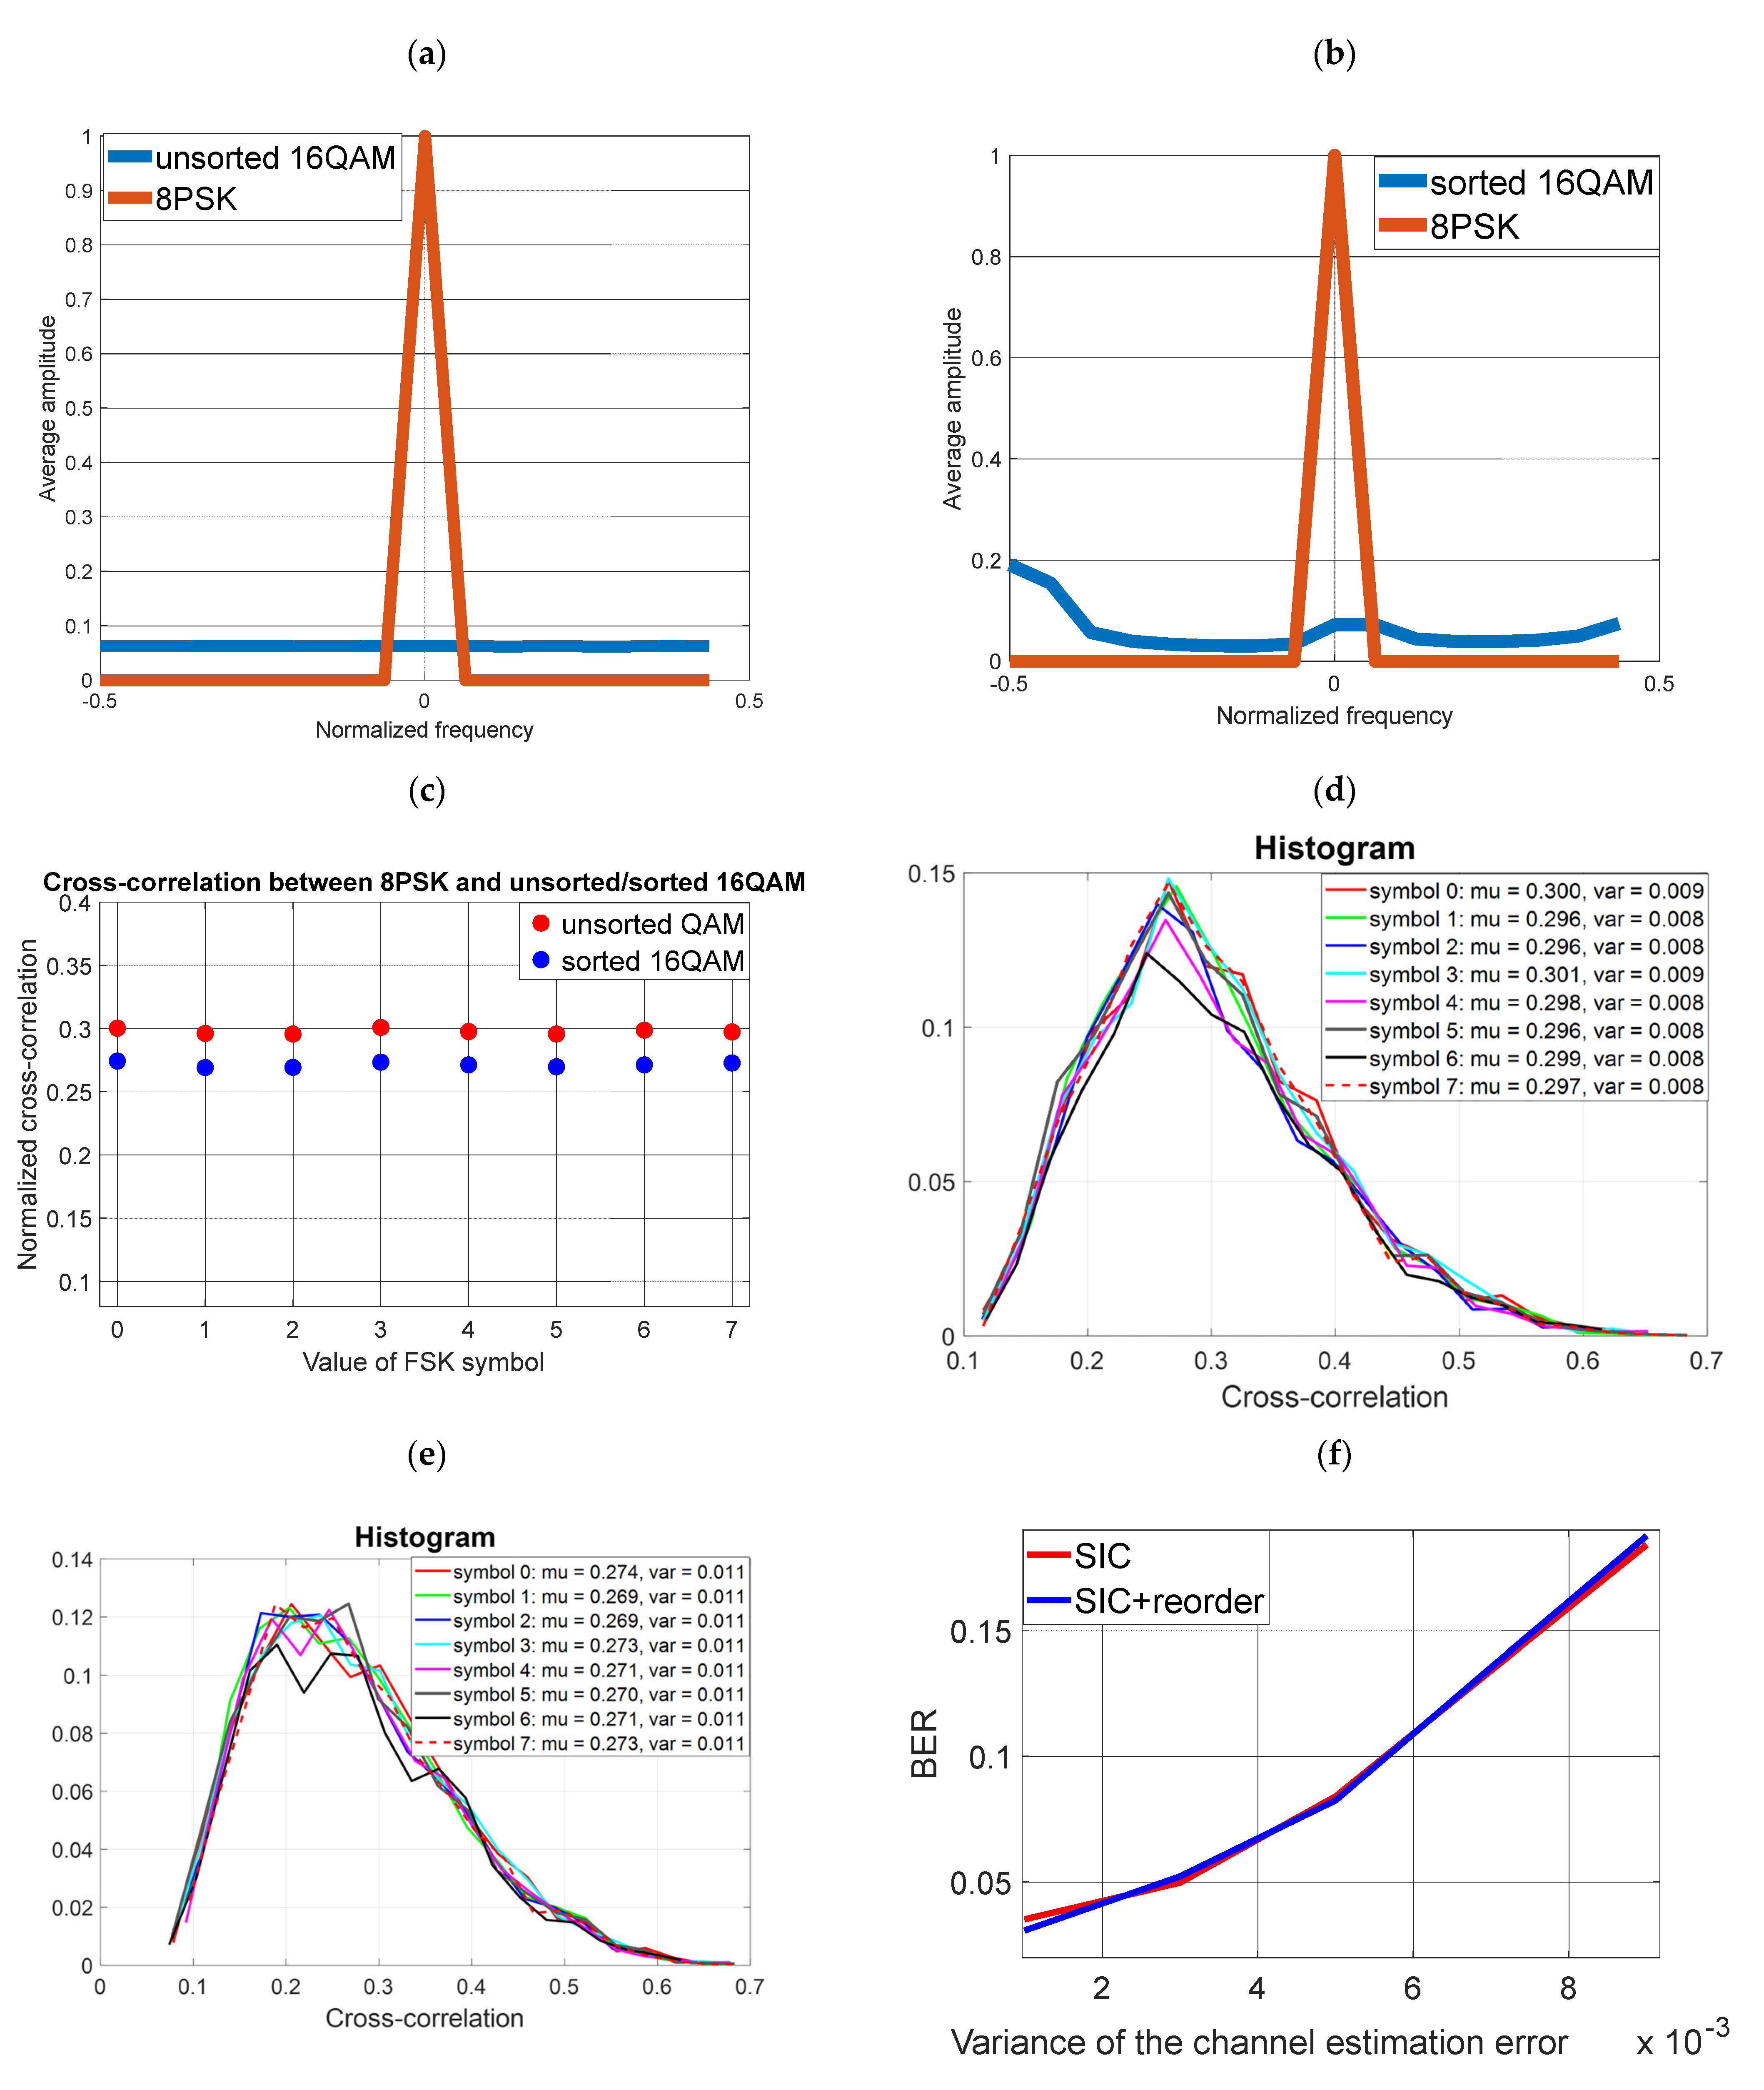
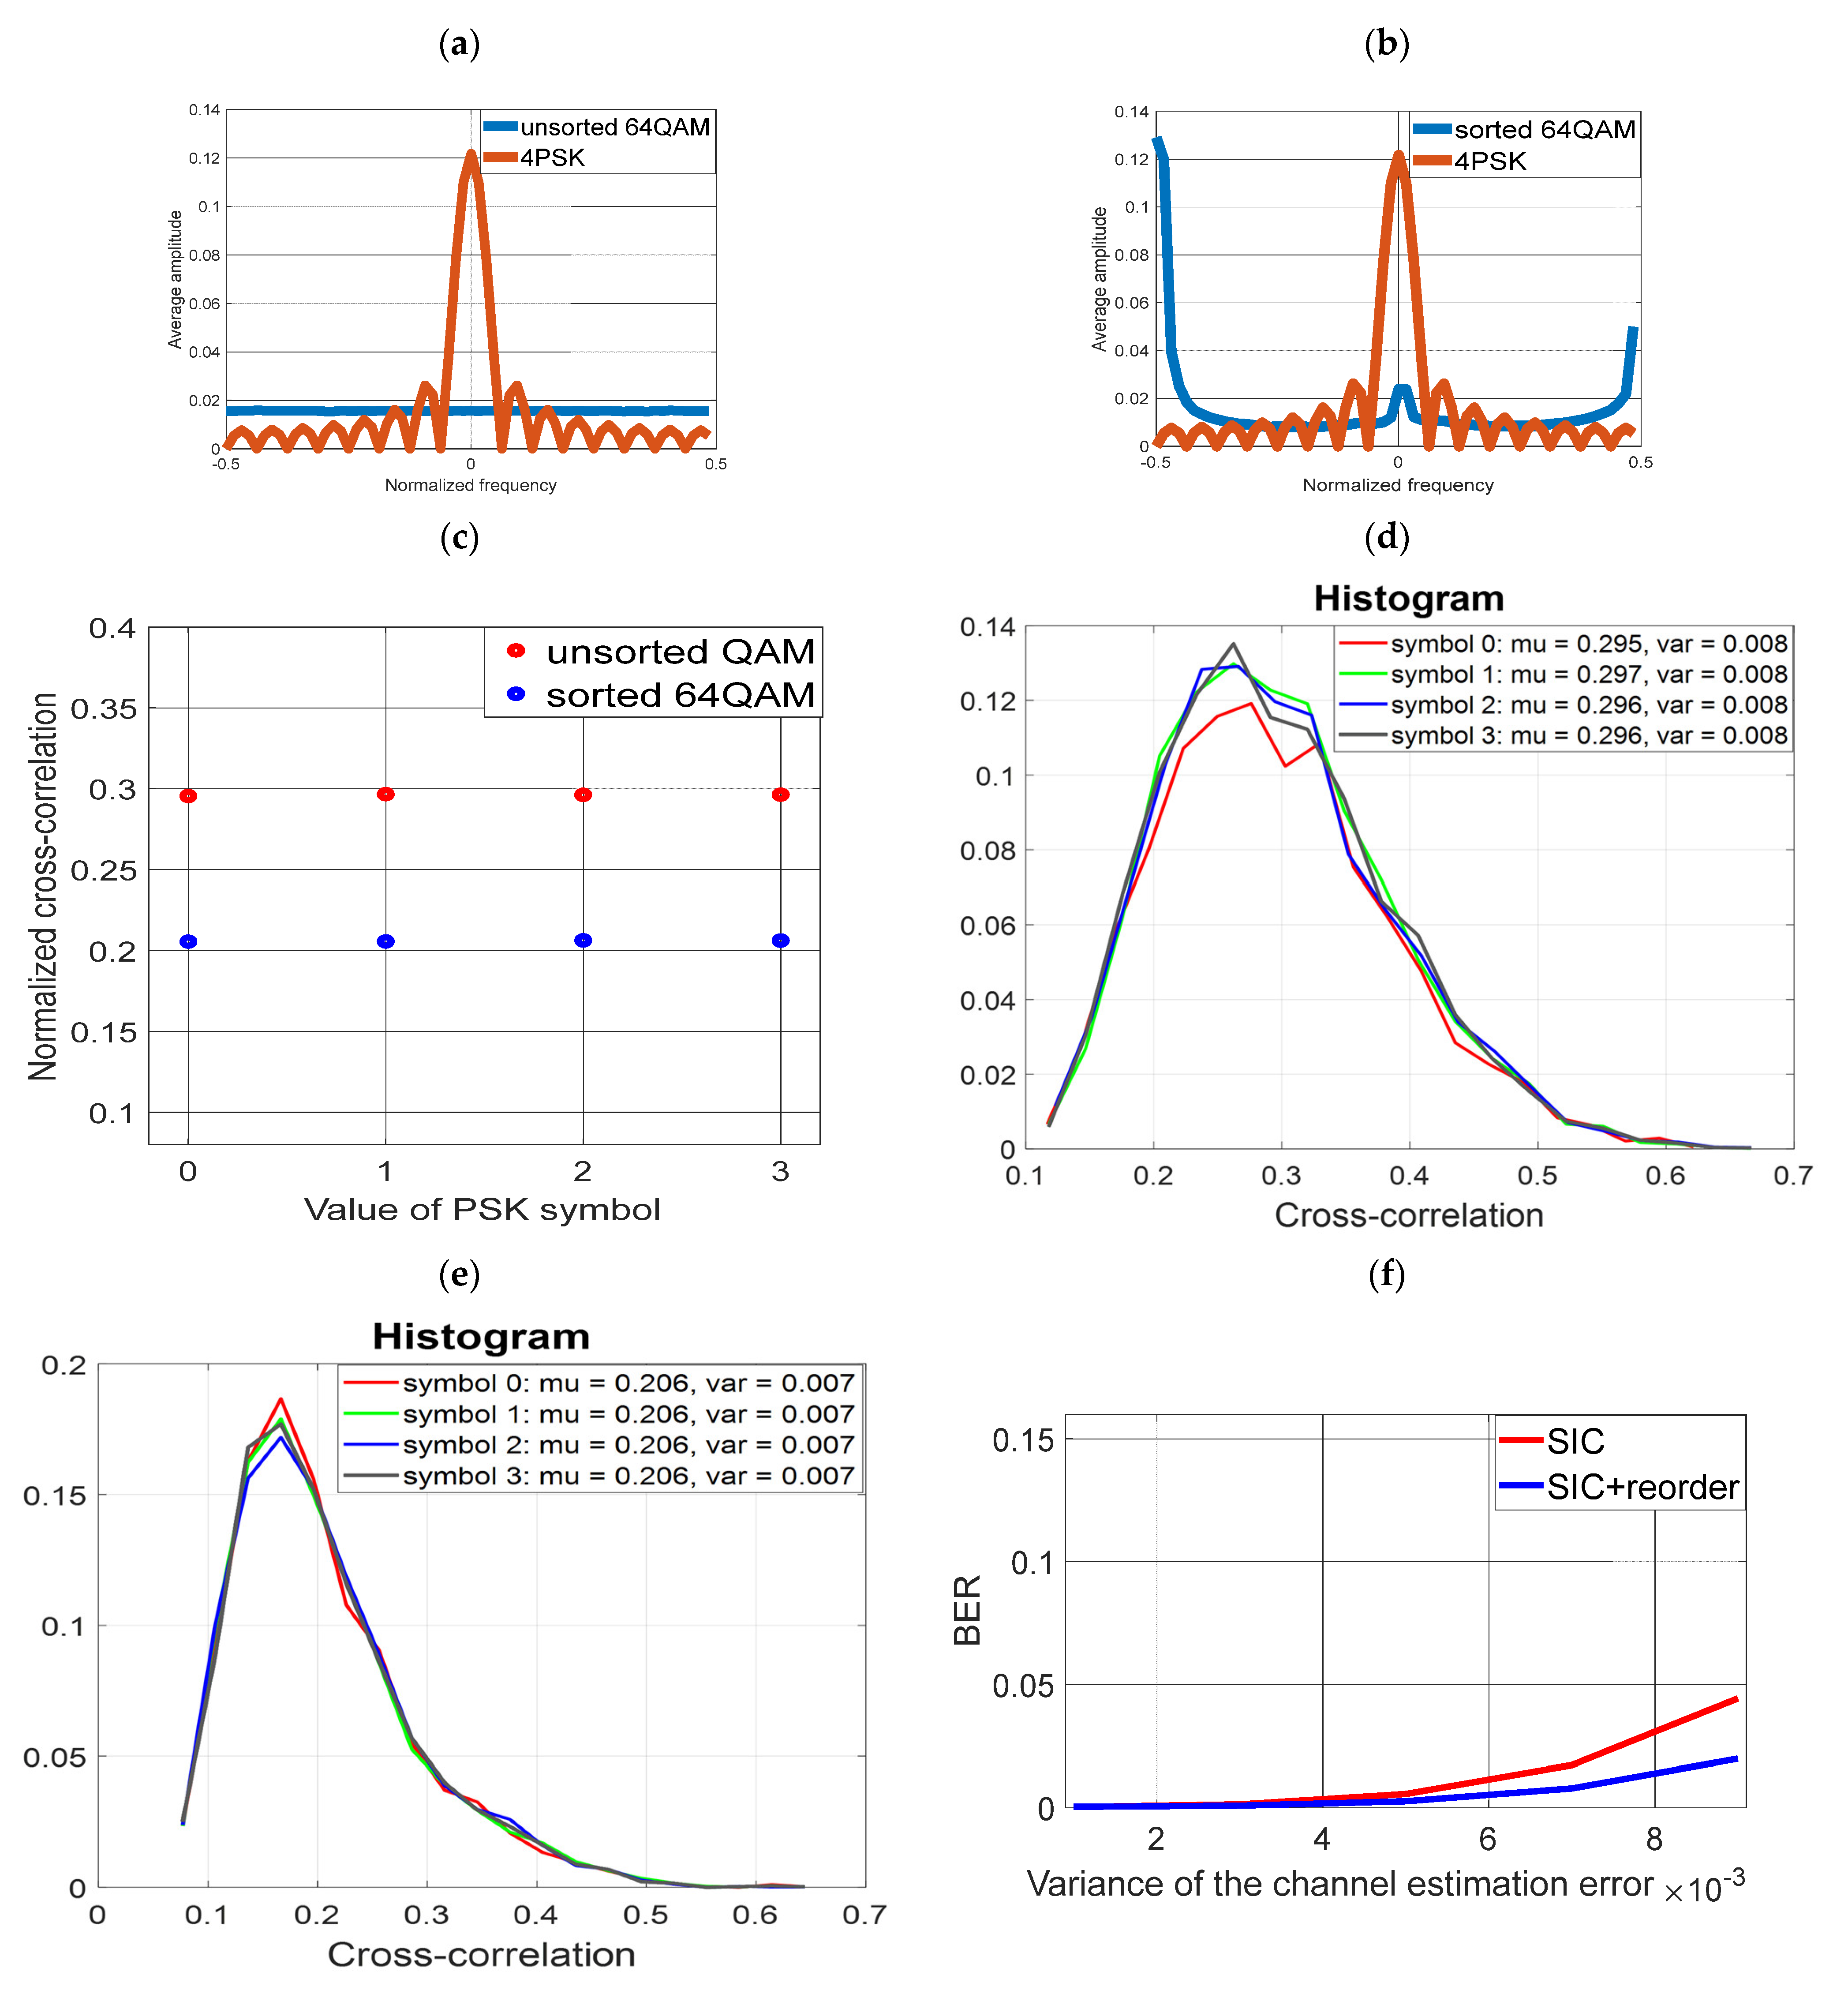
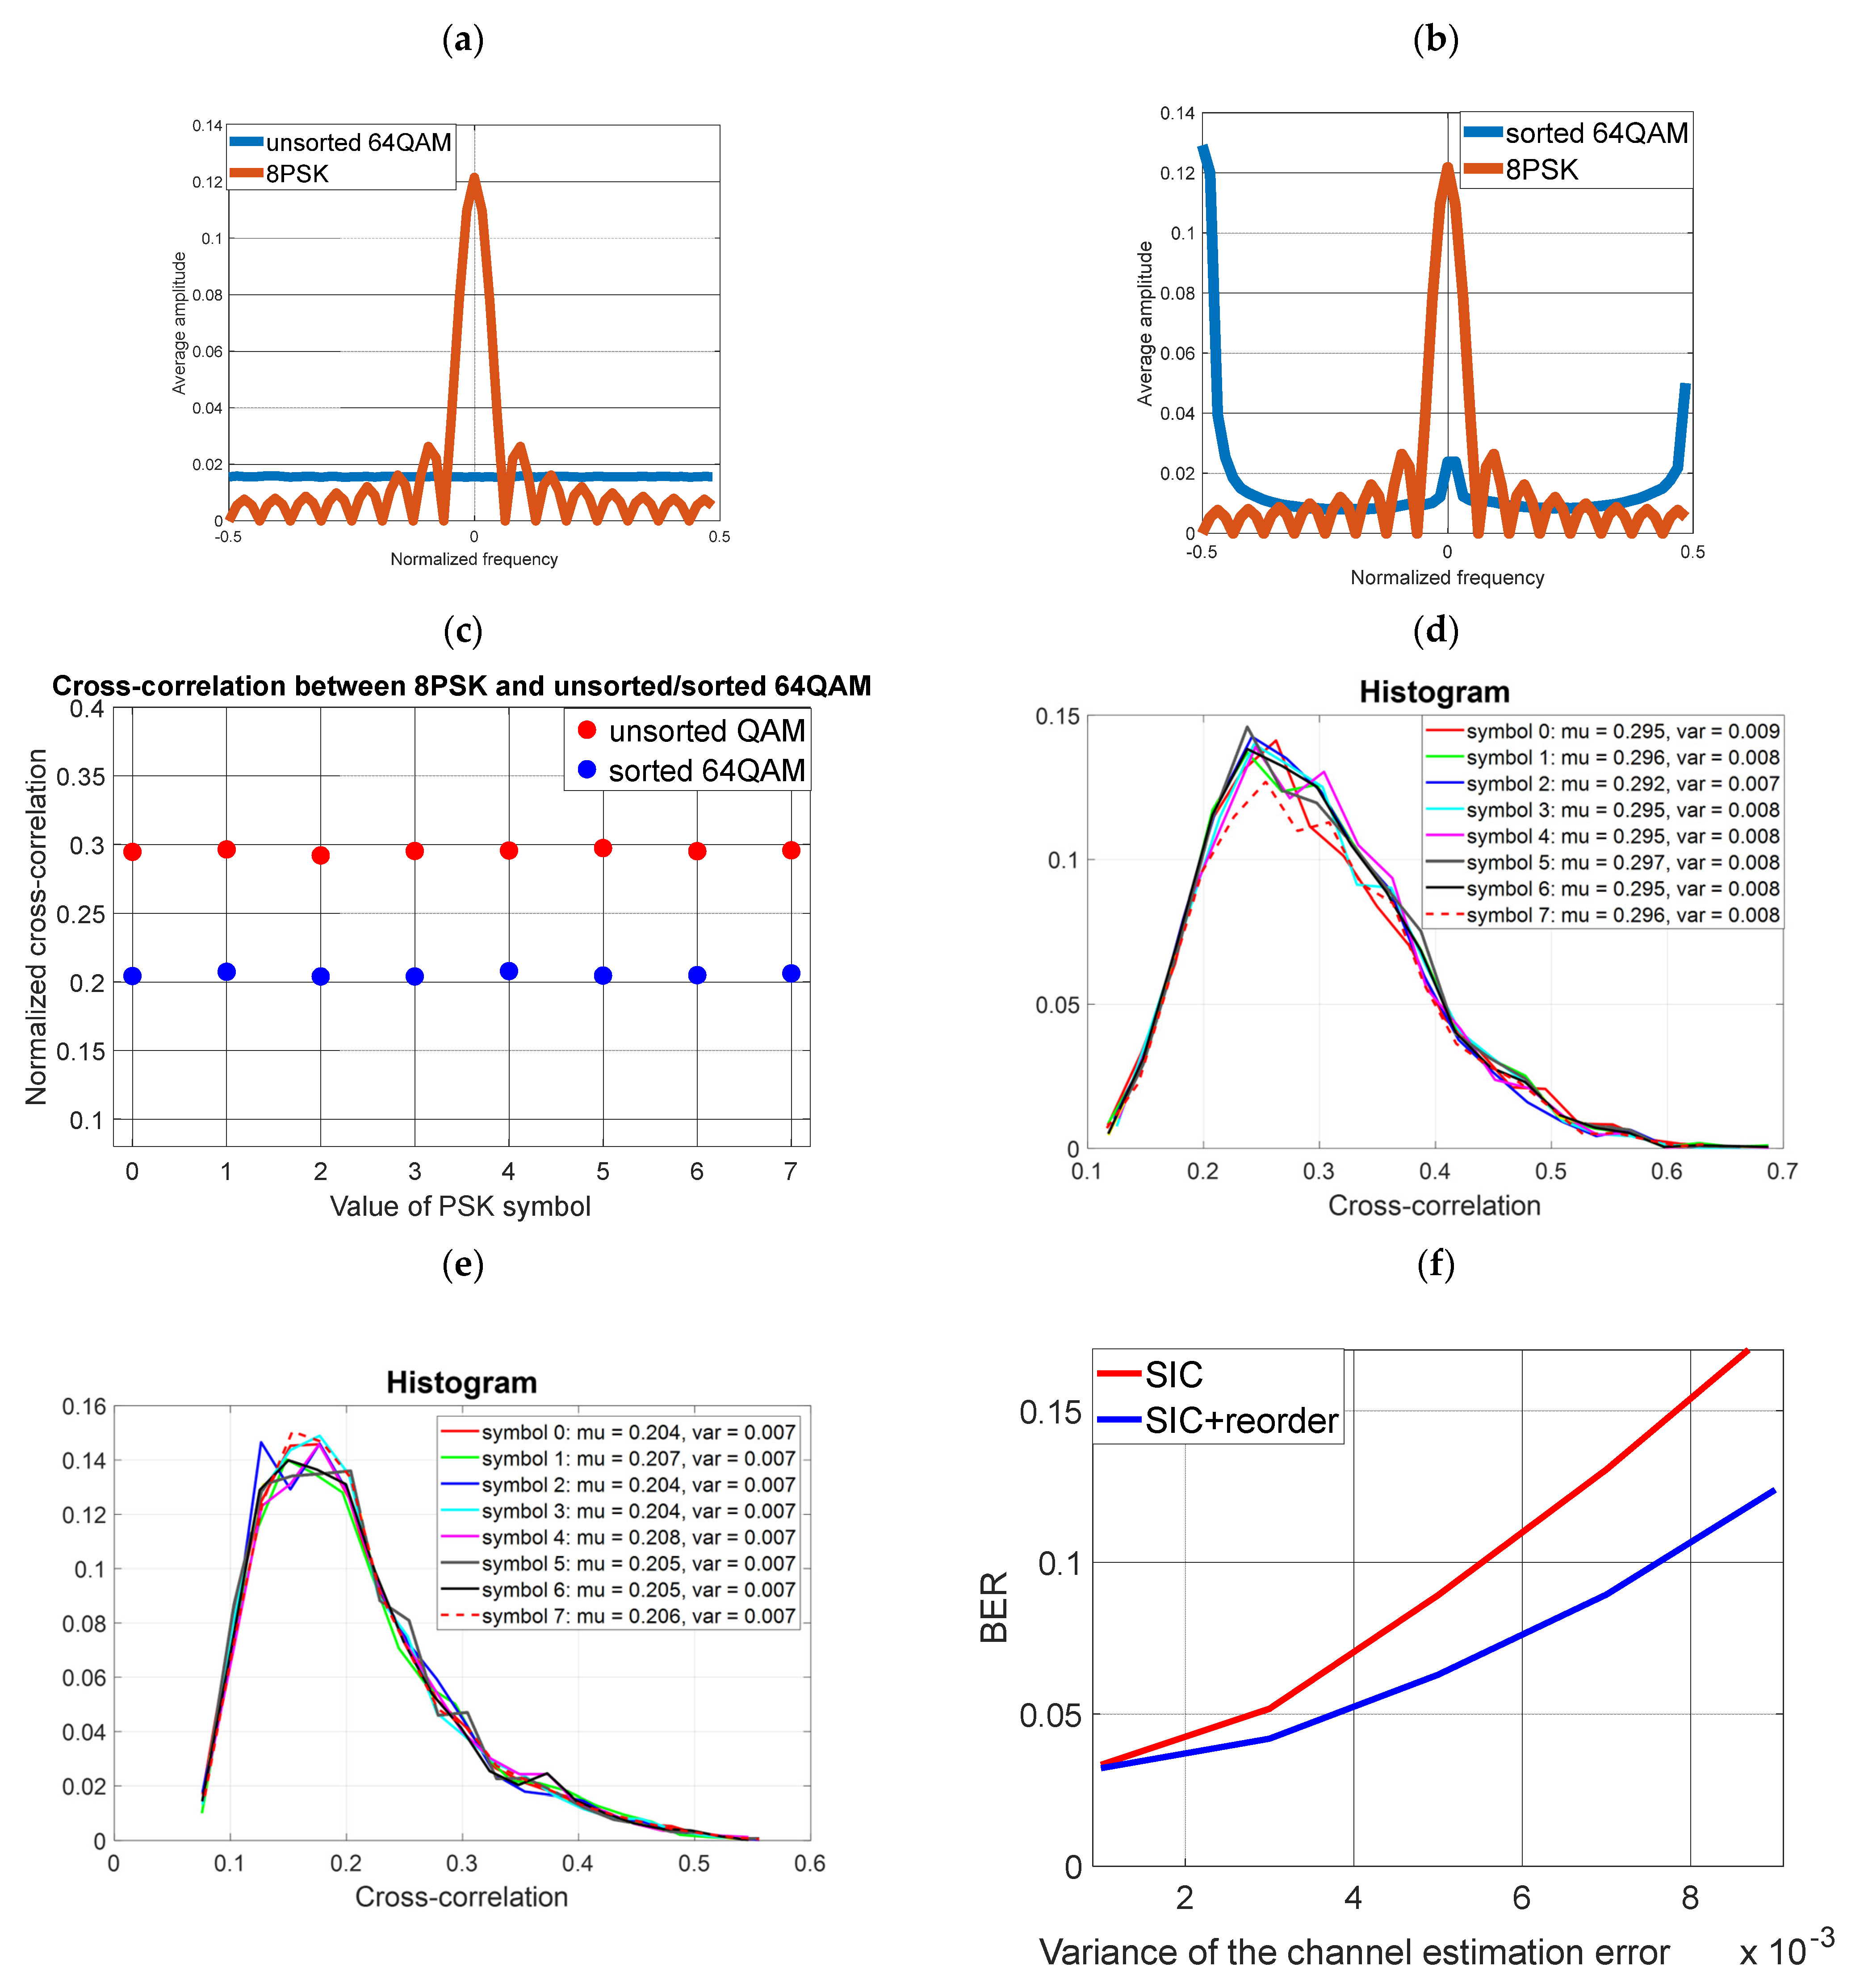
- (a)
- Averaged FFT spectrum of cover and covert signal (before and after sorting)
- (b)
- Averaged value and variance of cross-correlation of signals
- (c)
- Probability distribution of cross-correlation of signals estimated using histograms
4.1. Simulation No. 1
4.2. Simulation No. 2
4.3. Simulation No. 3
4.4. Simulation No. 4
4.5. Simulation No. 5
4.6. Simulation No. 6
4.7. Simulation No. 7
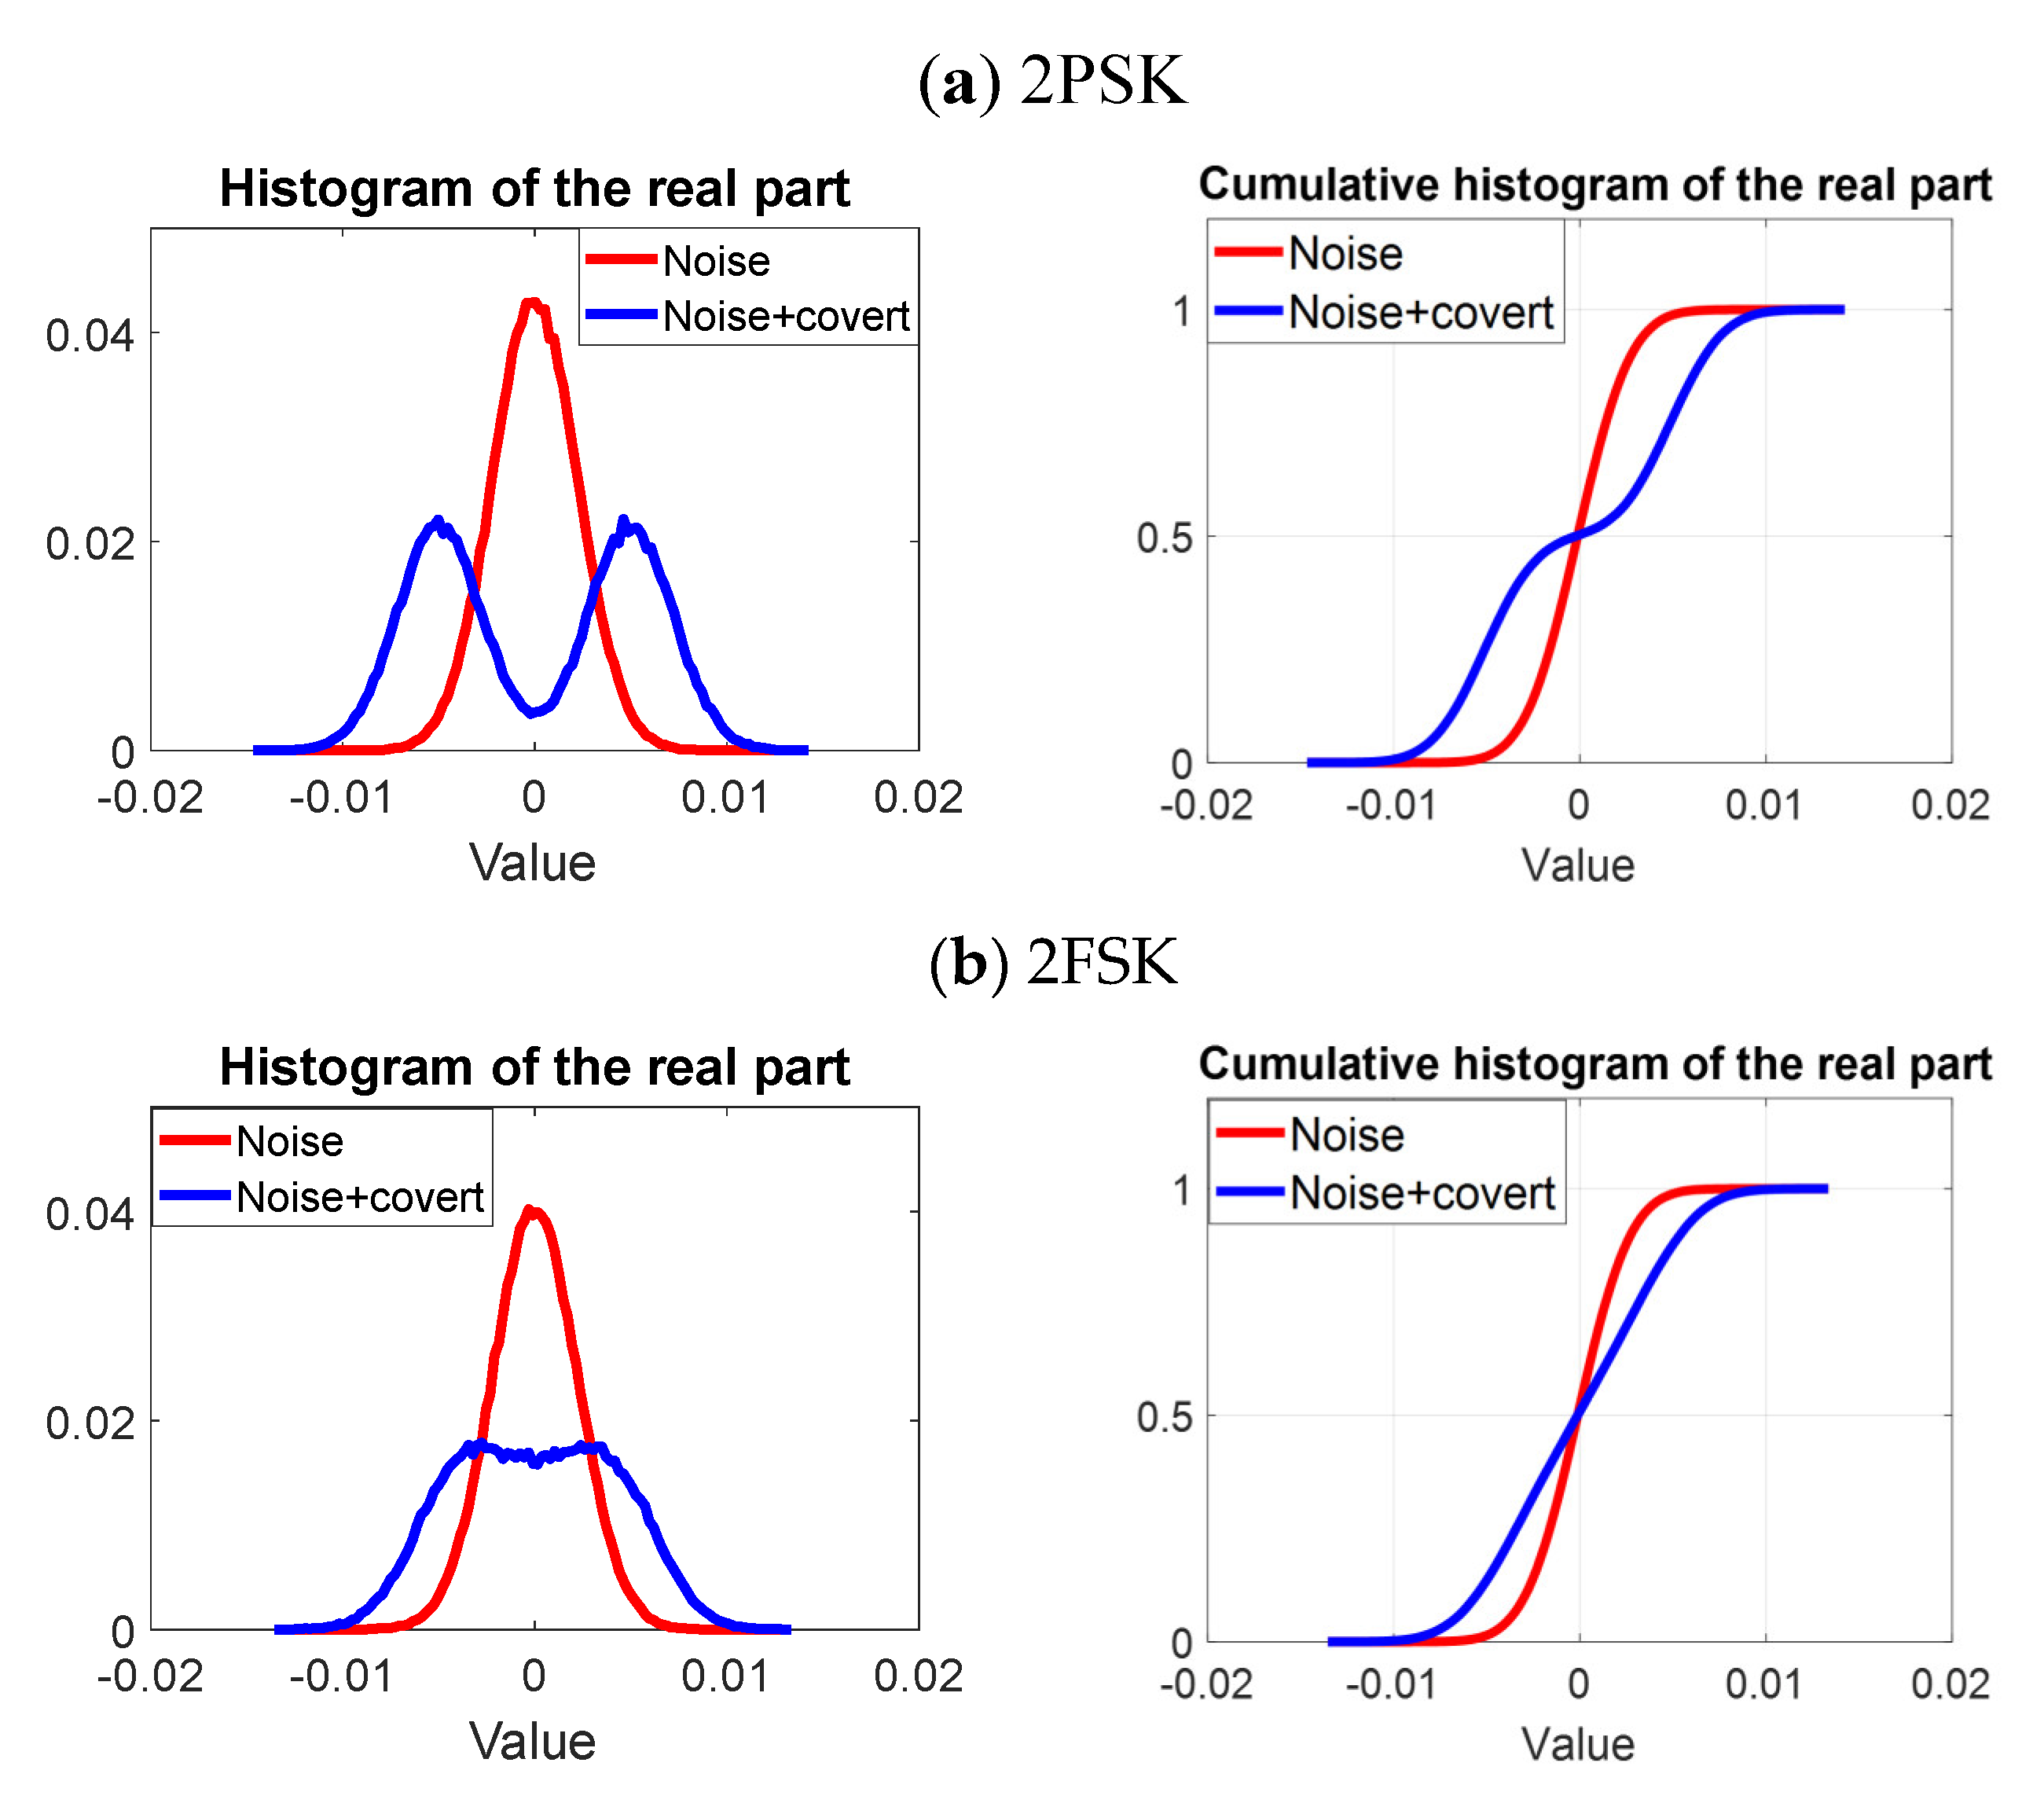
5. Steganographic Analysis
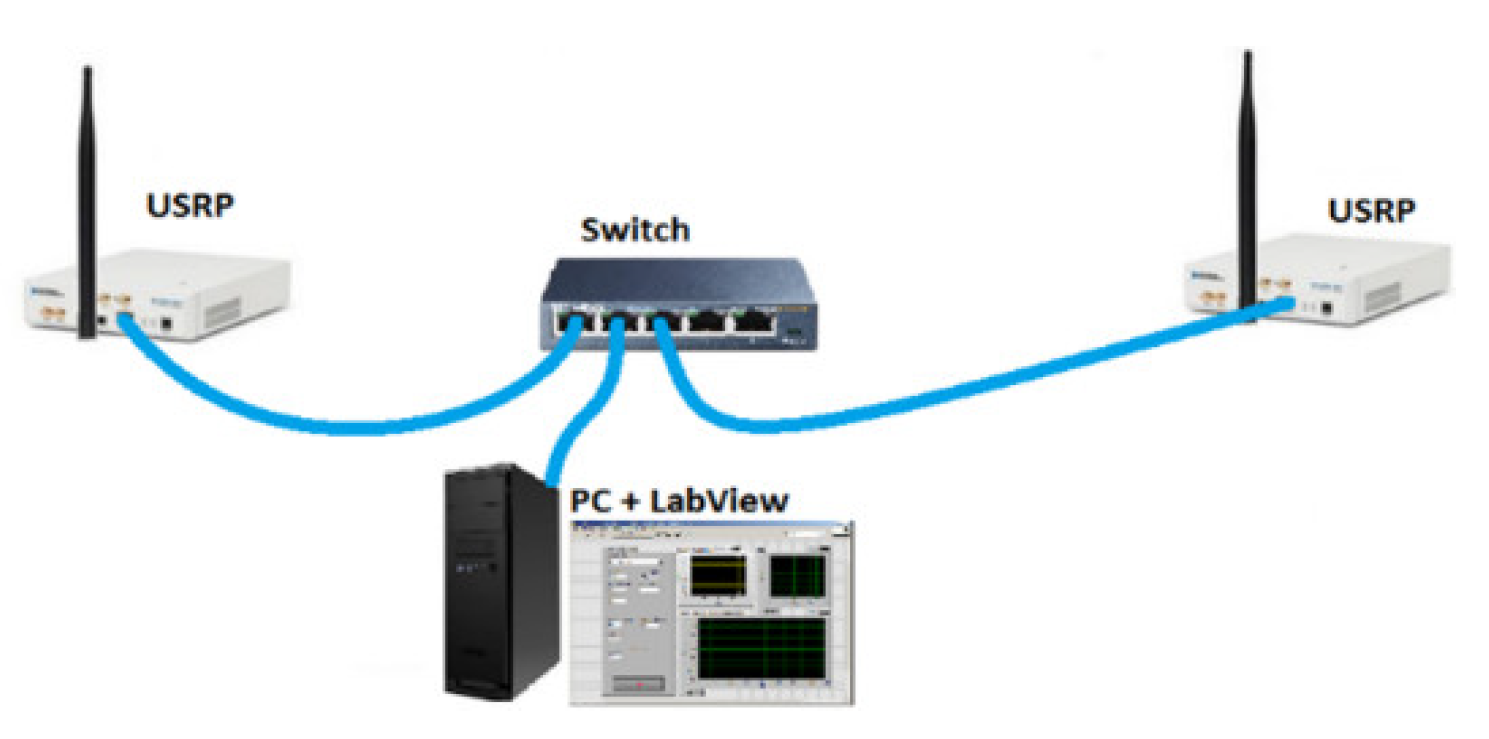
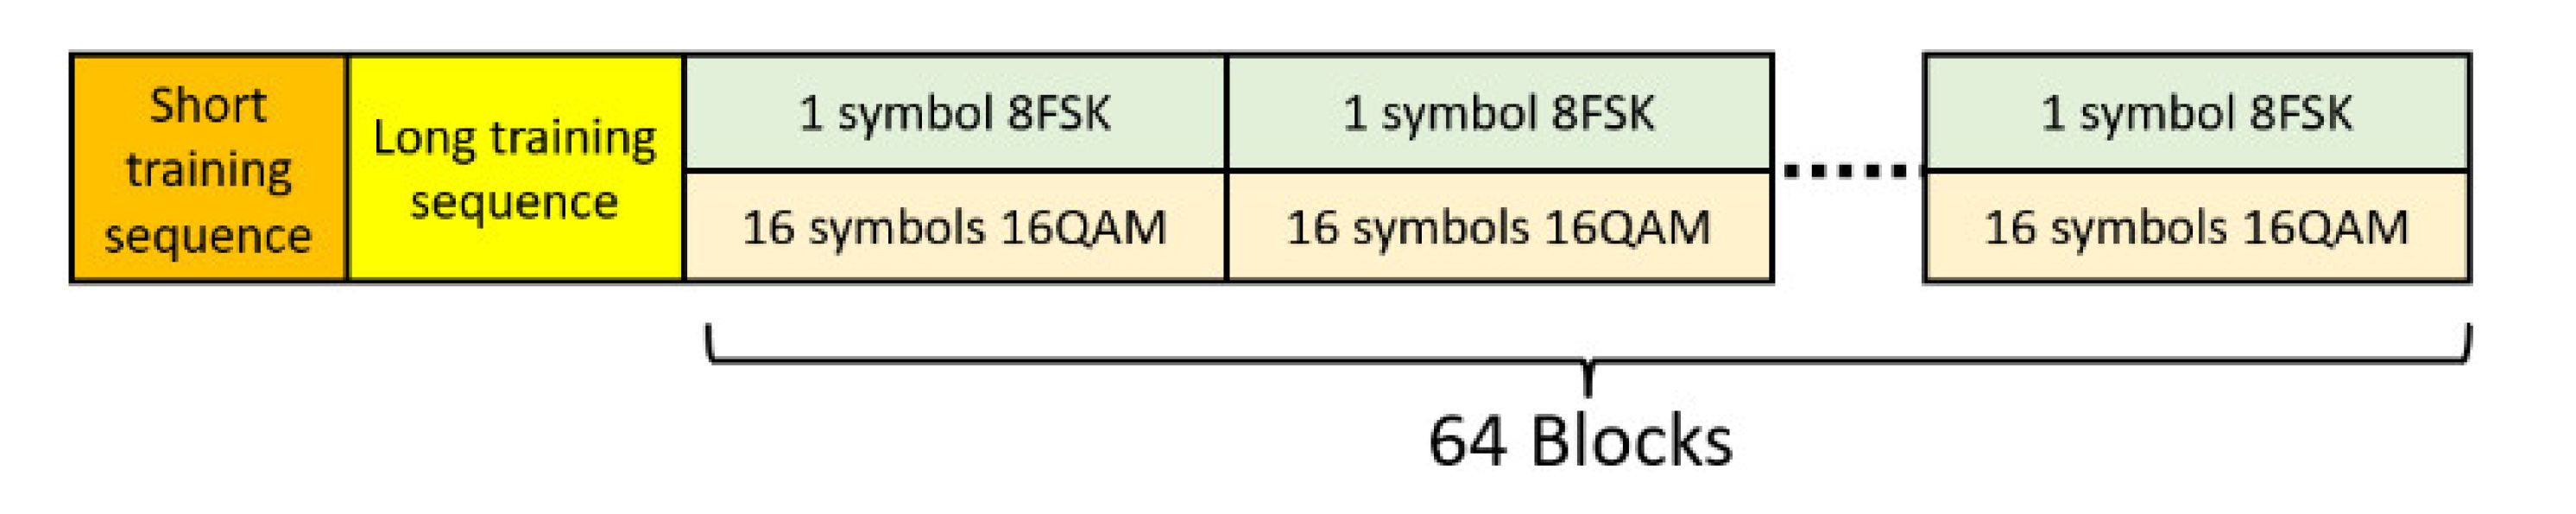
6. Practical Implementation
7. Summary
Author Contributions
Funding
Institutional Review Board Statement
Informed Consent Statement
Data Availability Statement
Acknowledgments
Conflicts of Interest
References
- Chen, O.; Meadows, C.; Trivedi, G. Stealthy Protocols: Metrics and Open Problems. In Concurrency, Security, and Puzzles. Lecture Notes in Computer Science; Gibson-Robinson, T., Hopcroft, P., Lazić, R., Eds.; Springer: Cham, Switzerland, 2017; Volume 10160. [Google Scholar] [CrossRef]
- Classen, J.; Schulz, M.; Hollick, M. Practical covert channels for wifi systems. In Proceedings of the 2015 IEEE Conference on Communications and Network Security (CNS), Florence, Italy, 28–30 September 2015; pp. 209–217. [Google Scholar]
- Dutta, A.; Saha, D.; Grunwald, D.; Sicker, D. Secret Agent Radio: Covert Communication through Dirty Constellations. In Information Hiding. IH 2012. Lecture Notes in Computer Science; Kirchner, M., Ghosal, D., Eds.; Springer: Berlin/Heidelberg, Germany, 2013; Volume 7692. [Google Scholar] [CrossRef]
- Grzesiak, K.; Piotrowski, Z.; Kelner, J.M. A Wireless Covert Channel Based on Dirty Constellation with Phase Drift. Electronics 2021, 10, 647. [Google Scholar] [CrossRef]
- Piotrowski, Z. Drift Correction Modulation Scheme for Digital Signal Processing. Math. Comput. Model. 2013, 57, 2660–2670. [Google Scholar] [CrossRef]
- Grzesiak, K.; Piotrowski, Z. NN-Based 8FSK Demodulator for the Covert Channel. Sensors 2022, 22, 7181. [Google Scholar] [CrossRef] [PubMed]
- D’Oro, S.; Restuccia, F.; Melodia, T. Hiding Data in Plain Sight: Undetectable Wireless Communications Through Pseudo-Noise Asymmetric Shift Keying. In Proceedings of the IEEE INFOCOM 2019–IEEE Conference on Computer Communications, Paris, France, 29 April–2 May 2019; pp. 1585–1593. [Google Scholar]
- Bonati, L.; D’Oro, S.; Restuccia, F.; Basagni, S.; Melodia, T. SteaLTE: Private 5G cellular connectivity as a service with full- stack wireless steganography. In Proceedings of the IEEE INFOCOM, Vancouver, BC, Canada, 10–13 May 2021. [Google Scholar]
- Qiao, S.; Liu, G.; Shi, J.; Ji, X.; Liu, W. Wireless Covert Channel with Polarized Dirty Constellation in Backscatter Communication. Res. Square 2021. [Google Scholar] [CrossRef]
- Cao, P.; Liu, W.; Liu, G.; Ji, X.; Zhai, J.; Dai, Y. A Wireless Covert Channel Based on Constellation Shaping Modulation. Secur. Commun. Netw. 2018, 2018, 1214681. [Google Scholar] [CrossRef]
- Oyerinde, O.O.; Mneney, S.H. Review of channel estimation for wireless communication systems. IETE Tech. Rev. 2012, 29, 282–298. [Google Scholar] [CrossRef]
- Yue, X.; Liu, Y.; Kang, S.; Nallanathan, A.; Chen, Y. Modeling and Analysis of Two-Way Relay Non-Orthogonal Multiple Access Systems. IEEE Trans. Commun. 2018, 66, 3784–3796. [Google Scholar] [CrossRef]
- Do, D.T.; Nguyen, T.T.T. Impacts of imperfect SIC and imperfect hardware in performance analysis on AF non-orthogonal multiple access network. Telecommun. Syst. 2019, 72, 579–593. [Google Scholar] [CrossRef]
- Yue, X.; Qin, Z.; Liu, Y.; Dai, X.; Chen, Y. Outage Performance of a Unified Non-Orthogonal Multiple Access Framework. In Proceedings of the 2018 IEEE International Conference on Communications (ICC), Kansas City, MO, USA, 20–24 May 2018; pp. 1–6. [Google Scholar] [CrossRef]
- Kara, F.; Kaya, H. BER performances of downlink and uplink NOMA in the presence of SIC errors over fading channels. IET Commun. 2018, 12, 1834–1844. [Google Scholar] [CrossRef]
- Grzesiak, K.; Piotrowski, Z. From Constellation Dithering to NOMA Multiple Access: Security in Wireless Systems. Sensors 2021, 21, 2752. [Google Scholar] [CrossRef] [PubMed]
- Ikki, S.; Aissa, S. Two-way amplify-and-forward relaying with Gaussian imperfect channel estimations. IEEE Commun. Lett. 2012, 16, 956–959. [Google Scholar] [CrossRef]
- Wang, C.; Liu, T.-K.; Dong, X. Impact of channel estimation error on the performance of amplify-and-forward two-way relaying. IEEE Trans. Veh. Technol. 2012, 61, 1197–1207. [Google Scholar] [CrossRef]
- Ma, Y.; Jin, J. Effect of channel estimation errors on M-QAM with MRC and EGC in Nakagami fading channels. IEEE Trans. Veh. Technol. 2007, 56, 1239–1250. [Google Scholar] [CrossRef]
- Yang, Z.; Ding, Z.; Fan, P.; Karagiannidis, G.K. On the Performance of Non orthogonal Multiple Access Systems with Partial Channel Information. IEEE Trans. Commun. 2016, 64, 654–667. [Google Scholar] [CrossRef]
- Keel, B.M.; Baden, J.M.; Heath, T.H. A Comprehensive Review of Quasi-Orthogonal Waveforms. In Proceedings of the 2007 IEEE Radar Conference, Waltham, MA, USA, 17–20 April 2007; pp. 122–127. [Google Scholar] [CrossRef]
- Strinati, E.C.; Simoens, S.; Boutros, J. New error prediction techniques for turbo-coded OFDM systems and impact on adaptive modulation and coding. In Proceedings of the 2005 IEEE 16th International Symposium on Personal, Indoor and Mobile Radio Communications, Berlin, Germany, 11–14 September 2005; Volume 2, pp. 1116–1119. [Google Scholar] [CrossRef]
- Desset, C.; Ahmed, N.; Dejonghe, A. Energy Savings for Wireless Terminals through Smart Vertical Handover. In Proceedings of the 2009 IEEE International Conference on Communications, Dresden, Germany, 14–18 June 2009; pp. 1–5. [Google Scholar] [CrossRef]
- Hamed, E. Practical distributed MIMO for WiFi and LTE. Doctoral Dissertation, Massachusetts Institute of Technology, Cambridge, MA, USA, 2018. [Google Scholar]
- Bob, W. FSK: Signals and Demodulation; Watkins-Johnson Company Technotes 7.5: Palo Alto, CA, USA, 1980. [Google Scholar]
- Boonrungruedee, T.; Khumsat, P. 27-MHz FSK Wireless System Resilient to In-band Interference for IoT Applications. In Proceedings of the 2021 18th International Conference on Electrical Engineering/Electronics, Computer, Telecommunications and Information Technology (ECTI-CON), Phuket, Thailand, 24–27 June 2020; pp. 692–695. [Google Scholar] [CrossRef]
- Saadeh, W.; Altaf, M.A.B.; Alsuradi, H.; Yoo, J. A Pseudo OFDM With Miniaturized FSK Demodulation Body-Coupled Communication Transceiver for Binaural Hearing Aids in 65 nm CMOS. IEEE J. Solid-State Circuits 2017, 52, 757–768. [Google Scholar] [CrossRef]
- Shang, Z.; Zhao, Y.; Lian, Y. A Low Power Frequency Tunable FSK Receiver Based on the N-Path Filter. IEEE Trans. Circuits Syst. II Express Briefs 2019, 66, 1708–1712. [Google Scholar] [CrossRef]
- Chiu, C.Y.; Zhang, Z.C.; Lin, T.H. Design of a 0.6-V 429-MHz FSK Transceiver Using Q-Enhanced and Direct Power Transfer Techniques in 90-nm CMOS. IEEE J. Solid-State Circuits 2020, 55, 3024–3035. [Google Scholar] [CrossRef]
- Park, D.; Ahn, J.; Choe, C.; Woo, S.; Ahn, S.; Choi, J. A Noise-Shaped Signaling Method for Vehicle-to-Everything Security. IEEE Access 2021, 9, 75385–75397. [Google Scholar] [CrossRef]
- Choi, J.; Park, D.; Kim, S.; Ahn, S. Implementation of a Noise-Shaped Signaling System through Software-Defined Radio. Appl. Sci. 2022, 12, 641. [Google Scholar] [CrossRef]
- Xu, Z.; Jin, W.; Zhou, K.; Hua, J. A Covert Digital Communication System Using Skewed α-Stable Distributions for Internet of Things. IEEE Access 2020, 8, 113131–113141. [Google Scholar] [CrossRef]
- Ahmaderaghi, B.; Kurugollu, F.; Rincon, J.M.D.; Bouridane, A. Blind Image Watermark Detection Algorithm Based on Discrete Shearlet Transform Using Statistical Decision Theory. IEEE Trans. Comput. Imaging 2018, 4, 46–59. [Google Scholar] [CrossRef]
- 20 MHz Bandwidth, 50 MHz to 2.2 GHz USRP Software Defined Radio Device. Available online: https://www.ni.com/pl-pl/support/model.usrp-2920.html (accessed on 5 January 2023).
- IEEE. 802.11a-1999. IEEE Standard for Telecommunications and Information Exchange Between Systems—LAN/MAN Specific Requirements—Part 11: Wireless Medium Access Control (MAC) and physical layer (PHY) specifications: High Speed Physical Layer in the 5 GHz band. 1999. Available online: https://pdos.csail.mit.edu/archive/decouto/papers/802.11a.pdf (accessed on 10 May 2023).


| Covert Modulation | ||
|---|---|---|
| SNR = 45 dB | SNR = 50 dB | |
| 2PSK | 0.153 | 0.321 |
| 4PSK | 0.087 | 0.214 |
| 8PSK | 0.082 | 0.188 |
| 2FSK | 0.081 | 0.186 |
| 4FSK | 0.081 | 0.186 |
| 8FSK | 0.080 | 0.185 |
| Carrier Frequency | 850 MHz | |
|---|---|---|
| Cover (carrier) | Modulation | 16QAM |
| Bandwidth | 8 MHz | |
| Transmission rate | 32 Mb/s | |
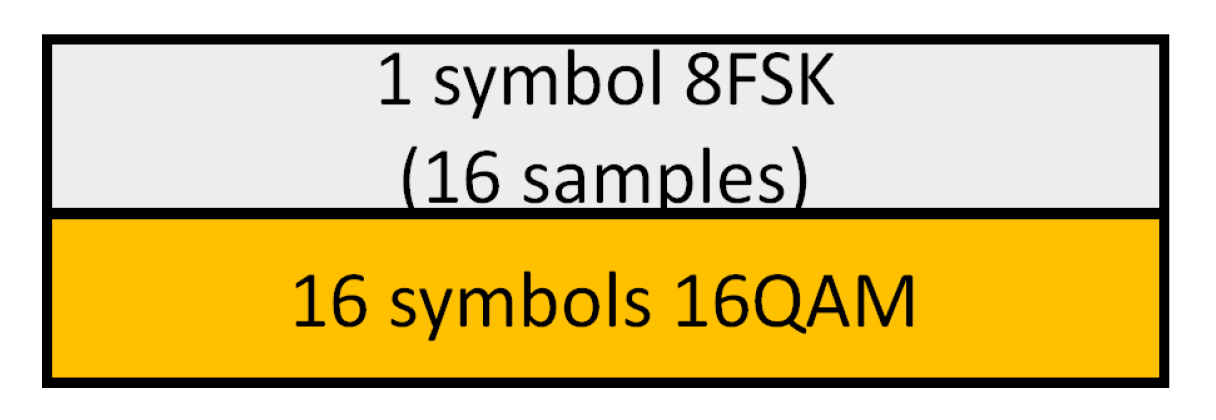
| Block length | 16 | |
| Power | ||
| Covert information | Modulation | 8FSK |
| Number samples per symbol | ||
| Number symbols in block | 1 | |
| Transmission rate | 1.5 Mb/s | |
| Power |
Disclaimer/Publisher’s Note: The statements, opinions and data contained in all publications are solely those of the individual author(s) and contributor(s) and not of MDPI and/or the editor(s). MDPI and/or the editor(s) disclaim responsibility for any injury to people or property resulting from any ideas, methods, instructions or products referred to in the content. |
© 2023 by the authors. Licensee MDPI, Basel, Switzerland. This article is an open access article distributed under the terms and conditions of the Creative Commons Attribution (CC BY) license (https://creativecommons.org/licenses/by/4.0/).
Share and Cite
Grzesiak, K.; Piotrowski, Z.; Kelner, J.M. Covert Channel Based on Quasi-Orthogonal Coding. Electronics 2023, 12, 2249. https://doi.org/10.3390/electronics12102249
Grzesiak K, Piotrowski Z, Kelner JM. Covert Channel Based on Quasi-Orthogonal Coding. Electronics. 2023; 12(10):2249. https://doi.org/10.3390/electronics12102249
Chicago/Turabian StyleGrzesiak, Krystian, Zbigniew Piotrowski, and Jan M. Kelner. 2023. "Covert Channel Based on Quasi-Orthogonal Coding" Electronics 12, no. 10: 2249. https://doi.org/10.3390/electronics12102249
APA StyleGrzesiak, K., Piotrowski, Z., & Kelner, J. M. (2023). Covert Channel Based on Quasi-Orthogonal Coding. Electronics, 12(10), 2249. https://doi.org/10.3390/electronics12102249