


Linear Voltage Stability Indicator (LVSI) for Optimal Placement of SVC Devices to Improve the Voltage Stability Margin in Transmission Systems


Abstract
1. Introduction
2. Materials and Methods
[∆Q] = [JQθ JQV]
| Algorithm 1. Procedure for the creation of VCAs | |
| 1 | Enter OPF parameters |
| 2 | Determine OPF |
| 3 | Quantify Jacobian array |
| 4 | Extract matrix JQV |
| 5 | Invert array JQV |
| 6 | Obtain the sensitivity set |
| 7 | Estimate the array of attenuations
|
| 8 | Collect the matrix of electrical distances
|
| 9 | Normalize the electrical distances Dij |
| Algorithm 2. Identification of VCAs | |
| 1 | Enter electrical distances Dij determined using Algorithm 1 |
| 2 | Arbitrarily choose k initial cluster centers |
| 3 | Distribute the samples {X} among the k domains Do for all r until k |
| 4 | Calculate the new cluster centers Zj (r + 1) Do for all j until k |
| 5 | Verify convergence Do for all until If Zj (r + 1) = Zj (r) Algorithm converges Print VCA Otherwise Return to Step 2 |
| Algorithm 3. Calculation of LVSI index | |
| 1 | Compute OPF |
| 2 | Obtain the equivalent sum of the load and the generation |
| 3 | Determine the equivalent impedance and the angle |
| 4 | Quantify , y |
| 5 | Determine the LVSI |
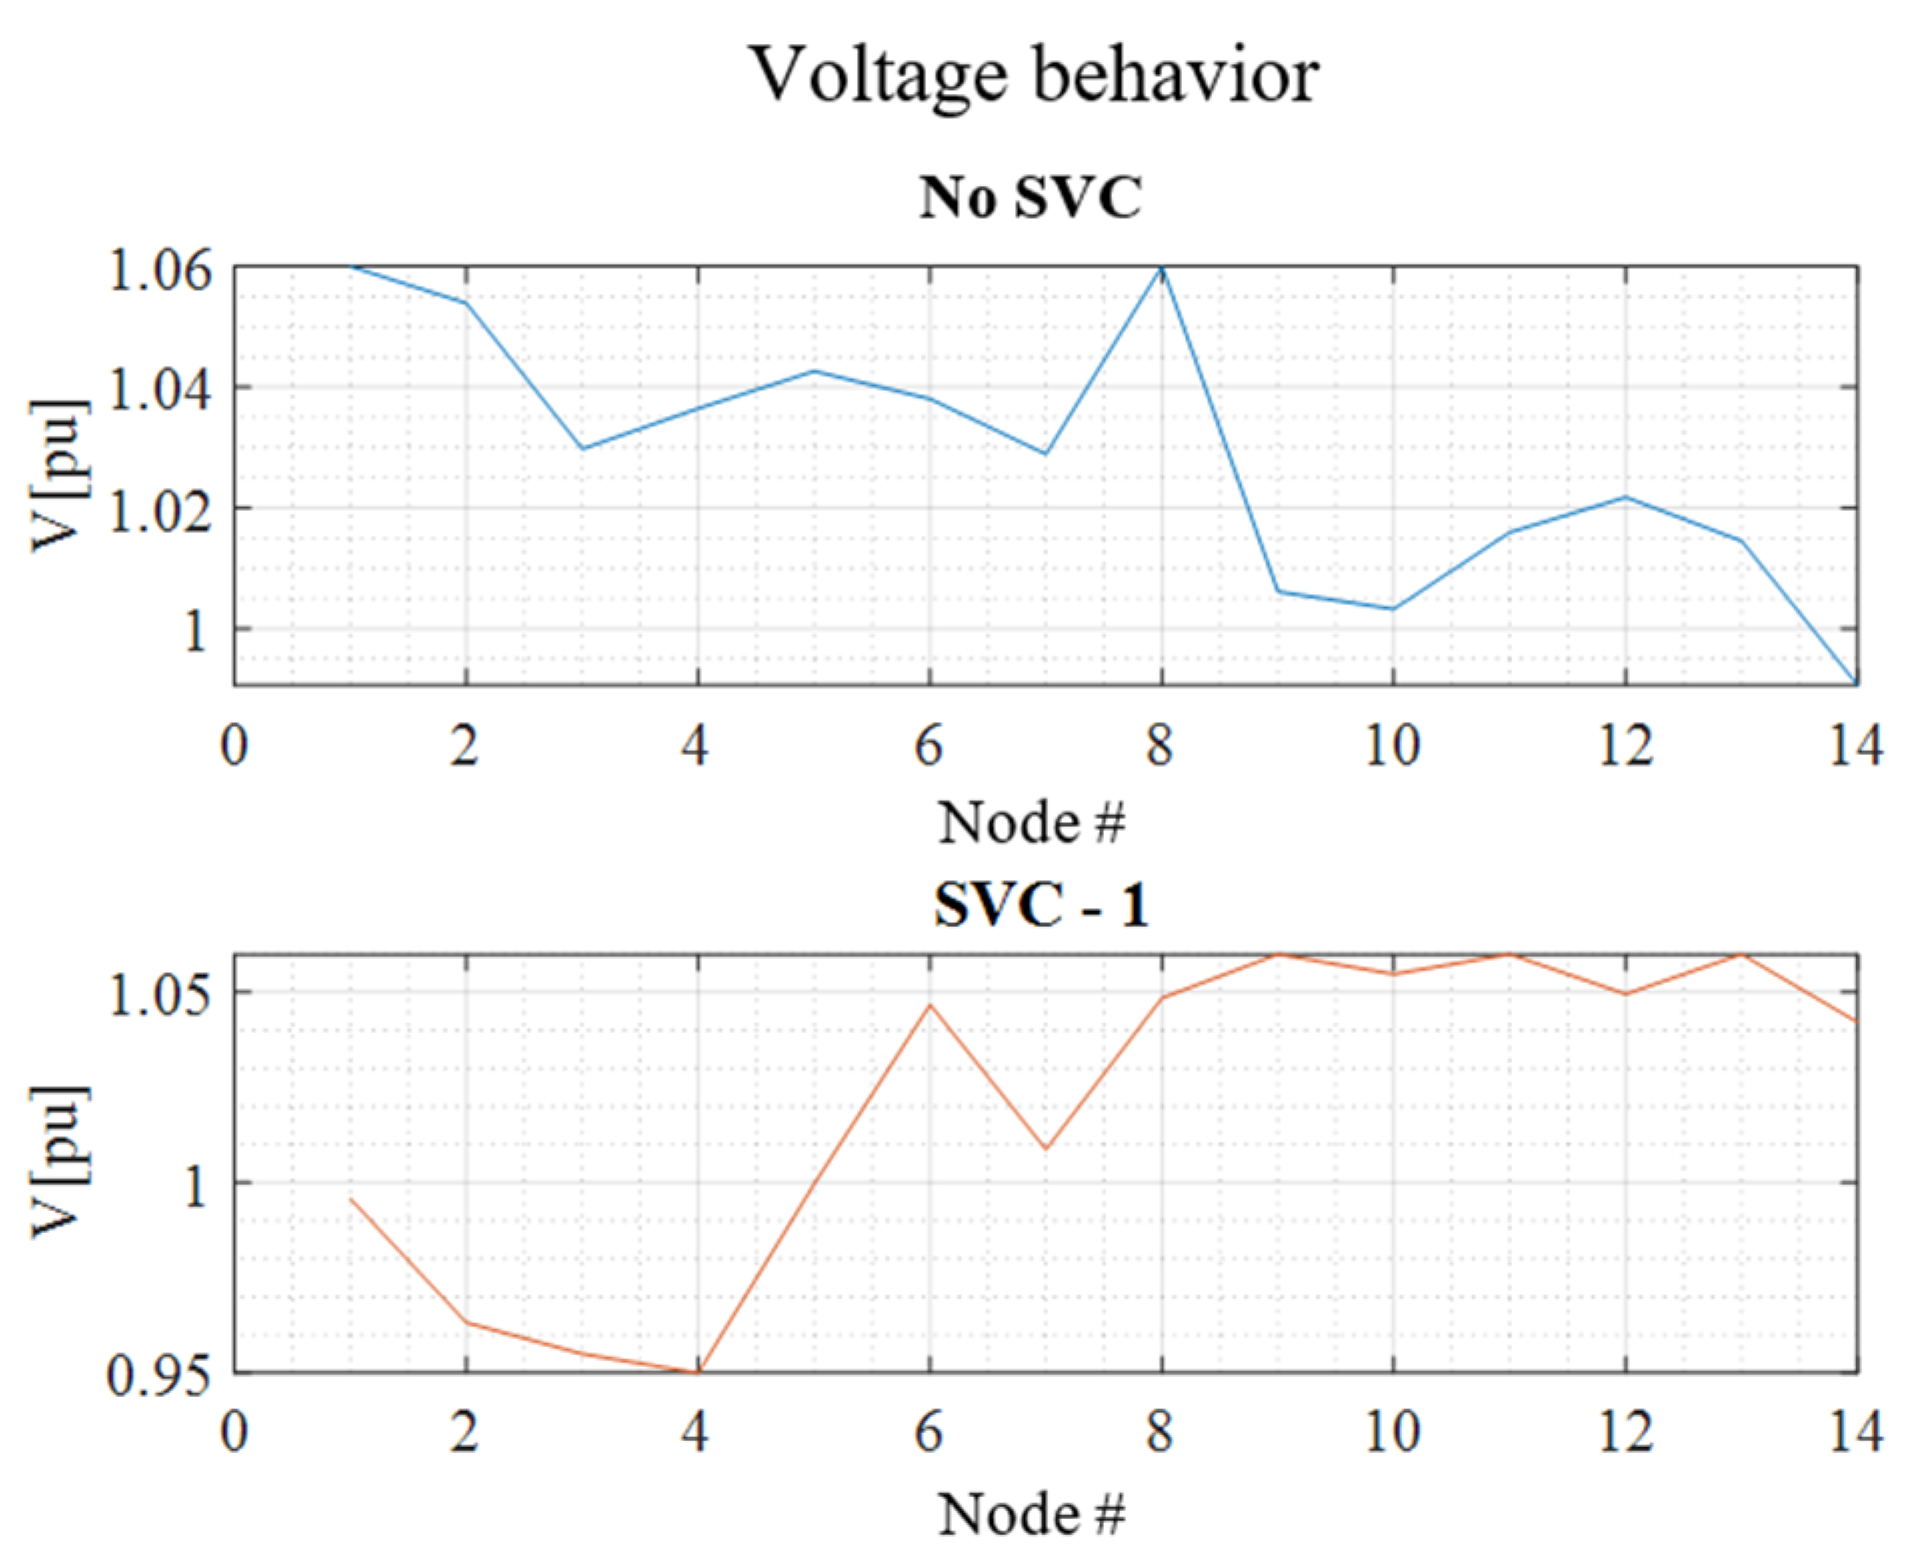
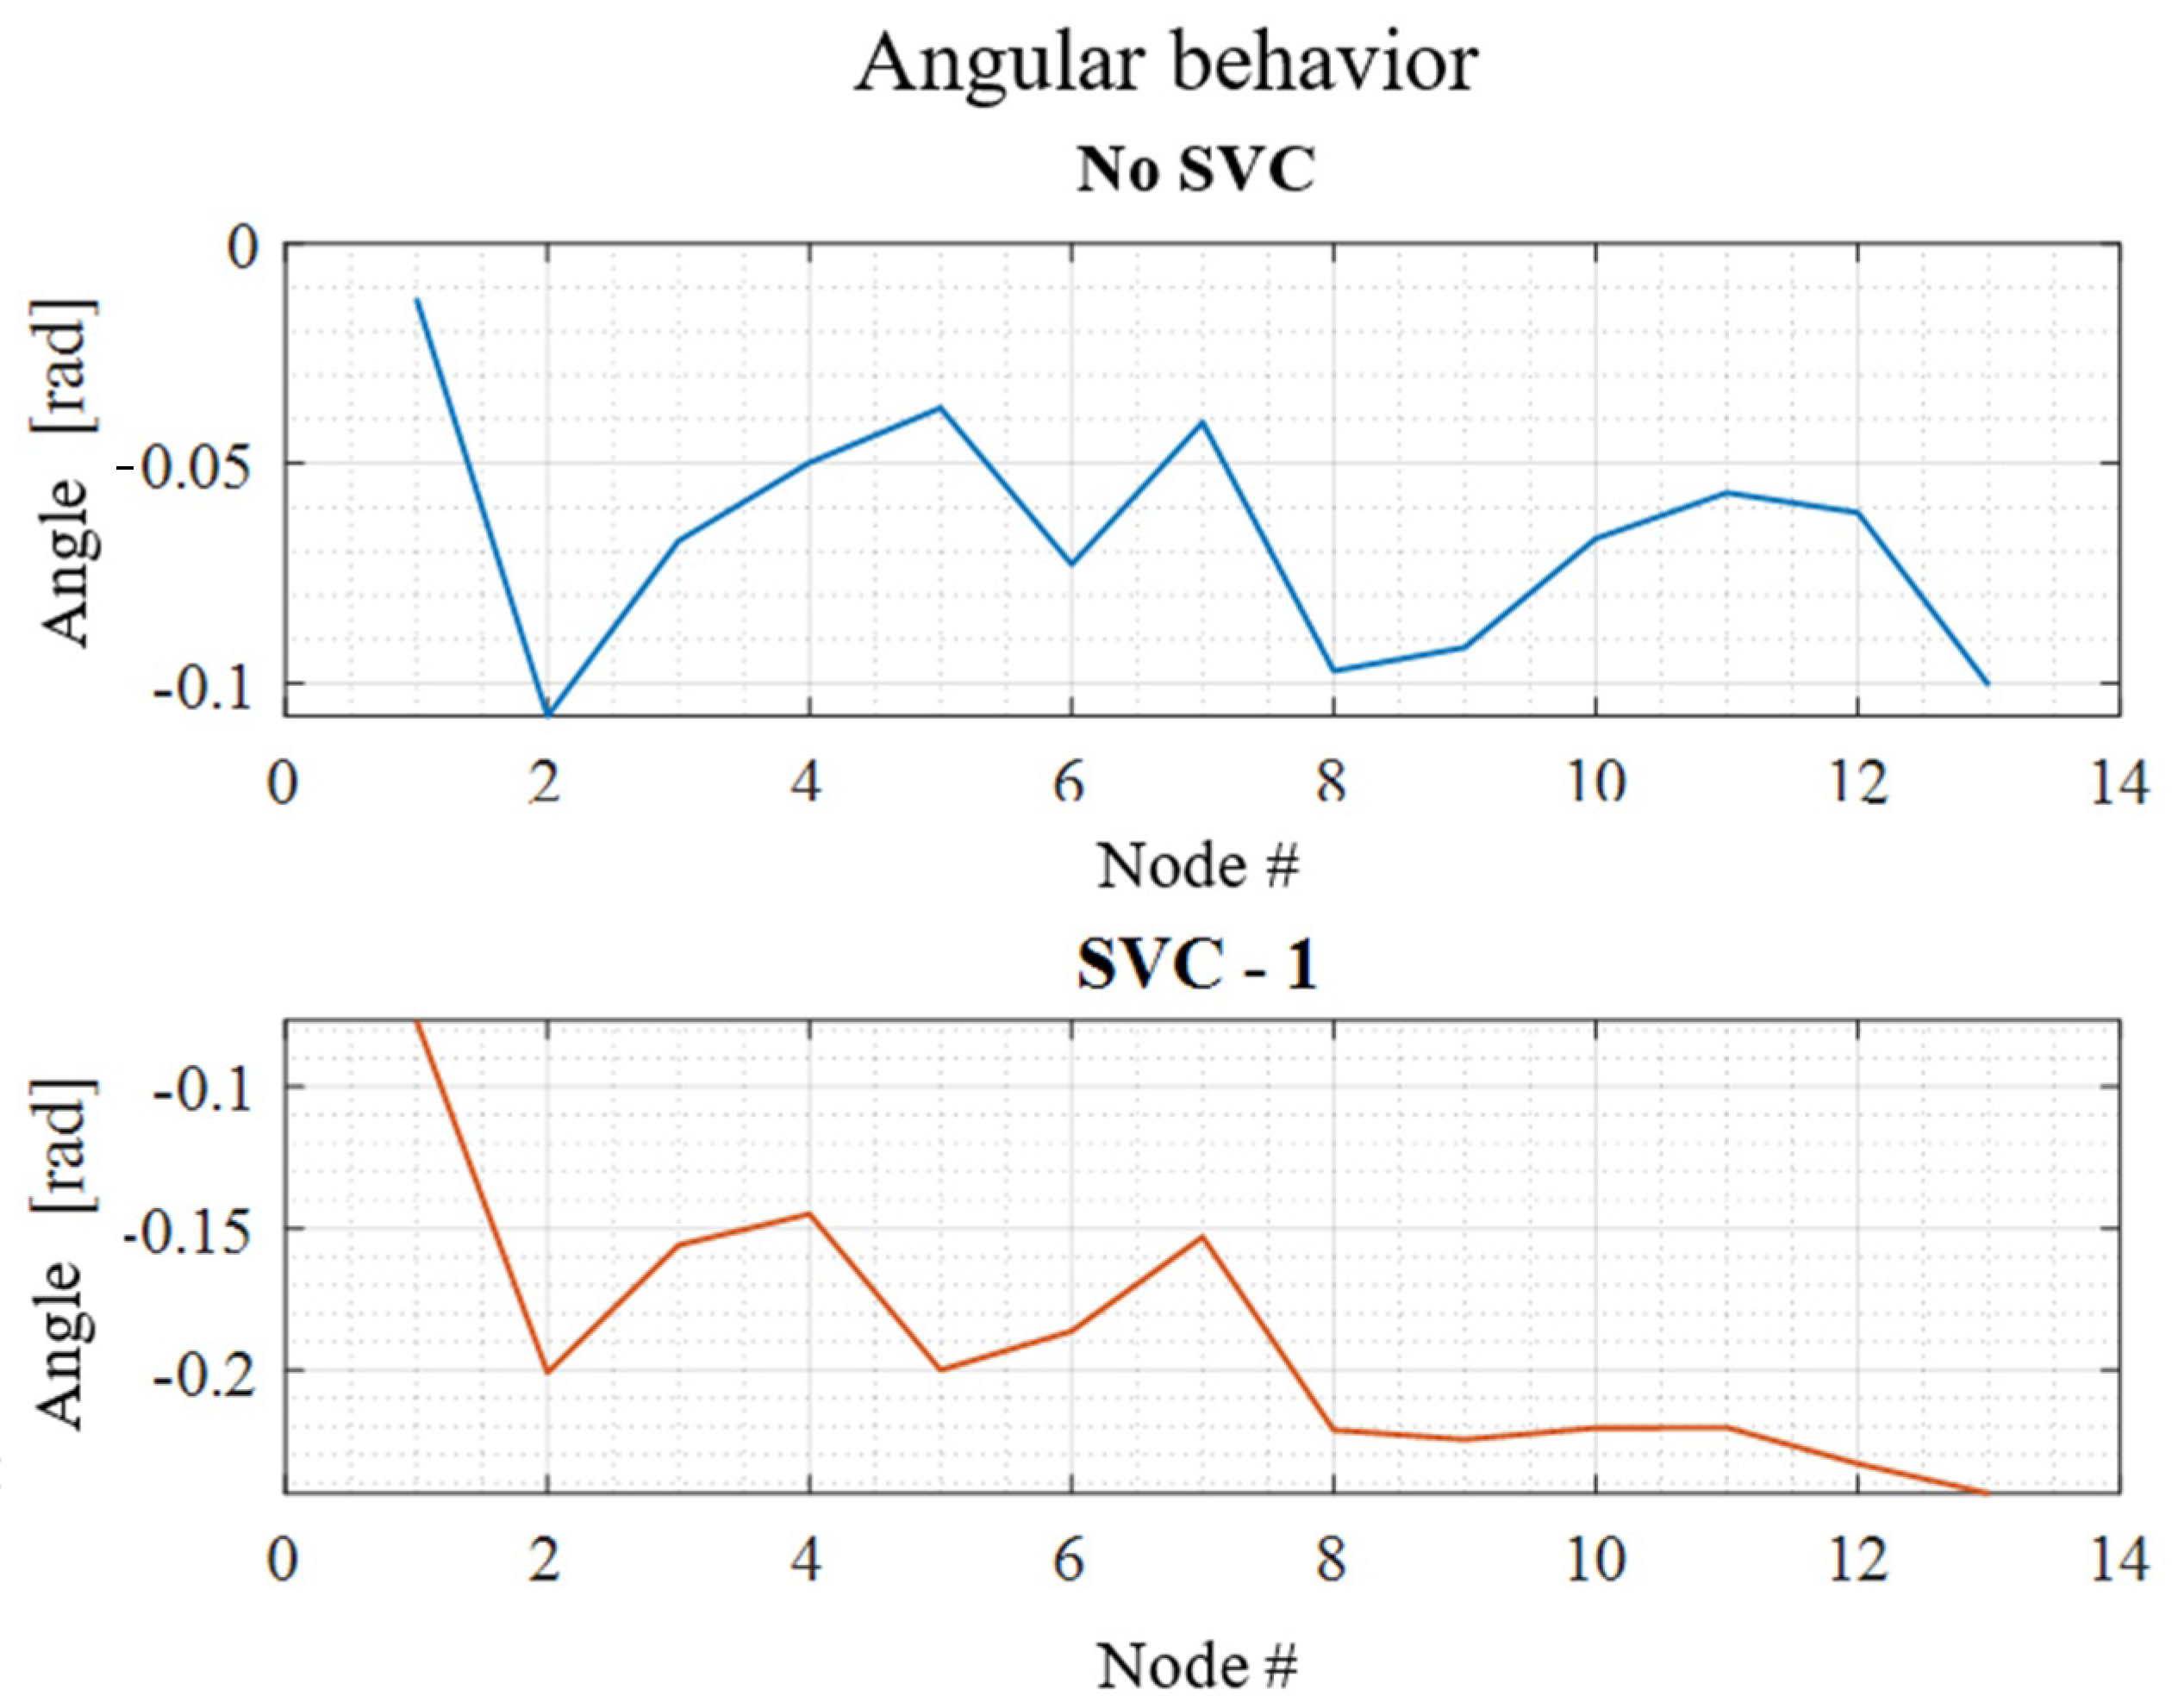
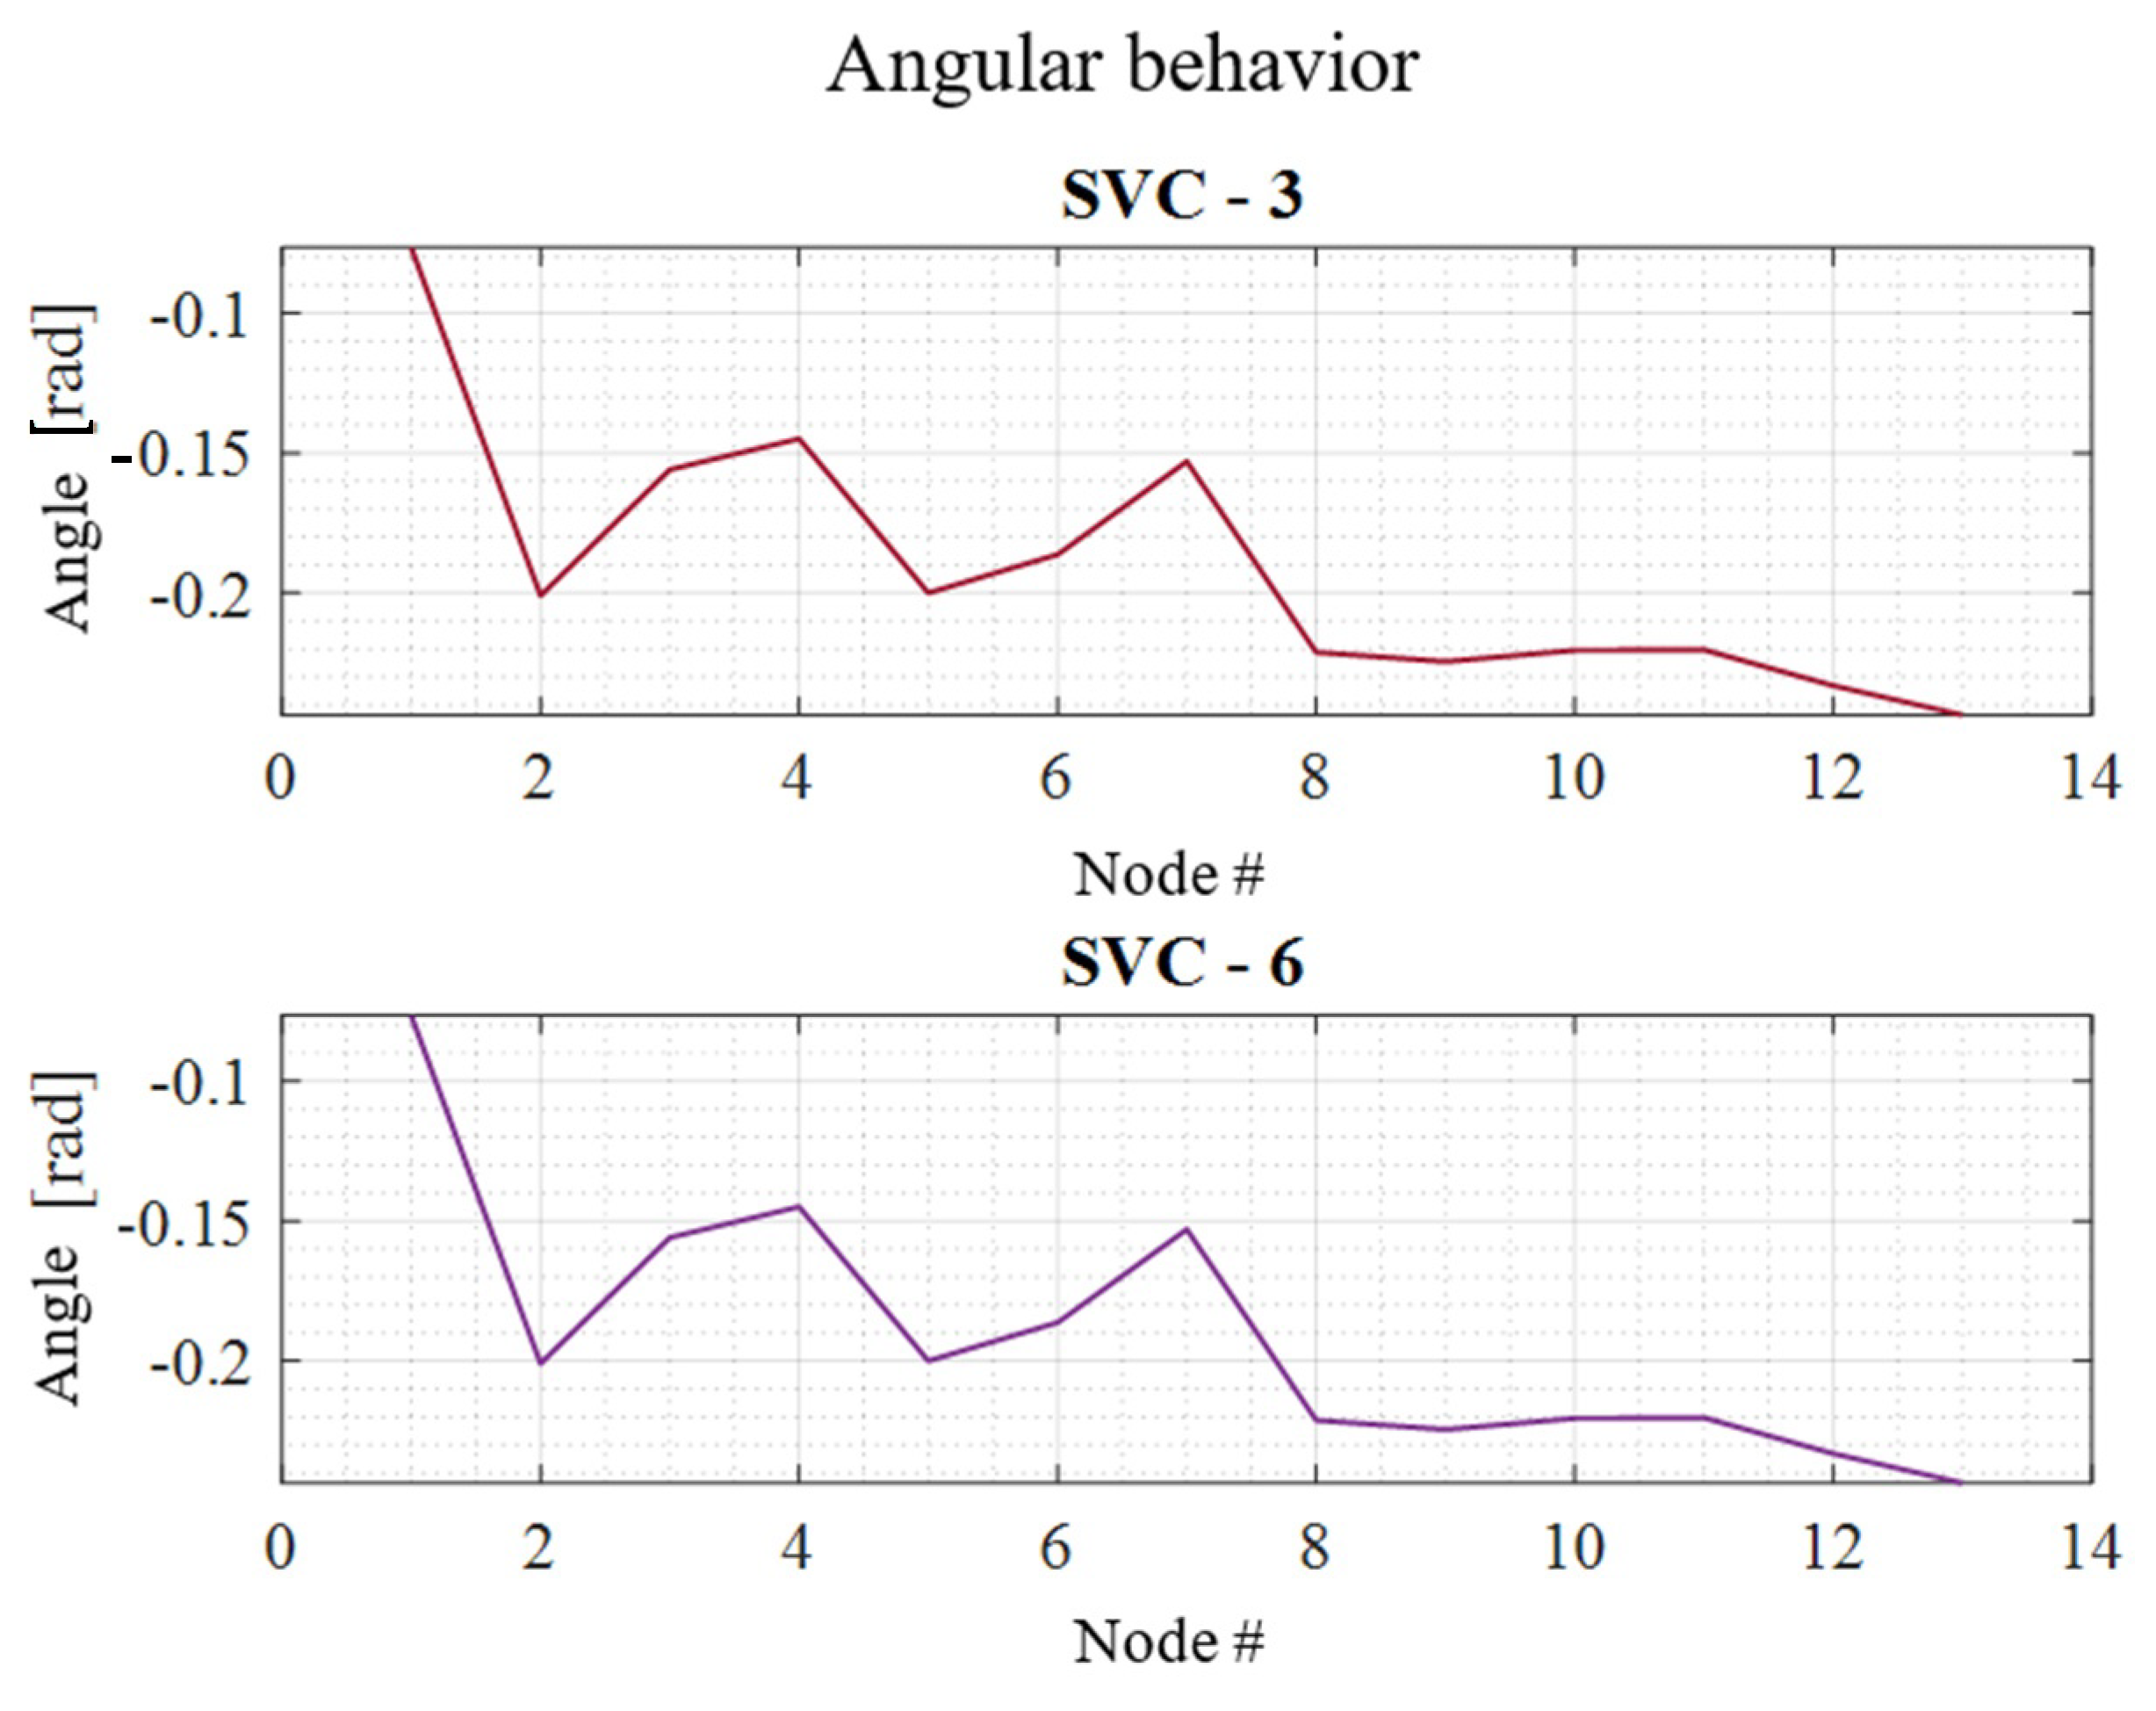
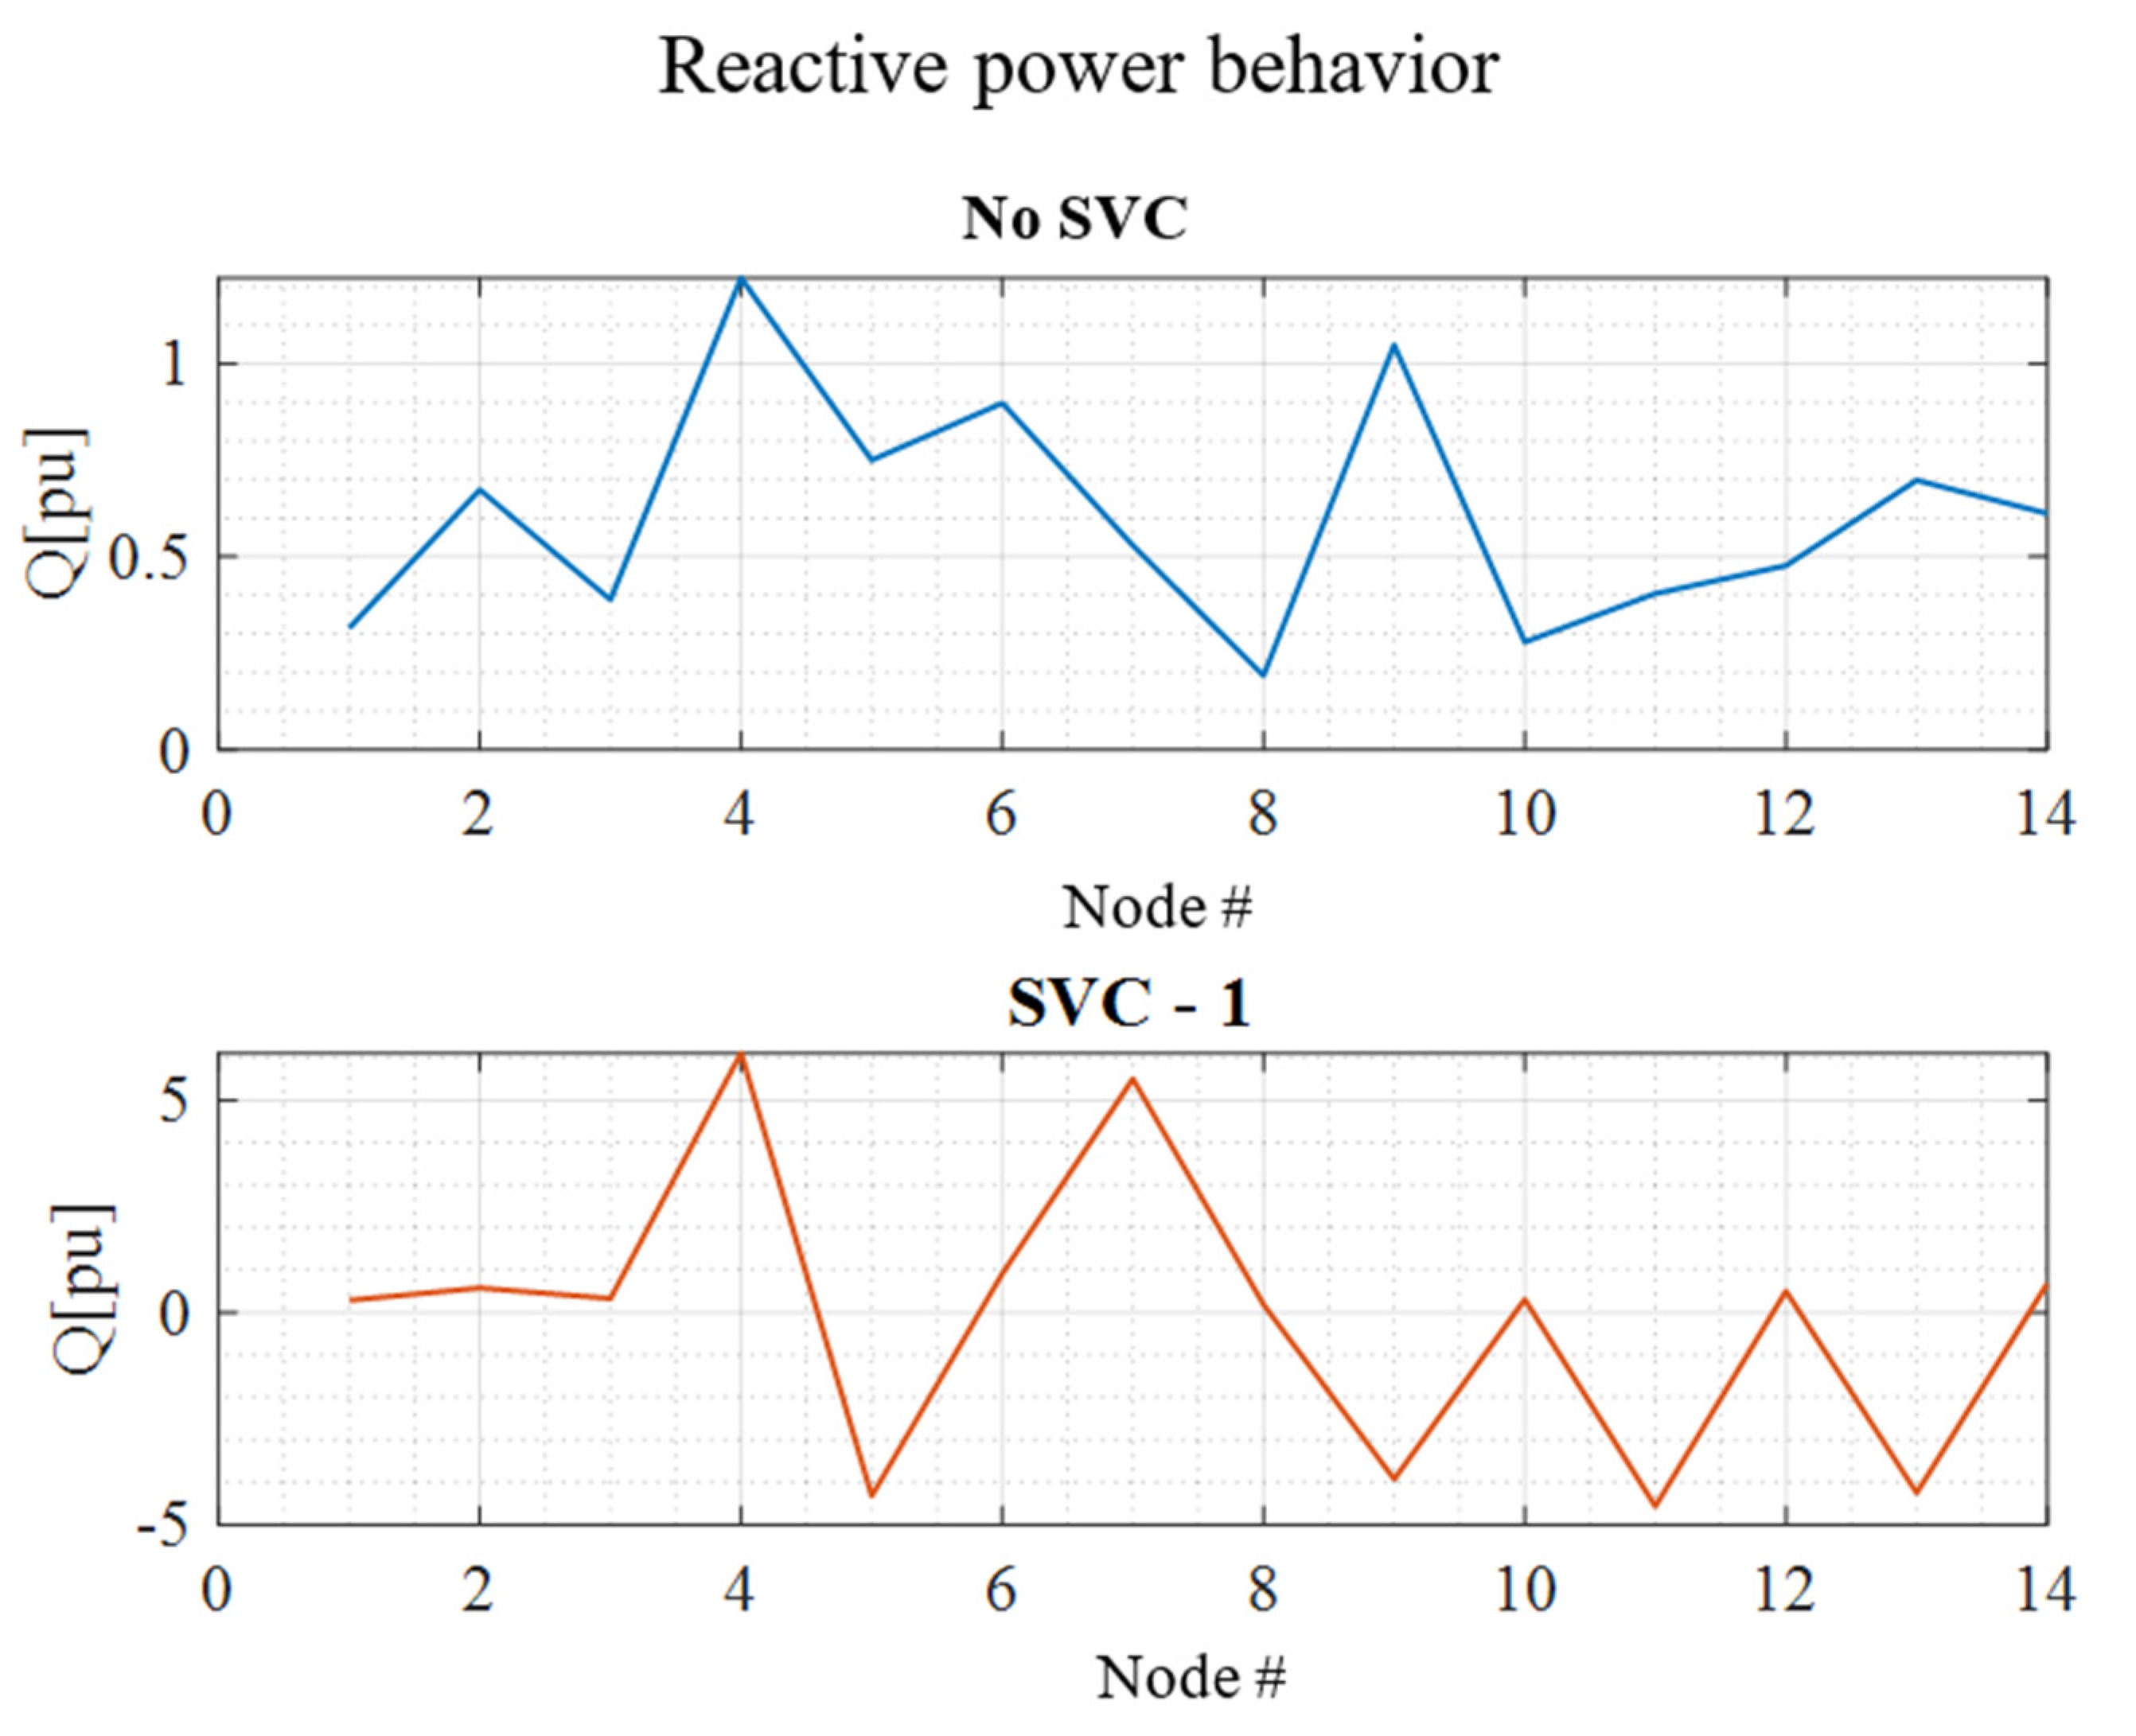
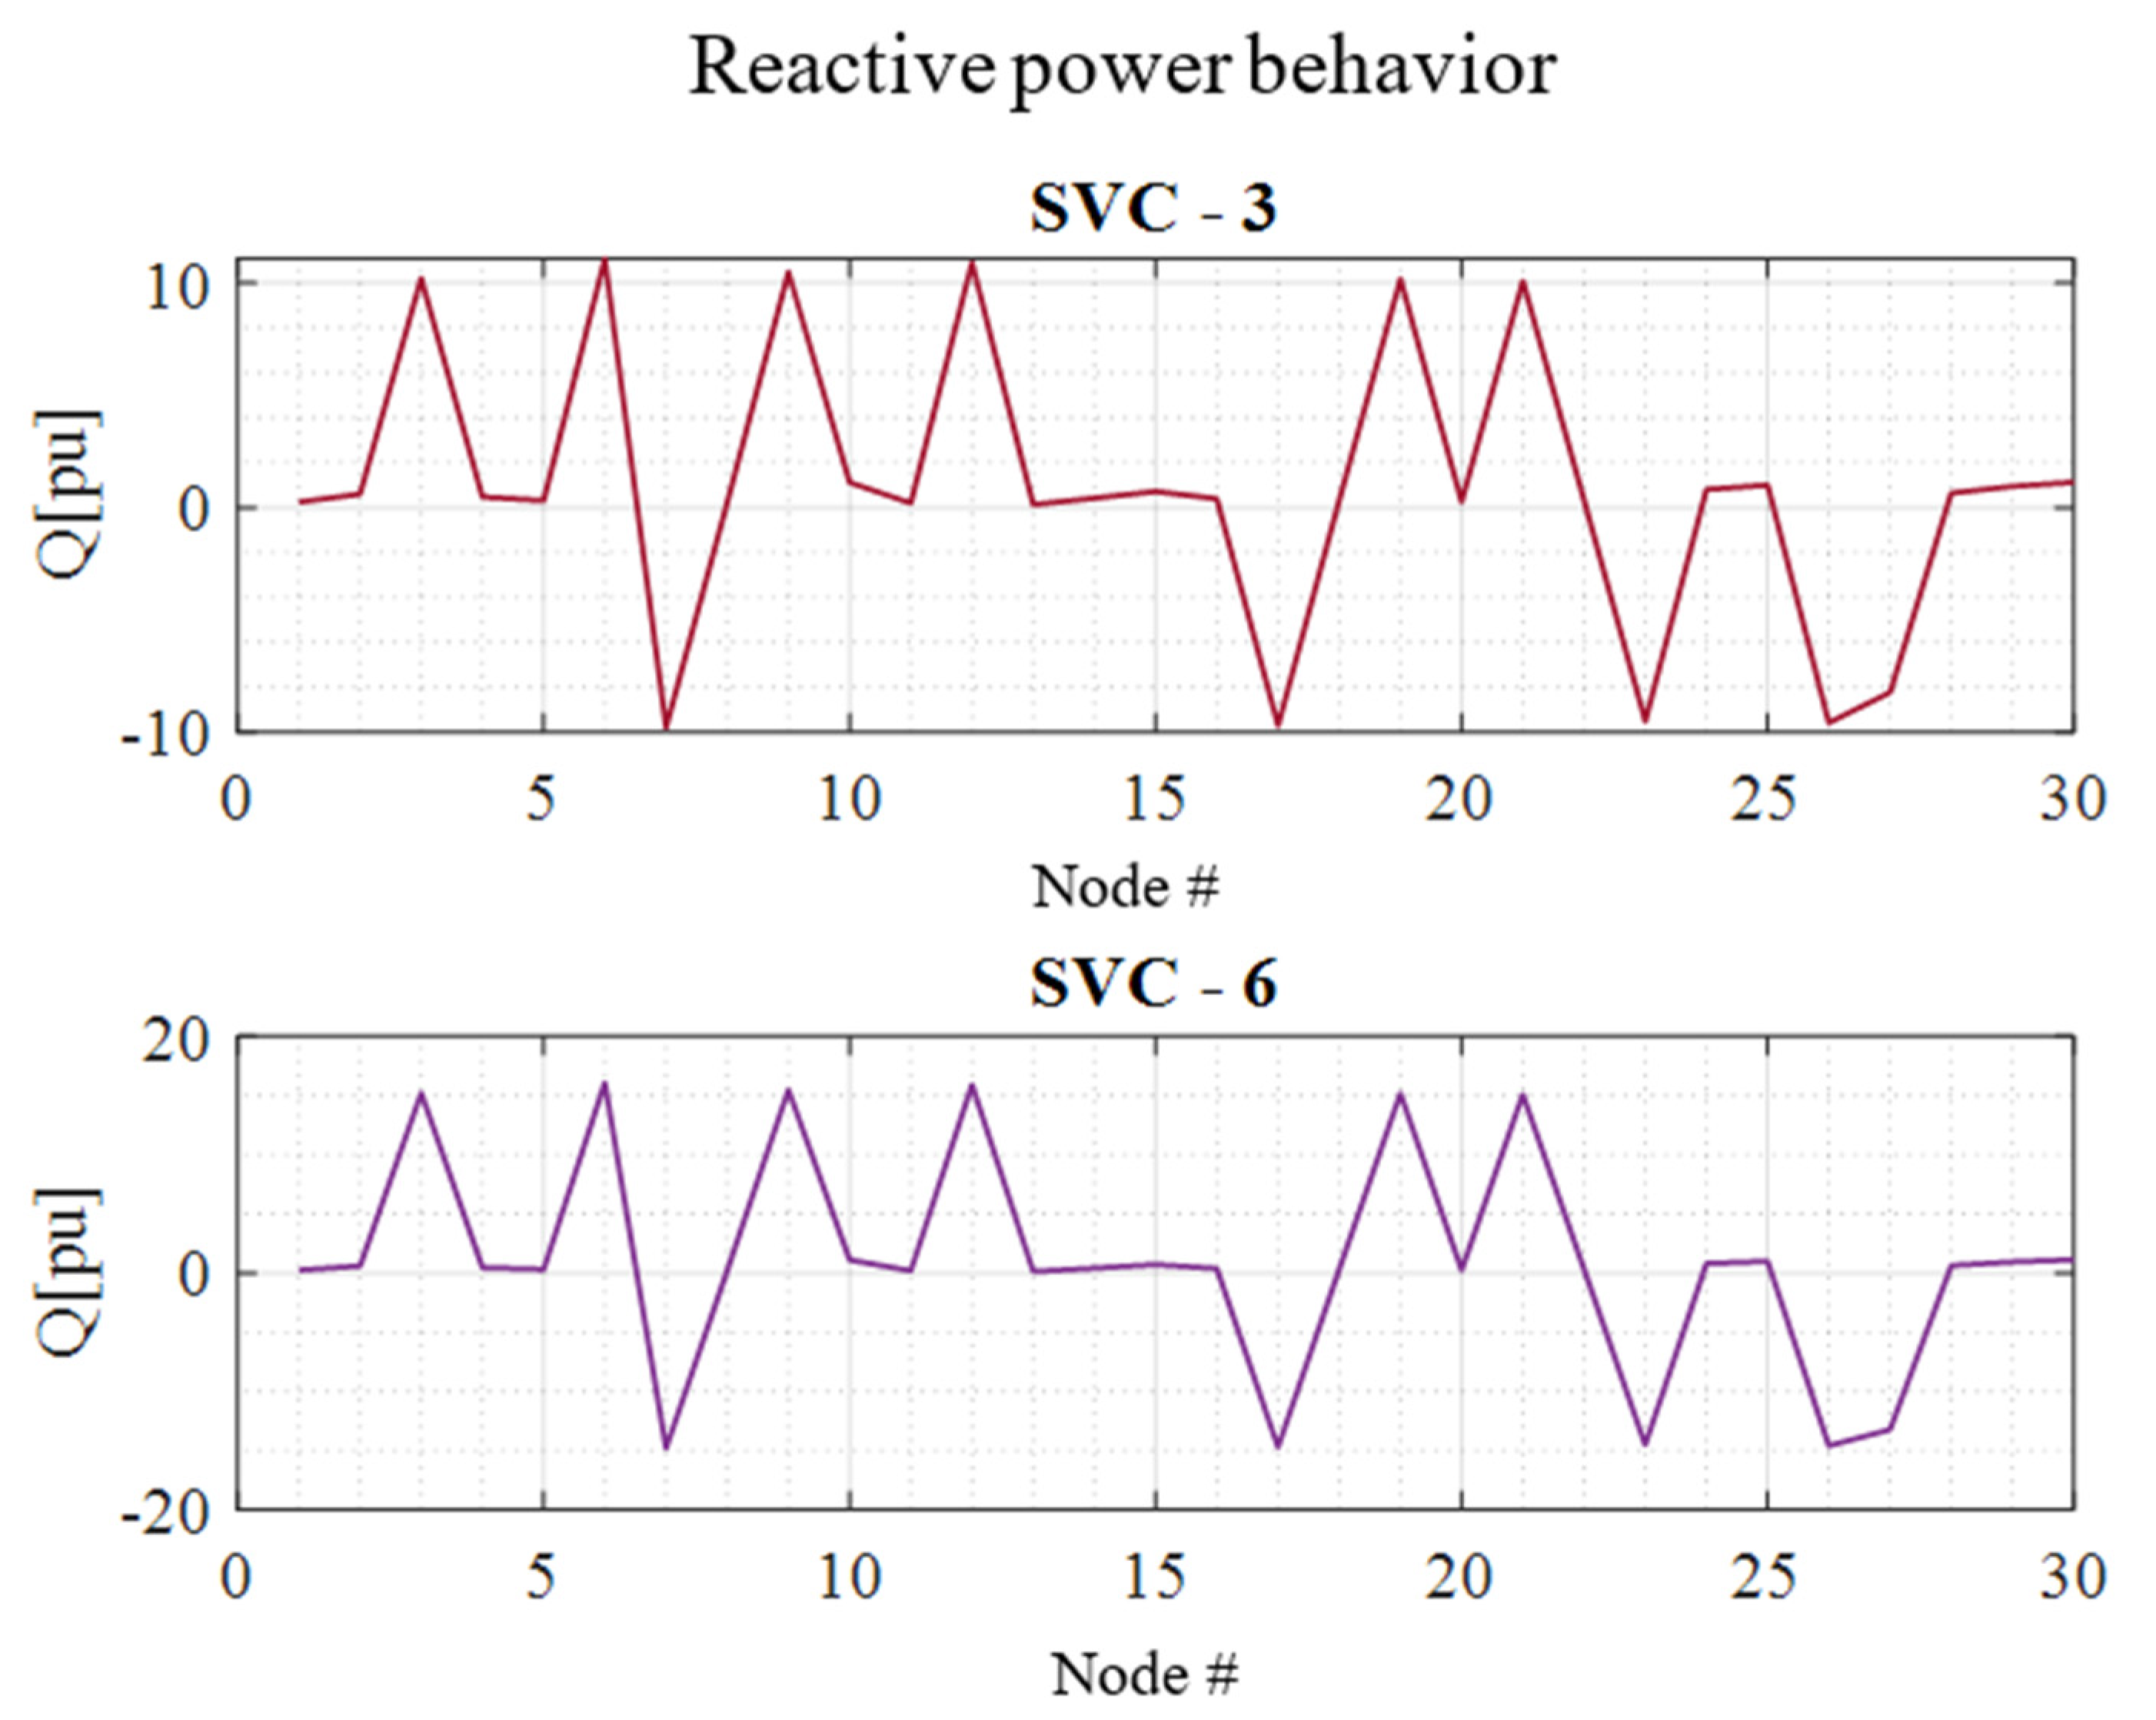
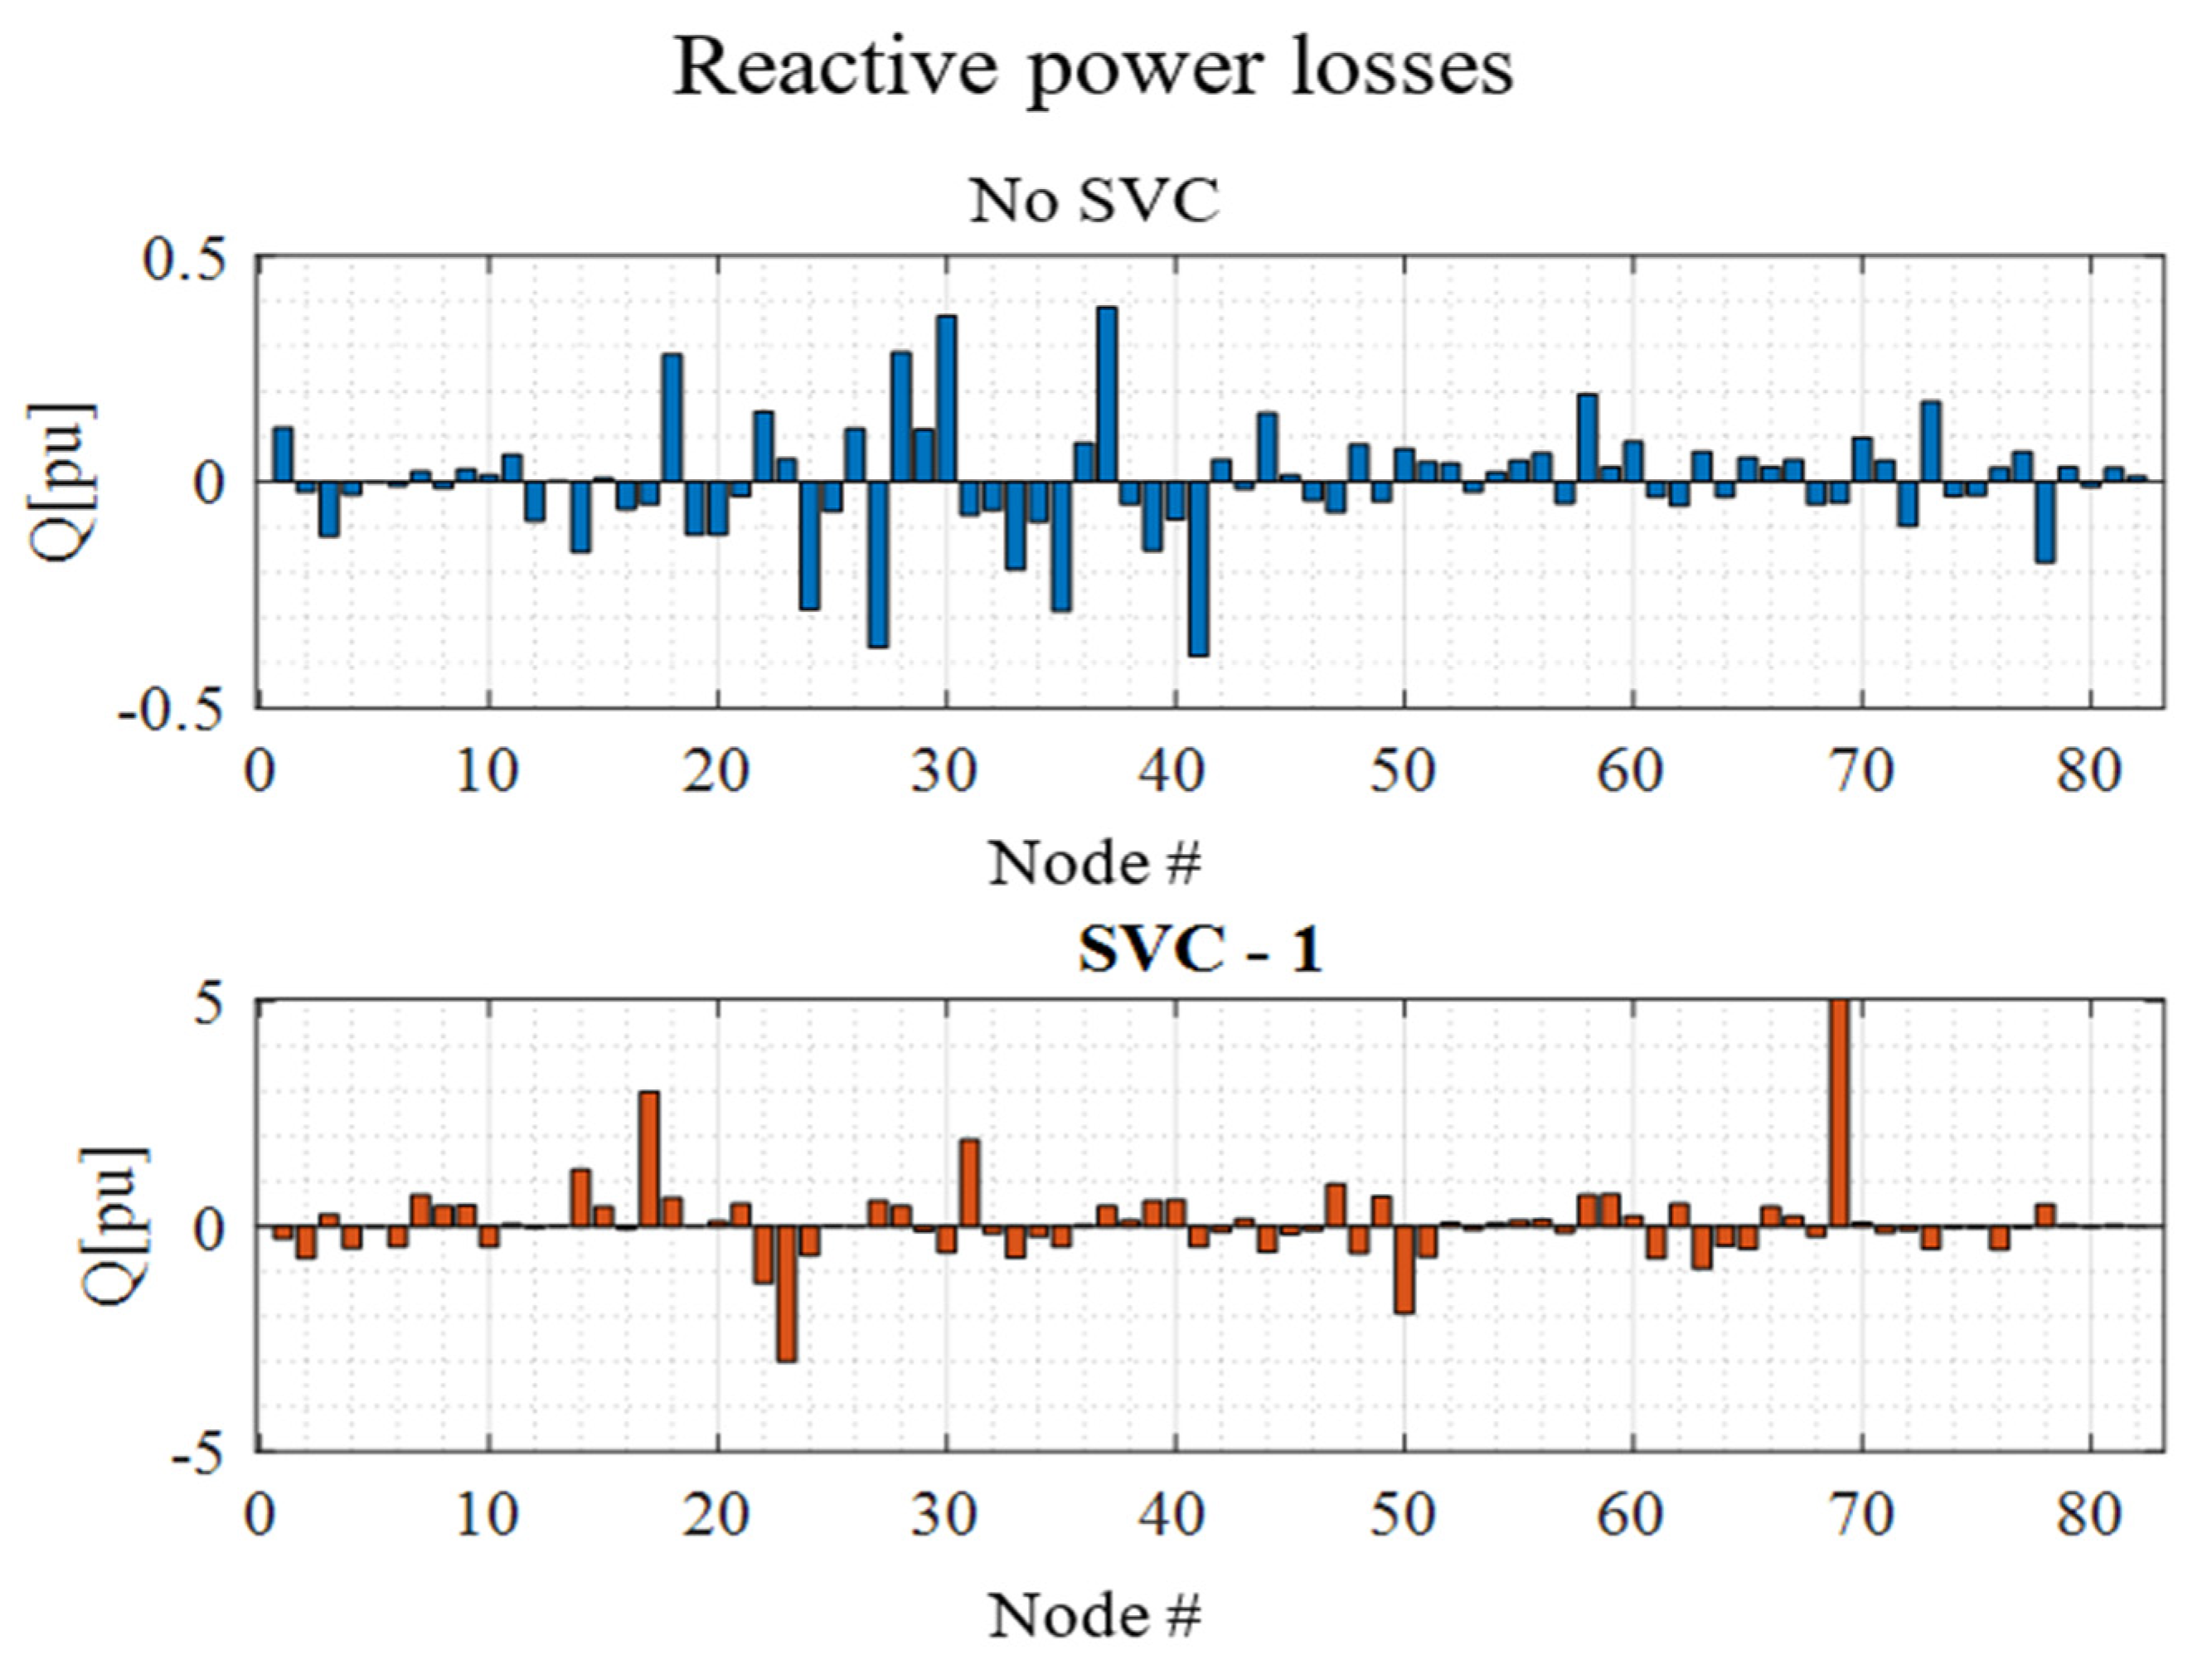
3. Results
4. Discussion
5. Conclusions
Author Contributions
Funding
Institutional Review Board Statement
Informed Consent Statement
Data Availability Statement
Conflicts of Interest
Abbreviations
| SVC | Static VAR Compensators |
| EPS | Electric Power System |
| LVSI | Linear Voltage Stability Index |
| VCA | Voltage Control Areas |
| OPF | Optimal Power Flow |
| STATCOM | Static Synchronous Compensator |
| GAMS | General Algebraic Modeling System |
| IEEE | Institute of Electrical and Electronics Engineers |
| TCR | Thyristor-Controlled Reactor |
| TSC | Thyristor-Switched Capacitor |
References
- Sulaiman, M.H.; Mustaffa, Z. Optimal placement and sizing of FACTS devices for optimal power flow using metaheuristic optimizers. Results Control Optim. 2022, 8, 100145. [Google Scholar] [CrossRef]
- Ahmad, A.A.L.; Sirjani, R. Optimal placement and sizing of multi-type FACTS devices in power systems using metaheuristic optimisation techniques: An updated review. Ain Shams Eng. J. 2020, 11, 611–628. [Google Scholar] [CrossRef]
- Ismail, B.; Wahab, N.I.A.; Othman, M.L.; Radzi, M.A.M.; Vijyakumar, K.N.; Naain, M.N.M. A Comprehensive Review on Optimal Location and Sizing of Reactive Power Compensation Using Hybrid-Based Approaches for Power Loss Reduction, Voltage Stability Improvement, Voltage Profile Enhancement and Loadability Enhancement. IEEE Access 2020, 8, 222733–222765. [Google Scholar] [CrossRef]
- Águila, A.; Ortiz, L.; Orizondo, R.; López, G. Optimal location and dimensioning of capacitors in microgrids using a multicriteria decision algorithm. Heliyon 2021, 7, e08061. [Google Scholar] [CrossRef]
- Aguila Téllez, A. Optimización multicriterio de flujos de potencia reactiva en sistemas eléctricos de distribución. Tesis de Doctorado, Universidad Pontificia Bolivariana de Medellín: Medellín, Colombia, 2021; Volume 2021-06-15, p. 105. [Google Scholar]
- Gutierrez, G.; Aguila, A.; González, D.; Ortiz, L. Optimum location and sizing of capacitor banks using VOLT VAR compensation in micro-grids. IEEE Lat. Am. Trans. 2020, 18, 465–472. [Google Scholar] [CrossRef]
- Medina, S.M.; Aguila, A. Óptima Compensación de Potencia Reactiva en Redes de Distribución Radiales considerando periodo de diseño Optimal Compensation of Reactive Power in Radial Distribution Networks considering design period. In Proceedings of the 2019 International Conference on Information Systems and Computer Science (INCISCOS), Quito, Ecuador, 22 November 2019; pp. 108–115. [Google Scholar] [CrossRef]
- Téllez, A.Á.; López, G.; Isaac, I.; González, J.W. Optimal reactive power compensation in electrical distribution systems with distributed resources. Review. Heliyon 2018, 4, e00746. [Google Scholar] [CrossRef]
- Aguila, A.; Wilson, J. Technical and Economic Assessment of the Implementation of Measures for Reducing Energy Losses in Distribution Systems. IOP Conf. Ser. Earth Environ. Sci. 2017, 73, 012018. [Google Scholar] [CrossRef]
- Munoz, F.A.C.; Tellez, A.A.; Sanchez, J.W.G. Analysis of Stability of Tension and Losses of Electric Power in Distribution Networks with Distributed Generation. IEEE Lat. Am. Trans. 2016, 14, 4491–4498. [Google Scholar] [CrossRef]
- Tellez, A.A.; Galarza, D.F.C.; Matos, L.O. Analysis of power losses in the asymmetric construction of electric distribution systems. IEEE Lat. Am. Trans. 2015, 13, 2190–2194. [Google Scholar] [CrossRef]
- Aguila, A. Medidas para minimizar las pérdidas de energía en circuitos de distribución. Bachelor’s Thesis, Universidad de Ciego de Ávila, Ciego de Ávila, Cuba, 2010. [Google Scholar] [CrossRef]
- Okampo, E.J.; Nwulu, N.; Bokoro, P.N. Optimal Placement and Operation of FACTS Technologies in a Cyber-Physical Power System: Critical Review and Future Outlook. Sustainability 2022, 14, 7707. [Google Scholar] [CrossRef]
- Ababssi, N. Implementation Optimal Location of STATCOM on the IEEE New England Power System Grid (100 kV). INASS 2022, 15, 441–454. [Google Scholar] [CrossRef]
- Shokouhandeh, H.; Latif, S.; Irshad, S.; Kamarposhti, M.A.; Colak, I.; Eguchi, K. Optimal Management of Reactive Power Considering Voltage and Location of Control Devices Using Artificial Bee Algorithm. Appl. Sci. 2021, 12, 27. [Google Scholar] [CrossRef]
- Khoa, N.M.; Tung, D.D. Locating fault on transmission line with static var compensator based on phasor measurement unit. Energies 2018, 11, 2380. [Google Scholar] [CrossRef]
- Zhu, X.; Dichen, L.; Wu, J. TwoStage Optimal Location Allocations of DPFC Considering Wind and Load Uncertainty. Front. Energy Res. 2022, 10, 865902. [Google Scholar] [CrossRef]
- Tareen, W.U.K.; Aamir, M.; Mekhilef, S.; Nakaoka, M.; Seyedmahmoudian, M.; Horan, B.; Memon, M.A.; Baig, N.A. Mitigation of power quality issues due to high penetration of renewable energy sources in electric grid systems using three-phase APF/STATCOM technologies: A review. Energies 2018, 11, 1491. [Google Scholar] [CrossRef]
- Karmakar, N.; Bhattacharyya, B. Optimal reactive power planning in power transmission system considering facts devices and implementing hybrid optimisation approach. IET Gener. Transm. Distrib. 2020, 14, 6294–6305. [Google Scholar] [CrossRef]
- Mohamed, A.A.; Kamel, S.; Hassan, M.H.; Mosaad, M.I.; Aljohani, M. Optimal Power Flow Analysis Based on Hybrid Gradient-Based Optimizer with Moth–Flame Optimization Algorithm Considering Optimal Placement and Sizing of FACTS/Wind Power. Mathematics 2022, 10, 361. [Google Scholar] [CrossRef]
- Orejuela, V.; Arias, D.; Aguila, A. Response of Residential Electricity Demand Against Price Signals in Ecuador. In Proceedings of the IEEE Thirty Fifth Central American and Panama Convention, No. Concapan XXXV, Tegucigalpa City, Honduras, 11–13 November 2015; pp. 373–378. Available online: www.proceedings.com (accessed on 15 July 2021).
- Torres, E.M.G.; Águila, A.; Isaac, I.; González, J.W.; López, G. Analysis of Voltage Profile to determine Energy Demand using Monte Carlo algorithms and Markov Chains (MCMC). In Proceedings of the 51st International Universities Power Engineering Conference (UPEC), Coimbra, Portugal, 6–9 September 2016; pp. 1–6. [Google Scholar] [CrossRef]
- Nusair, K.; Alasali, F.; Hayajneh, A.; Holderbaum, W. Optimal placement of FACTS devices and power-flow solutions for a power network system integrated with stochastic renewable energy resources using new metaheuristic optimization techniques. Int. J. Energy Res. 2021, 45, 18786–18809. [Google Scholar] [CrossRef]
- Singh, B.; Agrawal, G. Enhancement of voltage profile by incorporation of SVC in power system networks by using optimal load flow method in MATLAB/Simulink environments. Energy Rep. 2018, 4, 418–434. [Google Scholar] [CrossRef]
- Kamel, S.; Youssef, H. Voltage Stability Enhancement Based on Optimal Allocation of Shunt Compensation Devices Using Lightning Attachment Procedure Optimization. Int. J. Interact. Multimed. Artif. Intell. 2019, 5, 125. [Google Scholar] [CrossRef]
- Bhayani, K.J.; Pandya, D.J. Optimal Allocation of FACTS Devices Using Kinetic Gas Molecular Optimization and Cuckoo Search Algorithm. J. Inst. Eng. (India) Ser. B 2022, 103, 2057–2072. [Google Scholar] [CrossRef]
- Yasin, N.M.; Talib, H.A. Genetic Based Optimal Location of STATCOM Compensator. Int. J. Appl. Eng. Res. 2018, 13, 7516–7521. [Google Scholar]
- Salama, H.S.; Vokony, I. Voltage stability indices—A comparison and a review. Comput. Electr. Eng. 2022, 98, 107743. [Google Scholar] [CrossRef]
- Zaheb, H.; Danish, M.S.S.; Senjyu, T.; Ahmadi, M.; Nazari, A.M.; Wali, M.; Khosravy, M.; Mandal, P. A contemporary novel classification of voltage stability indices. Appl. Sci. 2020, 10, 1639. [Google Scholar] [CrossRef]
- Nadeem, M.; Imran, K.; Khattak, A.; Ulasyar, A.; Pal, A.; Zeb, M.Z.; Khan, A.N.; Padhee, M. Optimal placement, sizing and coordination of FACTS devices in transmission network using whale optimization algorithm. Energies 2020, 13, 753. [Google Scholar] [CrossRef]
- Hemeida, M.G.; Rezk, H.; Hamada, M.M. A comprehensive comparison of STATCOM versus SVC-based fuzzy controller for stability improvement of wind farm connected to multi-machine power system. Electr. Eng. 2018, 100, 935–951. [Google Scholar] [CrossRef]
- Modarresi, J.; Gholipour, E.; Khodabakhshian, A. A comprehensive review of the voltage stability indices. Renew. Sustain. Energy Rev. 2016, 63, 1–12. [Google Scholar] [CrossRef]
- Danish, M.S.S.; Senjyu, T.; Danish, S.M.S.; Sabory, N.R.; Narayanan, K.; Mandal, P. A recap of voltage stability indices in the past three decades. Energies 2019, 12, 1544. [Google Scholar] [CrossRef]
- Shojaei, A.H.; Ghadimi, A.A.; Miveh, M.R.; Mohammadi, F.; Jurado, F. Multi-Objective Optimal Reactive Power Planning under Load Demand and Wind Power Generation Uncertainties Using ε-Constraint Method. Appl. Sci. 2020, 10, 2859. [Google Scholar] [CrossRef]
- Daqaq, F.; Ouassaid, M.; Ellaia, R. A new meta-heuristic programming for multi-objective optimal power flow. Electr. Eng. 2021, 103, 1217–1237. [Google Scholar] [CrossRef]
- Conejo, A.J.; Baringo, L. Power System Operations; Springer International Publishing: Cham, Switzerland, 2018. [Google Scholar] [CrossRef]
- Pandian, A.N.; Palanivelu, A. Metaheuristic optimization based placement of SVCs with multiple objectives. J. Eng. Des. Technol. 2021, 19, 1586–1600. [Google Scholar] [CrossRef]
- Ćalasan, M.; Konjić, T.; Kecojević, K.; Nikitović, L. Optimal allocation of static var compensators in electric power systems. Energies 2020, 13, 3219. [Google Scholar] [CrossRef]
- Vanishree, J.; Ramesh, V. Optimization of size and cost of Static VAR Compensator using Dragonfly algorithm for voltage profile improvement in power transmission systems. Int. J. Renew. Energy Res. 2018, 8, 56–66. [Google Scholar] [CrossRef]
- Villa-Acevedo, W.M.; LópezLezama, J.M.; Colomé, D.G.; Cepeda, J. Long-term voltage stability monitoring of power system areas using a kernel extreme learning machine approach. Alex. Eng. J. 2022, 61, 1353–1367. [Google Scholar] [CrossRef]
- Wolgast, T.; Ferenz, S.; Nieße, A. Reactive Power Markets: A Review. IEEE Access 2022, 10, 28397–28410. [Google Scholar] [CrossRef]
- Guascal, A. Mejora del margen de estabilidad de tensión en sistemas de potencia basado en la úbicación óptima de dispositivos SVC. Bachelor’s Thesis, Universidad Politécnica Salesiana, Cuenca, Ecuador, 2020. [Google Scholar]
- Vaca, S.; Gallardo, C. Secondary Voltage Control Areas Using Hybrid Methods for Systems with High Wind Penetration. In Lastest Advances in Electrcial Engineering, and, Electronics; Botto-Tobar, M., Vizuete, M.Z., Cadena, A.D., Vizuete, A.Z., Eds.; Springer International Publishing: Cham, Switzerland, 2022; Volume 933, pp. 17–32. [Google Scholar] [CrossRef]
- Alayande, A.S.; Nwulu, N. A novel approach for the identification of critical nodes and transmission lines for mitigating voltage instability in power networks. Afr. J. Sci. Technol. Innov. Dev. 2019, 11, 383–390. [Google Scholar] [CrossRef]
- Alzaareer, K.; Saad, M.; Mehrjerdi, H.; Lefebvre, S.; Asber, D. TopDown/Bottom-Up Method for Identifying a Set of Voltage Stability Preventive Controls. In Proceedings of the 2020 International Conference on Technology and Policy in Energy and Electric Power (ICT-PEP), Bandung, Indonesia, 23–24 September 2020; Volume 3, pp. 339–343. [Google Scholar] [CrossRef]
- Chakraborty, K.; Chakrabarti, A. Chakrabarti, Soft Computing Techniques in Voltage Security Analysis; Springer: New Delhi, India, 2015. [Google Scholar] [CrossRef]


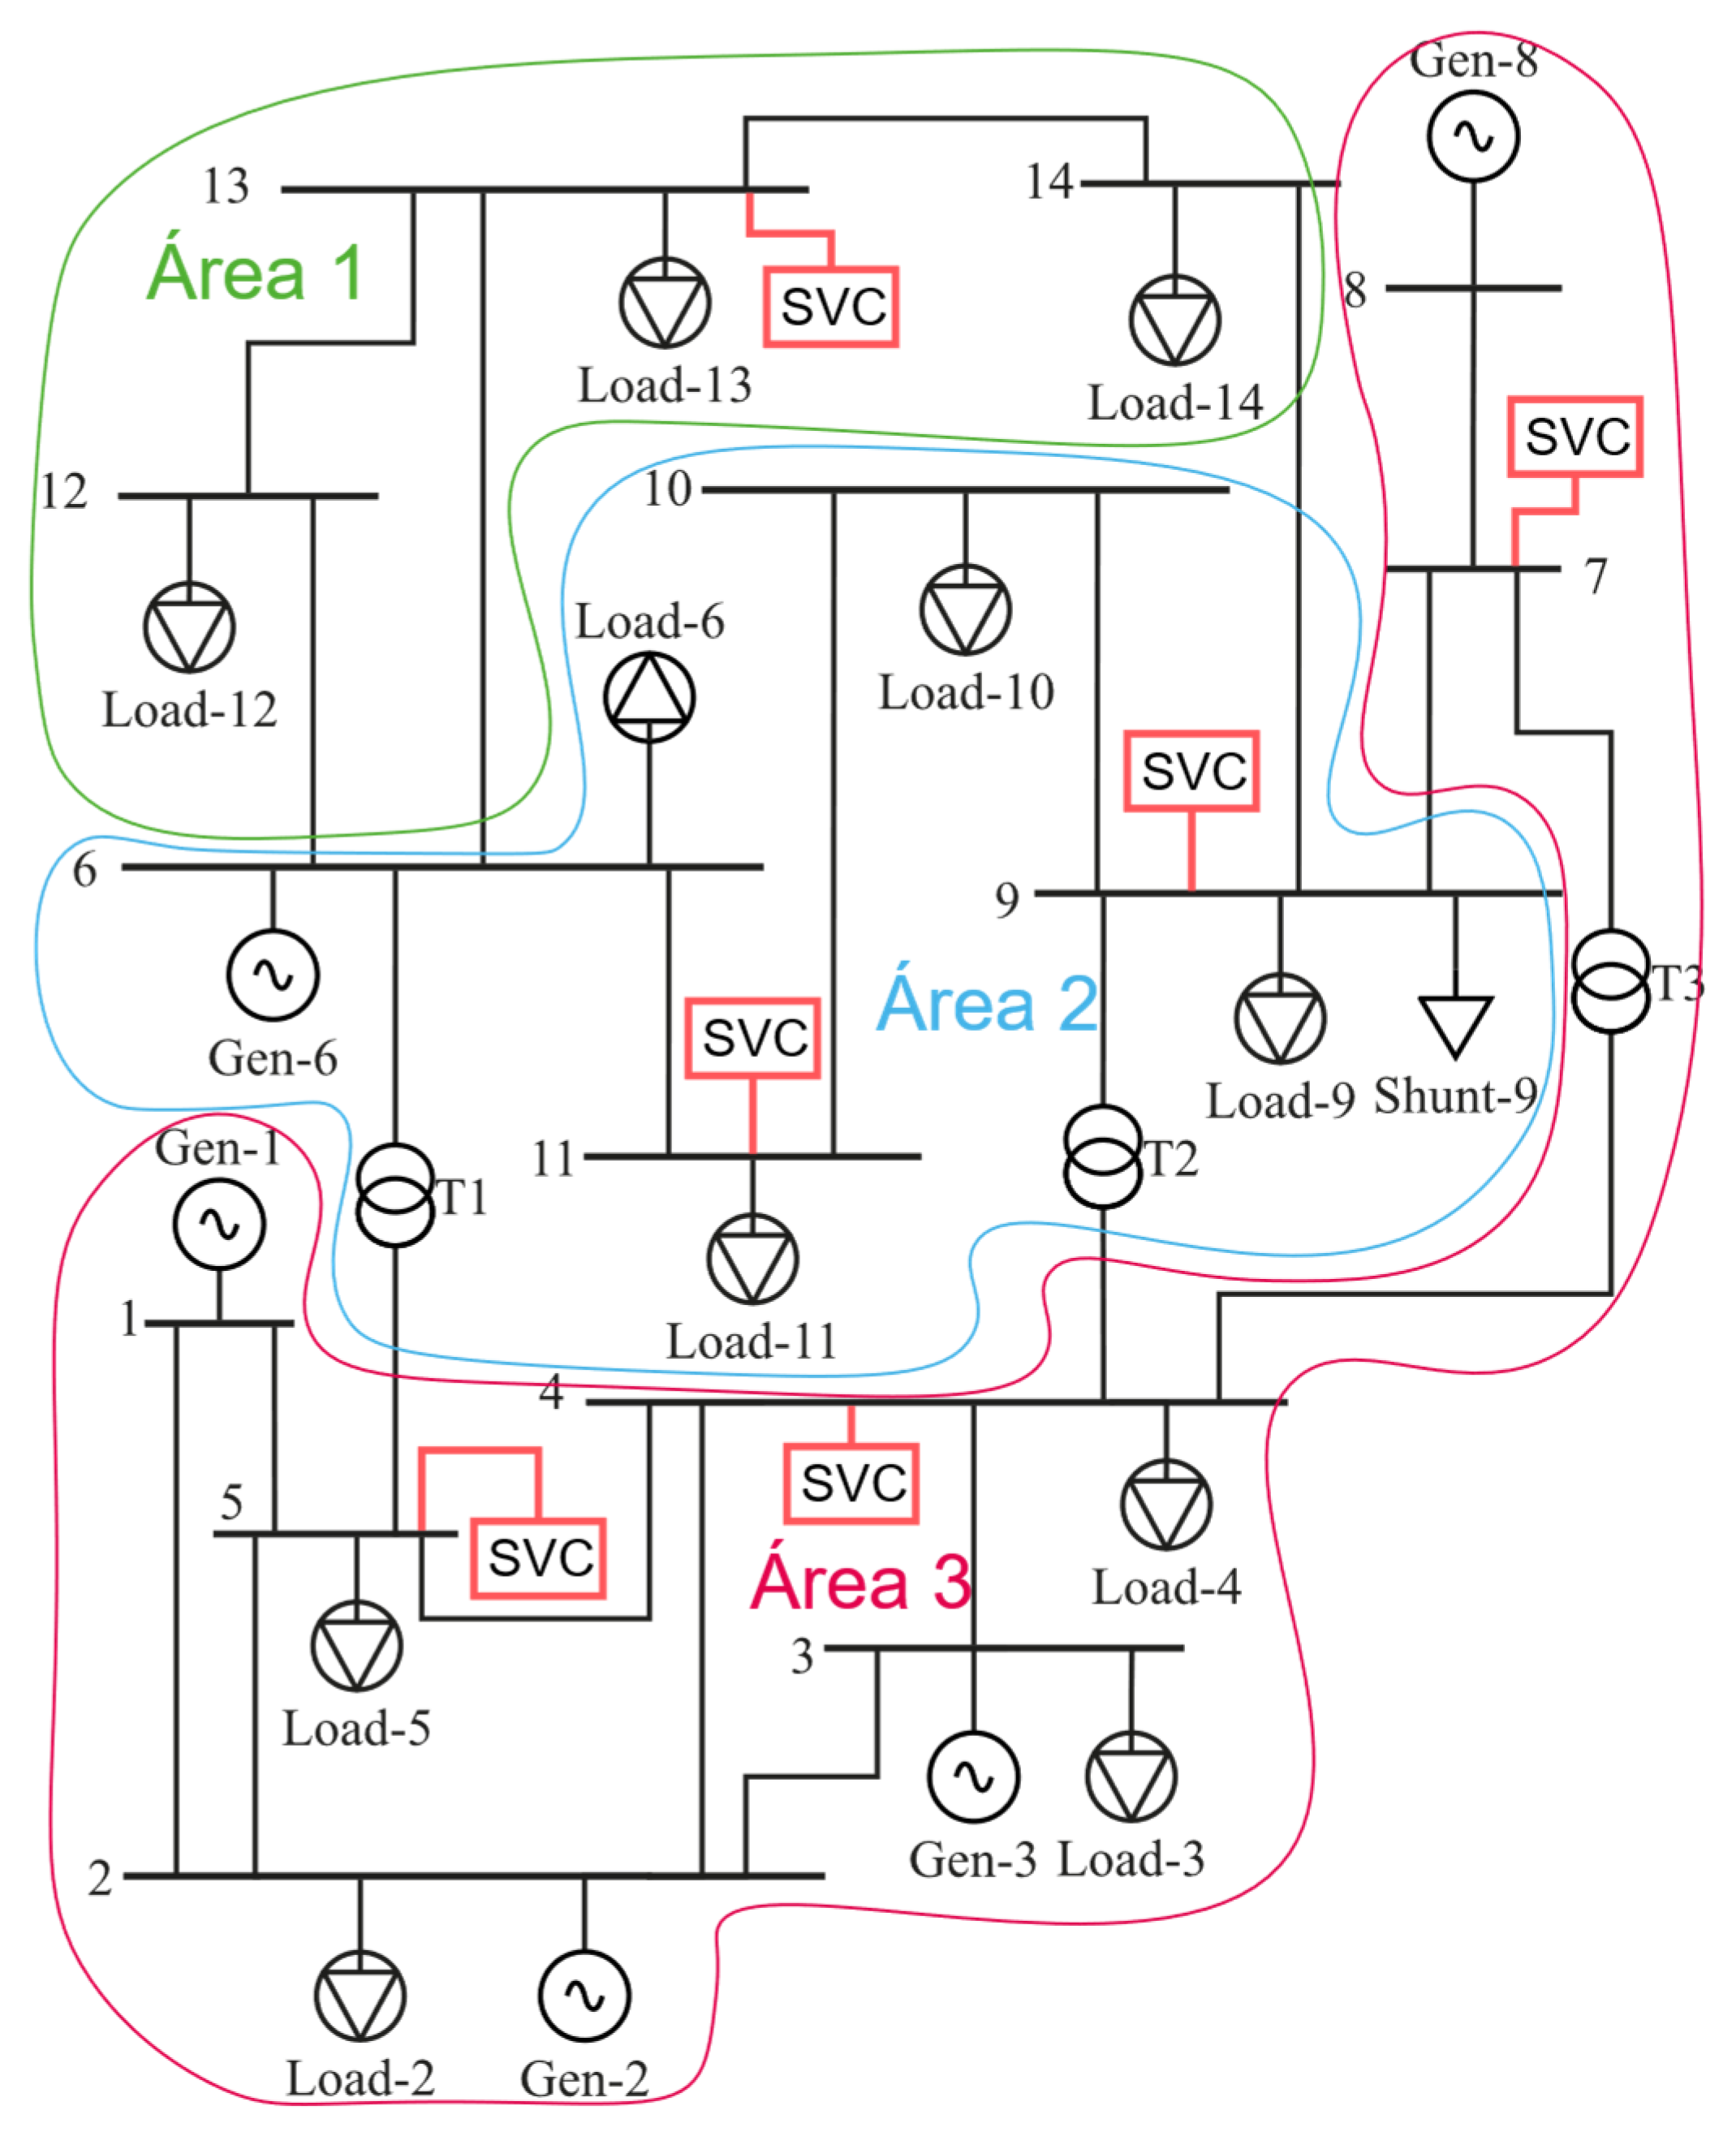
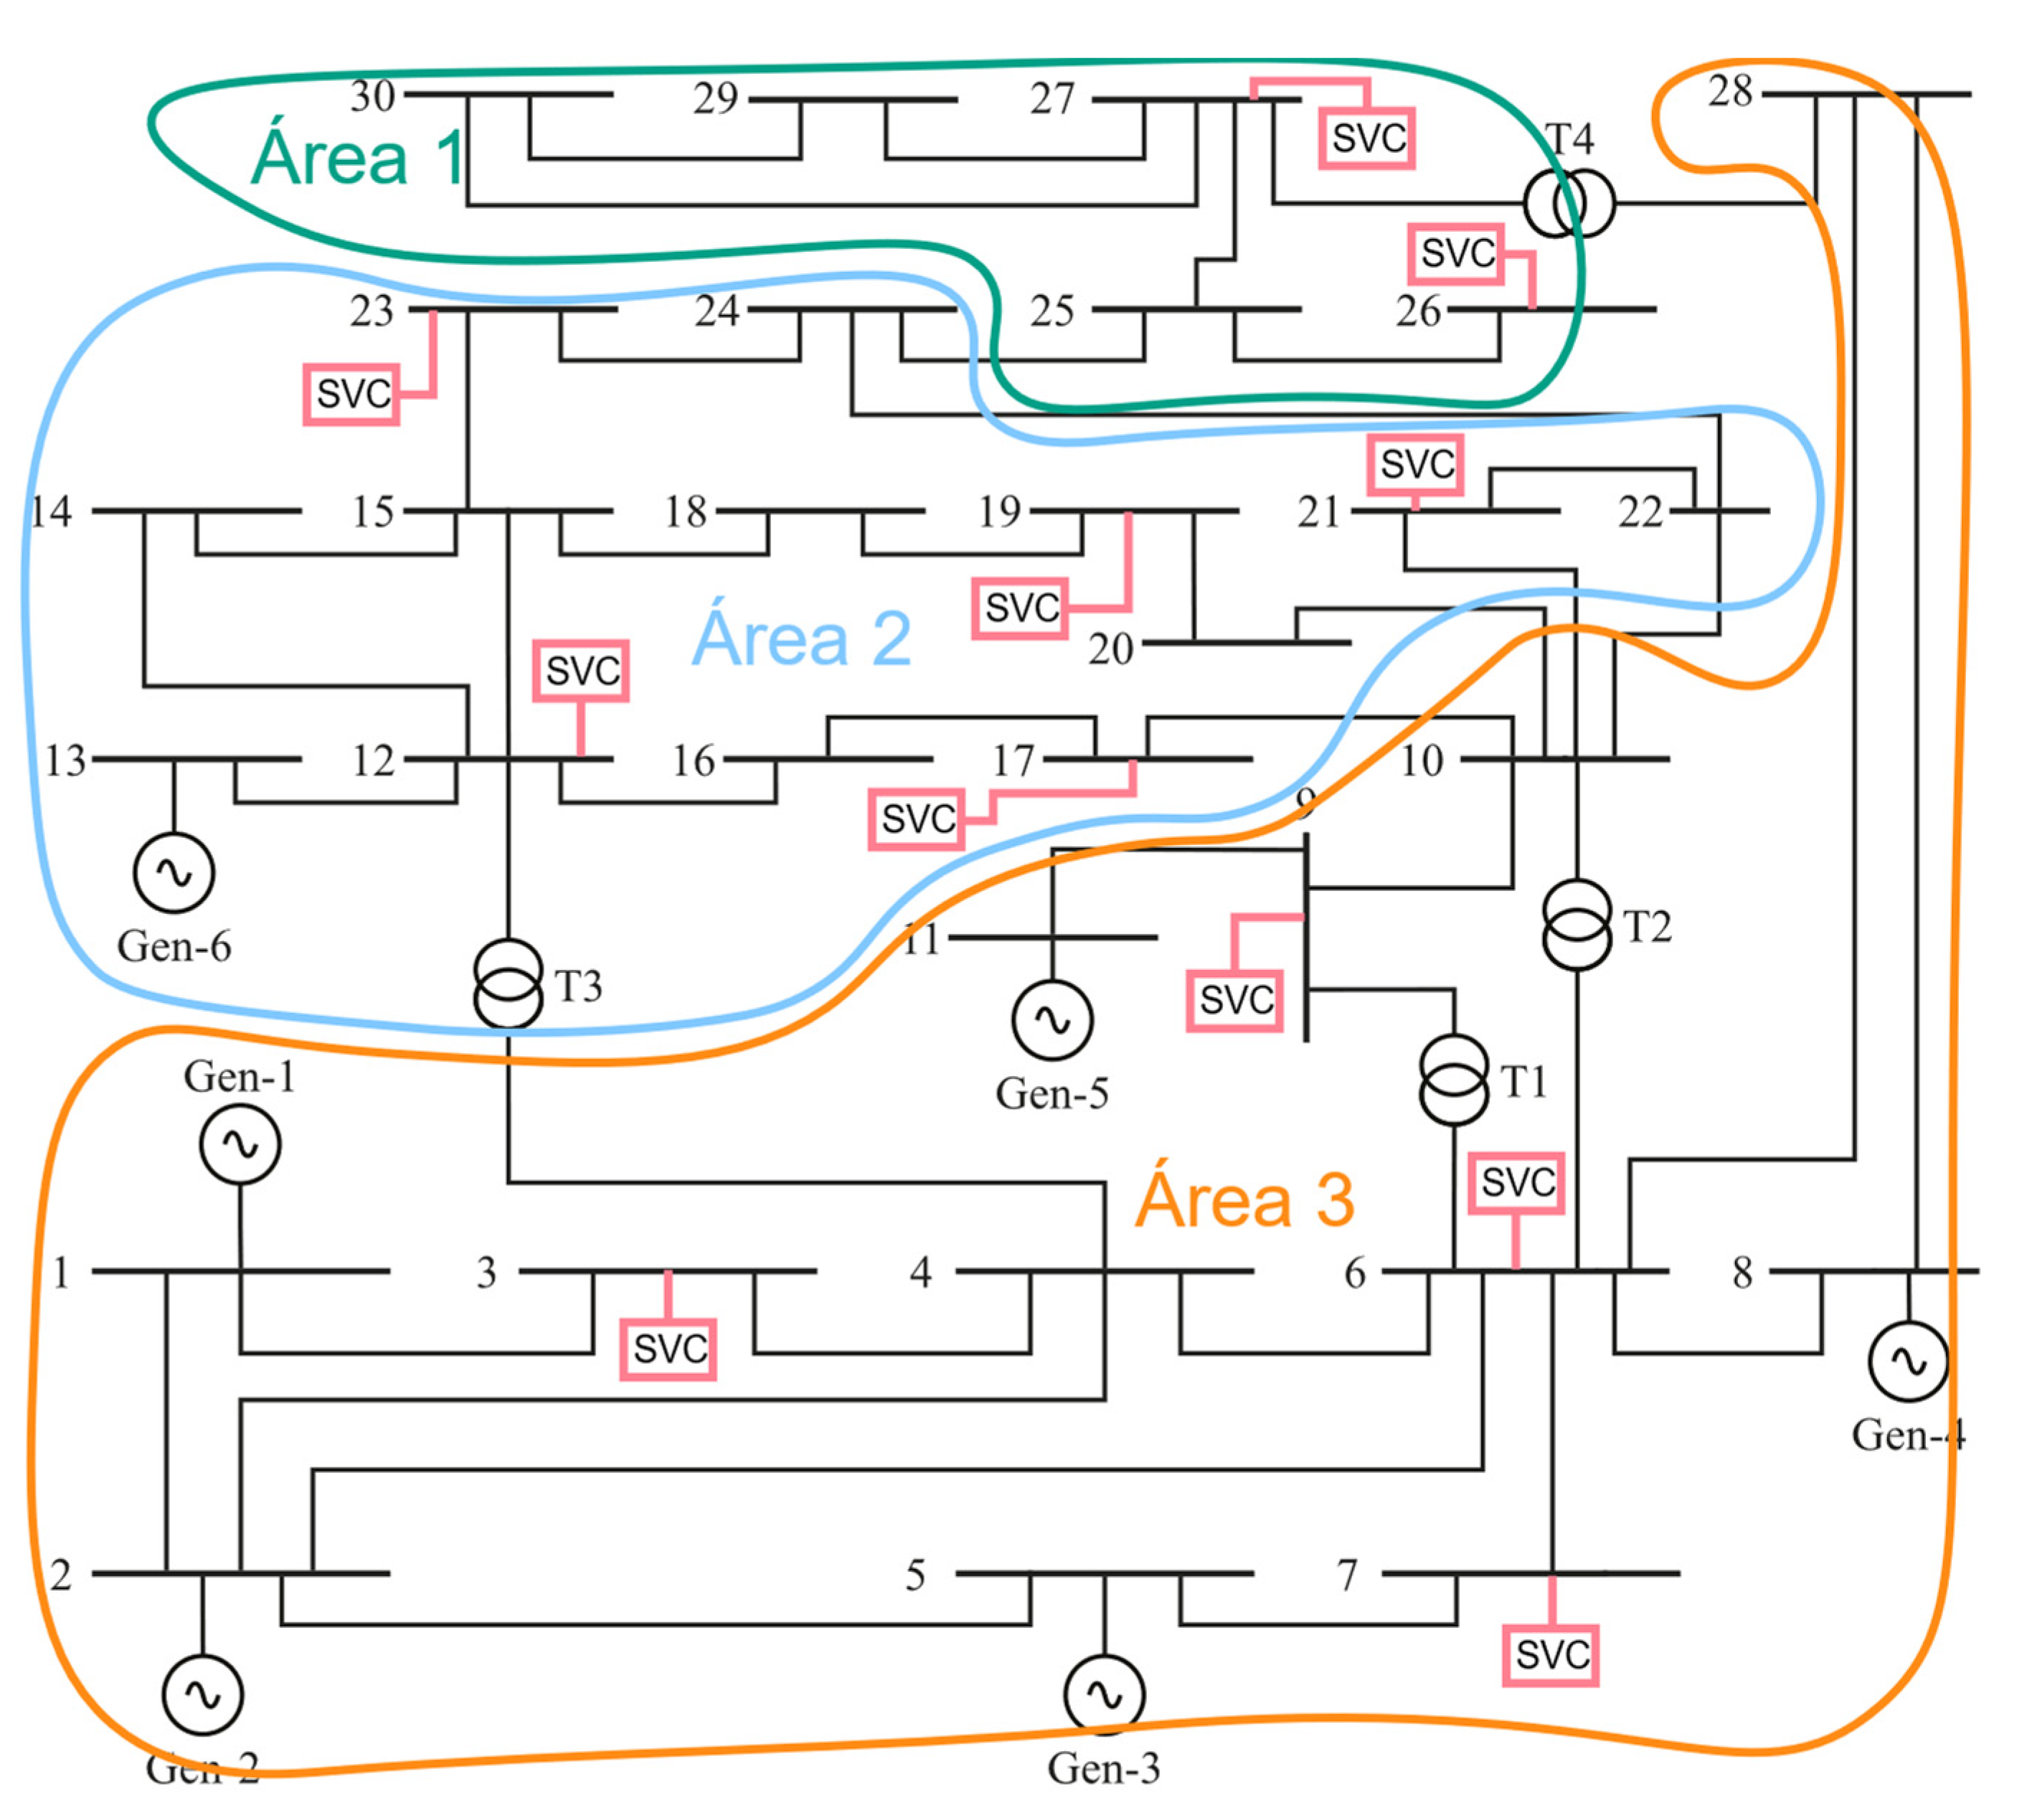
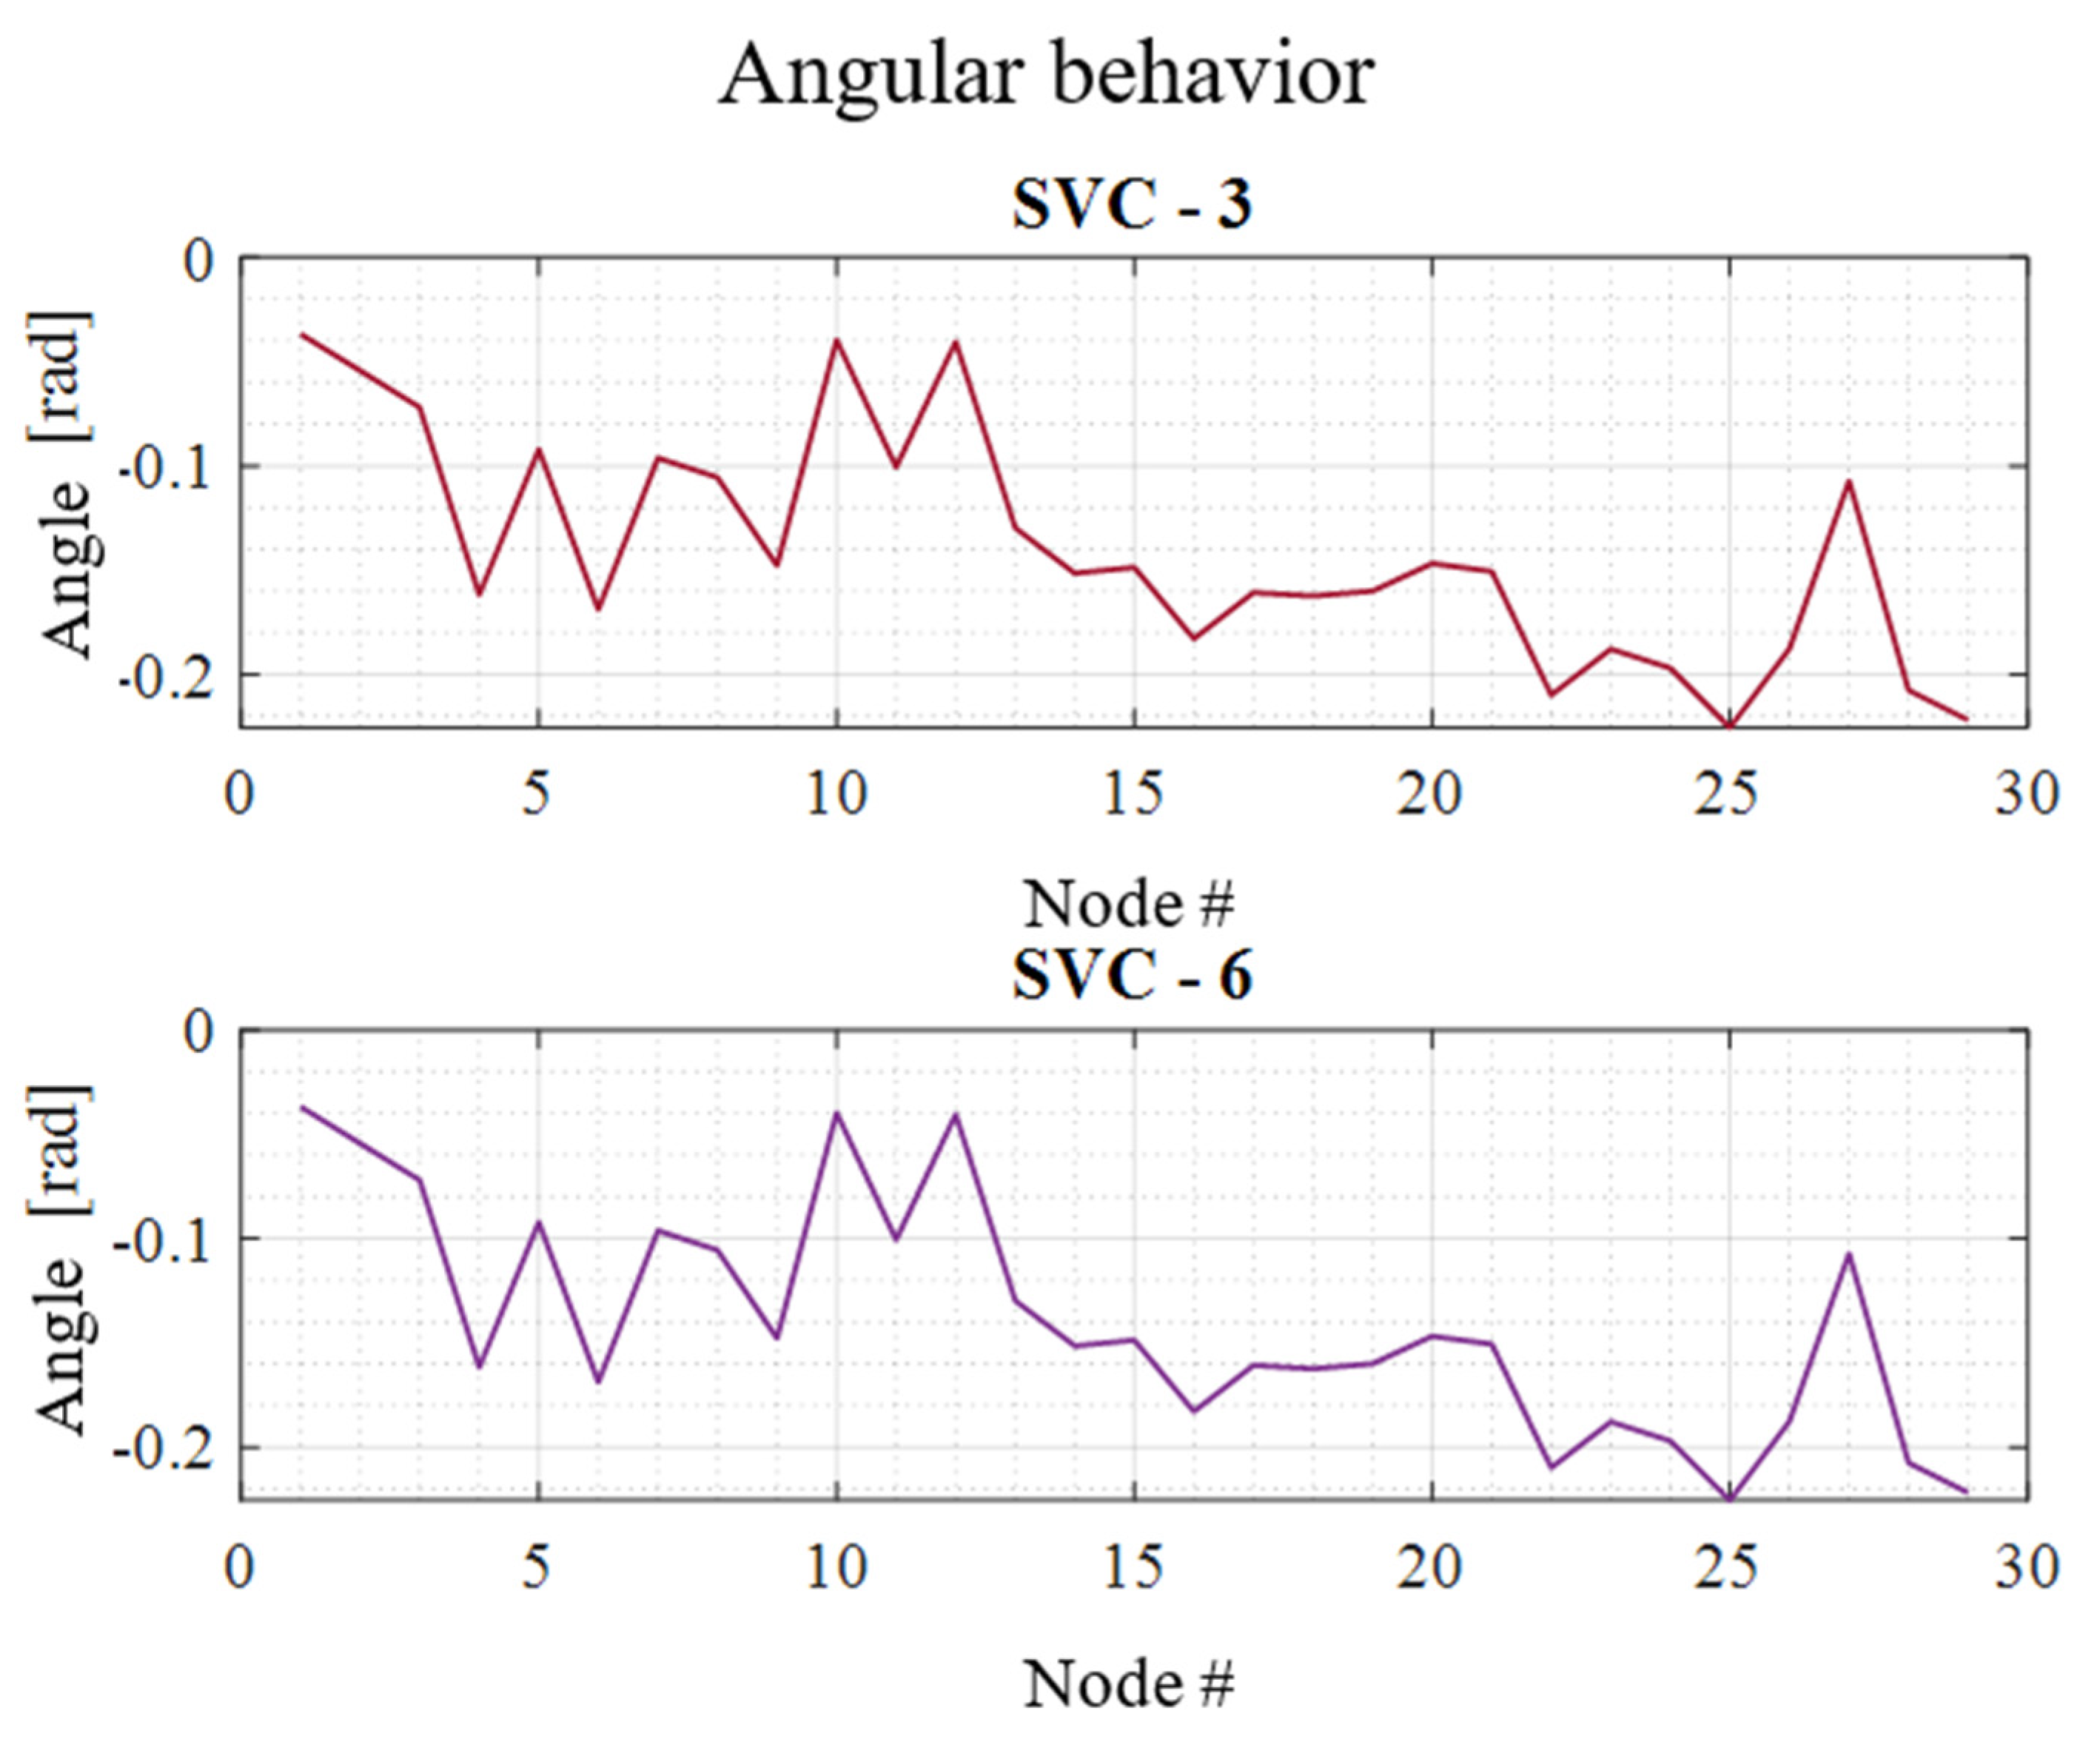
| VCA | Component | Placement of the SVC |
|---|---|---|
| 1 | 12 | - |
| 13 | X | |
| 14 | - | |
| 2 | 6 | - |
| 9 | X | |
| 10 | - | |
| 11 | X | |
| 3 | 1 | - |
| 2 | - | |
| 3 | - | |
| 4 | X | |
| 5 | X | |
| 7 | X | |
| 8 | - |
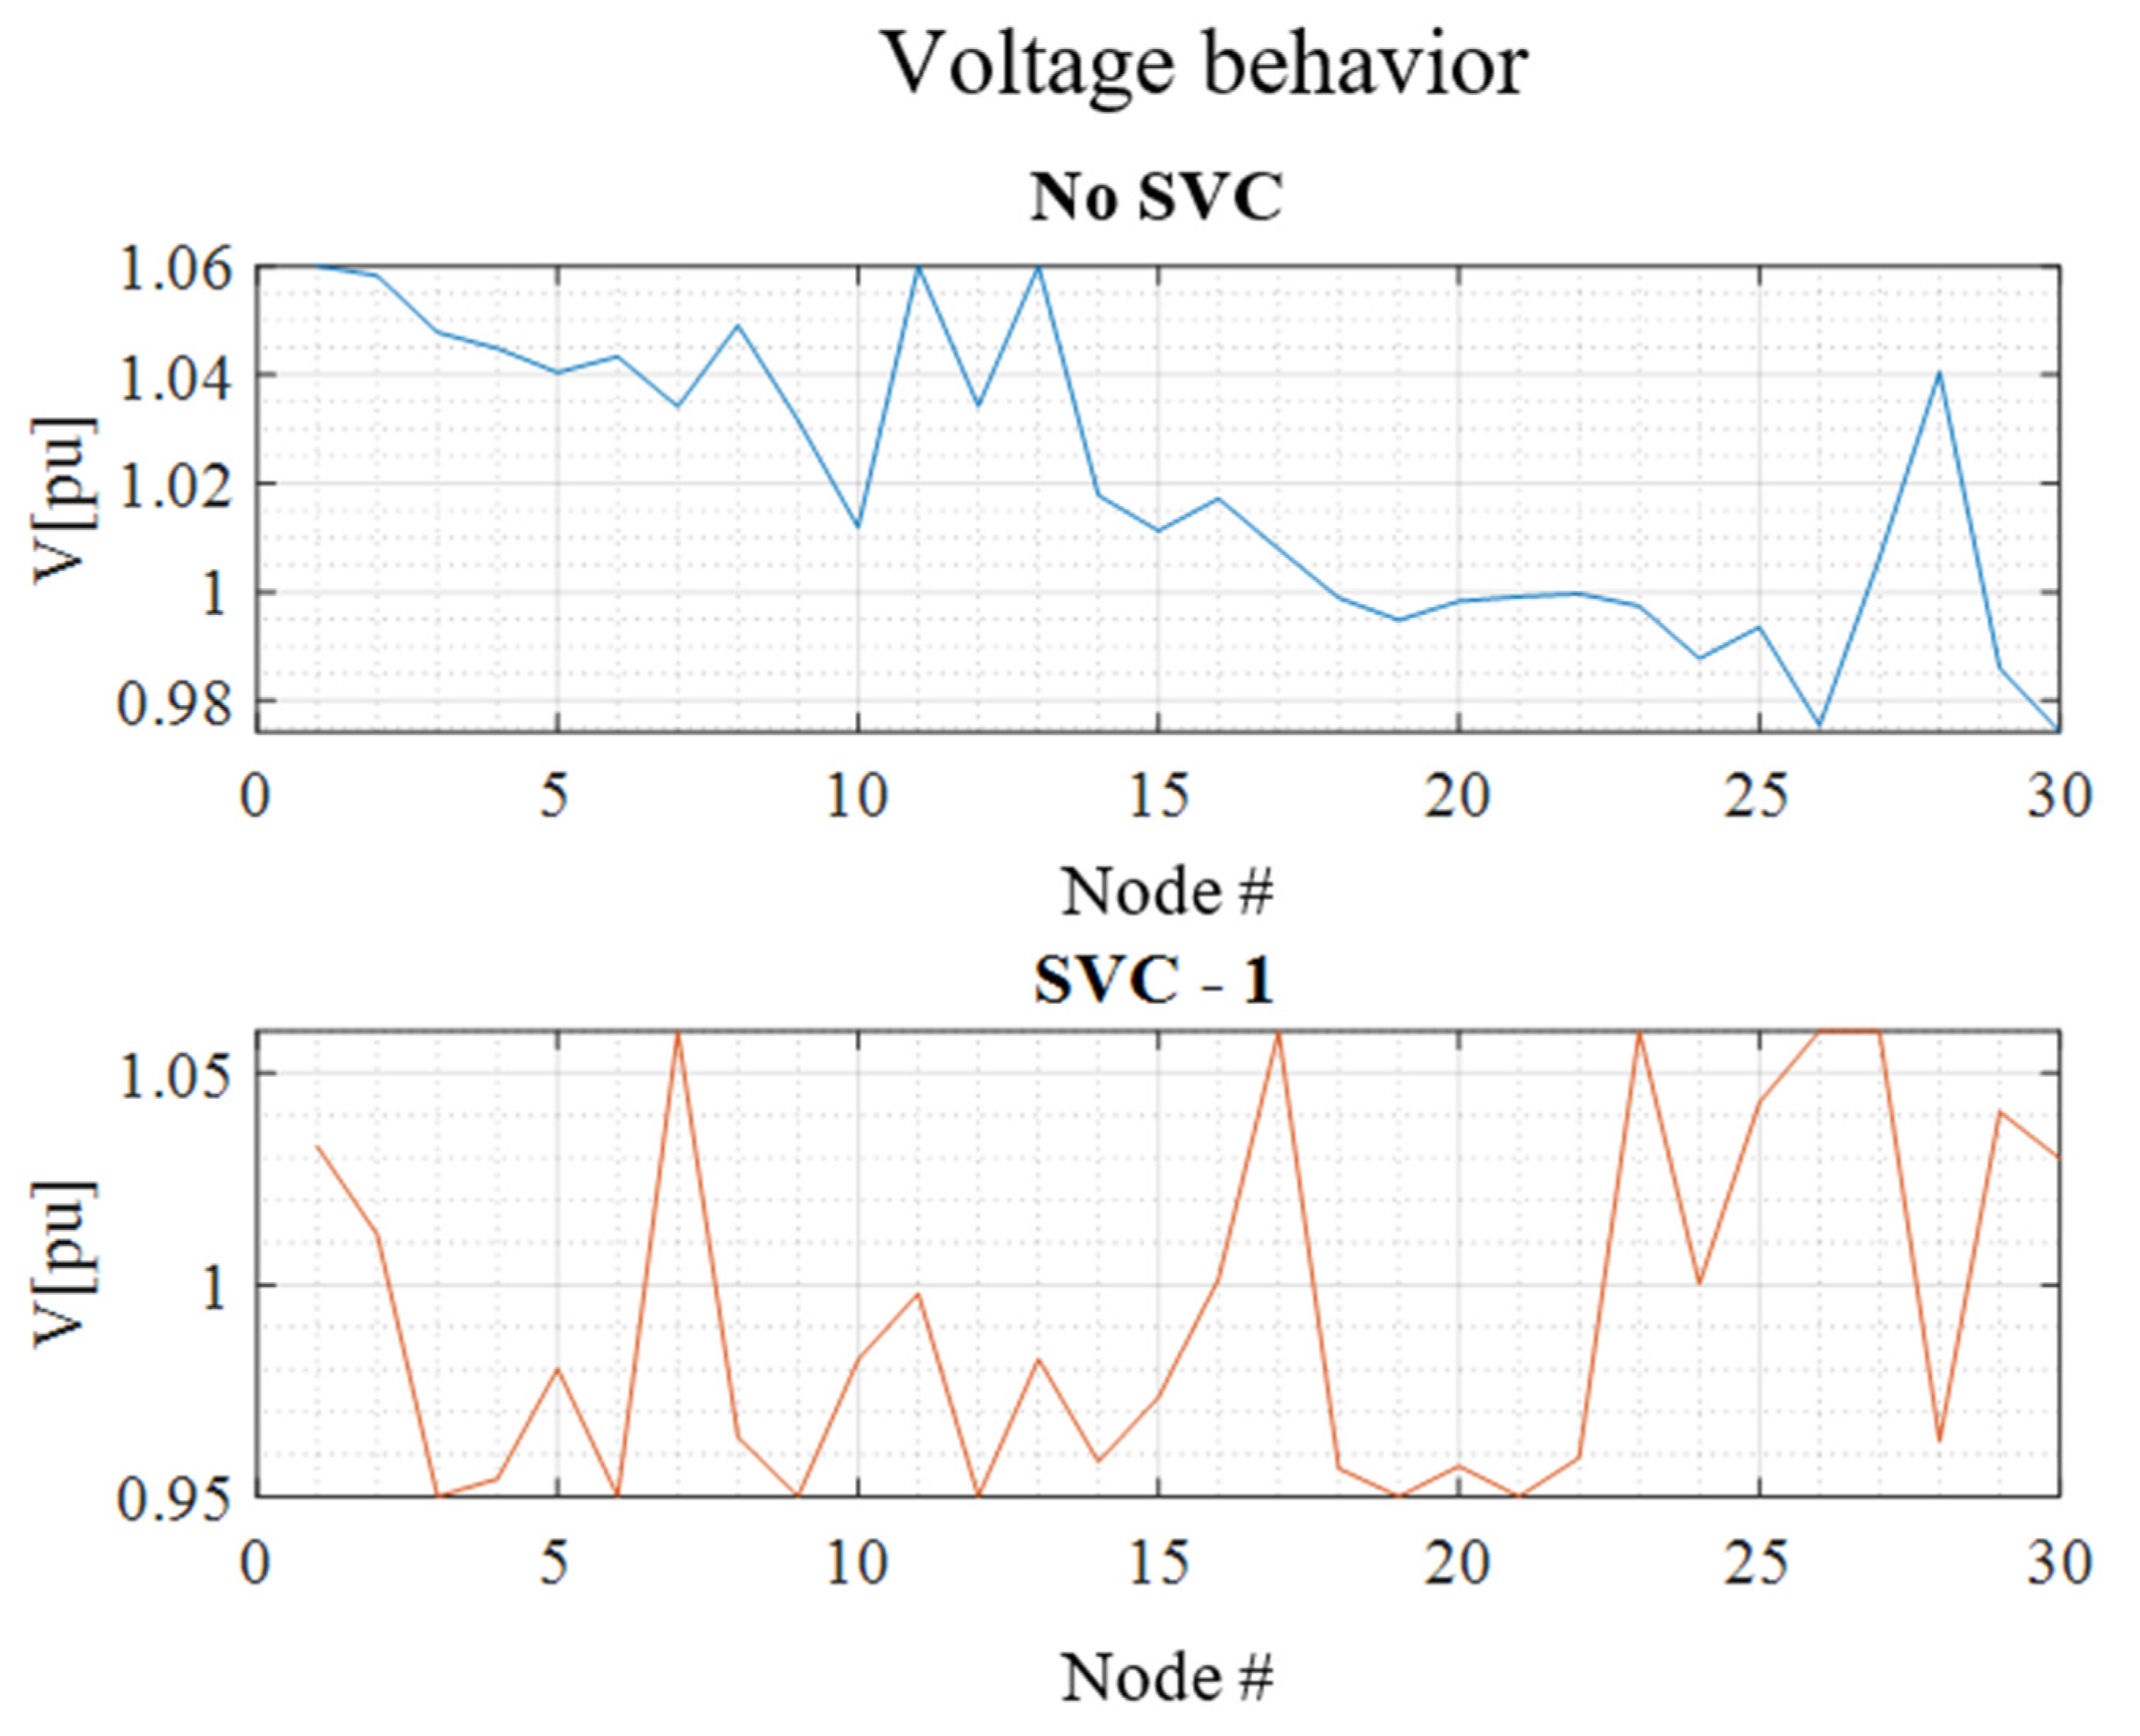
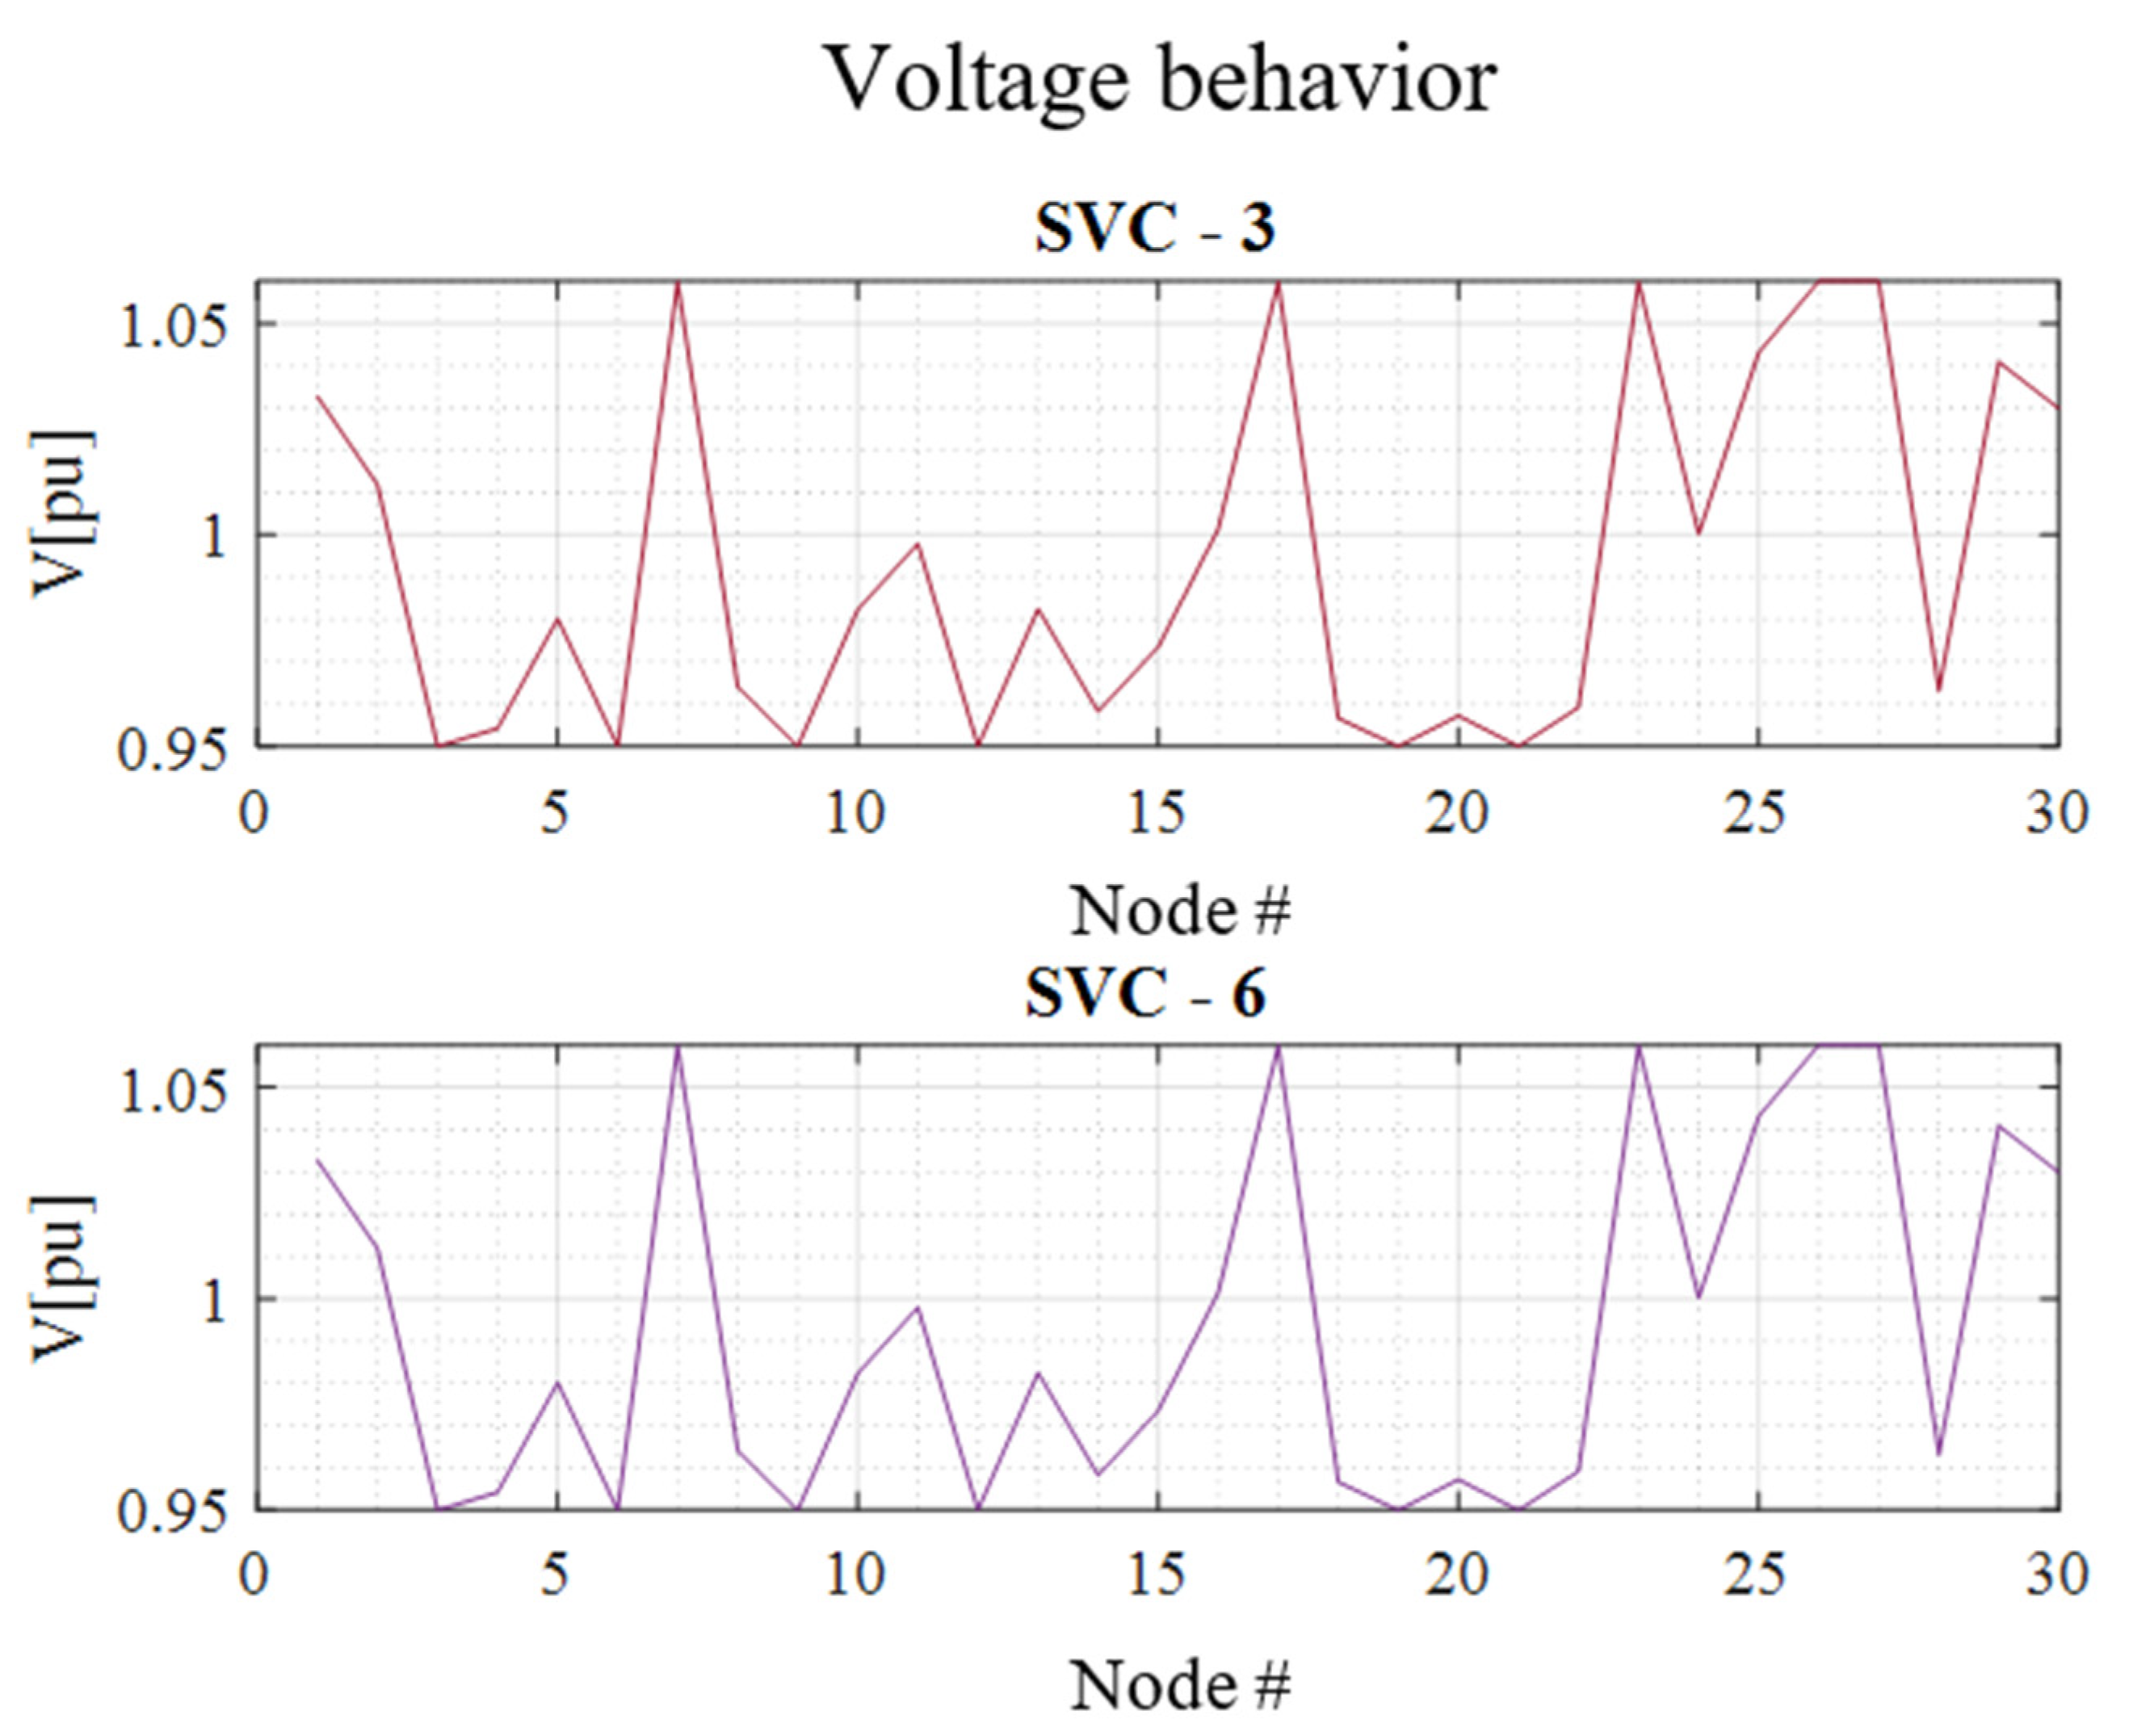
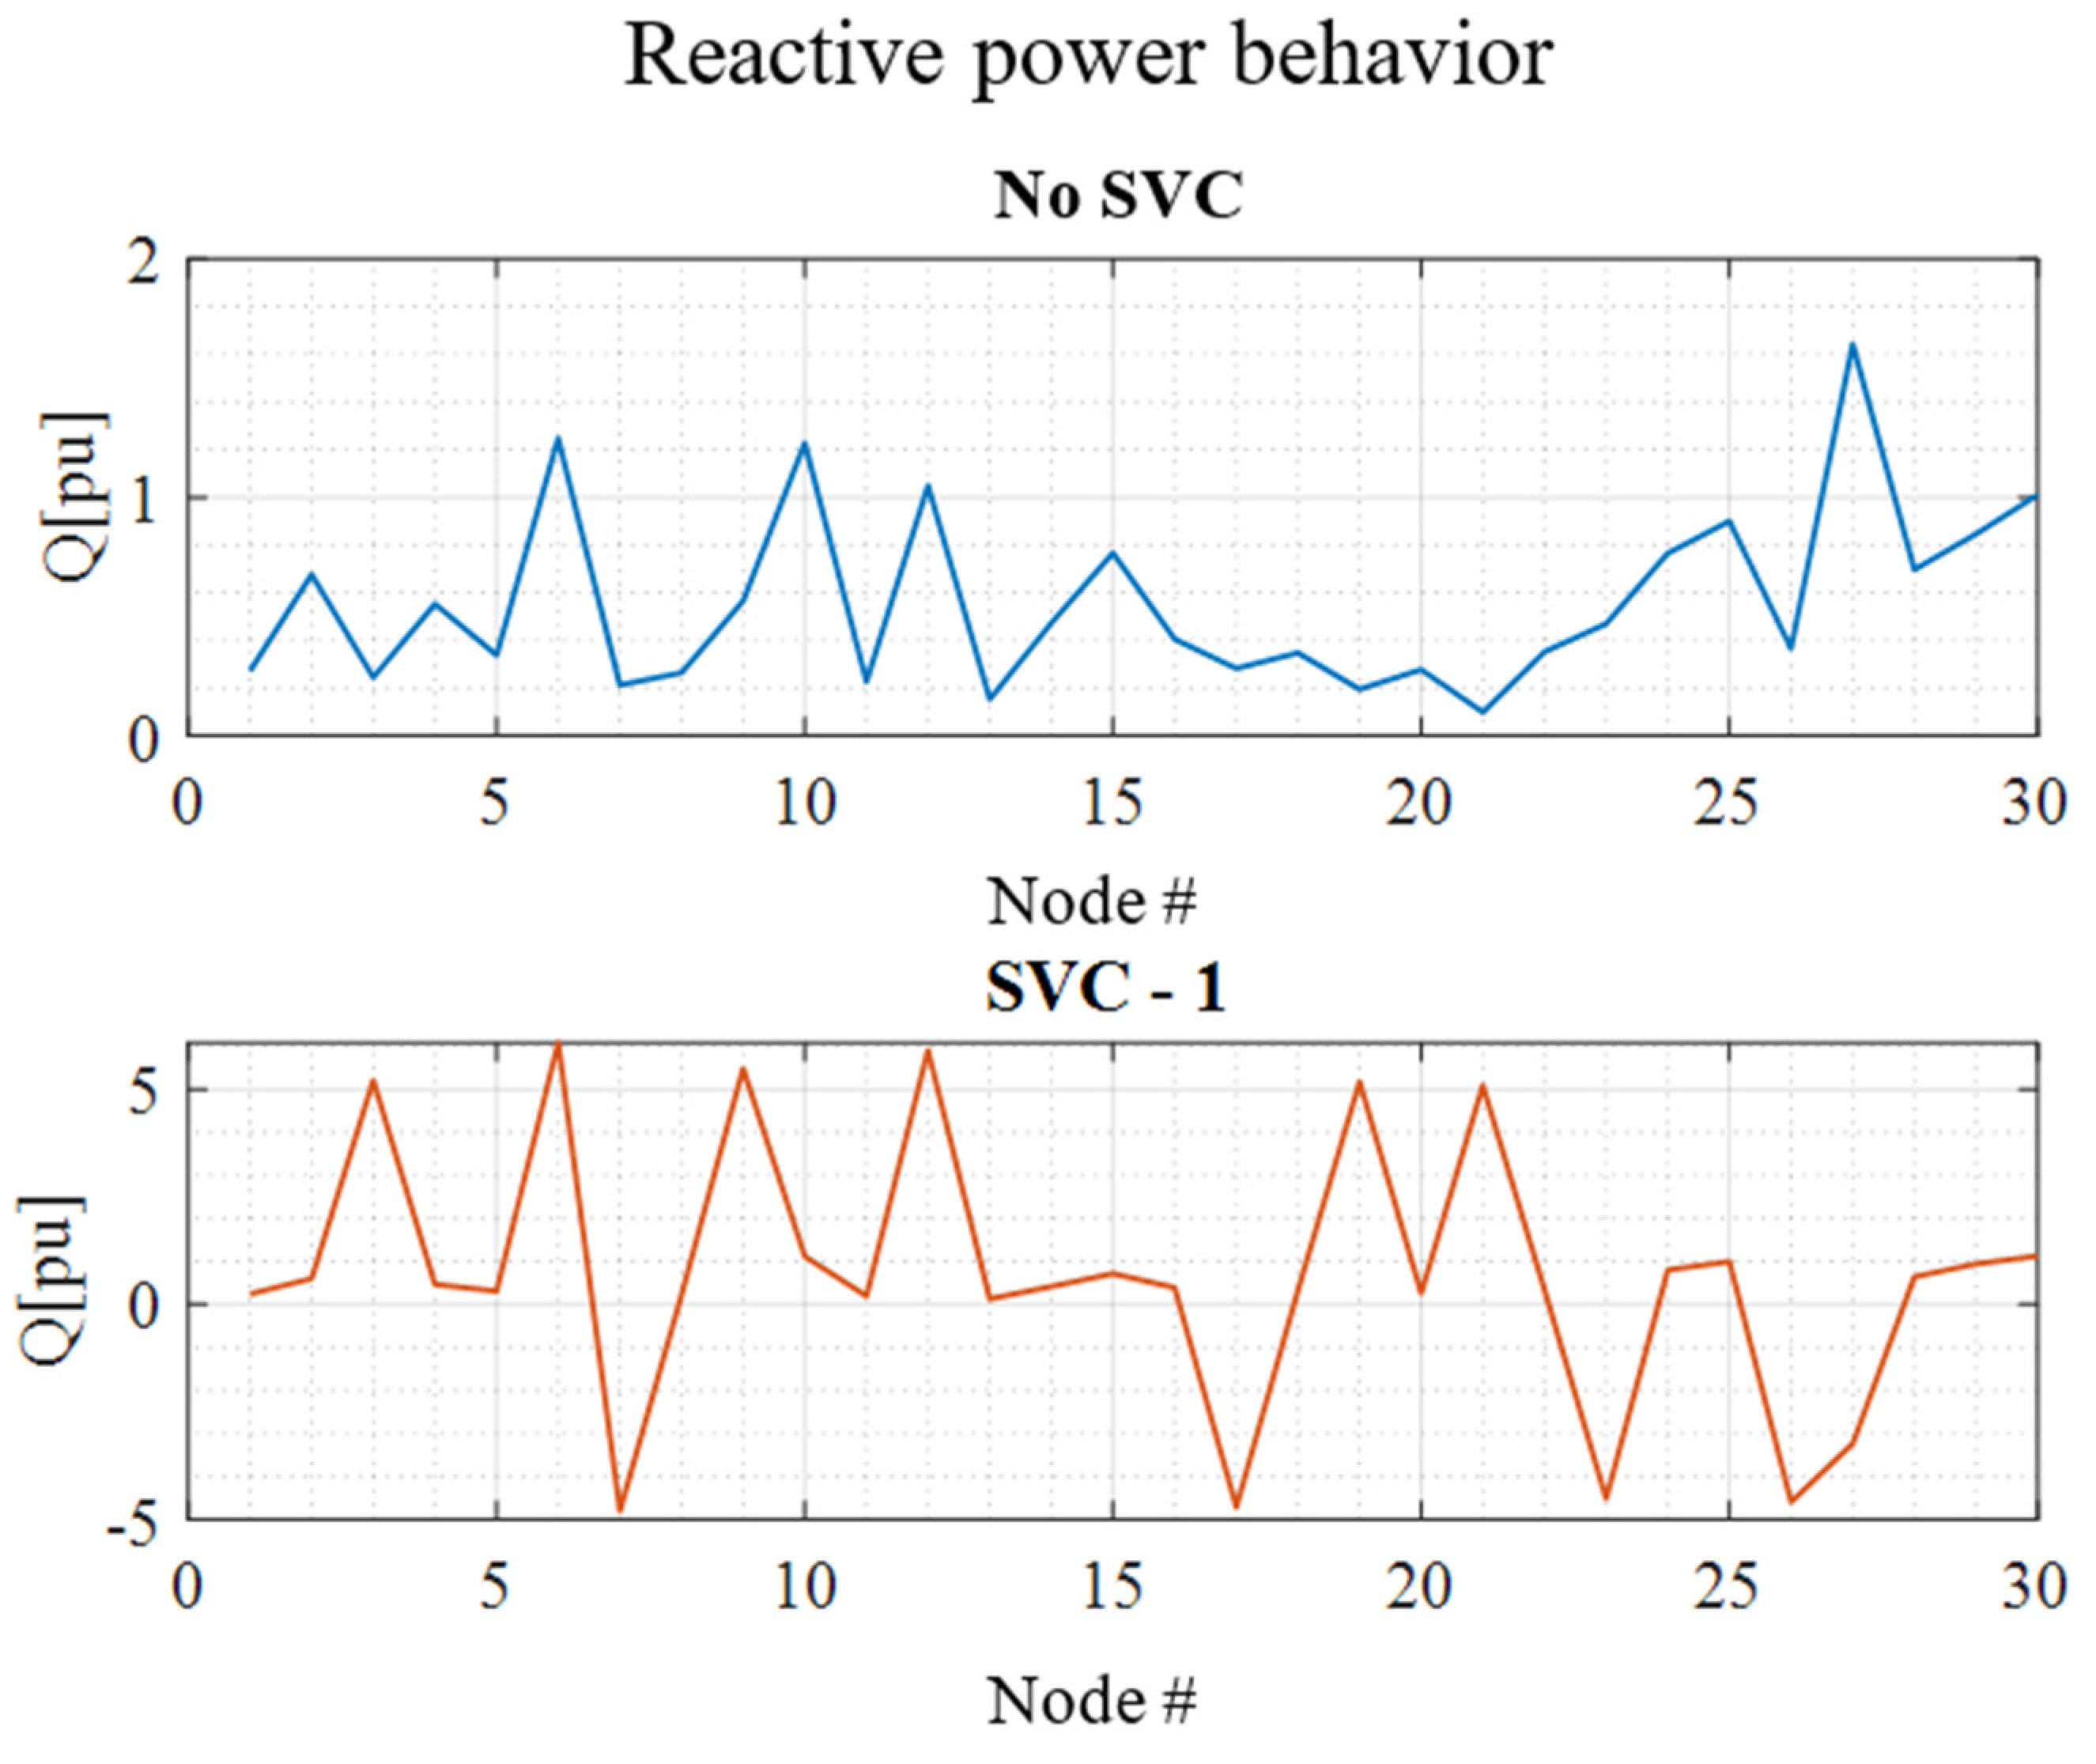
| W/O SVC | SVC (1) | SVC (3) | SVC (6) | ||||
|---|---|---|---|---|---|---|---|
| GAMS | Power Factory | GAMS | Power Factory | GAMS | Power Factory | GAMS | Power Factory |
| 1.060 | 1.060 | 0.996 | 1.060 | 0.996 | 1.060 | 0.996 | 1.060 |
| 1.054 | 1.045 | 0.963 | 1.045 | 0.963 | 1.045 | 0.963 | 1.045 |
| 1.030 | 1.010 | 0.955 | 1.010 | 0.955 | 1.010 | 0.955 | 1.010 |
| 1.036 | 1.019 | 0.950 | 1.018 | 0.950 | 1.016 | 0.950 | 1.013 |
| 1.043 | 1.020 | 1.000 | 1.019 | 1.000 | 1.018 | 1.000 | 1.015 |
| 1.038 | 1.070 | 1.047 | 1.070 | 1.047 | 1.070 | 1.047 | 1.070 |
| 1.029 | 1.062 | 1.009 | 1.060 | 1.009 | 1.057 | 1.009 | 1.053 |
| 1.060 | 1.090 | 1.048 | 1.090 | 1.048 | 1.090 | 1.048 | 1.090 |
| 1.006 | 1.056 | 1.060 | 1.055 | 1.060 | 1.051 | 1.060 | 1.046 |
| 1.003 | 1.051 | 1.055 | 1.050 | 1.055 | 1.046 | 1.055 | 1.041 |
| 1.016 | 1.057 | 1.060 | 1.055 | 1.060 | 1.051 | 1.060 | 1.046 |
| 1.022 | 1.055 | 1.050 | 1.053 | 1.050 | 1.049 | 1.050 | 1.042 |
| 1.015 | 1.050 | 1.060 | 1.049 | 1.060 | 1.045 | 1.060 | 1.040 |
| 0.991 | 1.036 | 1.042 | 1.034 | 1.042 | 1.031 | 1.042 | 1.026 |
| VCA | Component | Placement of the SVC |
|---|---|---|
| 1 | 25 | - |
| 26 | X | |
| 27 | X | |
| 29 | - | |
| 30 | - | |
| 2 | 12 | X |
| 13 | - | |
| 14 | - | |
| 15 | - | |
| 16 | - | |
| 17 | X | |
| 18 | - | |
| 19 | X | |
| 20 | - | |
| 21 | X | |
| 22 | - | |
| 23 | - | |
| 24 | X | |
| 3 | 1 | - |
| 2 | - | |
| 3 | X | |
| 4 | X | |
| 5 | - | |
| 6 | - | |
| 7 | X | |
| 8 | - | |
| 9 | X | |
| 10 | - | |
| 11 | - | |
| 28 | - |
| W/O SVC | SVC (1) | SVC (3) | SVC (6) | ||||
|---|---|---|---|---|---|---|---|
| GAMS | Power Factory | GAMS | Power Factory | GAMS | Power Factory | GAMS | Power Factory |
| 1.060 | 1.060 | 1.033 | 1.060 | 1.033 | 1.060 | 1.033 | 1.060 |
| 1.058 | 1.000 | 1.012 | 0.995 | 1.012 | 0.987 | 1.012 | 0.975 |
| 1.048 | 1.082 | 0.950 | 1.082 | 0.950 | 1.082 | 0.950 | 1.082 |
| 1.045 | 1.025 | 0.954 | 1.022 | 0.954 | 1.017 | 0.954 | 1.010 |
| 1.040 | 1.071 | 0.980 | 1.071 | 0.980 | 1.071 | 0.980 | 1.071 |
| 1.043 | 1.008 | 0.950 | 1.004 | 0.950 | 0.998 | 0.950 | 0.989 |
| 1.034 | 1.001 | 1.060 | 0.997 | 1.060 | 0.990 | 1.060 | 0.979 |
| 1.049 | 1.006 | 0.964 | 1.003 | 0.964 | 0.997 | 0.964 | 0.987 |
| 1.032 | 0.996 | 0.950 | 0.993 | 0.950 | 0.985 | 0.950 | 0.974 |
| 1.012 | 0.988 | 0.982 | 0.983 | 0.982 | 0.973 | 0.982 | 0.959 |
| 1.060 | 0.983 | 0.998 | 0.978 | 0.998 | 0.967 | 0.998 | 0.951 |
| 1.034 | 1.045 | 0.950 | 1.045 | 0.950 | 1.045 | 0.950 | 1.045 |
| 1.060 | 0.987 | 0.982 | 0.981 | 0.982 | 0.971 | 0.982 | 0.956 |
| 1.018 | 0.986 | 0.958 | 0.982 | 0.958 | 0.972 | 0.958 | 0.959 |
| 1.011 | 0.987 | 0.973 | 0.982 | 0.973 | 0.972 | 0.973 | 0.959 |
| 1.017 | 0.985 | 1.001 | 0.980 | 1.001 | 0.970 | 1.001 | 0.956 |
| 1.008 | 0.973 | 1.060 | 0.966 | 1.060 | 0.953 | 1.060 | 0.934 |
| 0.999 | 0.973 | 0.957 | 0.964 | 0.957 | 0.948 | 0.957 | 0.924 |
| 0.995 | 0.954 | 0.950 | 0.942 | 0.950 | 0.918 | 0.950 | 0.884 |
| 0.998 | 0.981 | 0.957 | 0.974 | 0.957 | 0.959 | 0.957 | 0.938 |
| 0.999 | 1.004 | 0.950 | 1.003 | 0.950 | 1.000 | 0.950 | 0.995 |
| 1.000 | 0.961 | 0.959 | 0.953 | 0.959 | 0.938 | 0.959 | 0.916 |
| 0.997 | 1.022 | 1.060 | 1.021 | 1.060 | 1.018 | 1.060 | 1.014 |
| 0.988 | 0.949 | 1.000 | 0.941 | 1.000 | 0.926 | 1.000 | 0.904 |
| 0.994 | 1.014 | 1.043 | 1.013 | 1.043 | 1.011 | 1.043 | 1.007 |
| 0.975 | 1.010 | 1.060 | 1.010 | 1.060 | 1.010 | 1.060 | 1.010 |
| 1.006 | 1.009 | 1.060 | 1.008 | 1.060 | 1.006 | 1.060 | 1.003 |
| 1.041 | 1.001 | 0.963 | 1.000 | 0.963 | 0.998 | 0.963 | 0.994 |
| 0.986 | 1.010 | 1.041 | 1.010 | 1.041 | 1.010 | 1.041 | 1.010 |
| 0.974 | 1.023 | 1.030 | 1.020 | 1.030 | 1.016 | 1.030 | 1.009 |
Disclaimer/Publisher’s Note: The statements, opinions and data contained in all publications are solely those of the individual author(s) and contributor(s) and not of MDPI and/or the editor(s). MDPI and/or the editor(s) disclaim responsibility for any injury to people or property resulting from any ideas, methods, instructions or products referred to in the content. |
© 2022 by the authors. Licensee MDPI, Basel, Switzerland. This article is an open access article distributed under the terms and conditions of the Creative Commons Attribution (CC BY) license (https://creativecommons.org/licenses/by/4.0/).
Share and Cite
Garrido, C.; Aguila Téllez, A.; Ortiz, L. Linear Voltage Stability Indicator (LVSI) for Optimal Placement of SVC Devices to Improve the Voltage Stability Margin in Transmission Systems. Electronics 2023, 12, 43. https://doi.org/10.3390/electronics12010043
Garrido C, Aguila Téllez A, Ortiz L. Linear Voltage Stability Indicator (LVSI) for Optimal Placement of SVC Devices to Improve the Voltage Stability Margin in Transmission Systems. Electronics. 2023; 12(1):43. https://doi.org/10.3390/electronics12010043
Chicago/Turabian StyleGarrido, Christian, Alexander Aguila Téllez, and Leony Ortiz. 2023. "Linear Voltage Stability Indicator (LVSI) for Optimal Placement of SVC Devices to Improve the Voltage Stability Margin in Transmission Systems" Electronics 12, no. 1: 43. https://doi.org/10.3390/electronics12010043
APA StyleGarrido, C., Aguila Téllez, A., & Ortiz, L. (2023). Linear Voltage Stability Indicator (LVSI) for Optimal Placement of SVC Devices to Improve the Voltage Stability Margin in Transmission Systems. Electronics, 12(1), 43. https://doi.org/10.3390/electronics12010043