1. Introduction
Penetration of distributed energy resources (DERs) and especially renewable-based generators is increased because of recent rise in energy demand and environmental issues [
1]. To support some benefits, such as reliability, sustainability, and cost-effectiveness, microgrids (MGs) were proposed to aggregate DERs and loads with distribution networks [
2]. Due to the rapid development of microgrids in distribution systems, the multi-microgrid (MMG) concept is proposed concerning the interaction and energy exchange among MGs [
3].
The energy management of MMGs has turned into a challenging topic in the literature. In [
4], a chance-constrained model was proposed for solving the probabilistic optimal energy management of MMG systems. The authors did not yet investigate the efficiency of their model on the emission of greenhouse gases. Penetration of renewable energy sources (RESs) on the performance of the islanded MMG systems was studied in [
5]. Though, the cost allocation among MGs, emission of greenhouse gases, and energy not supplied (ENS) were not investigated. The authors of [
6] suggested the epsilon constraint method and fuzzy model to define the best plan for the energy hubs in solving the multi-objective optimization for water management of a MMG system. Nevertheless, the uncertainties of RESs and demand response programs were not considered. To model the interaction among MGs, a cooperative energy planning was presented in [
7]. The uncertainties of RESs were not considered in the model. Some authors proposed a probabilistic scheme in [
8] to deal with the energy exchange among MGs. However, the efficiency of the cooperation MGs was not investigated. A cooperative game for short-term energy probabilistic planning of the MMG systems was proposed in [
9] while modeling the uncertainties of RESs. However, the authors did not consider emission in their model.
A cooperative energy-management framework for “networked multi-carrier systems” was proposed in [
10]. The authors, however, did not study the uncertainties of RESs. In [
11], an optimal energy-management framework was suggested for the hybrid MMG system. To fairly divide profit among MGs, a cooperative game was applied. An energy trading approach based on the cooperative game was employed in [
12]. However, uncertainties were not considered in the model.
In [
13], a “two-stage multi-objective optimization” approach was suggested for optimal energy management of MMG systems. The objective functions were minimizing the total cost, energy not supplied (ENS), and greenhouse gas emissions. However, the uncertainties were not studied in the suggested framework. A cooperative game was proposed in [
14] to determine the best coalition among microgrids in MMG systems. The problem was considered as a single-objective problem considering cost minimization as the objective function. In addition, the uncertainties of RESs were not considered in the problem.
“A two-stage stochastic programming” method was proposed in [
15] for MMG management considering reliability and the emission of the system. The suggested two-stage stochastic optimization strategy in [
16] considered capital and operational costs in the optimal design and operation of MMG systems. In [
17], the flexibility of MMG system operation was improved through “mobile energy storage systems and power transactions.” To consider energy management of MMGs, some authors studied the uncertainty caused by random electric vehicle charging in [
18]. The objective functions were reducing line loss, the generated emissions and minimizing cost. The authors in [
17,
18,
19,
20] did not investigate an optimal offering of MGs for energy transactions with the distribution system in the considered MMG energy management.
A “software-defined networking system” was presented in [
19] to promote energy sharing among MGs through a transactive energy framework. The suggested approach resulted in reducing the total cost of the MMG system. A chance-constrained model was applied in [
20] for optimal day-ahead scheduling of a MMG considering emissions of the system. However, optimal bidding strategy and demand response program were not studied. A “risk-constrained stochastic mixed-integer linear programming (MILP) model” was presented in [
21] for “optimal bidding strategy of a CHP-based MMG system” considering environmental restrictions and demand response programs.
In [
22], a robust decentralized energy-management approach was proposed for the optimal day-ahead scheduling of a MMG system in the presence of hydrogen refueling stations and EV parking. A two-stage probabilistic optimization framework for day-ahead scheduling of MMG systems was proposed in [
23] to minimize the total operational cost. Applying a variable weighted multi-objective function in [
24], the authors presented a coordinated energy-management approach for optimal operation of MMG systems. The “targeted search shuffled complex evolution optimization algorithm” was then proposed to optimize decision parameters in faulted and normal operation modes. A “stochastic contingency-constrained energy and reserve scheduling model” was presented in [
25] for an islanded P2H- equipped MMG considering demand response program. “A multi-period optimal energy scheduling for MMGs integrated with an urban transportation network” was suggested in [
26] which was facilitated by “peer-to-peer communication of transactive energy information among the agents”.
The main advantages of using meta-heuristic algorithms in solving multi-objective problems are reviewed in the literature [
1,
2]. Different meta-heuristic algorithms were applied in solving a variety of multi-objective problems [
27,
28,
29,
30,
31]. In [
27], a multi-objective memetic search algorithm (MMSA), was suggested to solve the multi-objective permutation flow shop scheduling problem (MOPFSSP). An improved particle swarm optimization (PSO) algorithm with the continuous high-degree Bezier curve was proposed in [
28] for solving the problem of smooth path planning for mobile robots. A combination of the whale optimization algorithm (WOA) and PSO was presented in [
29] to tackle the problem of the optimal placement of motion sensors in smart homes and intelligent environments. A multi-objective genetic algorithm (GA) was proposed in [
30] to optimize multiple design metrics of a stand-alone PV/battery system. The purpose-oriented shuffled complex evolution (POSCE) algorithm was suggested in [
31] for solving of energy management of MMG systems for both faulted and normal operation modes.
In this paper, a multi-objective JAYA (MJAYA) algorithm is proposed to investigate the optimal power management in interconnected MMG systems. The burdensome tuning procedure of controlling algorithmic parameters is not required in JAYA algorithm that makes it superior when compared to all other algorithms [
32]. In short, the major advantages of the proposed MJAYA algorithm are fast convergence and low computational time as well as its ability to independently control the algorithmic parameters [
32,
33,
34]. Due to the inherent uncertainties of RESs besides the fluctuations of load demand and electricity price the operation and power management of MMG systems have become complex [
35]. Consequently, different strategies have been conducted to analyze the stochastic operation of MGs [
36]. To consider the uncertainties related to the forecasted values of load demand, market price and the available outputs of RESs, the unscented transformation (UT) method is employed. UT method is time-efficient and very accurate in solving problems with high data rates [
35,
36,
37]. To investigate the stochastic optimal power management in inter-connected multi-microgrid systems UT-MJAYA is proposed in this paper. The validity of the suggested UT-MJAYA algorithm in solving probabilistic power management of MMG systems is verified by implementing the algorithm on a grid-connected MMG system of
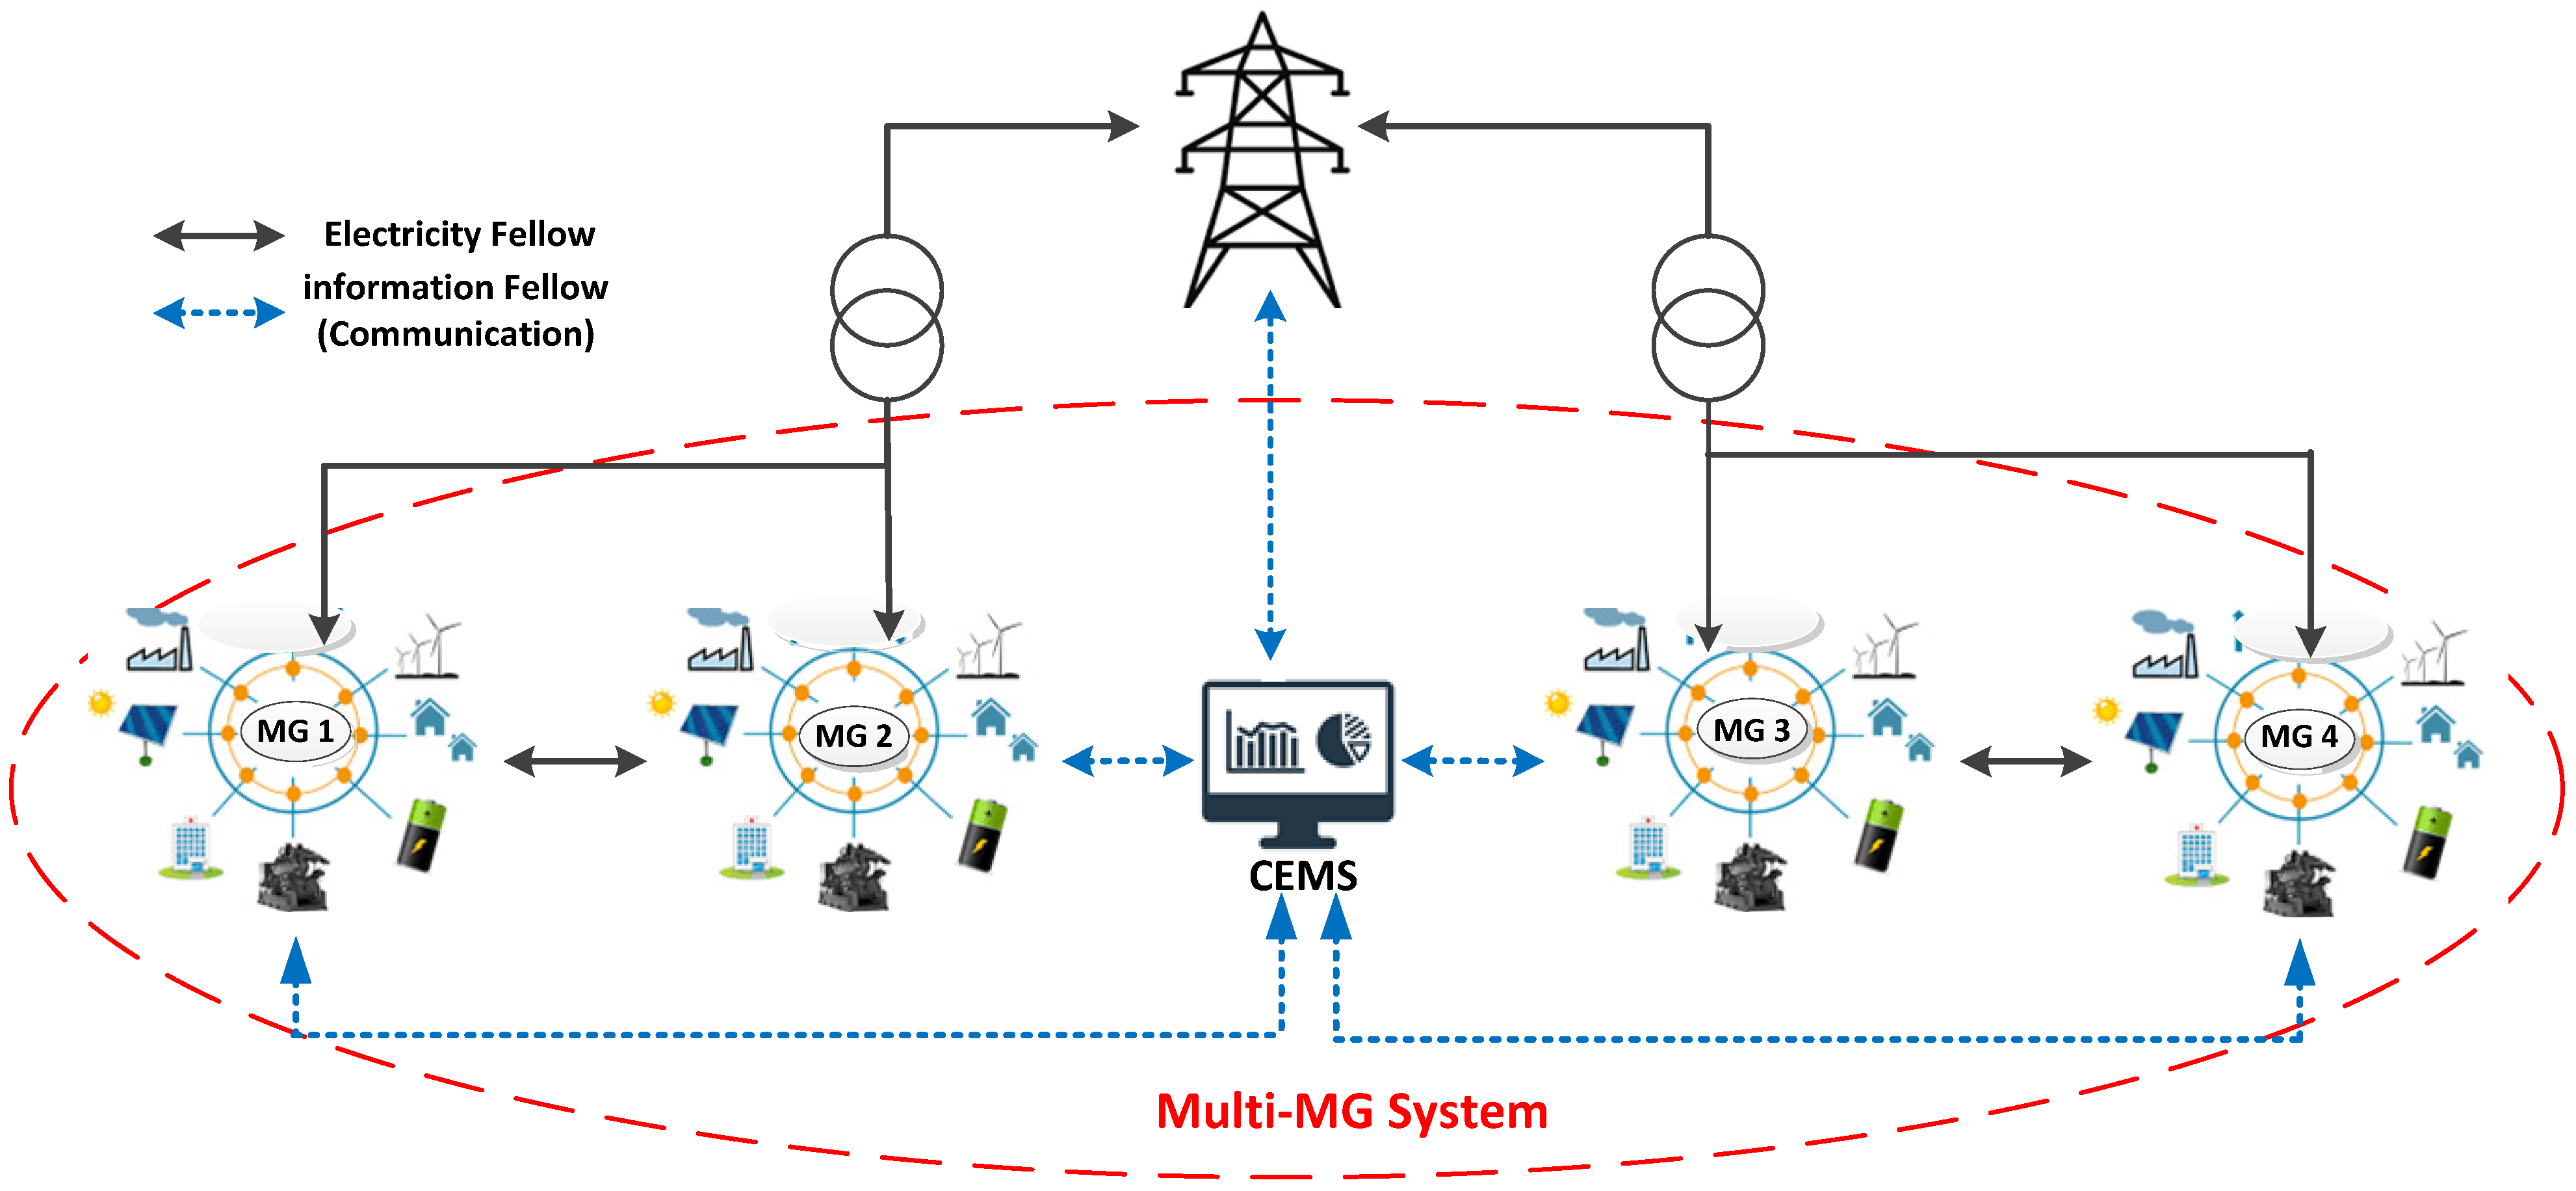
Figure 1, including four interconnected MGs.
The main contributions of this paper are summarized as follows:
The proposed UT-MJAYA algorithm can appropriately deal with multi-objective stochastic power management of MMG systems, while considering conflicting objectives;
The suggested optimal power management strategy aims to minimize the total cost of day-ahead market transactions and fuel costs, while it is also intent on minimizing emission of the system;
The uncertainties related to the forecasted values of the load demand, electricity price, and the available outputs of RESs are considered and investigated competently applying the presented UT-MJAYA algorithm;
Since in the considered problem of optimal power management of MMGs the generations of renewable energies (i.e., wind and photovoltaic) as well as the load demand and electricity price are correlated, the correlation between these uncertain variables are considered; and
By maximizing the utilization of RESs in the considered region, the suggested approach concentrates on the reduction of dependency of the MMG system on the main grid and the electricity market.
2. Problem Formulation
Figure 1 shows the considered MMG system, which consists of four MGs. According to
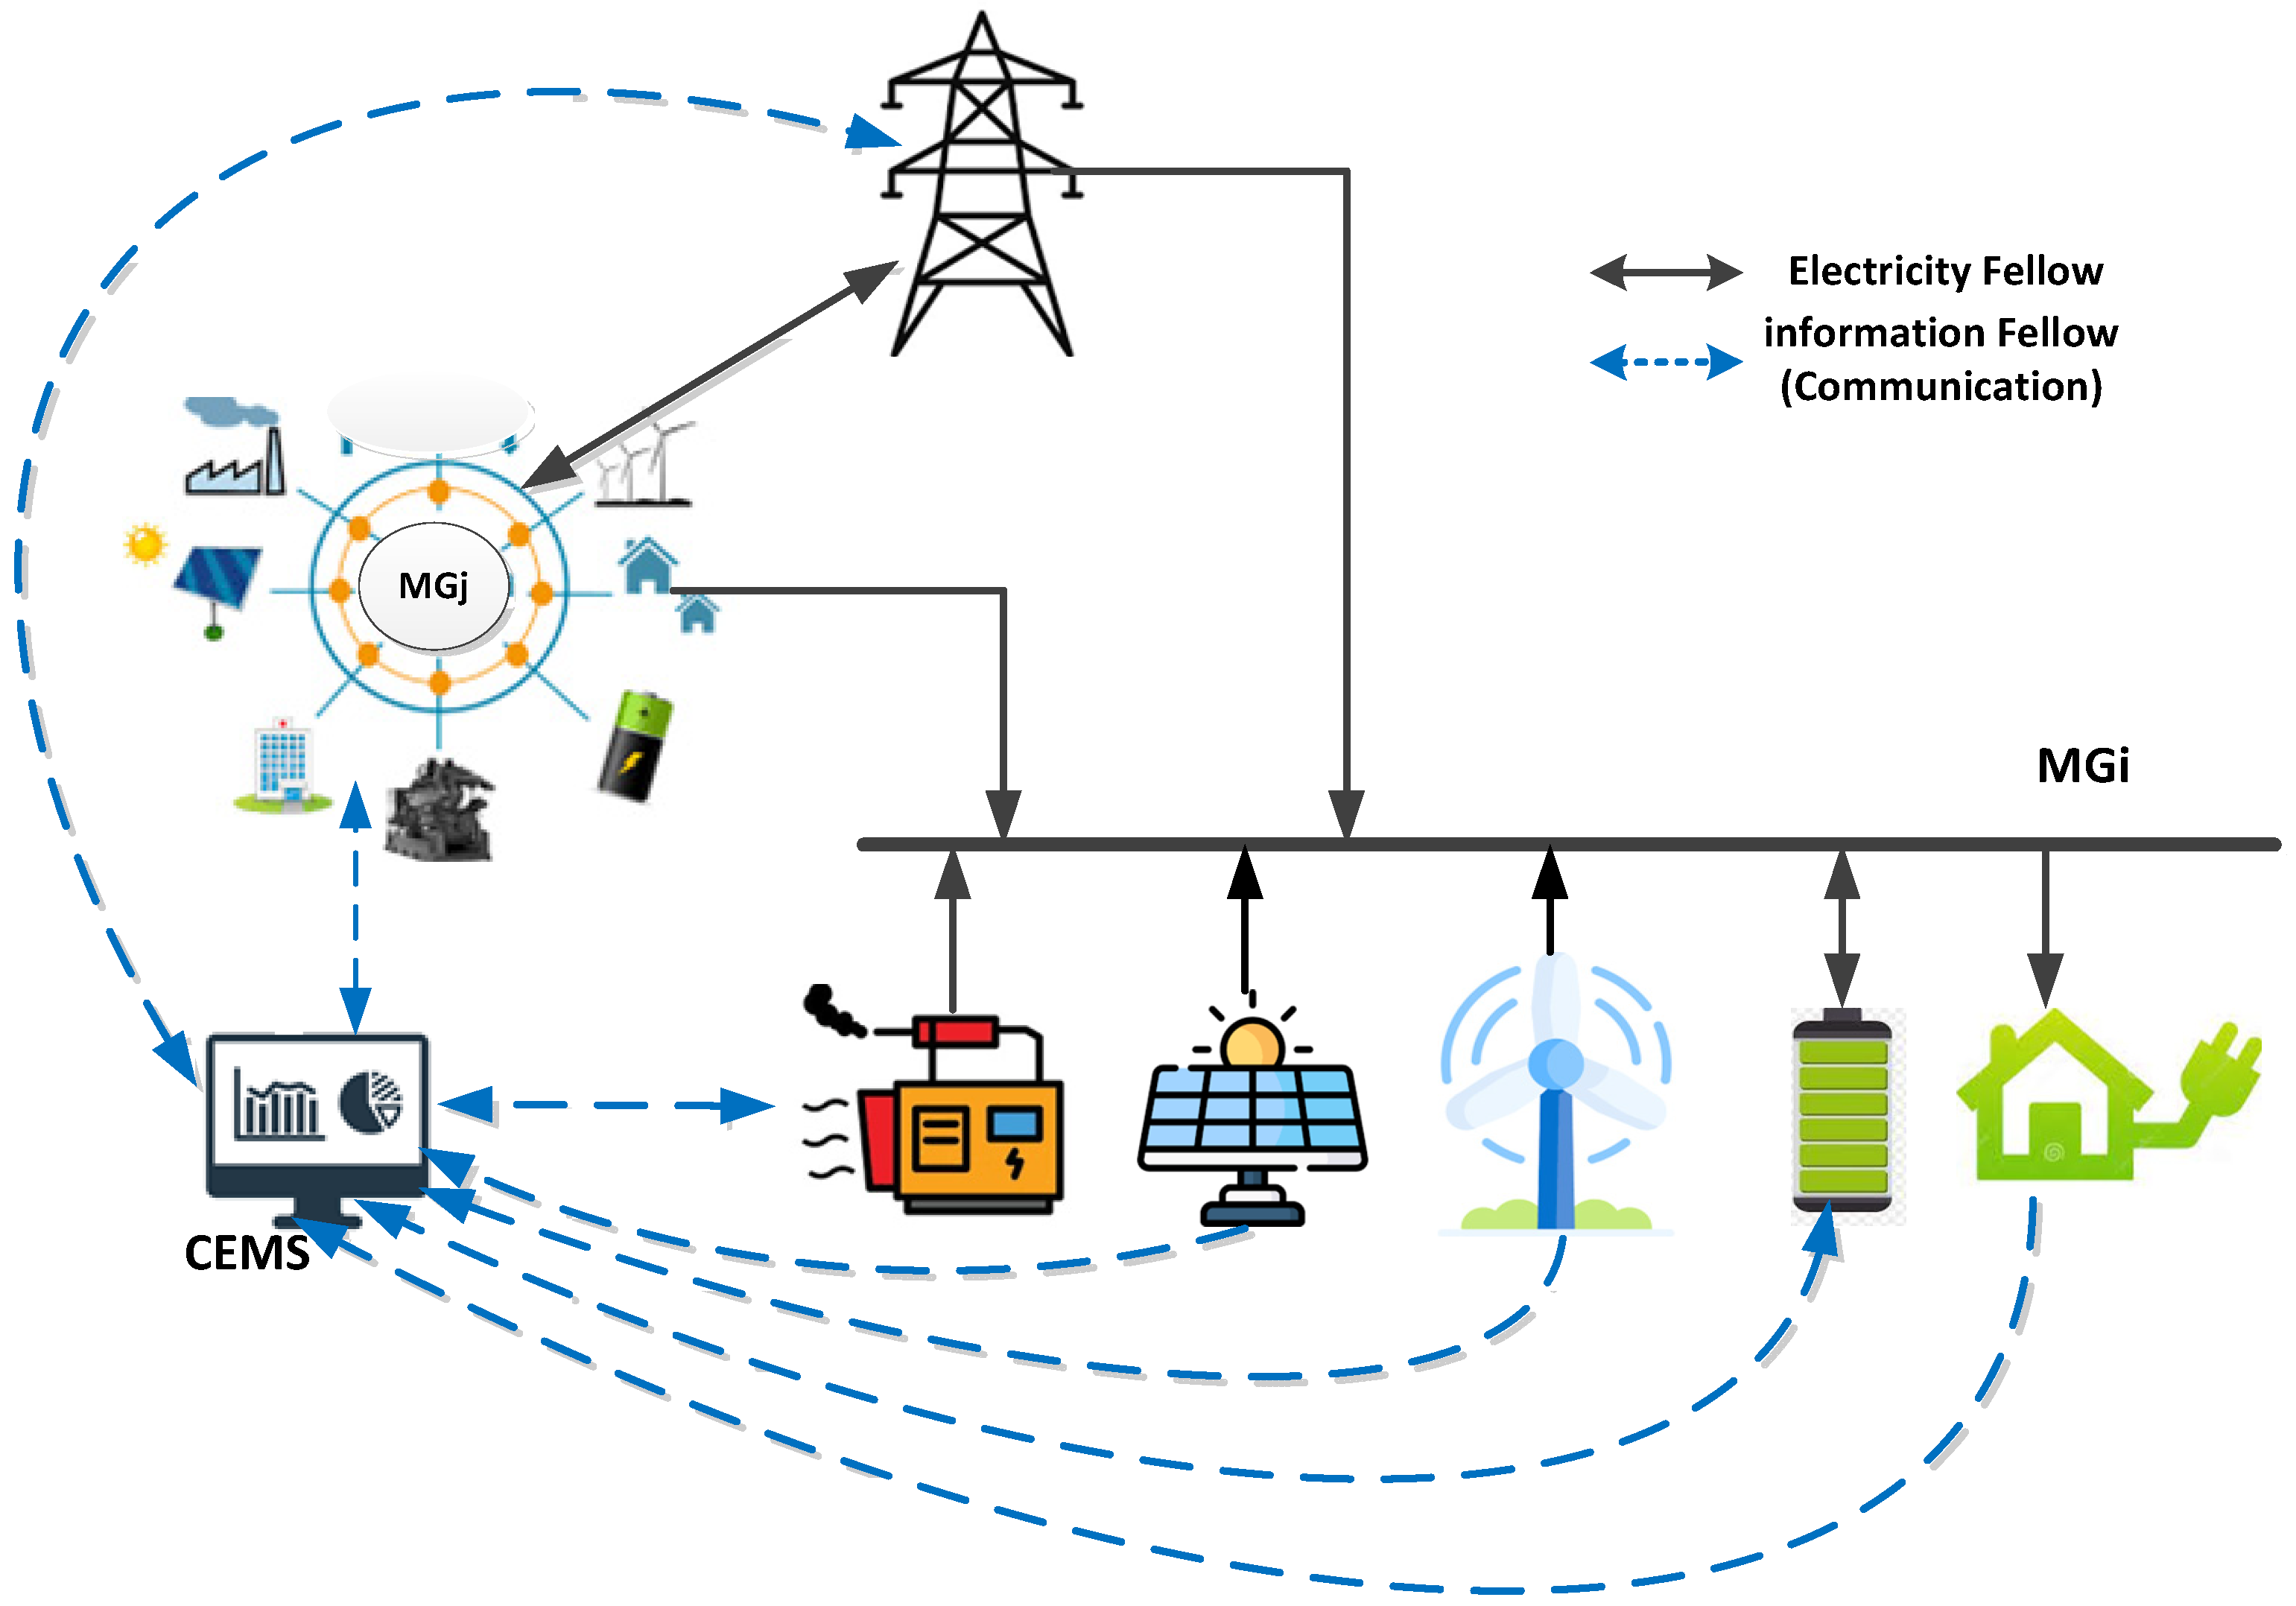
Figure 2, each MG includes dispatchable (i.e., fossil fuel-based units, which includes diesel generators) and non-dispatchable (wind turbine (WT) and photovoltaic (PV) system) units as well as energy storage (ES) device and local loads. The central energy-management system (CEMS) as a central controller collects information of power consumption and generation as well as ES states and sends commands to the dispatchable units. Decisions and orders can be transferred through information links. considered that the MGs in the MMG system are close to each other to be controlled by one EMS without encountering any problem in the information flow among MGs and the CEMS.
Stochastic optimal power management of MMG system is solved for 24-h day-ahead. The outputs include the total produced and consumed power of each MG in the MMG, the produced power of each dispatchable unit, the rate, and hours of charging/dis-charging of batteries, the power sharing among the MGs and the hourly power shared between the MMG and the main electricity grid. Moreover, since in the operation of MMG it is aimed to use the maximum produced and achievable power of renewable-based units (WT and PV) CEMS should accurately forecast the available power of WT and PV units. Additionally, since there exist local loads in each MG and due to the power sharing between the MMG and the electricity grid CEMS should decide on an accurate and proper strategy based on load demand and the electricity price while considering the uncertainties. Accordingly, the stochastic optimal power management of MMG problem is considered as a bi-objective optimization problem for minimizing the operational cost and emission.
2.1. Minimizing the Operational Cost
The first objective is to minimize the total operational cost in the power management of an MMG. The total cost consists of the cost of diesel generators plus the cost of power sharing between the MMG and the electricity grid, which is modeled as (1). The CEMS unit of the MMG purchases power from the electricity grid when the electricity price is low while it sells power to the electricity grid during the high price hours. Accordingly, the operational cost is reduced, and this leads to profit from the difference of selling and buying price of electric energy.
is the operational cost of MMG, Np is the number of MGs in the MMG system, T is the horizon of operation which is considered equal to 24 h in this paper and is the hourly operational cost of dispatchable units in $. is the shared power of nth MG with the electricity grid in MW and the positive values of represent purchasing energy from the electricity grid while the negative values represent selling energy to the grid. is the market price in electric market in $/MWh. Accordingly, is representative of income (if is negative) and cost (if is positive) from power sharing with the electricity grid.
2.2. Minimizing the Emission
In order to consider the environmental effects of emissions in the MMG the second objective function is to minimize the total emission of the units. The mathematical model of the second objective function is as follows:
where
represents the value of emission from MMG,
is the emission factor in kg for each MWh of the produced power of fossil fuel-based units,
represents the emission of each MWh received power from the electricity grid in kg. Accordingly,
represents the value of emission in kg resulted from the output power of fossil fuel-based units while
represents the value of emission in kg resulted from purchasing power from the electricity grid.
It should be mentioned that, when the power is delivered to the electricity grid from MMG (i.e., is negative) the emission term related to the electricity grid equals zero and no emission is produced. Moreover, the ES device as well as PV and WT units produce no emission.
2.3. Technical Constraints
The balance of the amount of demanded load and the hourly total generated power of diesel generators, the stored power in ESs, the forecasted power of renewable based units as well as the exchanged power between MGs and the main electricity grid is the most important requirement of the MMG optimal operation problem. The power balance equation can be formulated as follows:
where
is the hourly total demanded load of each MG in MW,
and
are, respectively, the estimated hourly power of WT and PV units of each MG in MW,
is the battery charging (negative values) and discharging (positive values) values in each MG in MWh.
is the amount of exchanged power among MGs in which
presents the hourly exchanged power between the
nth and
mth MG in MW.
The positive values of
show the power sharing from the
nth MG to the
mth MG while the negative values represent the power sharing from the
mth MG to the
nth MG. Moreover, all the generated and stored powers as well as the exchanged power with the electricity grid should satisfy the power limit constraints as follows:
where
and
are the minimum and maximum generated power of DG unit in MW, respectively.
is the maximum exchangeable power between the
nth and the
mth MG in the MMG system in MW.
is the maximum exchangeable power with the electricity grid in MW.
is the maximum hourly charging/discharging value of the battery of each MG in MW.
and
are, respectively, the minimum and the maximum stored energies in the battery of each MG in MWh.
3. Unscented Transformation (UT) Method
Most of the problems in power system planning deal with uncertainties [
35,
36,
37]. In order to manage the inherent uncertainties of random variables in power systems efficient approaches should be applied such that the sensitivity of the results to the uncertainties decreases. Due to the existence of renewable-based power generation in MGs the optimum power management of microgrids is considered as a high probabilistic problem with high degree of uncertainties. Moreover, the load variation in MGs is more significant than in conventional power systems. Consequently, an appropriate approach should be considered to carry out the uncertainties in the optimal power management of MMG.
UT method is an efficient approach for modeling uncertainties and solving probabilistic problems [
35,
36,
37]. Comparing with Monte-Carlo, UT has less computational cost and is inherently developed to model the correlation among uncertain variables [
37]. Using covariance matrices enables UT method to model uncertainties in each situation. UT method is efficiently capable of modeling uncertainties of input variables with any linear and nonlinear correlations [
36]. Consequently, UT becomes one of the efficient and proper approaches for considering and modeling uncertainties of input variables. UT is a method to calculate a random variable in a nonlinear function and it has been presented to overcome the deficiencies of conventional methods especially those that apply linearization process [
35,
36,
37]. The major consideration in UT is how to produce proper samples of input variables that maintain appropriate data of the probability density function of input variables [
36].
A deterministic sampling approach is employed in UT method and states’ distributions are shown by the total minimum sampling points (namely, sigma points) that are selected with high accuracy. In UT procedure, the set of sigma points passes through the system’s nonlinear function to achieve new mean value and covariance related to the distribution of new states.
where
is a function of the matrix of sigma points that are shown by
. This equation leads to another matrix which includes the transformed sigma points that were passed through the nonlinear function. Using (9), the Gaussian distribution related to the estimated states can be approximated. The main steps of the UT method are as follows:
calculating the set of sigma points;
assigning weights to each sigma point;
converting sigma points using the nonlinear function;
calculating the Gaussian distribution of new states and their related assigned weights; and
finding the covariance and mean value of the new Gaussian distribution.
The procedure of UT method is as follows:
It should be mentioned that the numerical values of weights are between zero and one.
Step 4: output extraction for sigma points: for each sigma point the outputs of the problem are extracted based on the following:
and
Step 5: achieving the mean value of the output: according to the extracted outputs and the assigned weights, the output of the problem is calculated as follows:
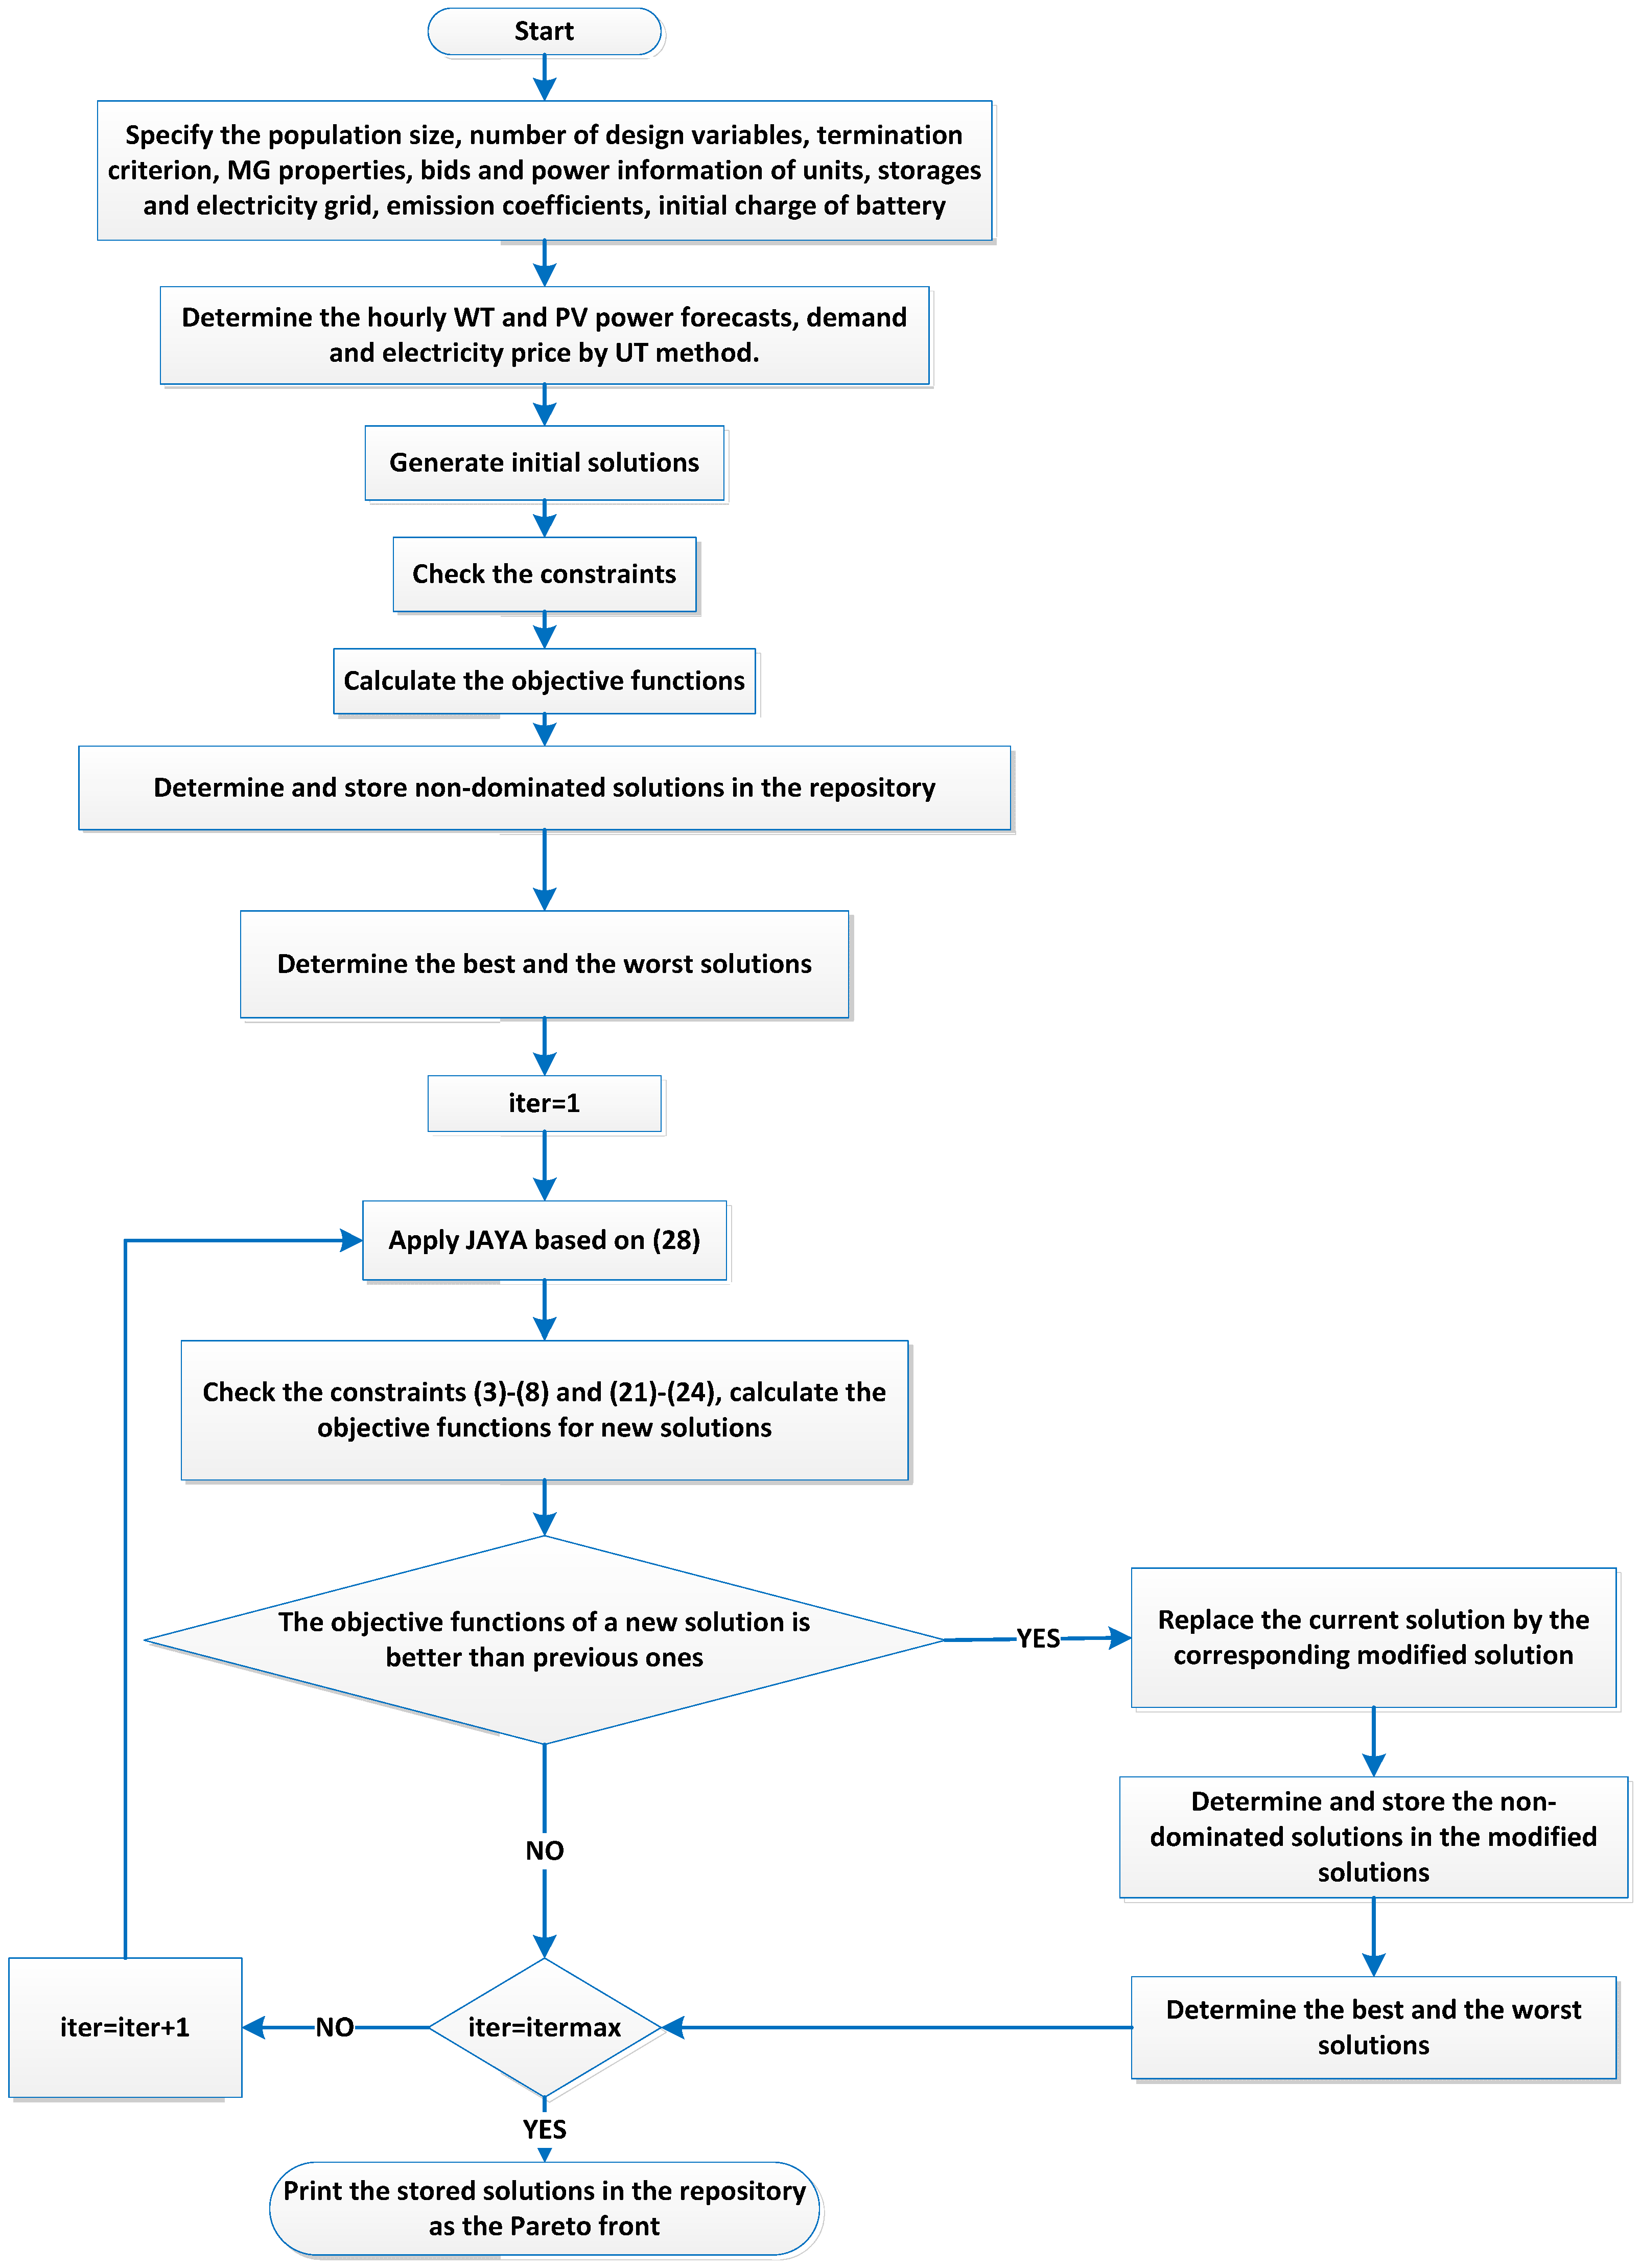
5. Application of the Suggested Multi-Objective JAYA Algorithm (MJAYA)
The major advantage of JAYA over other meta-heuristic algorithms is its independency to algorithmic parameters. Moreover, JAYA algorithm is simpler and faster in dealing with optimization problems comparing to other meta-heuristic algorithms [
32,
33,
34,
40]. Consequently, in this paper MJAYA algorithm is applied to solve the stochastic bi-objective optimal power management of MMG systems. As is mentioned in
Section 2, the objectives are minimization of the total operational cost (maximization of profit) and minimization of the environmental pollutant. In the following, a brief overview of the main JAYA algorithm is presented. Afterwards, the flowchart of the UT-MJAYA algorithm is shown.
Assuming
as the objective function that is minimized, where
is the vector of design variables of x and
is the counter of design variables where
D is the number of design variables. The counter of solutions in the population is presented by
where
is the number of solutions or the size of population. The counter of iterations in the algorithm procedure is defined by
where
shows the maximum number of iterations. The best solution and the worst solution in the
iterth iteration are updated based on the following:
where
is the
ith variable in best solutions, and
is the
ith variable in worst solutions in
iterth iteration.
is the modified version of
while
and
are two random values in range [0, 1]. The trend of a solution to approach to the best solution and to get far from the worst solution are, respectively, expressed by
and
. If
results in a better objective function value than that of
, it will be accepted. Based on the values of objective functions, at the end of each iteration, best solutions are maintained and will be considered as the population for the next iteration. The best and worst solutions are determined in the recent maintained population for the next iteration. The process will pursue until the termination criterion is fulfilled [
32,
33,
34].
Since the bi-objective optimal energy management of MMG system is studied in this paper the multi-objective JAYA (MJAYA) algorithm is applied to solve this optimization problem [
41,
42]. To solve the problem of stochastic optimal power management of MMG system considering economic and environmental indices, UT-MJAYA algorithm is applied. The flowchart of the implemented algorithm is illustrated in
Figure 3.
6. Simulation Results
In this section, the simulation results of the suggested approach for solving the problem of optimal power management of the studied MMG system are presented. First, the single objective problem is solved to minimize the operational cost of the MMG system. Afterwards, the minimization of emission is considered as the objective function. In the next section, the two objective functions of minimization of the total cost and the emission are considered simultaneously to solve the multi-objective optimal power management of MMG by implementing the suggested approach. Moreover, the results of deterministic and stochastic optimal power management of MMG components are compared.
The MMG system consists of four MGs each includes one fossil fuel-based unit, two RES-based units, ES, and local load. RES unit in MG1 and MG3 are PV unit, while in MG2 and MG4 WT is considered as the RES-based unit. Each MG can share power with the main electricity grid based on the electricity price. Moreover, power sharing up to 1 MW between MG1 and MG2 as well as MG3 and MG4 is considered.
In this paper, we assumed that the main electricity grid is not renewable-based, which leads to the high amount of emission from the electricity grid.
Considering the population size and the number of maximum iterations in the proposed MJAYA algorithm equal to 50 and 200, respectively, the problem is solved in MATLAB (MathWorks corporate, Natick, MA, USA) environment.
The parameters related to the diesel generators are listed in
Table 1. In
Table 2, the batteries’ parameters are shown assuming that the initial charge of batteries is
MWh. Parameters related to PV and WT are tabulated in
Table 3 and
Table 4, respectively. The range of the maximum exchangeable power of each MG is listed in
Table 5. The emission coefficient of each unit is observed in
Table 6 [
43].
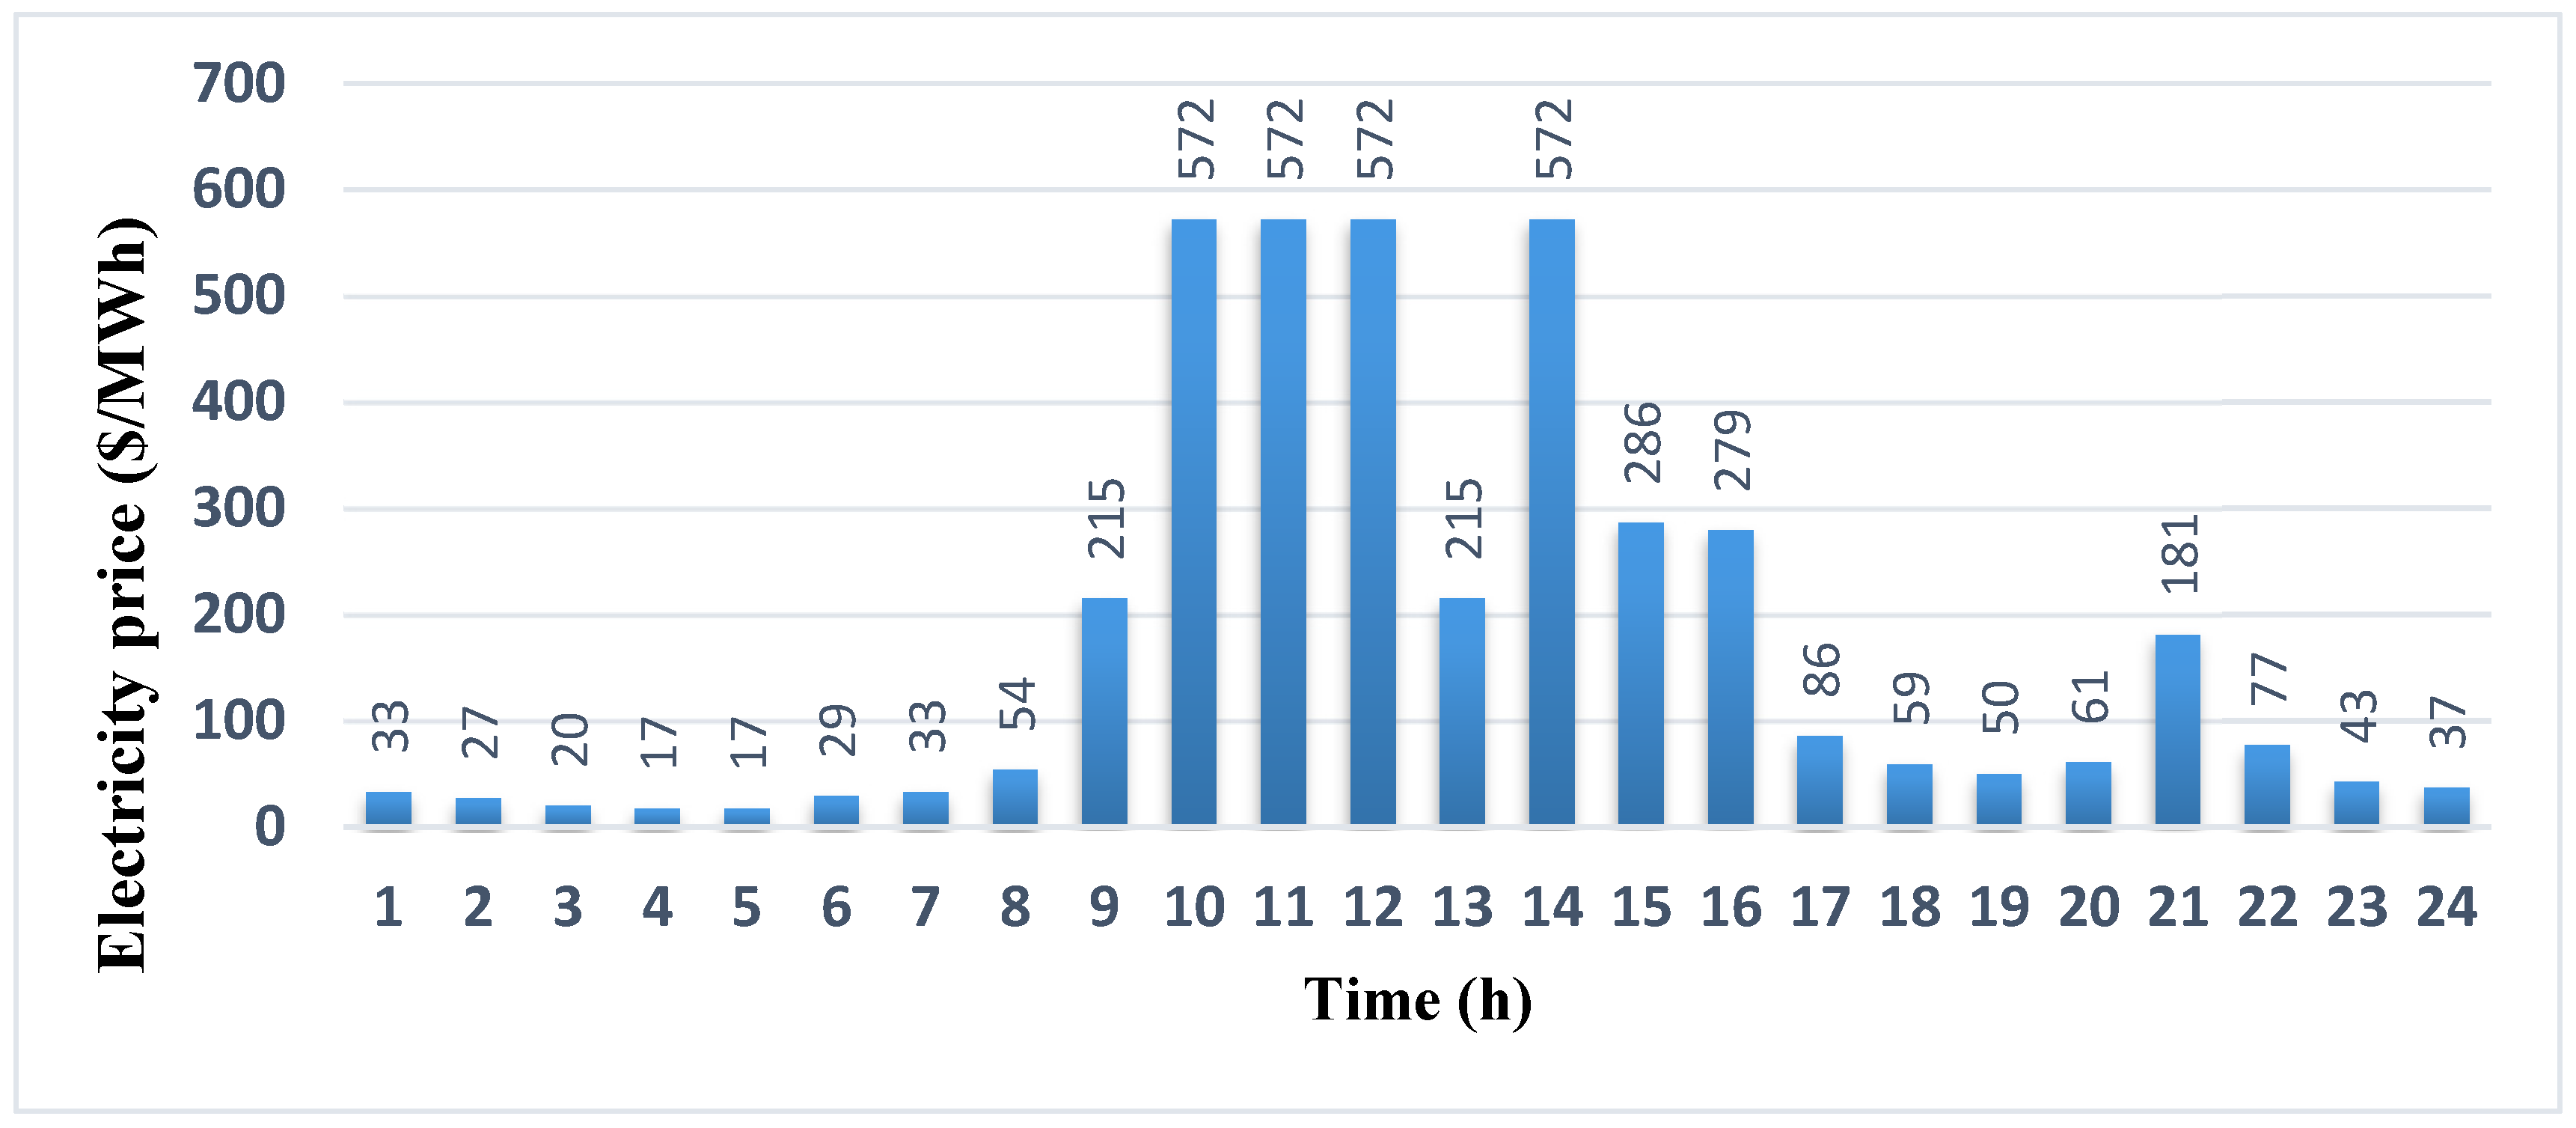
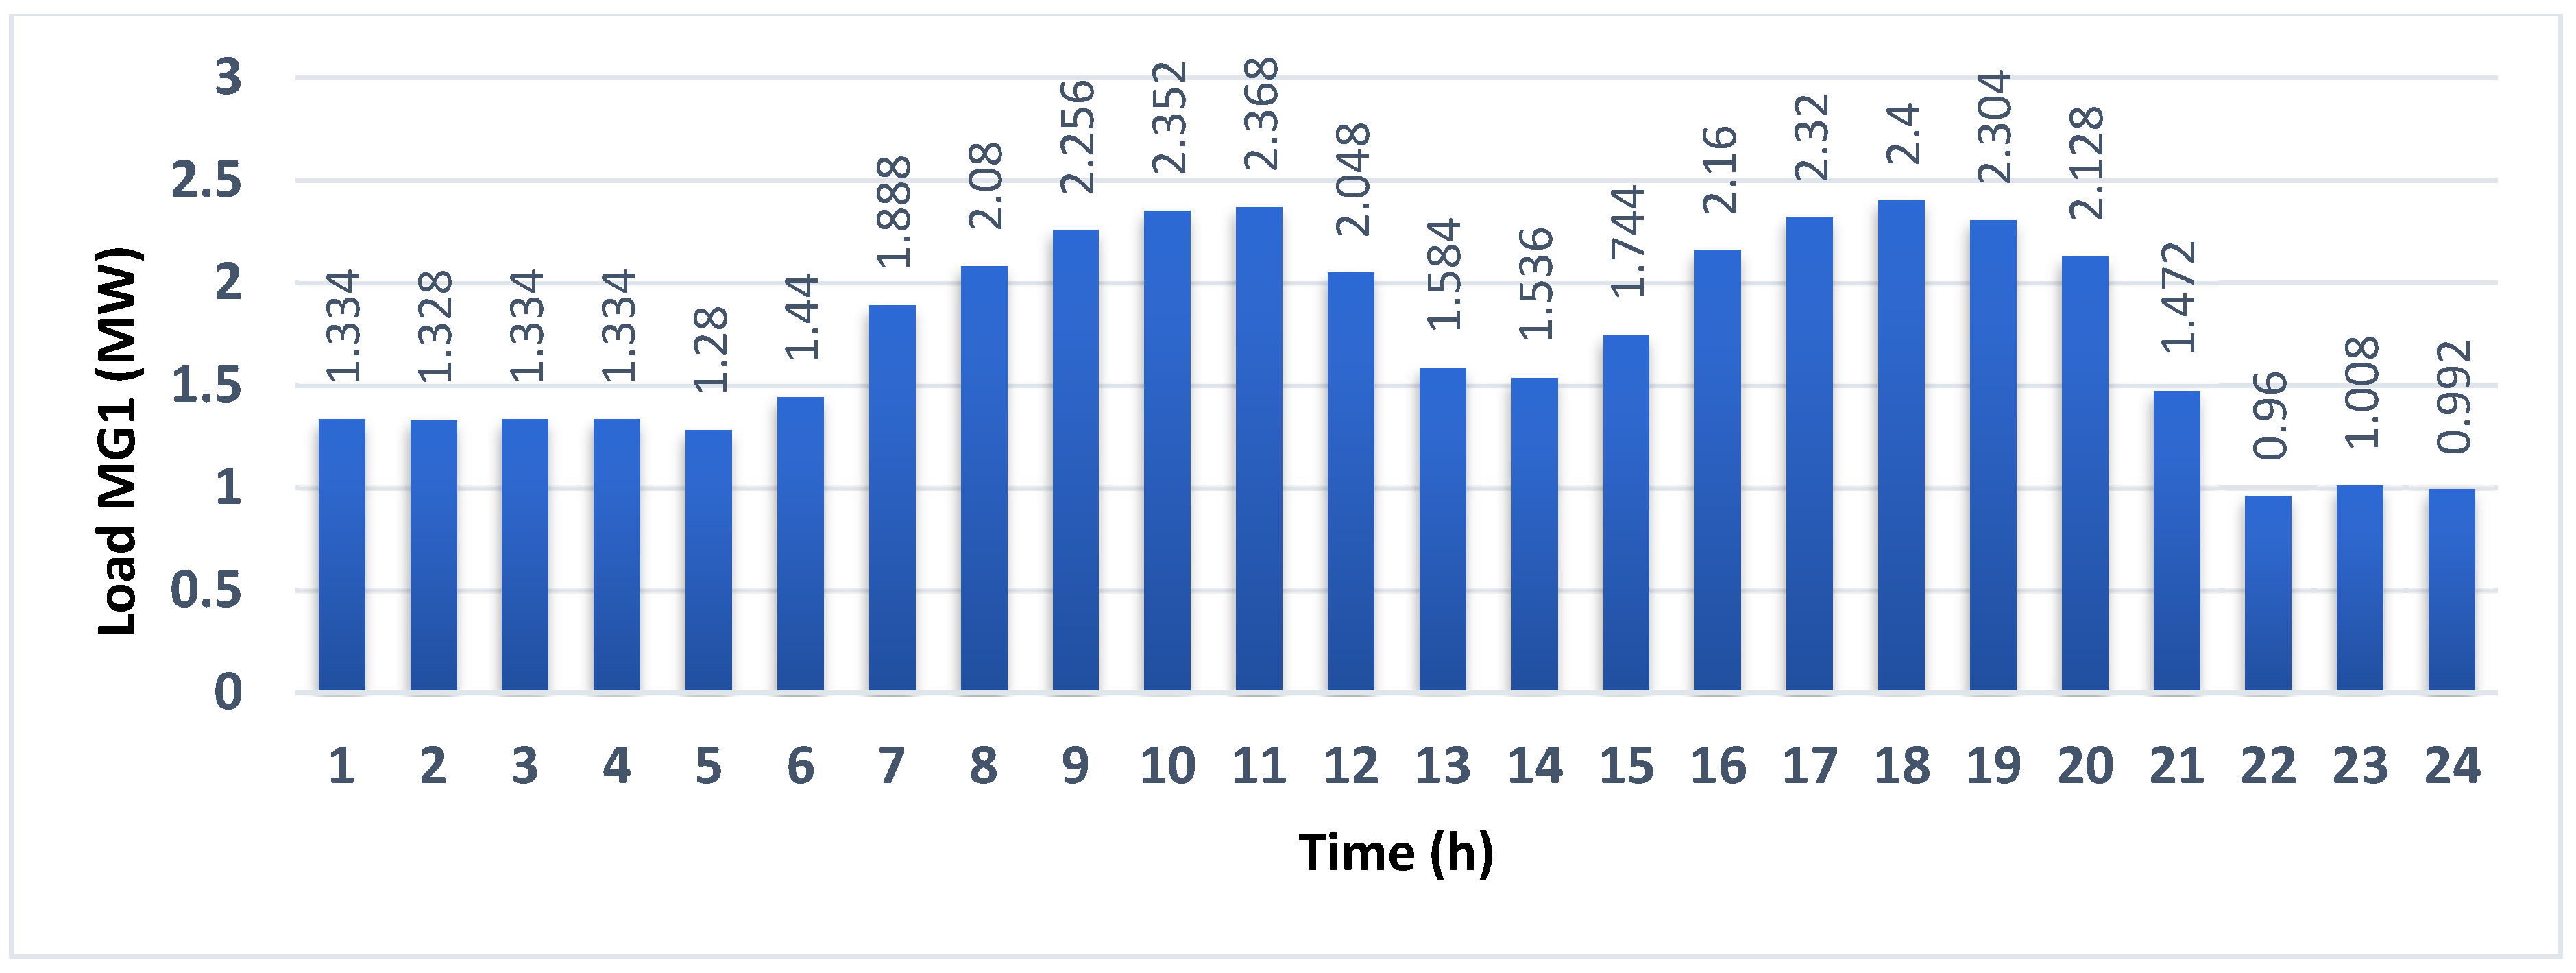
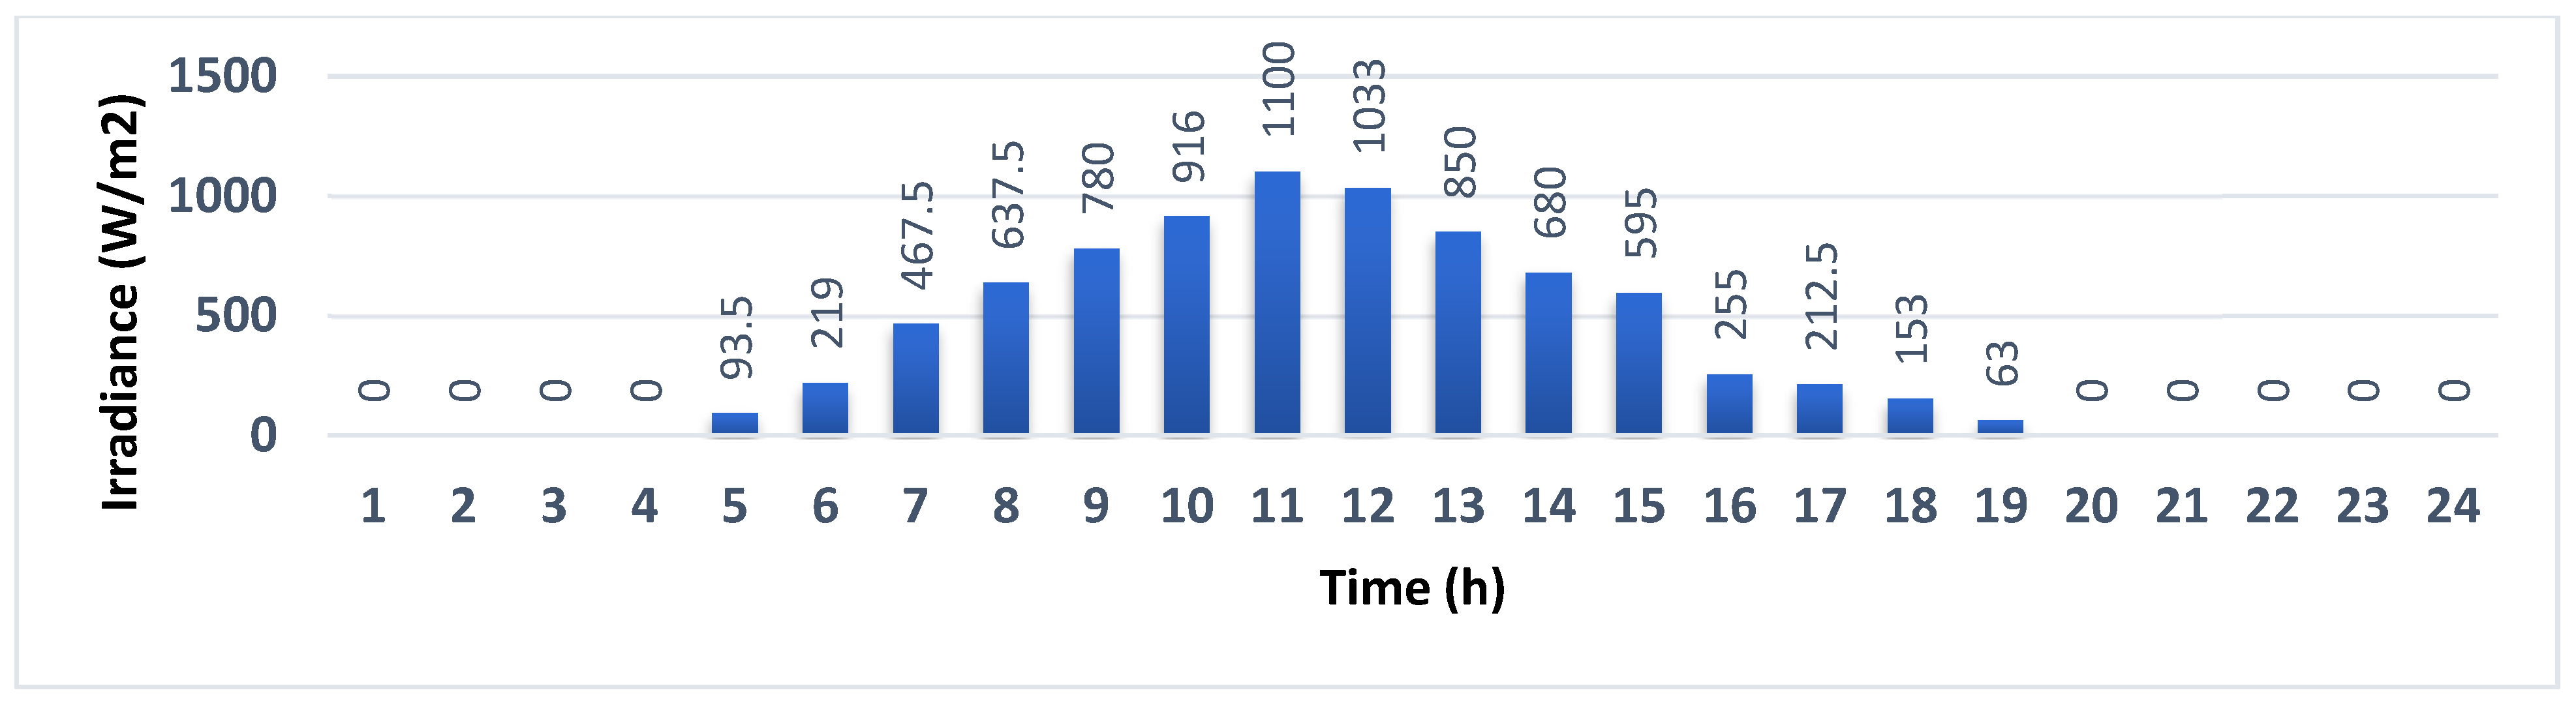
Figure 4,
Figure 5,
Figure 6,
Figure 7,
Figure 8,
Figure 9 and
Figure 10, respectively, represent the forecasted values of electricity price, load demand, output power of PV, and WT units in the 24-h day-ahead [
43].
In the deterministic analysis, it is assumed that the values of wind speed, solar irradiance, load demand, and electricity price are equal to their forecasted values without any uncertainties. However, in the stochastic analysis, the MMG system parameters are assumed similar to the deterministic analysis while the wind speed, solar irradiance, load demand, and electricity price are considered as uncertain variables and follow the normal distribution function. The mean values for the normal distribution function of these variables are considered equal to the forecasted values of these parameters and their SDs are considered 5% of their mean values. The stochastic optimal operation of MMG system is solved by applying the suggested UT-MJAYA approach in single and multi-objective frame works considering the uncertainties of WT, PV, electricity price, and load demand.
6.1. Minimizing the Operational Cost
This section is devoted to investigating the results of solving the optimal operation of MMG while considering the economic index as the only objective function. The values of the achieved profit and the expected profit of each MG are shown in
Table 7. From
Table 7, it can be concluded that the MMG operator should pay a cost for operation of MG1 while it can gain profit from MG2, MG3, and MG4. The total achieved profit is more than the total operational cost. Since the load demand of MG1 is more than that of other MGs and since the generation capacity of diesel unit in MG1 is less than other MGs and MG1 has less maximum exchangeable power with the electricity grid the operation of MG1 leads to paying a cost. MG2 has lower load than MG1 and higher exchangeable power with the electricity grid, consequently the operation of MG2 leads to profit. The diesel generator capacity in MG3 is more than MG2 and MG1; and MG3 has a higher maximum exchangeable power with the electricity grid, therefore the operation of MG3 leads to a higher profit than MG2. MG4 has a lower load demand and higher maximum exchangeable power with the electricity grid than other MGs, therefore, the achieved profit in operation of MG4 is the highest.
According to
Table 7, the achieved profit is decreased 6% when the uncertainties are considered. When considering uncertainties, the demanded load in every MGs, the available power of renewable-based units and the electricity price will change, consequently, in comparison with the situation that these variables are considered constant the operational cost as well as the achieved profit will change. If the load demand, the available power of renewable-based units and the electricity price decrease the operational profit will also decrease and vice-versa. According to
Table 7, when the uncertainties are considered the profit of operation of MG1 and MG3 decrease while the operational profit of MG2 and MG4 increase.
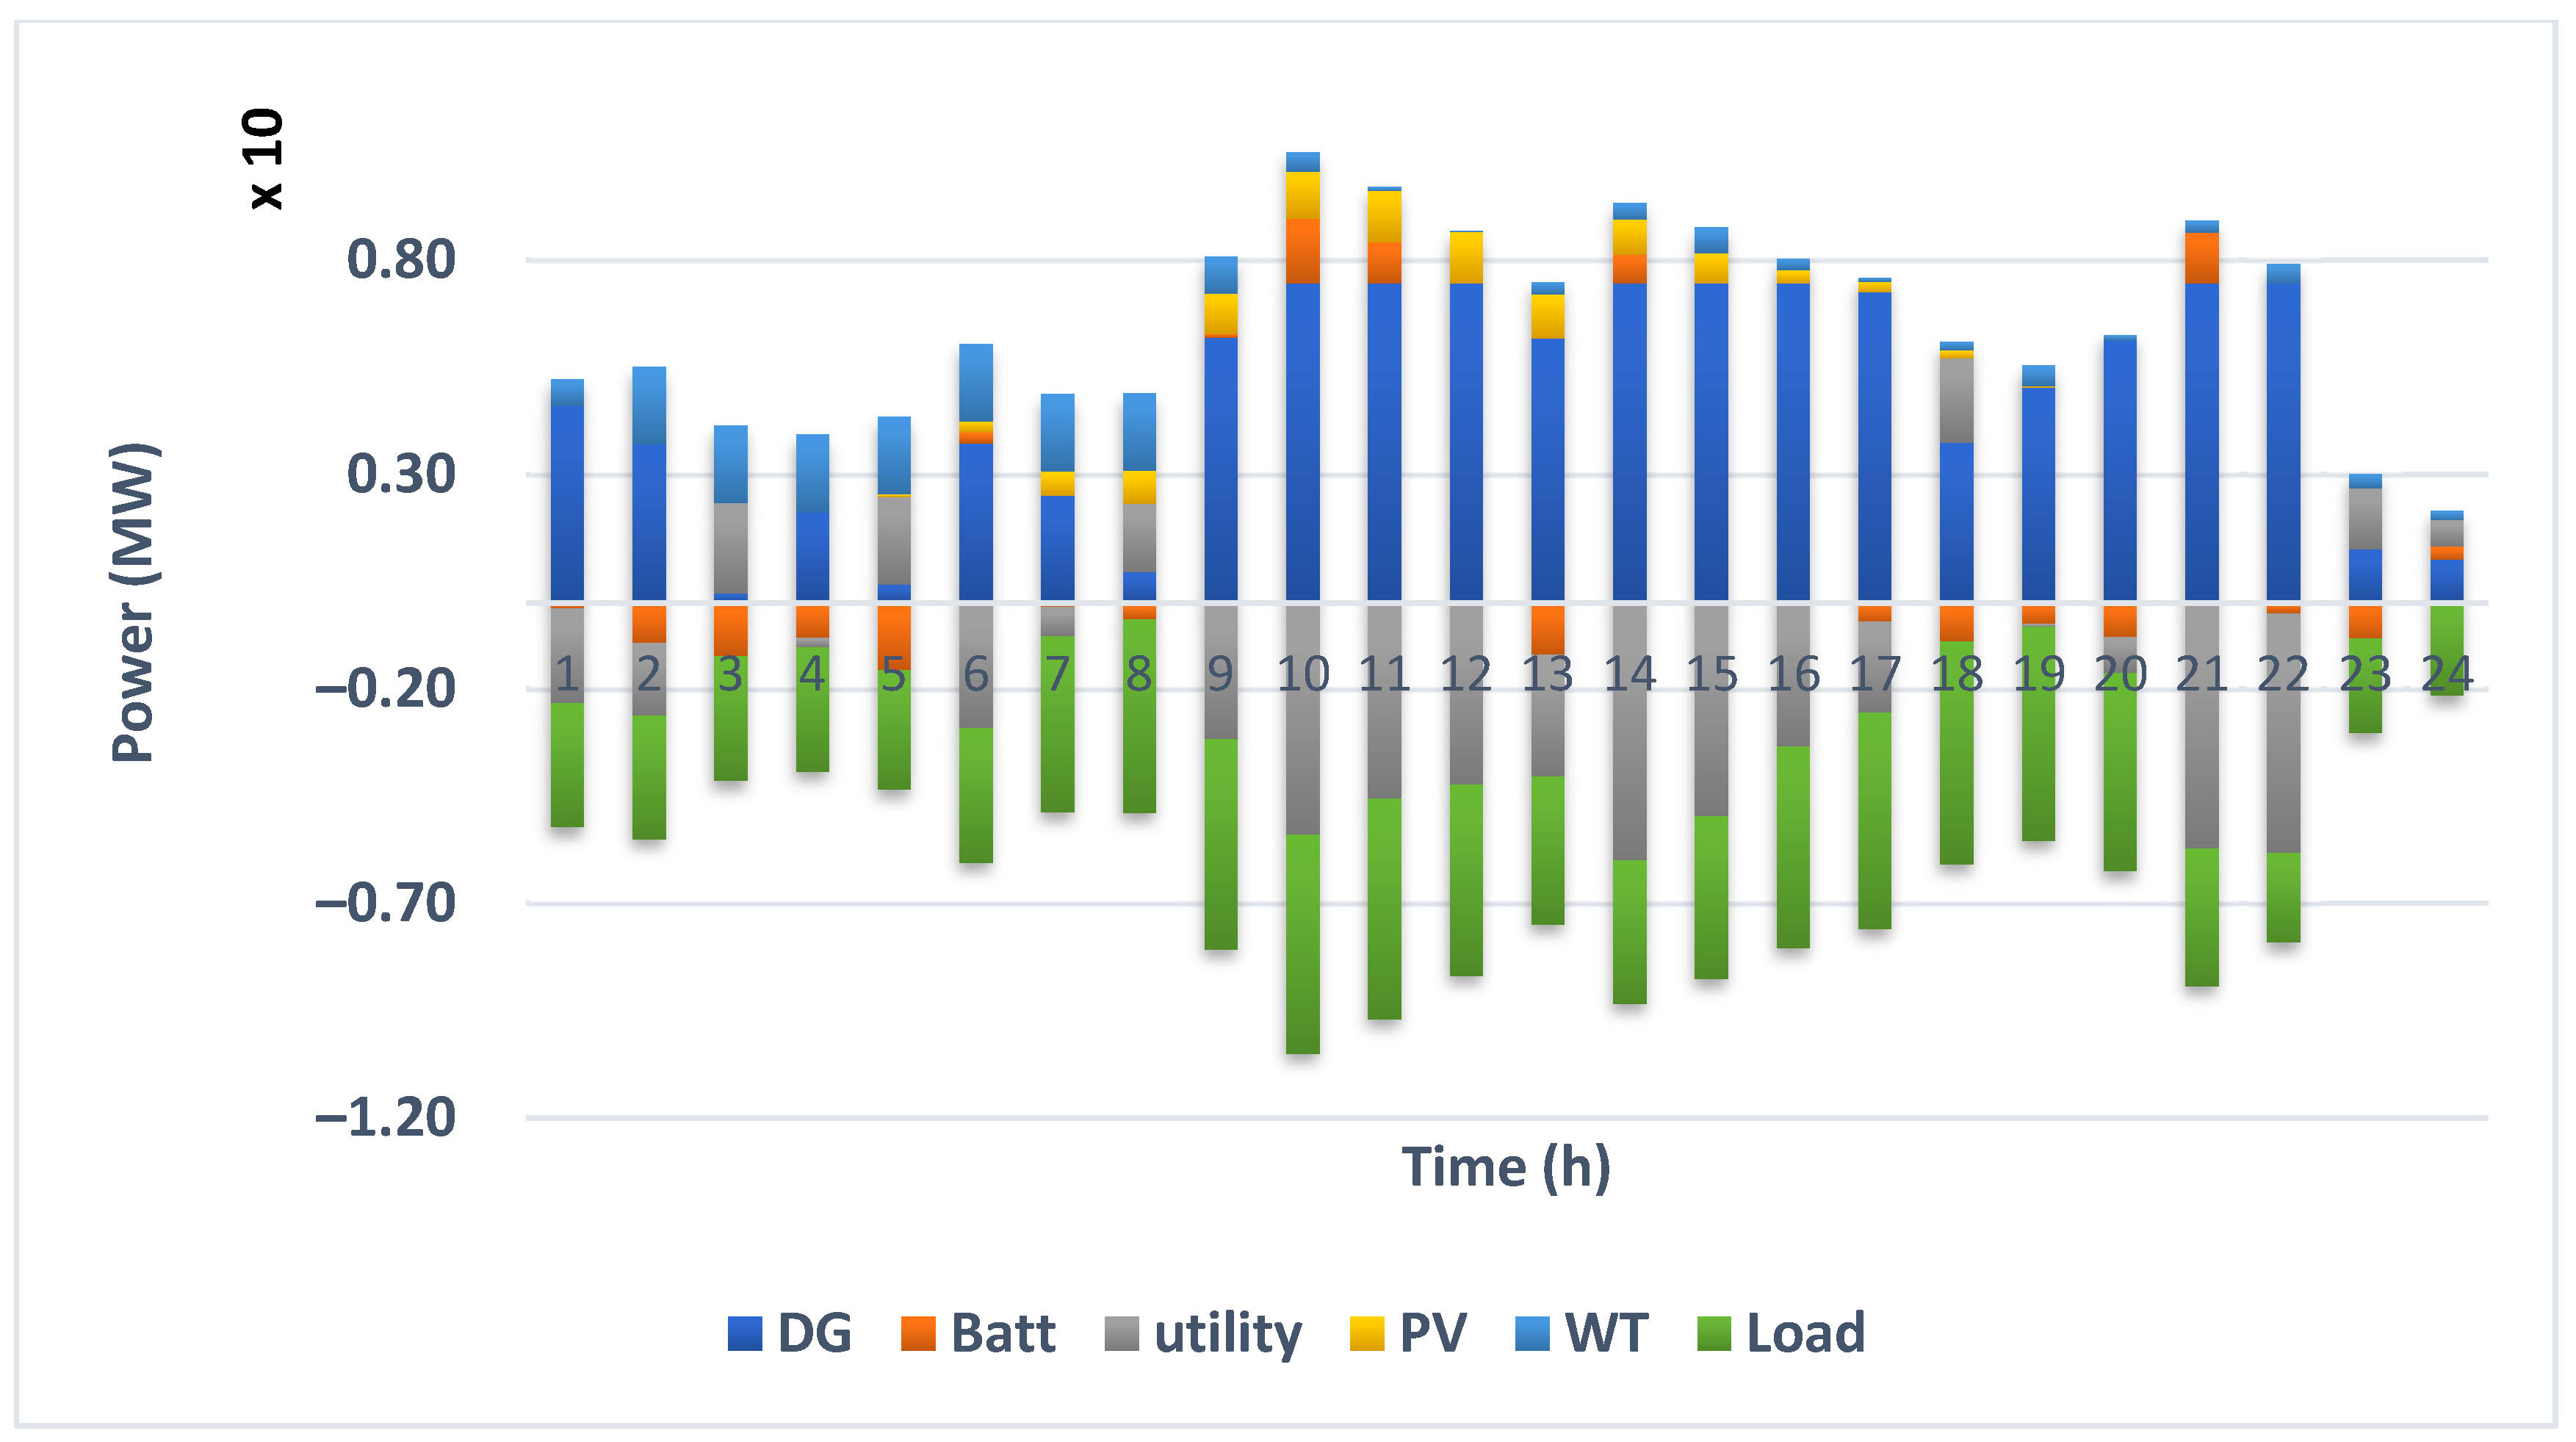
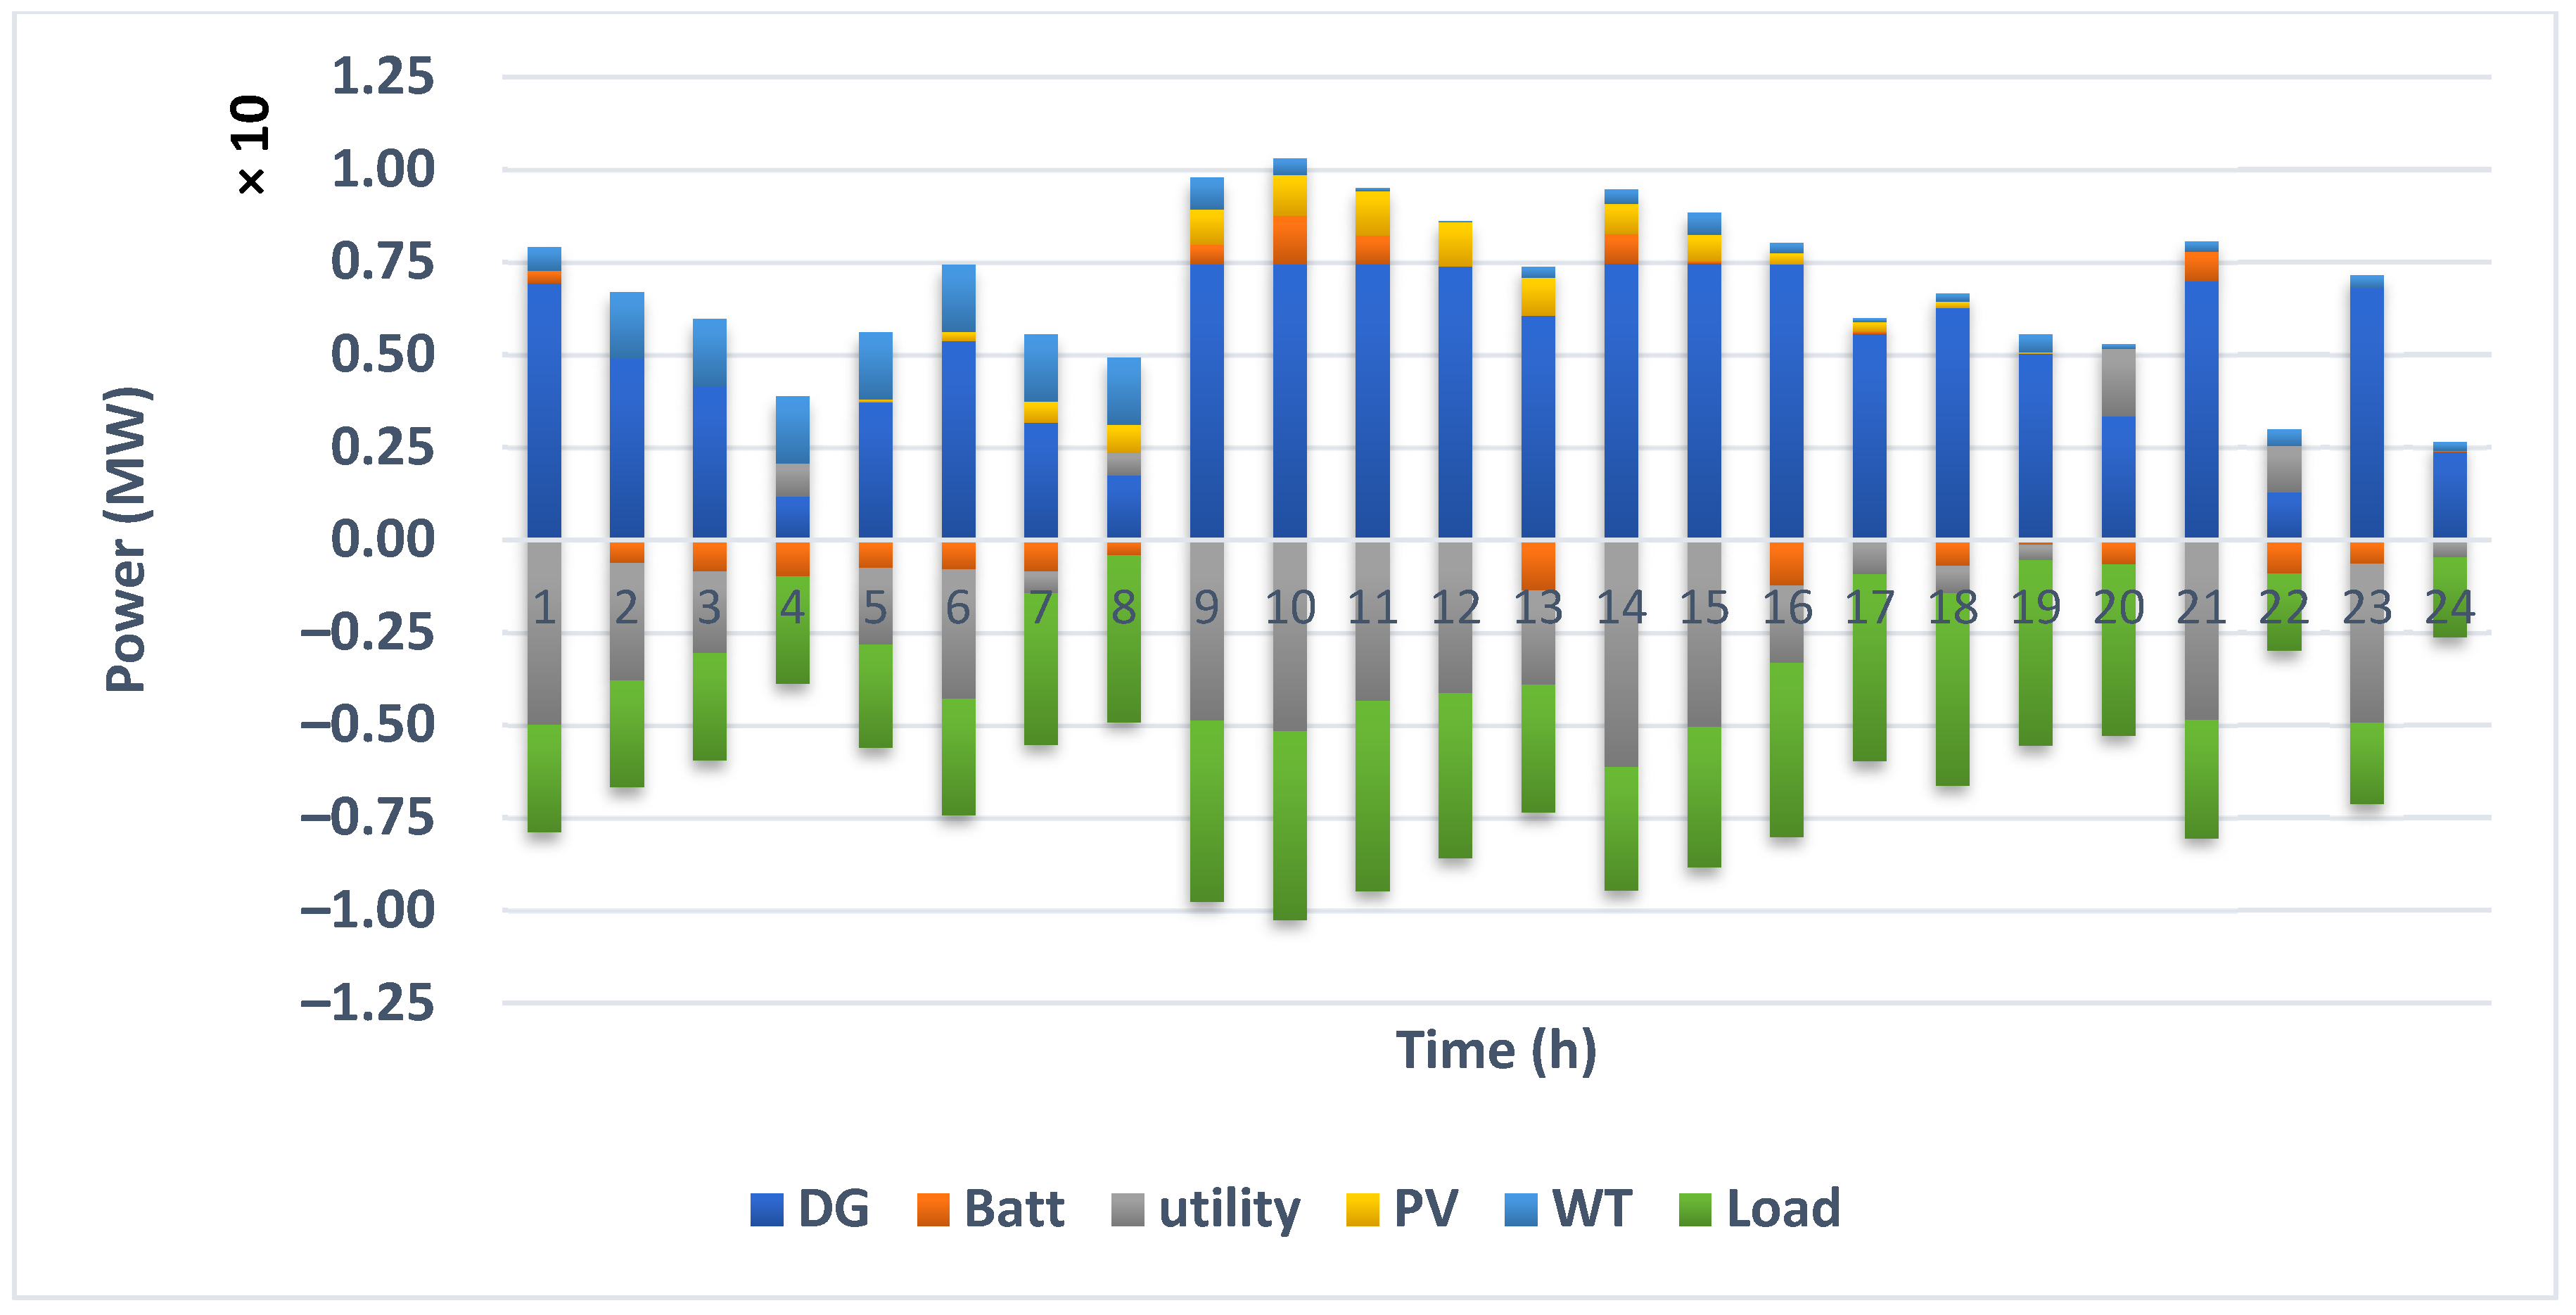
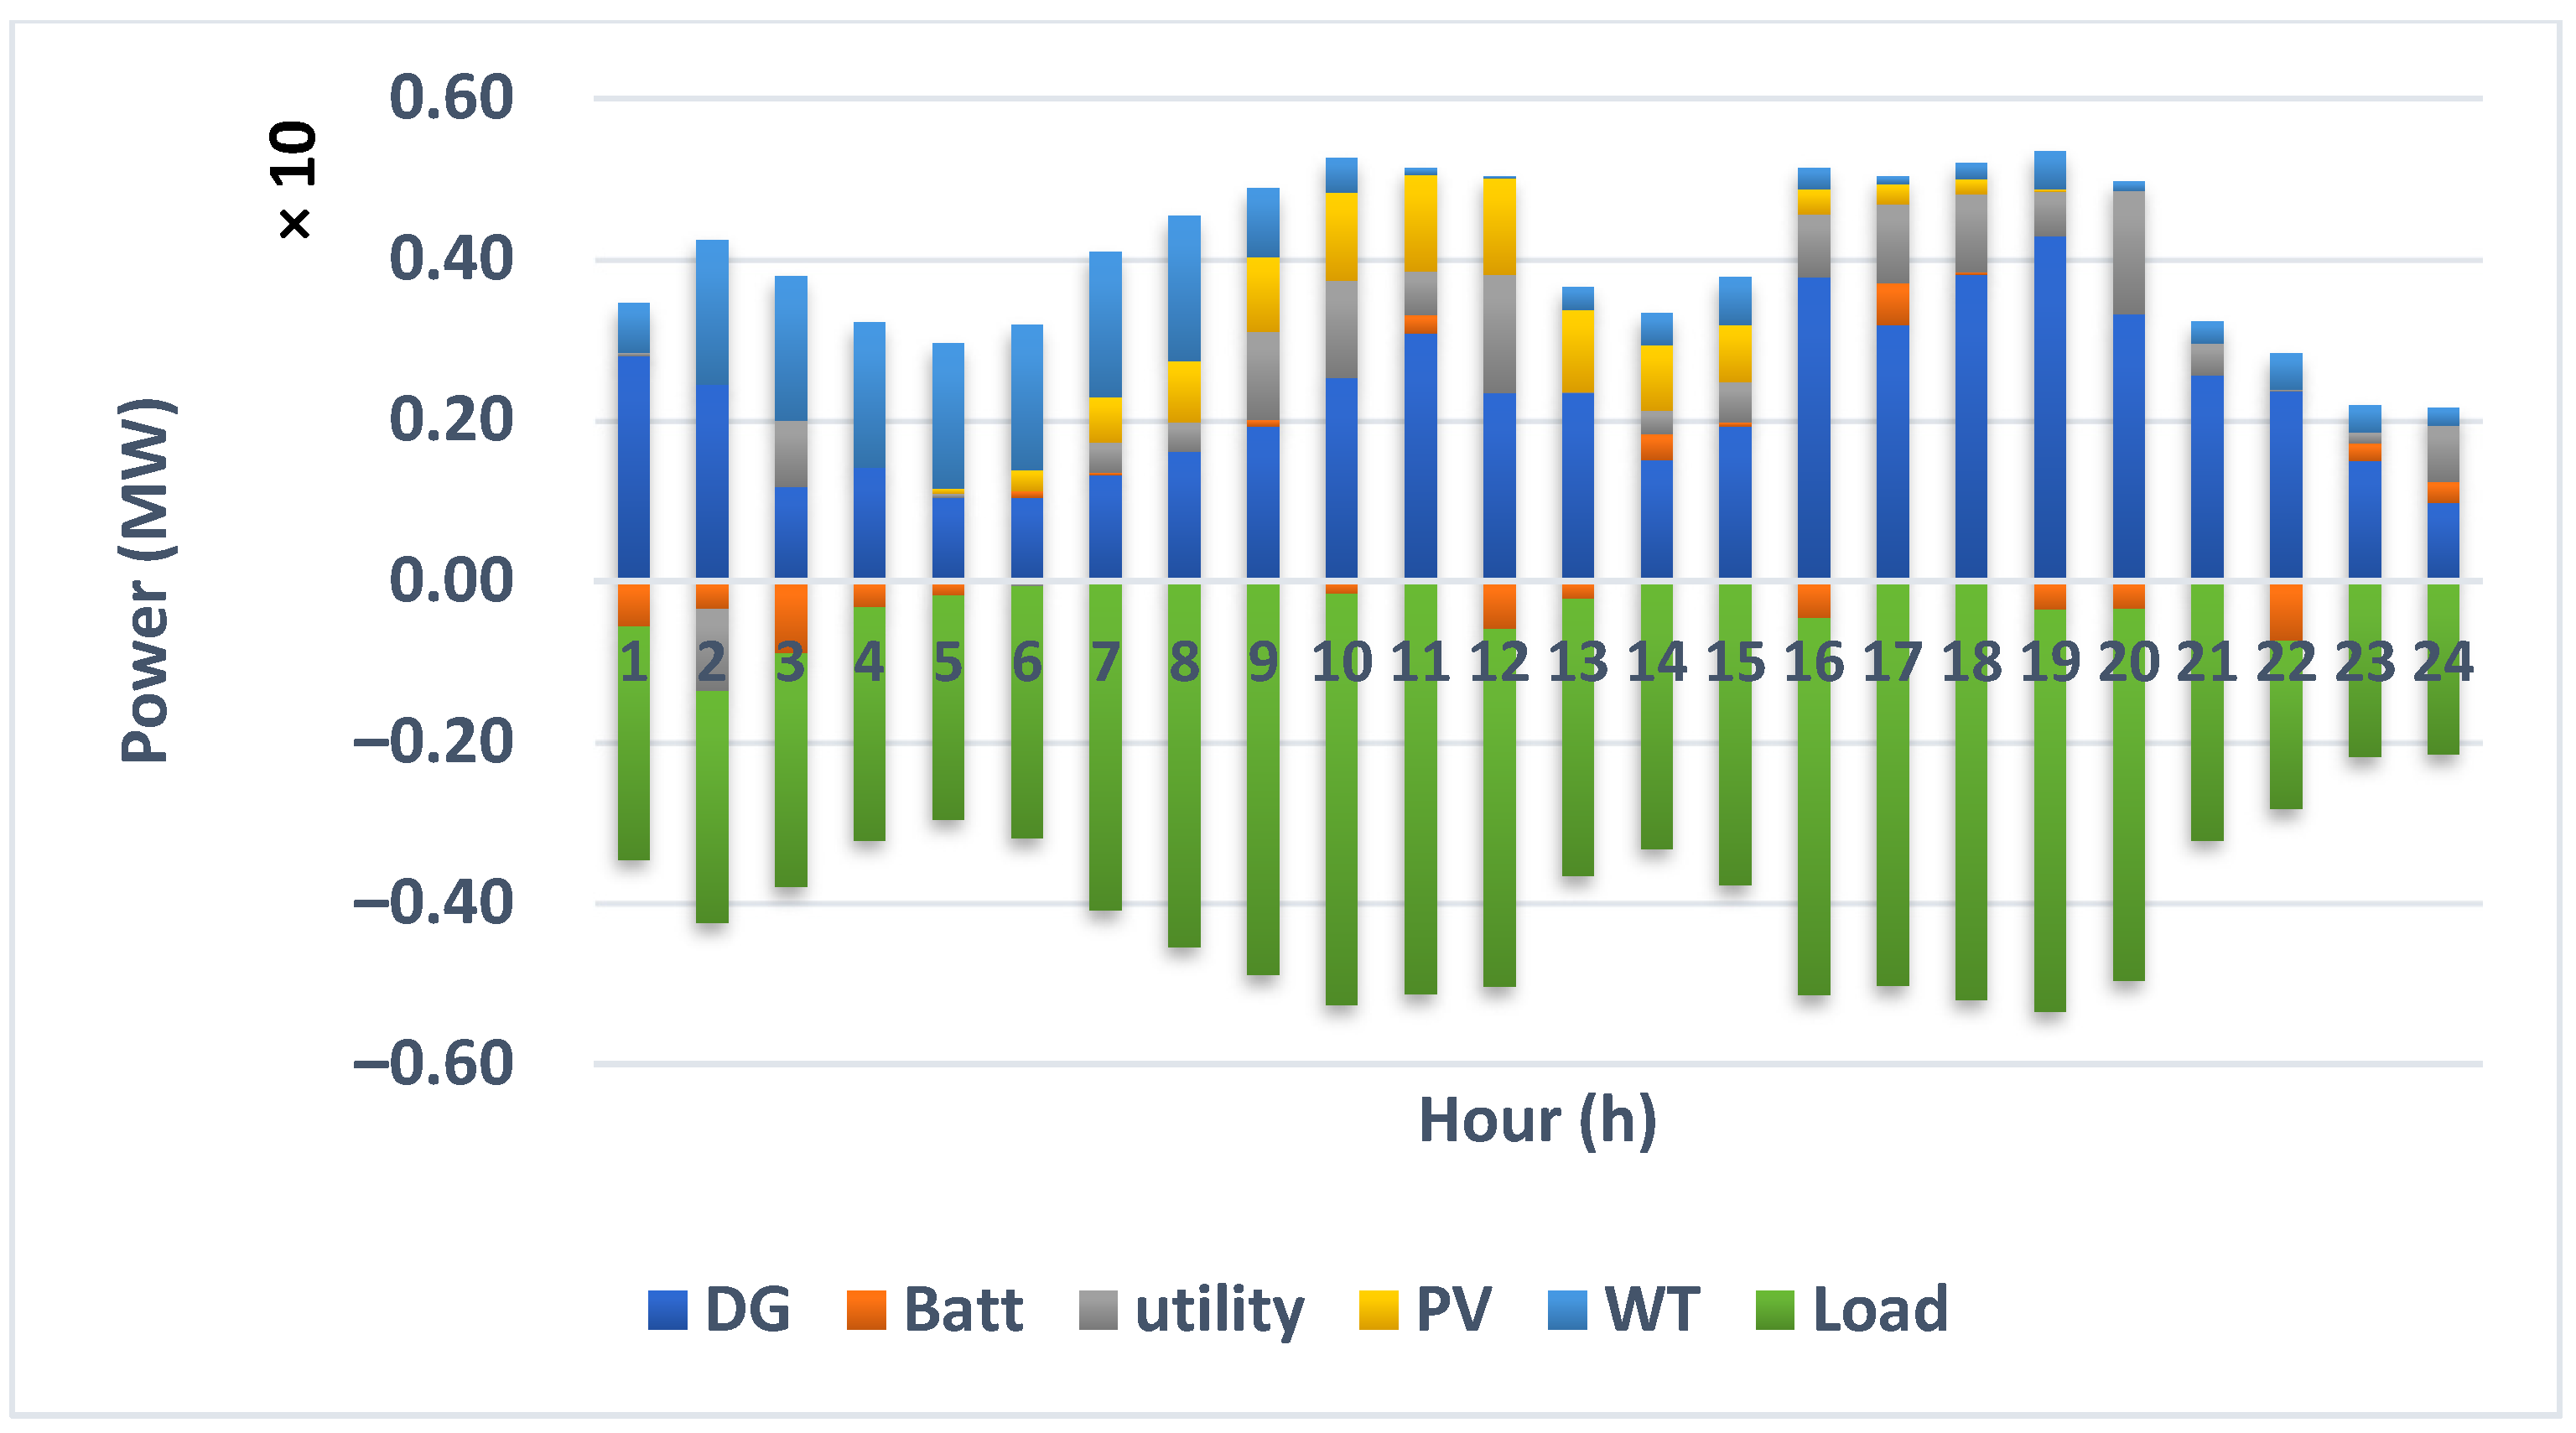
Figure 11 and
Figure 12, respectively, present the deterministic and stochastic accumulated optimal operation of different elements of MMG system in different hours of a day for while considering economic index as the objective function.
In
Figure 11 and
Figure 12, load and any units, which is a consumer, are shown with negative power values in each hour while the producers have positive power values. Since the diesel generators are always power producers the related values are positive. ES units can play the role of both power producer and consumer. During the charging hours, ES units are considered as consumer with negative values while during discharging hours they are considered as power producer with positive values. Furthermore, negative values related to the exchanged power with the electricity grid reveal selling power to the electricity grid while positive values present purchasing power from the grid and power sharing is from the electricity grid to the MMG system.
By comparing
Figure 11 and
Figure 12, it is observed that in deterministic operation of MMG system in the 3rd, 5th, 18th, 20th, 23rd, and 24th the power is purchased from the electricity grid while in the stochastic operation of MMG the power is sold to the electricity grid in these mentioned hours. Accordingly, when considering uncertainties in the variables, the operation of units is different from the deterministic operation. Consequently, to prevent economic loss, the impact of uncertainties should be considered in the optimal power management of MMG system to have a proper vision in the variables’ changes on the operation of the system.
6.2. Minimizing Emission
In this section, the results of optimal power management of MMG system are shown while considering the environmental index. The values of the emission of all the MGs and the total emission of the system in both deterministic and probabilistic analysis as well as the execution time are observed in
Table 8.
According to
Table 8, the operation of MMG leads to 60 tons of emission. Since the emission coefficient of diesel generators is less than that of the electricity grid, it is observed that when the objective is minimizing emission, more power is received from diesel generators to satisfy the load and, consequently, the emission from these units is more than the emission of the electricity grid.
Since the load demand of MG1 is more than other MGs, MG1 has the highest sharing in producing emission in the system. MG2 has lower demanded load than MG1 and lower sharing of emission production. MG3 has lower load demand than MG1 and, consequently, the resulted emission is less than MG1. While the demanded load of operation of MG3 comparing to MG2 is higher which leads to more emission production than MG2. MG4 has the lowest load demand profile and, consequently, the lowest sharing in emission production.
According to
Table 8, considering uncertainties in the problem leads to a 2% increase in the value of emission. In probabilistic analysis, the expected emission in MG1 and MG3 decreases while it increases in MG2 and MG4. Since the produced emission depends on the load and the available renewable energy, the decrease of emission in MG1 and MG3 is due to the reduction of load demand or the increase of available solar energy when considering uncertainty in the variables. Furthermore, the increase of emission in MG2 and MG4 is the result of the increase of load demand or the decrease of available wind.
Figure 13 and
Figure 14 show, respectively, the deterministic and probabilistic accumulated optimal operation of each unit to minimize the total emission of the system.
By comparing
Figure 11 and
Figure 12 with
Figure 13 and
Figure 14, it is obvious that when the objective is changed from maximizing the profit into minimizing the emission the management of units changed significantly. Since in order to maximize the profit the MMG system shares more power with the electricity grid, when the objective is to minimize the emission less power can be exchanged with the electricity grid since the emission coefficient of the electricity grid has a high value. It should be mentioned that, when the power is sold to the electricity grid no emission is produced, and the emission coefficient of the electricity grid equals to zero during these hours.
According to the results, in the single objective problem in order to reduce emission since the power supplying from the electricity grid results in high emission the aim is to supply the load through the generation units in the MGs in all hours. However, during the hours that the amount of load is higher than the total produced power of the generation units of the MGs in the MMG the operator should purchase power from the electricity grid to satisfy the load of each MG.
By comparing
Figure 13 with
Figure 14, it is observed that planning of diesel generators, ES and power sharing with the electricity grid in deterministic and probabilistic analysis of the MMG system are not the same. In deterministic analysis, the total output power of diesel generators is half of the probabilistic analysis. Moreover, in hours 7th and 11th, the ES is discharged in deterministic analysis while in probabilistic analysis the battery is charged during these hours. In deterministic analysis, from 3rd to 6th hour and in 8th hour the power is purchased from the electricity grid while in the probabilistic analysis the power is sold to the grid during these hours.
6.3. Multi-Objective Optimal Operation of MMG
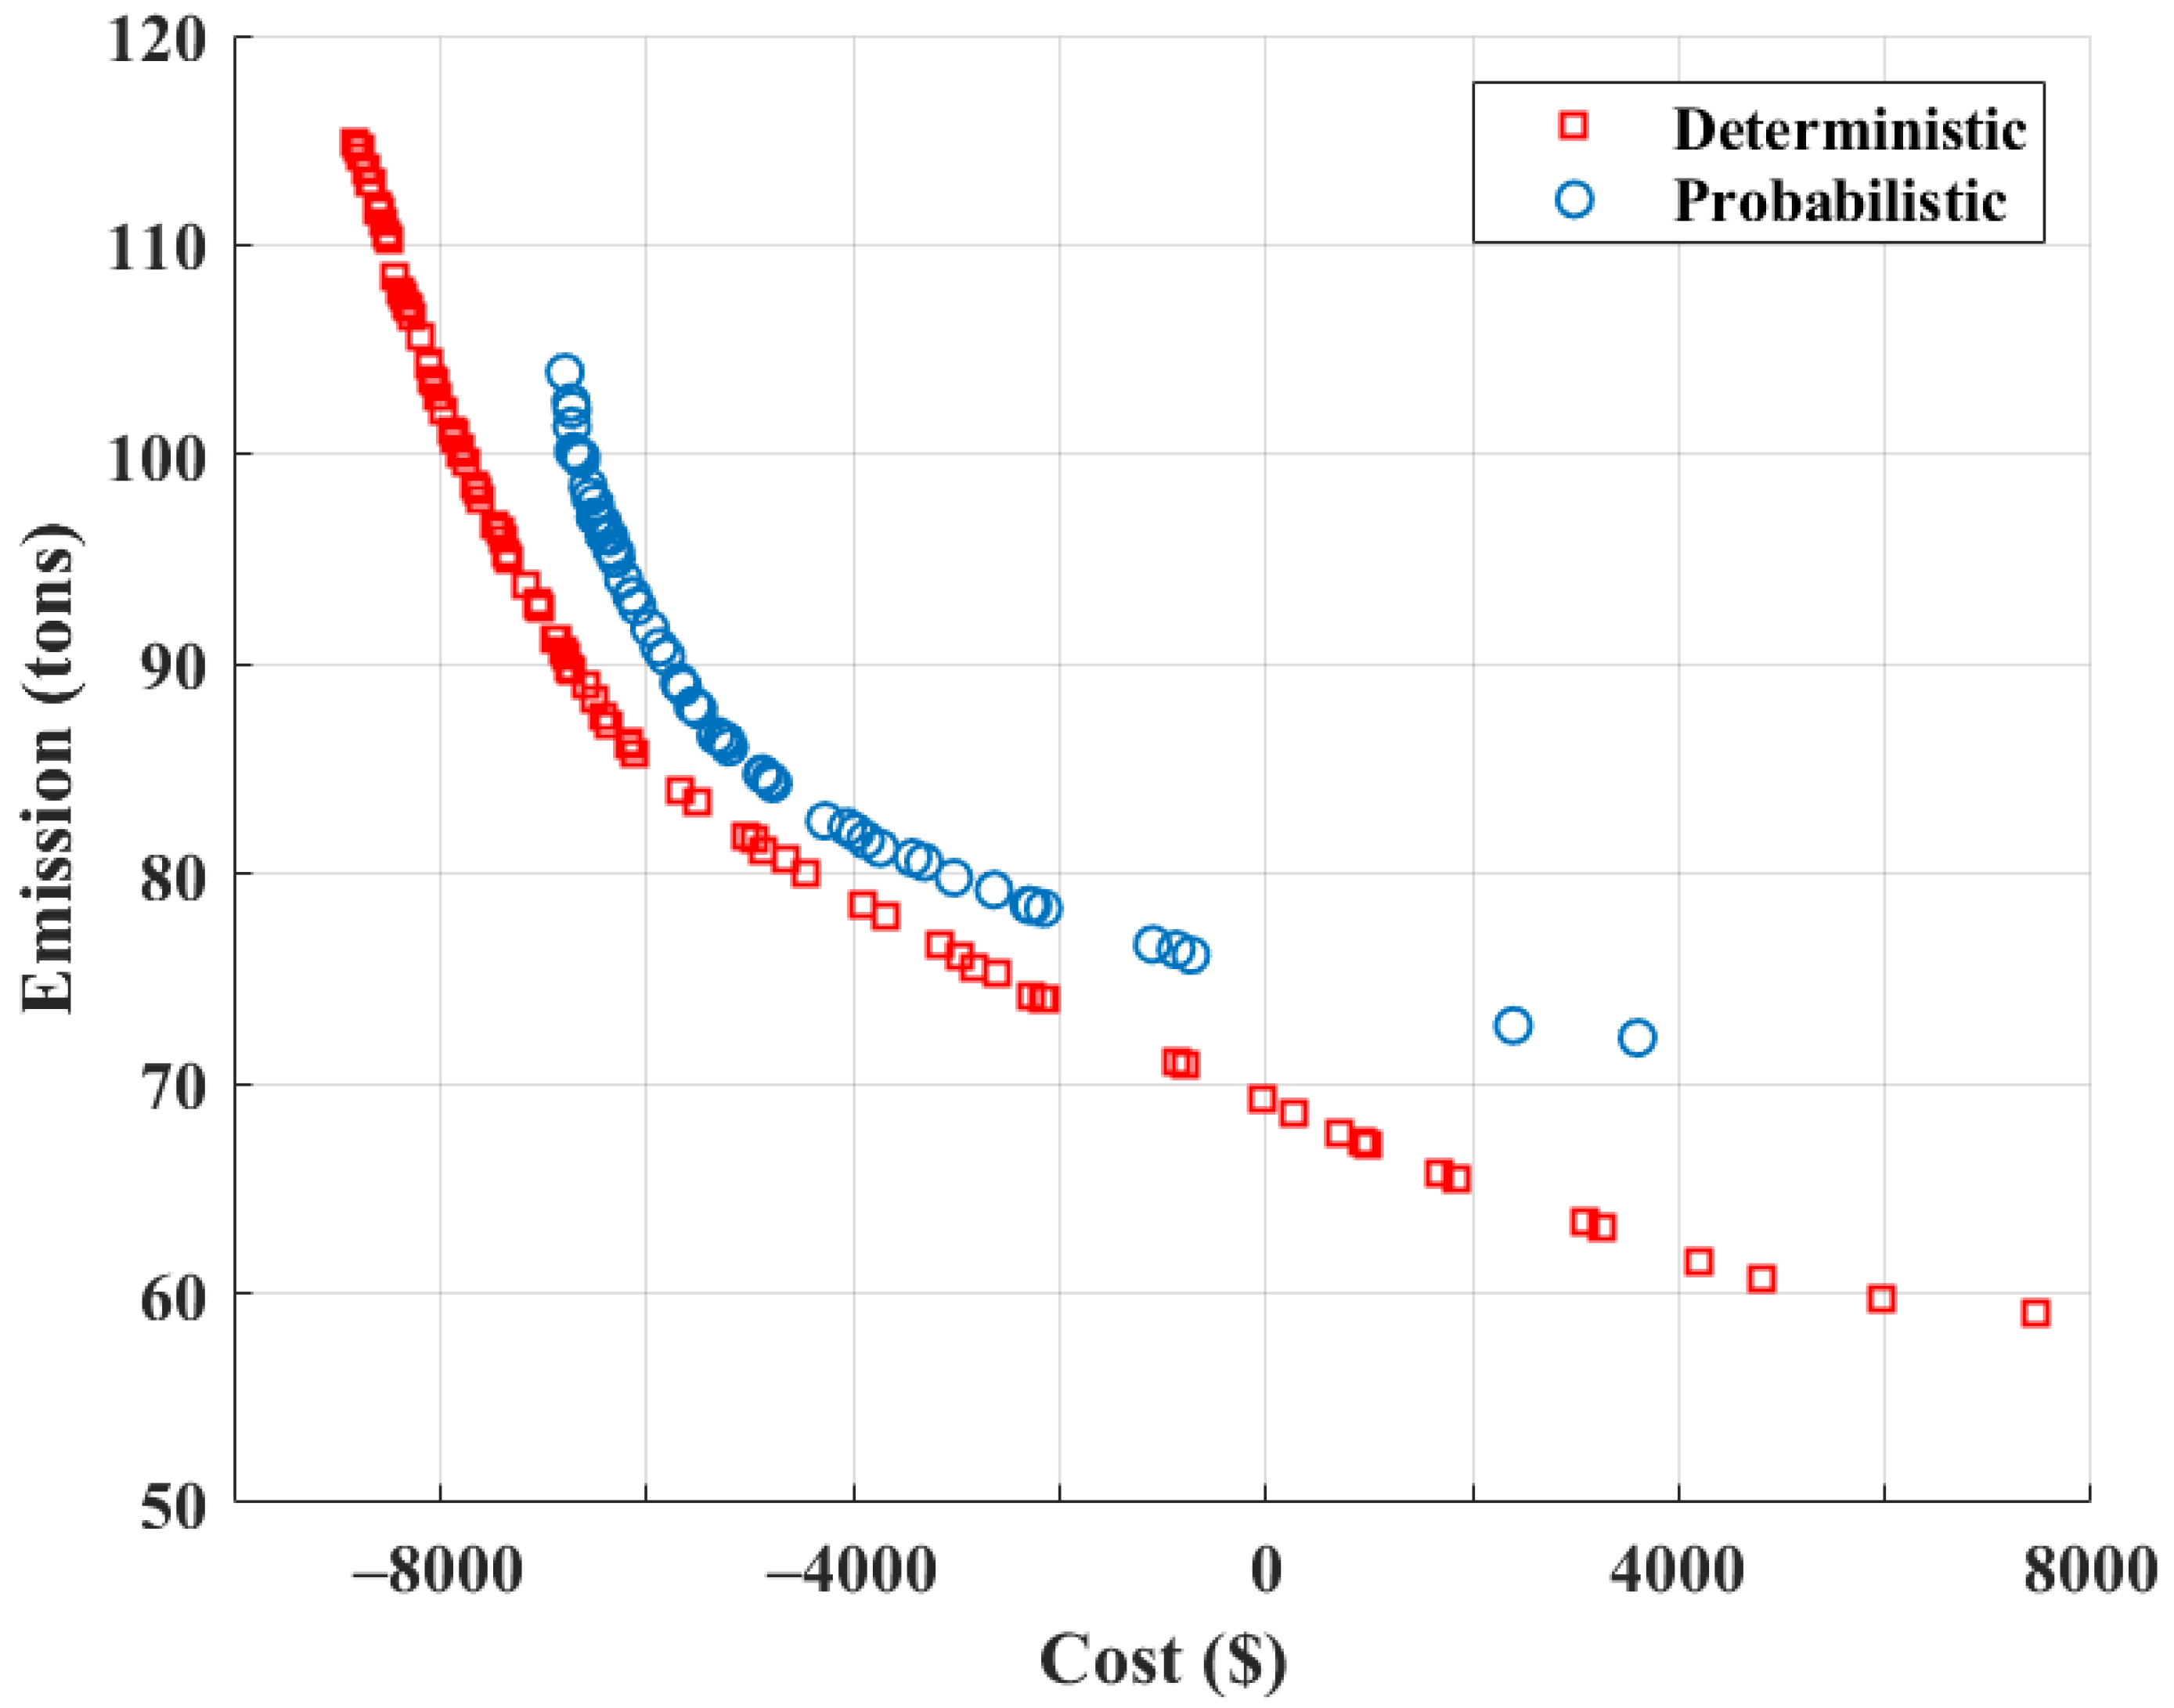
As it is shown in the single objective analysis section, the two objective functions (minimizing the cost and emission) conflict each other and consequently the problem can be solved as a multi-objective problem. When considering the problem as multi-objective, based on the dominancy and Pareto optimal concept, there exists a set of solutions with different values for objective functions instead of one single solution (
Figure 15). According to
Figure 15, the MMG operator decides to choose one of the solutions in the set of solutions with different economic/ environmental indices based on the priority of the indices.
In
Figure 15, the Pareto optimal fronts of both probabilistic and deterministic optimal operation of MMG system are shown. It is observed that when the uncertainties are considered in the parameters, the obtained operational cost in the solutions of Pareto front decrease significantly. It can be concluded that, the influence of uncertainties on the costs of MMG system is higher comparing to their influence on the emission.
According to
Figure 15, when investigating the probabilistic problem, the maximum achievable profit decreases by 23% while the minimum emission level increases 22%. Consequently, when considering the effect of uncertainties on the optimal power management of MMG system the operational cost will increase 23% and the emission increases 22%.
7. Conclusions
In this paper, the problem of optimal power management of MMG systems by considering a sample MMG for two deterministic and probabilistic analyzes in single-objective and bi-objective scenarios is investigated. In the case of deterministic analysis, it is assumed that the predicted values for wind speed and solar irradiation, the load demand and the electricity price are not uncertain, and the best solution obtained in each case is obtained using the JAYA algorithm. In order to consider the effect of uncertainties on the power management of the considered MMG system, the UT method is used. The best solution in each case is presented using the proposed UT-MJAYA approach. Comparing the obtained values, it is observed that when considering the uncertainties, the value obtained in each case for probabilistic analysis is different from the deterministic analysis. The maximum amount of profit that can be obtained by the MMG, taking into account the uncertainties, is about 23% less than in the case where uncertainties are not taken into account. Moreover, in the probabilistic analysis, the minimum emission increases 22%. Given this issue, it is observed that the effect of considering uncertainty on the economic index is very significant. Therefore, to provide a more accurate and realistic solution and to achieve a planning that is economically and environmentally optimal, it is necessary to carefully address the uncertainties in the problem. Also, according to the problem formulation and the simulation results, it is concluded that the effect of changes in the amount of battery efficiency, energy price, fossil fuel-based unit capacity, the maximum exchangeable power between the MMG system and the electricity grid, the exchange between adjacent MGs in the MMG system and the price of electricity is very significant on the economic index, and, in the case of using more efficient batteries, the use of more suitable distributed generation resources, the operation of the MMG system can be more profitable. Also, the effect of changing the amount of load demand on both economic and environmental indices is very significant. Furthermore, it is observed that changing the capacity of renewable-based units (WT and PV) on the environmental index is significant and the effect of changing the capacity of PV units on the minimum amount of pollutant production is more noticeable. Future work can focus on solving the stochastic power management of MMG systems while considering reliability and risk management indices. Presenting an efficient approach for real-time optimal power flow of MMG systems while considering network constraints can also be considered for future studies.


 ,
, 


