Article

Prompt Frequency Stabilization of Ultra-Stable Laser via Improved Mean Shift Algorithm

1
National Time Service Center, Chinese Academy of Sciences, Xi’an 710600, China
2
University of Chinese Academy of Sciences, Beijing 100039, China
3
Key Laboratory of Time and Frequency Standards, Chinese Academy of Sciences, Xi’an 710600, China
*
Authors to whom correspondence should be addressed.
Electronics 2022, 11(9), 1319; https://doi.org/10.3390/electronics11091319
Submission received: 31 March 2022 / Revised: 15 April 2022 / Accepted: 19 April 2022 / Published: 21 April 2022

Abstract

:
In many scientific fields, the continuous operation of ultra-stable lasers is crucial for applications. To speed up the frequency stabilization process in case of the occurence of unexpected interruptions, a prompt frequency stabilization approach based on an improved mean shift algorithm is proposed and verified with a homemade laser system. We developed a double-loop feedback controller to steer the laser frequency with fast and slow channels, respectively. In this study, an improved mean shift algorithm is utilized to intelligently search for the transmission signal, which involves adaptively updating the sliding window radius and incorporating a Gaussian kernel function to update the shift vector. The number of lock points on the left and right sides of the central point determines the scanning direction to search for the transmission signal quickly. The laser is intentionally interrupted 306 times within 10,000 s to evaluate the relocking performance. The median auto-locking time of the laser is improved from 16 s to 4 s. By beating with another ultra-stable laser system, the laser frequency instability is measured to be less than 2.1 × 10 14 and the linewidth is 5 Hz. This work improves the adaptation and relocking ability of the ultra-stable laser in a complex environment.

1. Introduction

As the ultra-stable laser have the characteristics of high-frequency stability, it hasthey have been applied in many scientific research fields, such as optical clocks [1,2,3], gravitational wave detection [4,5,6,7], fundamental physical constant measurements [8,9,10], geodesy [11], low-noise microwave signal generation [12,13,14,15] and optical frequency transfer [16,17]. While most of the present ultra-stable laser systems can only be implemented in the laboratory, various applications demand the ultra-stable laser that can be utilized more extensively in the field or mobile platforms, even in space. A critical problem of laser engineering studies is the development of an automatic relocking mechanism for an extended period in an unattended environment. Simultaneously, to assure its reliable operation in a complicated environment, the ultra-stable laser should be able to relock promptly after any unexpected interruption.
Much research has been devoted to the automatic frequency locking of the ultra-stable laser [18,19,20,21]. In 2005, a relocking method based on a “flywheel circuit” with automatic gain control was presented, and the relocking time was 10 s [18]. While it is made with an analog circuit, it is not flexible enough to adapt to the control parameters of the system in various working conditions, and it is capable of working with a medium-finesse Fabry–Perot cavity. In 2016, a digital auto-locking laser system based on a field-programmable gate array (FPGA) was demonstrated for inter-satellite laser ranging. Since it has to scan the laser frequency finely to find the sharp cavity resonance, the entire process takes ∼8 min [19,20]. In 2020, an automatic laser frequency locking method utilizing pattern recognition technology was presented, which can automatically lock the laser frequency to the setting point of the atomical saturated absorption spectrum within 11.6 s [21]. However, the cavity-stabilized laser is more challenging because the width of the resonant peak of a high-finesse cavity is usually of the order of a tenth of the kilohertz level. The laser frequency has to scan finely enough to capture the narrow cavity resonance. On the other side, the built-up time of a high-finesse cavity may be of the order of the sub-ms level, which eventually limits the maximum scan speed of the laser frequency. We combine the advantages of the digital circuit’s high adaptability and the analog circuit’s short response time to address the aforementioned issues. This work focuses on a novel automatic relocking algorithm to improve the laser’s environmental adaptability and relocking time. An improved mean shift method, which includes adaptively updating the sliding window radius and introducing a Gaussian kernel function to update the shift vector, is used to search the transmission signal in this paper. The scanned direction is determined by the number of lock points on the left and right sides of the center point to detect the transmission signal quickly. This paper will study a fast auto-locking laser system with solid environment adaptability.

2. System Experimental Model

As shown in Figure 1, Pound–Drever–Hall (PDH) laser frequency stabilization technology is employed to lock the output frequency of the laser to one of the resonant frequencies of the optical reference cavity. It consists of an optical module and an electrical module. The laser output from the commercial 1550 nm NKT fiber laser is first shifted for 50 MHz by the acoustic-optical modulator (AOM, SGTF50-1550-1) and then phase-modulated by the electro-optic modulator (EOM, MPX-LN-0.1), as shown in Figure 1a. The first-order diffraction efficiency of the AOM is ∼60%, and the modulation frequency of the EOM is 20 MHz. The lens (L) is utilized for the optical reference cavity pattern matching, where a homemade mode-match lens asemble is applied to coupling the laser beam into the reference cavity. A polarization beam splitter (PBS) with an extinction ratio higher than 40 dB and a half-wave plate ( λ / 2 ) are inserted into the laser beam in front of the cavity to adjust the laser power entering the optical reference cavity. In the experiment, the utilized optical reference cavity has a finesse of 484,000 and a coupling efficiency of 11.2 % is achieved. The quarter-wave plate ( λ / 4 ) is used to rotate the reflected laser’s polarization plane by 90 degrees. The photo-detector (PD1) detects the beat signal between the laser carrier and the modulation sidebands. The PD2 detects the transmission signal behind the cavity. For PD1 and PD2, a homemade photodetector with a gain of 23 dB is used.

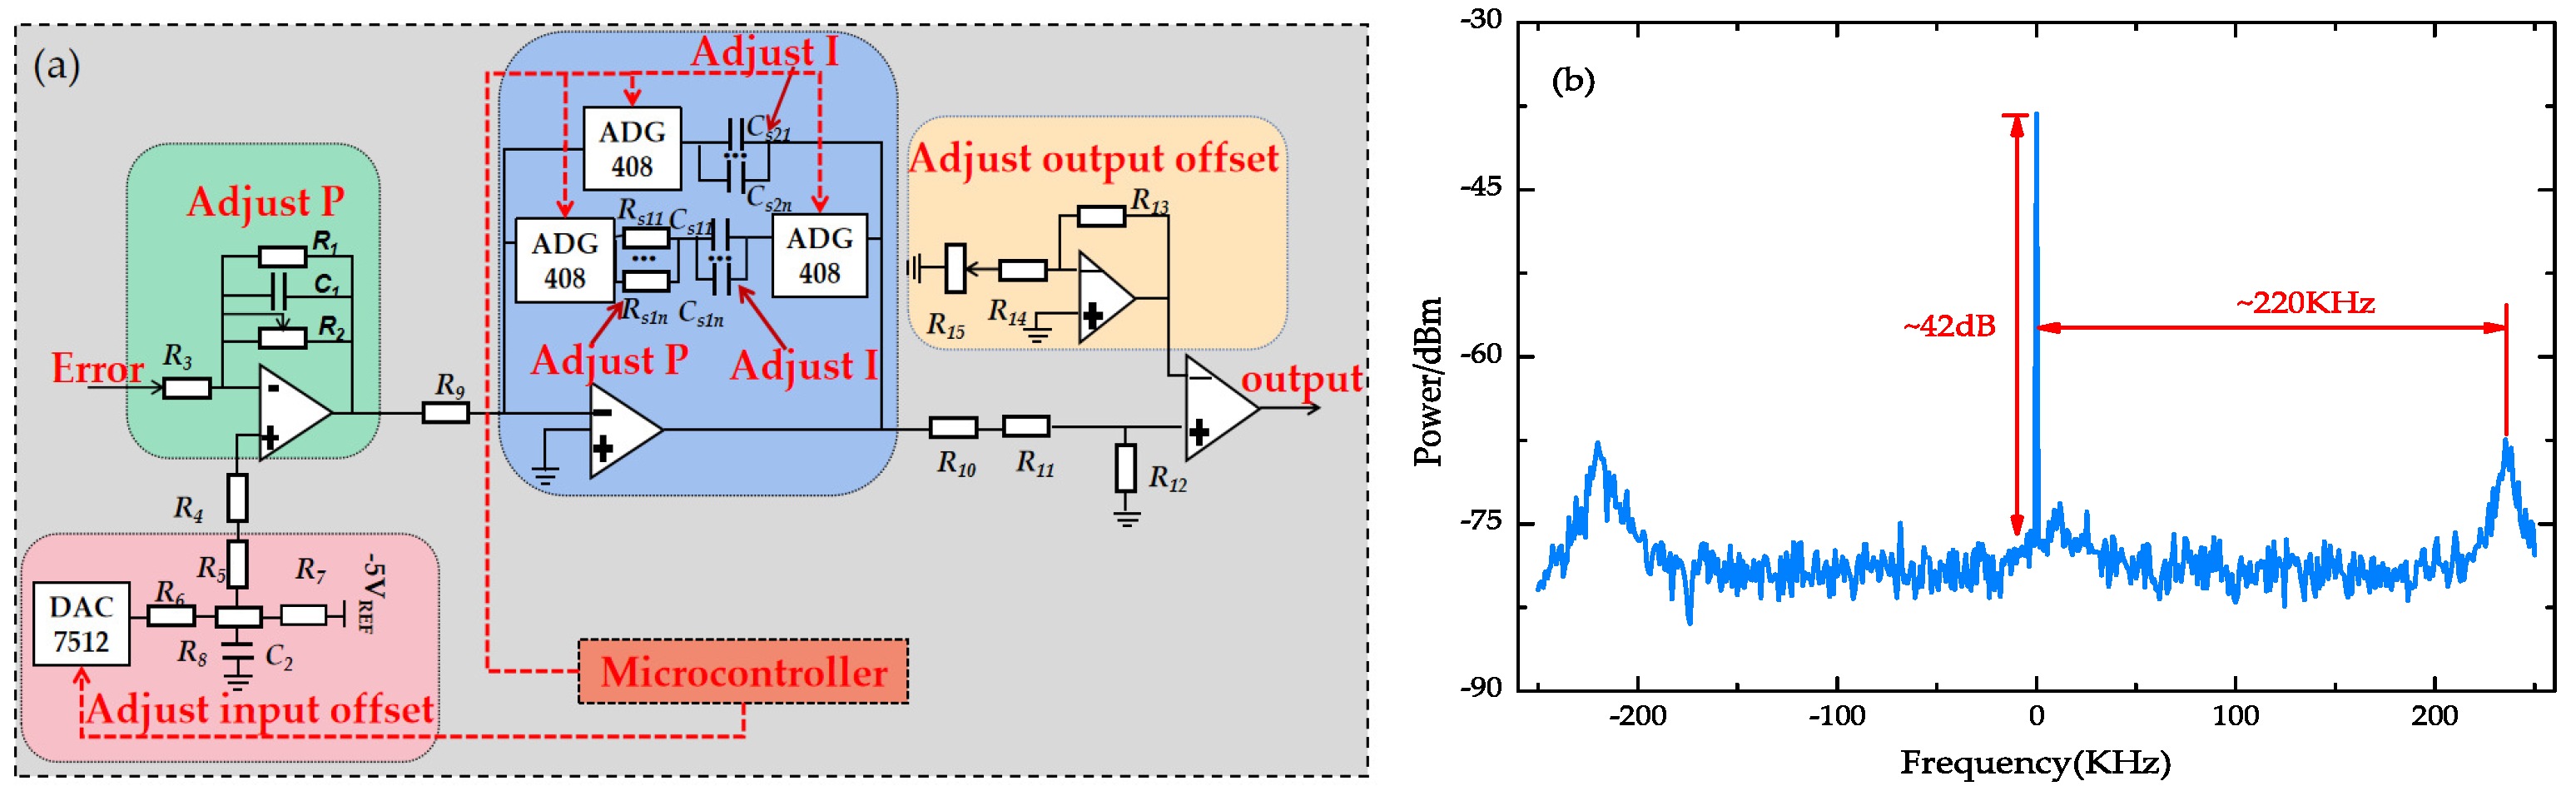
2.1. Hardware Design

As shown in Figure 1b, the electrical module consists of analog and digital components. The direct digital synthesis (DDS, AD9958) chip generates two 20 MHz signals. One signal is used to drive the EOM for phase modulation, while the other one is applied for demodulation. A homemade double-PI-loop feedback controller is developed to steer the piezo transducer (PZT) inside the laser head by a slow proportional–integral (slow PI) controller and the AOM by a fast PI controller, respectively.
The fast PI module is extremely important to us, so it is introduced in detail here. As shown in Figure 2a, the fast PI module consists of two proportional and integration (PI) stages connected in series. The fast PI part, which receives the frequency discrimination error signal as input, first adjusts its offset by controlling the DAC (DAC7512) via the microcontroller unit (MCU, STM32F103ZET6). The potentiometer R2 adjusts the gain of the primary PI. In the second PI stage, the MCU controls analog switches (ADG408) to combine different resistors and capacitors with changing the gain of the second stage and the noise suppression range. Further, the bias of the output signal is adjusted.
The output signal of the PDH detector in front of the optical reference cavity is separated by the power distributor, and the noise suppression range of the fast PI module is tested. As shown in Figure 2b, the noise suppression range of the fast PI is ∼220 kHz by optimizing the frequency locking parameters. And, the ratio of the carrier against the noise floor of the homemade module is about 42 dB.

2.2. Software Design

The essential part of the relocking includes two parts: the intelligent search for the locking point and the optimization of the resonance peak. Its detailed procedure is described below.

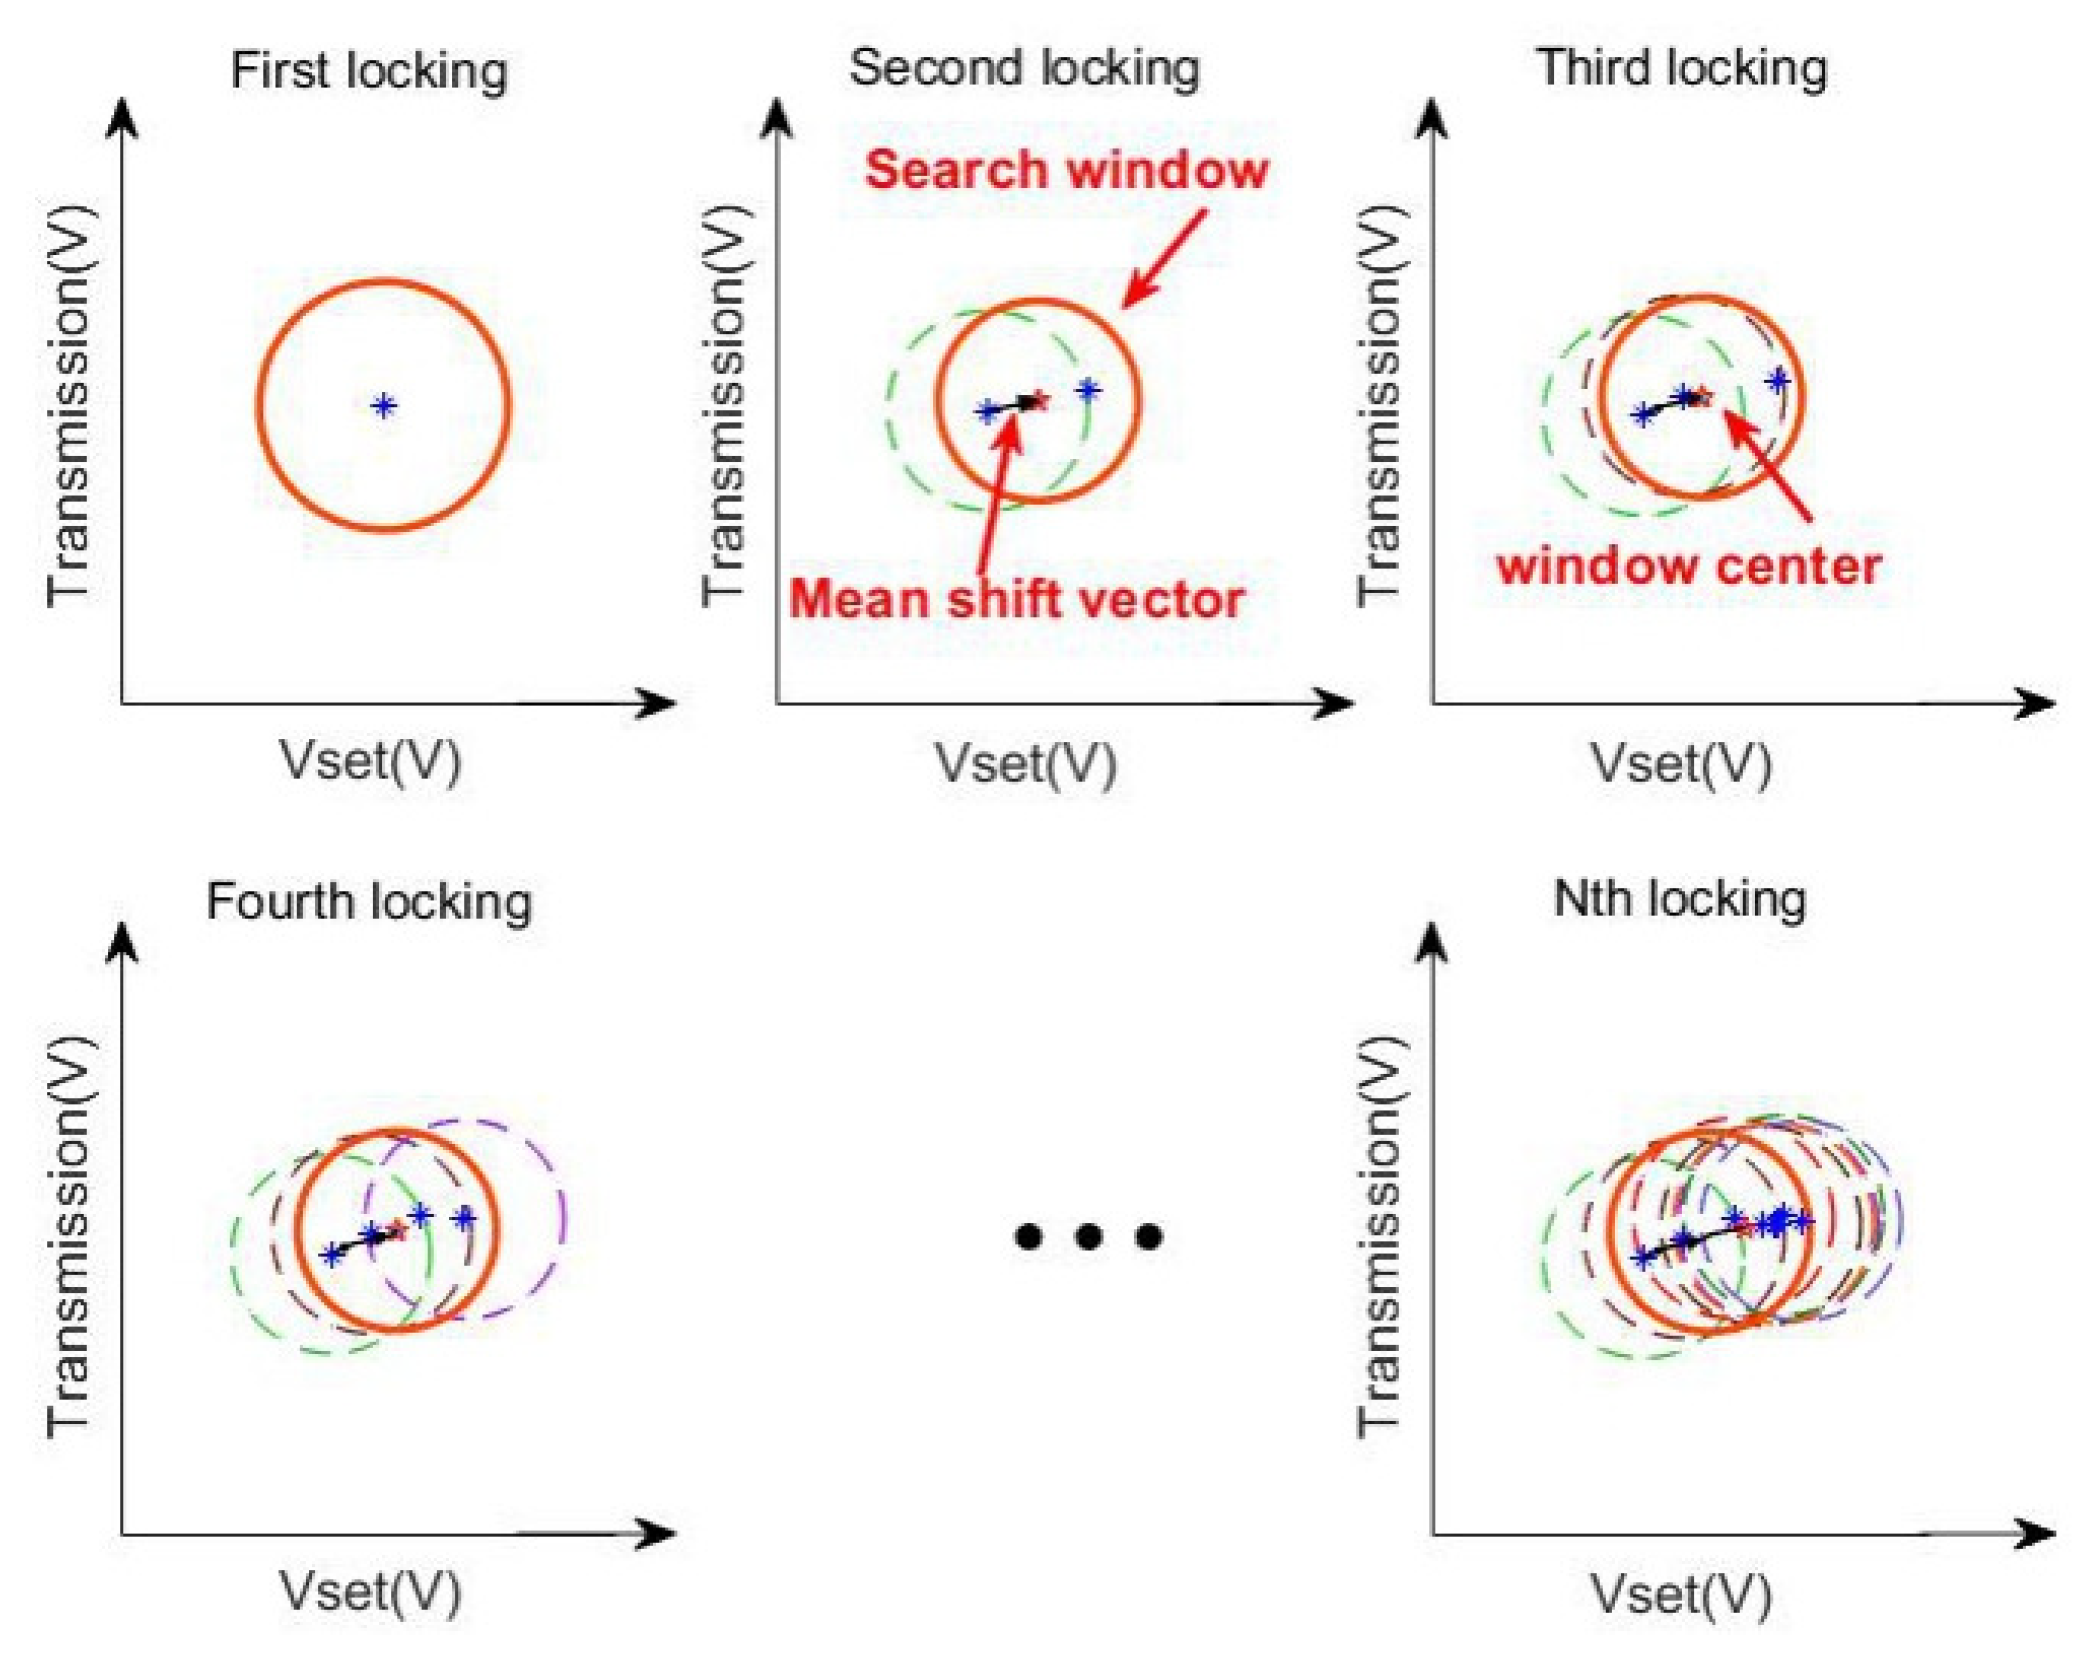
2.2.1. Intelligent Search for the Locking Point

In previous work, the laser frequency scans in a fixed range to find the resonance peak of the reference cavity. A moderate scan range is chosen to maintain balance between the relocking time and the chances of success, and a total relocking time of 16 s is realized with the laboratory laser system. Nevertheless, in many practical applications, the laser system needs to work in a demanding environment where only limited resources can be employed for environment control, such as space-borne platforms and field applications. The laser frequency may drift due to tricky operational conditions such as temperature, vibration and noise. We noticed that the locking point of the laser under test varies with the environment, mainly due to the room temperature. In that case, the laser’s locking point may drift out of the preset scan range, finally inducing the failure of the relocking process.
On the other hand, the mean shift algorithm has been widely used in moving-target tracking due to its advantages of robustness, simple computation and real-time performance [22,23]. In the process of laser relocking, searching for the transmitted signal may be regarded as a kind of signal-tracking process. In this paper, the traditional mean shift algorithm is improved for more efficient searches for laser locking points, including adaptively updating the sliding window radius and introducing the Gaussian kernel function to update the shift vector.
The principle of the mean shift algorithm is shown in Figure 3. The PZT voltage V p p 1 and cavity transmission V t 1 are the crucial parameters, denoted as the abscissa and ordinate, respectively. The solid-red and dashed circles represent, respectively, the current and previous search windows. The width of the search window is set to r. Once an unlocking event happens, the PZT voltage is scanned between V p p 1 r V p p 1 + r repeatedly until the cavity resonance signal is found. The searching process will halt once the transmission signal exceeds the threshold. The instant PZT voltage V p p 2 and transmission signal V t 2 will be recorded to calculate the initial state of the secondary search. Here, we define the shifts vector M 1 as M 1 = ( V p p 2 V p p 1 , V t 2 V t 1 ) / 2 . The coordinates of the center point Q 2 are modified as follows: Q 2 = M 1 + Q 1 = ( V p p 1 + V p p 2 , V t 1 + V t 2 ) / 2 . Thus, the shifts vector M 1 stands for the movement of the preset locking point of the laser frequency under various conditions.
Following the next laser unlock event, the PZT will be triggered to scan, following a procedure similar to the one described above, a few times. In this process, the centroid of the search window will shift from Q 2 to Q 3 on a step-by-step basis, among Q 3 = M 2 + Q 2 = ( V p p 1 + V p p 2 + V p p 3 , V t 1 + V t 2 + V t 3 ) / 3 . The calculation formula of the shift vector of all points in the search window is as follows:
M ( x ) = 1 n i = 1 n ( x i x )
After a few unlocks in this experiment, the shift direction of the centroid will be optimized for an even faster capture of the cavity resonance. We take a simple rule to adjudge the right direction, taking the points to the center to judge whether there are more left or more right locking points. All locking points eventually converge in the increasing density of the locking point, as shown in the search window of Figure 3. All locking points are essentially contained in the current search window. The specific scanning process is shown in Figure 4.
All locking points contribute equally to the shift vector as long as they fall into the search window, regardless of their distance from the center point. However, in the actual process of the iteration, the contribution of each locking point to solving the mean value is different. In other words, the locking point close to the center point should have a greater weight. Thus, we introduce a Gaussian kernel function so that the offset’s contribution to the shift vector varies with the distance. That is, the locking point closer to the center will contribute more than others.
Set Q to be the center point, ( V p p t , V t i ) the lock point, n the number of lock points and h the bandwidth in the search window. The formula for the Gaussian kernel function is as follows:
G h ( V p p i V p p ( c e n t e r ) ) = G ( V p p i V p p ( c e n t e r ) h ) h
A Gaussian kernel function is introduced to update the shift vector of the mean shift process. ω ( V p p i ) represents the weight of each point. The updated shift vector M is represented as:
M h ( V p p ( c e n t e r ) ) = i = 1 n G ( | | V p p i V p p ( c e n t e r ) h | | 2 ) ω ( V p p i ) ( V p p i V p p ( c e n t e r ) ) i = 1 n G ( V p p i V p p ( c e n t e r ) h ) ω ( V p p i )
= i = 1 n G ( | | V p p i V p p ( c e n t e r ) h | | 2 ) ω ( V p p i ) V p p i i = 1 n G ( V p p i V p p ( c e n t e r ) h ) ω ( V p p i ) V p p ( c e n t e r )
The updated center point coordinate, according to the calculated shift vector, is:
Q i + 1 = Q i + M h ( V p p ( c e n t e r ) )
The search window remains unchanged during the transmission signal tracking process after being determined artificially. If the search window is set too large, it will result in more iterations and a longer locking time. If the search window is set too small, it will fail to track when the transmission signal drifts too far away. Therefore, the search window size should be optimized to improve the system’s environmental adaptability, that is, to calculate the absolute value of the difference of horizontal coordinates between the center point and the lock point during this scanning process, and plus 0.5 t as the search window size for the subsequent scanning, until the transmission signal is searched for. The calculation formula is as follows; among them, t = 0 , 1 , 2 , n .
h i + 1 = | V p p i V p p ( c e n t e r ) | + 0.5 t

2.2.2. Optimizing of the Resonance Peak

After the intelligent search for the laser lock point, the laser can be locked to the cavity resonance. However, it is not locked to the highest position of the resonance peak. So, we introduce the optimization of the resonance peak searching. The input offset of the slow PI gradually increases from the initial value, with a step of 1 mV in our case, until the cavity transmission is less than it was at a previous time. Once the input offset is optimized, the PI parameters will be optimized on a step-by-step basis by minimizing of RMS of the error signal. Figure 5 depicts the specific process.
In the experimental system, we used C language to develop the software program for calculating the mean value of the shift vector, searching for the transmission signal behind the cavity and the locking optimization. A typical relocking process is shown in Figure 6. The frequency, transmission signal and error signal recorded during the auto-locking process are depicted in Figure 6a–c. The figure shows that it can be relocked at 2.6 s after the laser is unlocked. The results show that the relocking algorithm dramatically reduces the locking time when applied to the transmission signal’s searching process.

3. Experimental Results and Discussion

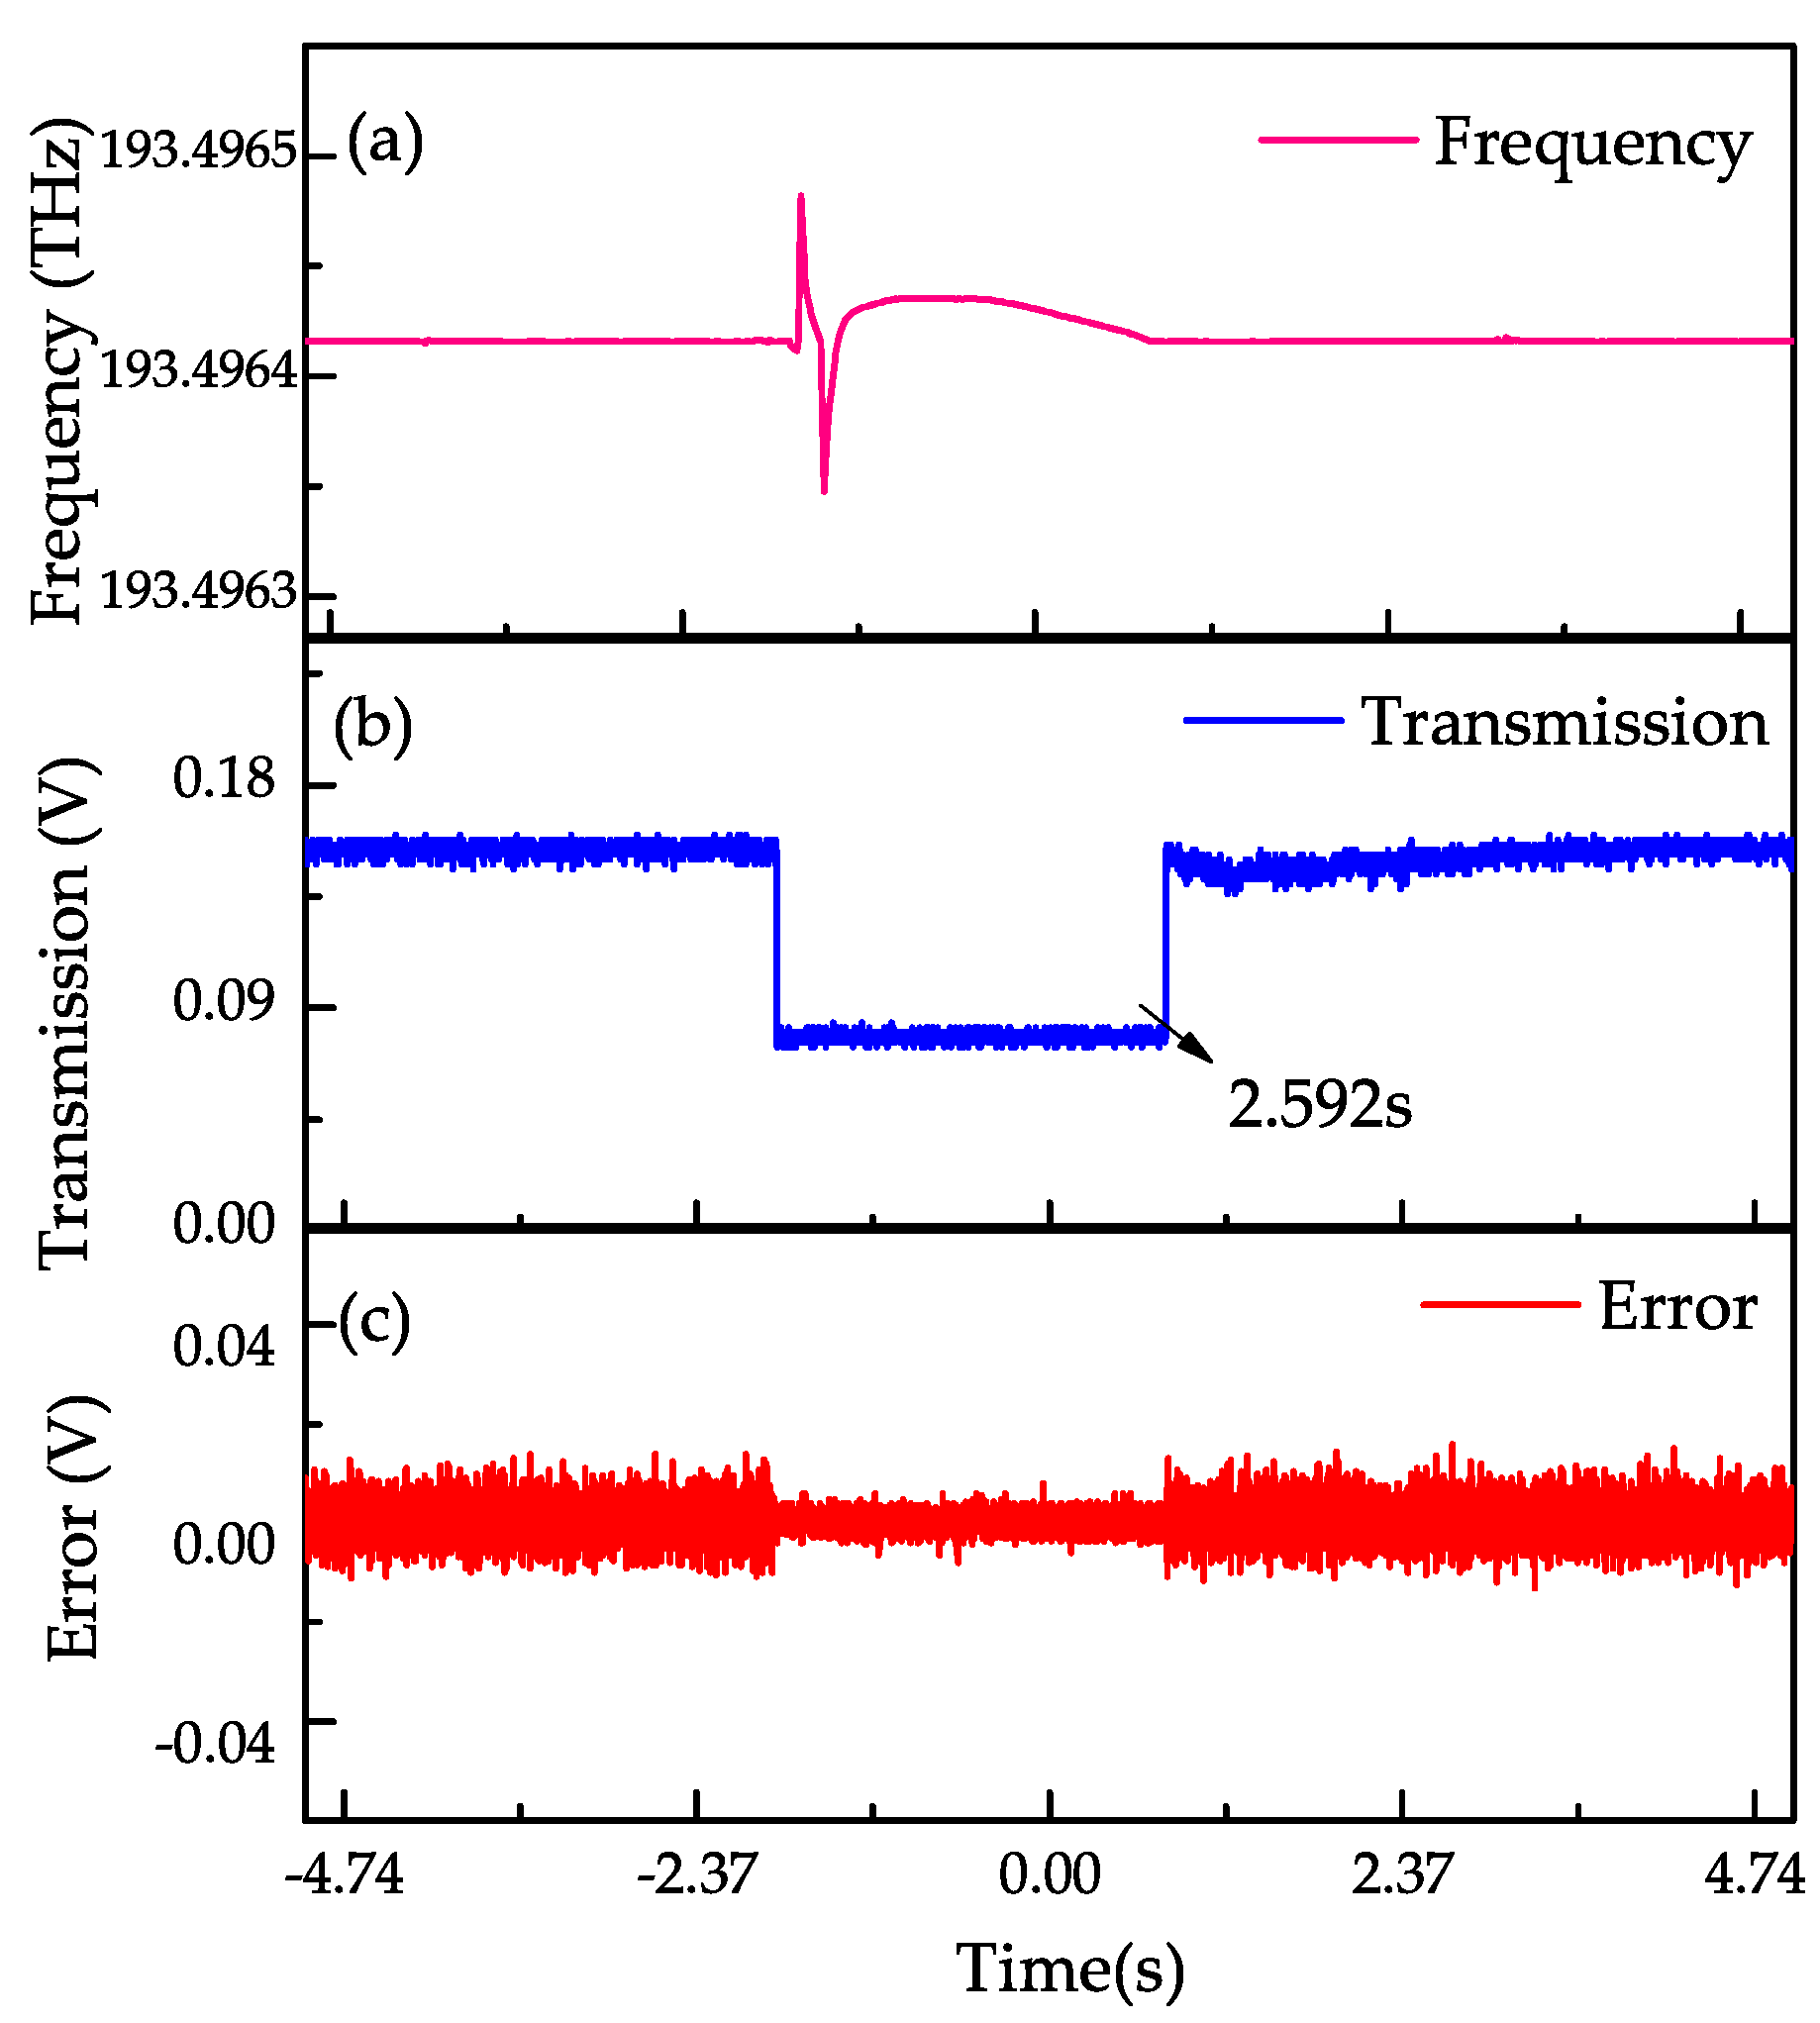
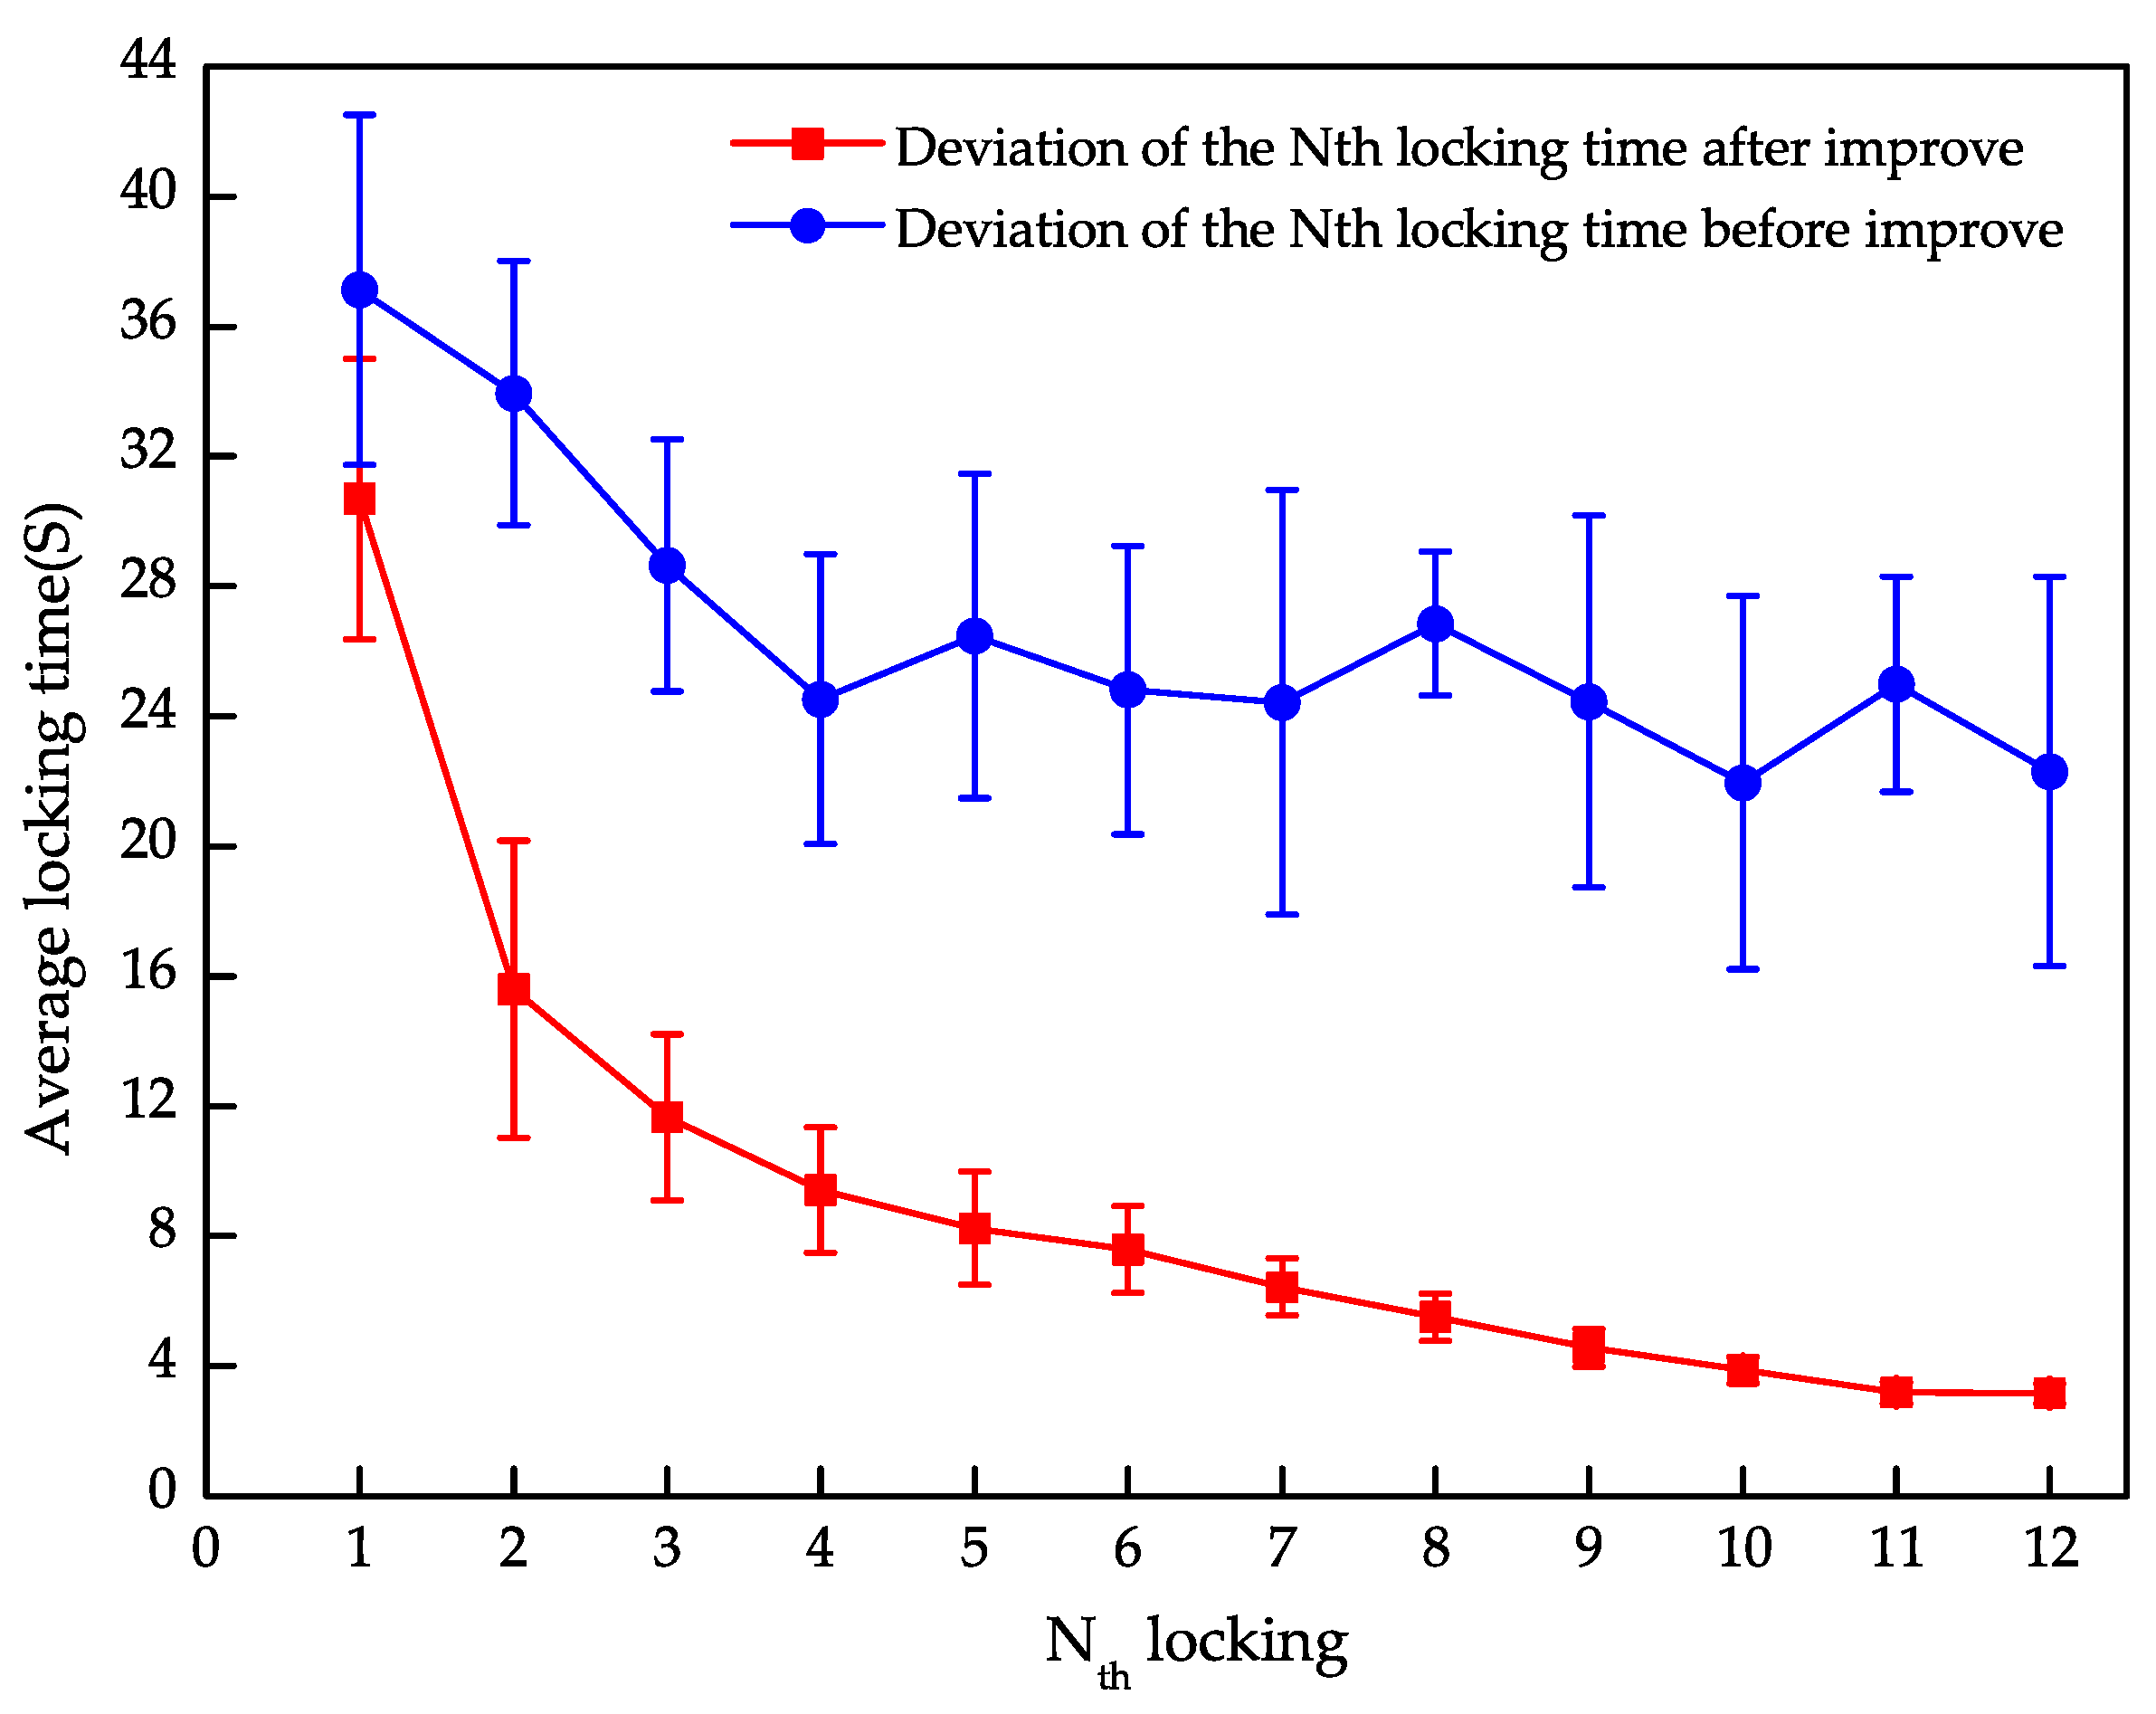
3.1. Test of Relocking Algorithm

An indoor ultra-stable laser system is applied to evaluate the performance of the proposed relocking algorithm. The reference cavity’s active temperature control and vibration isolation are turned off, intended to simulate realistic operation conditions. The frequency locking of the ultra-stable laser is interrupted by switching off the EOM driving power for a short moment of ∼10 ms. When the cavity transmission drops below the threshold, the relocking process of the laser is triggered. In the experiment, we observed 306 relocking processes in a test period of ∼1000 s; the statistics are shown in Figure 7. Generally, the relocking duration is centered in 2∼6 s. The green curve indicates that the probability of a relocking time within 7 s is ∼79% and that the median relocking time is 4.1 s, which is nearly four times higher than previous results. We notice that the most probable relocking time is only 3 s.
The relocking times before and after the improvement of the algorithm is shown in Figure 8. In the experiment, we interrupted the frequency locking consequently 12 times in our case, and recorded the corresponding relocking time of for each step.
We can see a clearly decreasing trend of the relocking time. We repeat the relocking procedure ten times to decrease the statistical uncertainty, which is indicated as the error bar in the plot. The relocking time is suppressed step-by-step from the plot and converges to less than 3.5 s with the improved algorithm.
In contrast, the previous relocking algorithm does not show an apparent decrease in the relocking time. The system’s mean relocking time is more than 20 s with a significant fluctuation of ∼8 s. This demonstrates that the improved mean shift algorithm significantly impacts the laser locking time.

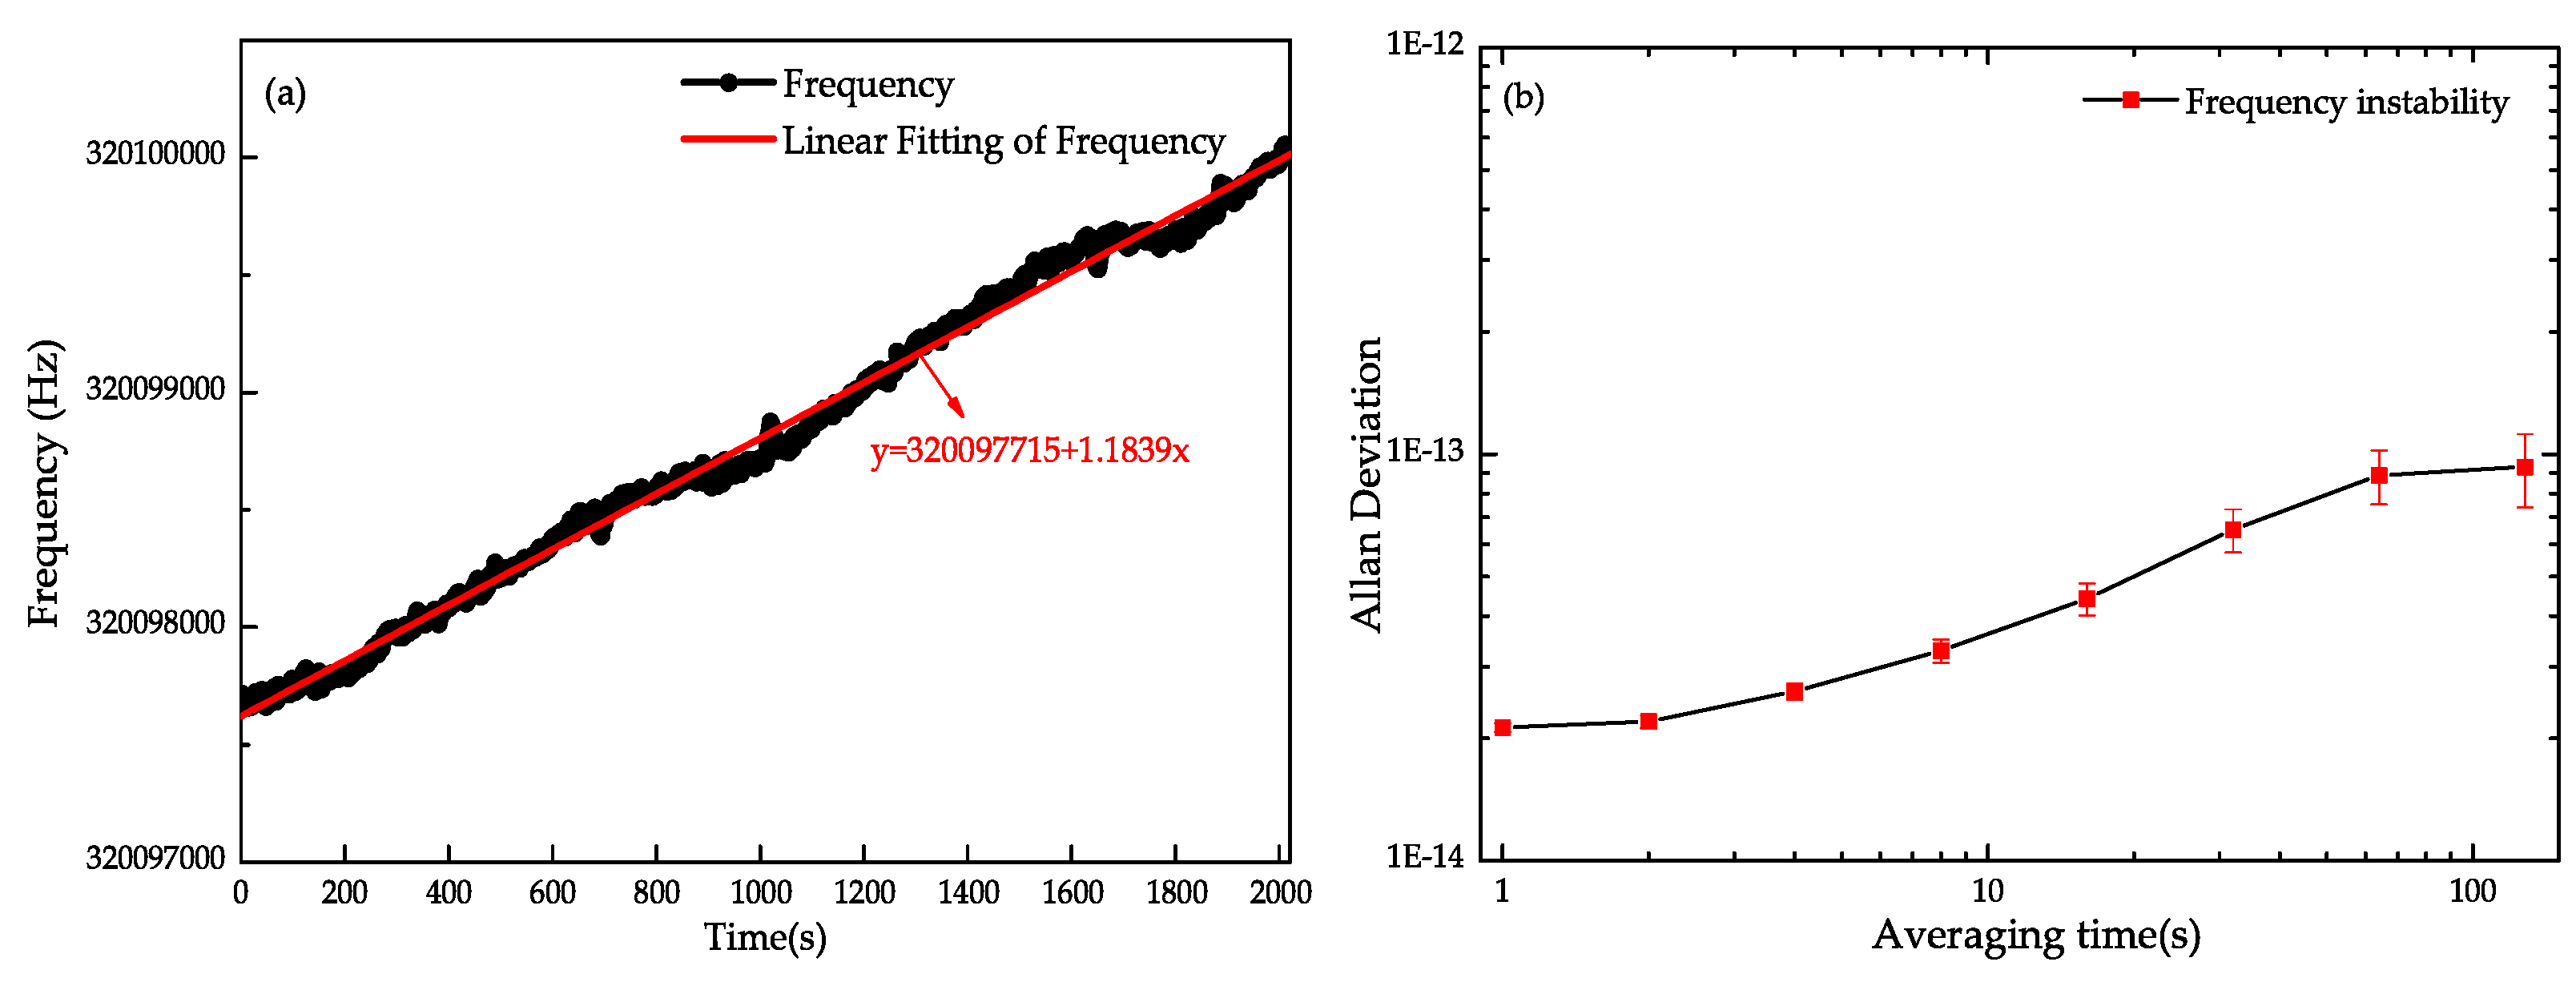
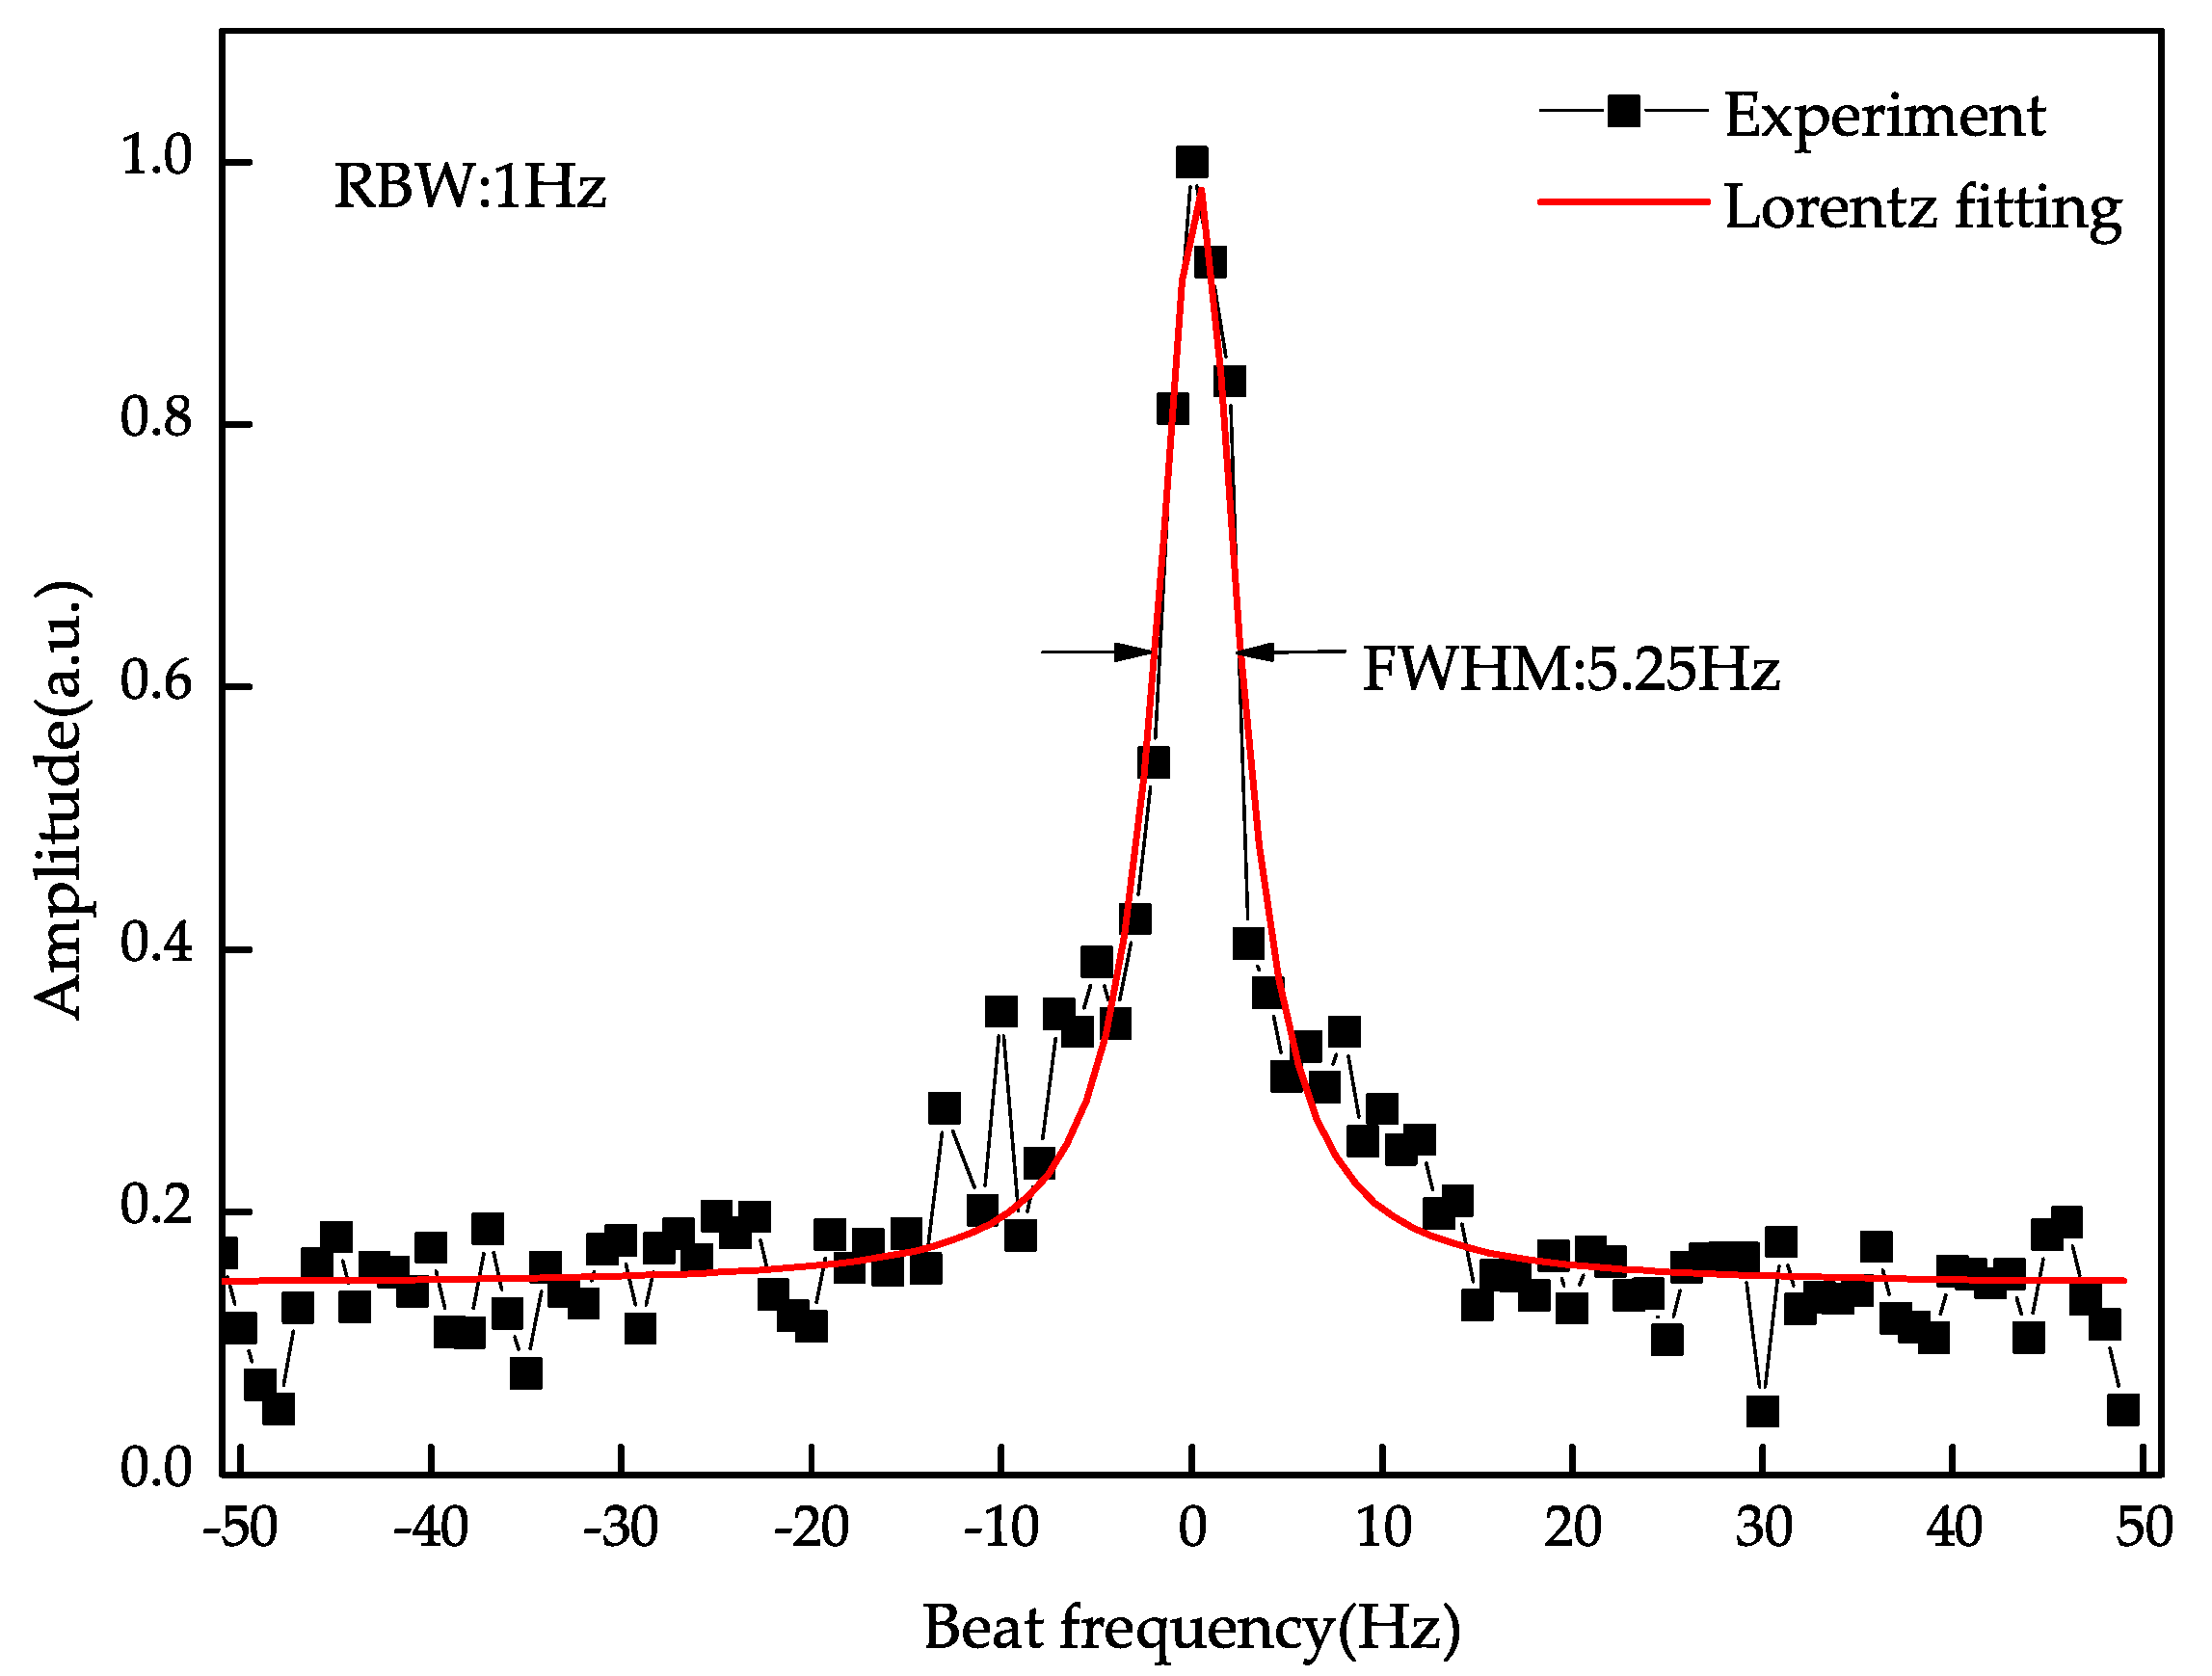
3.2. Frequency Stability of the Ultra-Stable Laser

The beat signal was obtained between the ultra-stable laser output from the system and another 1550 nm ultra-stable laser system to evaluate the performance of the improved system. The beat signal is divided into two channels, one of which records the change of the beat signal over time through a frequency counter to measure the laser frequency stability, and another to measure the spectrum distribution of the beat signal through a spectrum analyzer to obtain the beat linewidth. The change of the beat signal over time, measured by the frequency counter, is shown in Figure 9a. The beat signal drifts from 320,097,715 Hz to 320,100,042 Hz within 2000s. By linearly fitting the beat signal, it can be seen that the linear drift rate is 1.18 Hz/s. The frequency stability of the ultra-stable laser without the linear drift is shown in Figure 9b. The stability of the laser frequency is better than 2.1 × 10 14 within 1 s.
A spectrum analyzer is used to measure the spectral characteristics of the beat signal, and the resolution of the spectrum analyzer is set to 1 Hz to obtain the laser linewidth, as shown in Figure 10. The laser linewidth is 5.25 Hz, as determined by the Lorentz linear function fitting. Since the temperature control and vibration isolation are turned off for the evaluation of the relocking algorithm, we believe that the frequency stability and linewidth should be improved with a better environment.

4. Conclusions

In summary, a double-PI-loop digital–analog feedback controller based on an improved mean shift algorithm has been successfully applied to the automatic relocking of the ultra-stable laser. The algorithm can quickly judge the scanning direction of the laser when the unlocking occurs and can adaptively change the size of the scanning window, which can shorten the re-locking time of the laser. In 306 sets of testing with intended interruptions, the median relocking time is 4.1 s and the probability of a relocking time less than 7 s is 79 % . By beating the measurement with another 1550 nm ultra-stable laser, the frequency instability within 1 s is about 2.1 × 10 14 and the beat frequency linewidth is 5.25 Hz. We believe that temperature control and vibration isolation will improve the system’s indications.

Author Contributions

Conceptualization, R.D. and S.Z.; methodology, L.F.; software, L.F.; validation, L.F., D.J. and J.L. (Jun Liu); formal analysis, L.F.; data curation, L.C.; writing—original draft preparation, L.F.; writing—review and editing, L.F., J.L. (Jie Liu), L.Z. and G.X.; supervision, R.D. and T.L. All authors have read and agreed to the published version of the manuscript.

Funding

The project is partially supported by the National Natural Science Foundation of China (Grant No. 11903041), the Youth Innovation Promotion Association of the Chinese Academy of Sciences (Grant No. 1188000XGJ) and the Young Innovative Talents of the National Time Service Center of the Chinese Academy of Sciences (Grant No. Y917SC1).

Conflicts of Interest

The authors declare that there is no conflict of interest.

References

  1. Cao, J.; Zhang, P.; Shang, J.; Cui, K.; Huang, X. A compact, transportable single-ion optical clock with 7.8 × 10⁻¹⁷ systematic uncertainty. Appl. Phys. B 2017, 123, 112. [Google Scholar] [CrossRef]
  2. Schiller, S.; Görlitz, A.; Nevsky, A.; Alighanbari, S.; Vasilyev, S.; Abou-Jaoudeh, C.; Mura, G.; Franzen, T.; Sterr, U.; Falke, S. The Space Optical Clocks Project: Development of high-performance transportable and breadboard optical clocks and advanced subsystems. In Proceedings of the 2012 European Frequency and Time Forum, Gothenburg, Sweden, 23–27 April 2012; pp. 412–418. [Google Scholar]
  3. Swierad, D.; Hfner, S.; Vogt, S.; Venon, B.; Sterr, U. Ultra-stable clock laser system development towards space applications. Sci. Rep. 2016, 6, 33973. [Google Scholar] [CrossRef] [PubMed] [Green Version]
  4. Patrick, K.; Bogan, C.; Danzmann, K.; Frede, M.; Kim, H.; King, P. Stabilized high-power laser system for the gravitational wave detector advanced LIGO. Opt. Express 2012, 20, 10617–10634. [Google Scholar]
  5. Nina, B.; Fabian, M.; Benno, W. Sequential high power laser amplifiers for gravitational wave detection. Opt. Express 2020, 28, 29469–29478. [Google Scholar]
  6. Li, Y.; Wang, C.; Wang, L.; Liu, H.; Jin, G. A laser interferometer prototype with pico-meter measurement precision for Taiji space gravitational wave detection missionin China. Microgravity Sci. Technol. 2020, 32, 331–338. [Google Scholar] [CrossRef]
  7. Dickmann, J.; Kroker, S.; Levin, Y.; Nawrodt, R.; Vyatchanin, S. Thermal noise of beam splitters in laser gravitational wave detectors. Phys. Rev. D 2018, 98, 082002. [Google Scholar]
  8. Peik, E.; Schumm, T.; Safronova, M.S.; Palffy, A.; Weitenberg, J.; Thirolf, P.G. Nuclear clocks for testing fundamental physics. Quantum Sci. Technol. 2021, 6, 034002. [Google Scholar] [CrossRef]
  9. Alauze, X.; Lim, J.; Trigatzis, M.A.; Swarbrick, S.; Collings, F.J.; Fitch, N.J.; Sauer, B.E.; Tarbutt, M.R. An ultracold molecular beam for testing fundamental physics. Quantum Sci. Technol. 2021, 6, 044005. [Google Scholar] [CrossRef]
  10. Herrmann, S.; Senger, A.; Möhle, K.; Nagel, M.; Kovalchuk, E.V.; Peters, A. Rotating optical cavity experiment testing Lorentz invariance at the 10−17 level. Phys. Rev. D 2019, 80, 105011. [Google Scholar] [CrossRef] [Green Version]
  11. Igel, H.; Schreiber, K.U.; Gebauer, A.; Bernauer, F.; Egdorf, S.; Simonelli, A.; Lin, C.-J.; Wassermann, J.; Donner, S.; Hadziioannou, C. Romy: A multi-component ring laser for geodesy and geophysics. Geophys. J. Int. 2021, 225, 684–698. [Google Scholar] [CrossRef]
  12. Nakamura, T.; Davila-Rodriguez, J.; Leopardi, H.; Sherman, J.A.; Fortier, T.M.; Xie, X.; Campbell, J.C.; McGrew, W.F.; Zhang, X.; Hassan, Y.S.; et al. Coherent optical clock down-conversion for microwave frequencies with 10−18 instability. Science 2020, 368, 889–892. [Google Scholar] [CrossRef] [PubMed]
  13. Xie, X.; Bouchand, R.; Nicolodi, D.; Giunta, M.; Hänsel, W.; Lezius, M.; Joshi, A.; Datta, S.; Alexandre, C.; Lours, M.; et al. Photonic microwave signals with zeptosecond-level absolute timing noise. Nat. Photonics 2017, 11, 44–47. [Google Scholar] [CrossRef]
  14. Fortier, T.M.; Kirchner, M.S.; Quinlan, F.; Taylor, J.; Bergquist, J.C.; Rosenband, T.; Lemke, N.; Ludlow, A.; Jiang, Y.; Oates, C.W.; et al. Generation of ultrastable microwaves via optical frequency division. Nat. Photonics 2011, 5, 425–429. [Google Scholar] [CrossRef] [Green Version]
  15. Heinecke, D.C.; Bartels, A.; Diddams, S.A. Offset frequency dynamics and phase noise properties of a self-referenced 10 GHz Ti: Sapphire frequency comb. Opt. Express 2011, 19, 18440–18451. [Google Scholar] [CrossRef] [Green Version]
  16. Ohmae, N.; Sakama, S.; Katori, H. High-stability optical frequency transfer with all-fiber architecture for optical lattice clocks. Electron. Commun. Jpn. 2019, 102, 43–48. [Google Scholar] [CrossRef]
  17. Chiodo, N.; Quintin, N.; Stefani, F.; Wiotte, F.; Camisard, E.; Chardonnet, C.; Santarelli, G.; Amy-Klein, A.; Pottie, P.-E.; Lopez, O. Cascaded optical fiber link using the internet network for remote clocks comparison. Opt. Express 2015, 23, 33927–33937. [Google Scholar] [CrossRef] [Green Version]
  18. Lee, S.K.; Han, B.W.; Cho, D. Automatic system to relock a laser frequency to a Fabry–Perot cavity. Rev. Sci. Instrum. 2005, 76, 026101. [Google Scholar] [CrossRef]
  19. Luo, Y.; Li, H.; Yeh, H.-C.; Luo, J. A self-analyzing double-loop digital controller in laser frequency stabilization for inter-satellite laser ranging. Rev. Sci. Instrum. 2015, 86, 044501. [Google Scholar] [CrossRef]
  20. Luo, Y.; Li, H.; Yeh, H.-C. Note: Digital laser frequency auto-locking for inter-satellite laser ranging. Rev. Sci. Instrum. 2016, 87, 056105. [Google Scholar] [CrossRef]
  21. Li, Q.-X.; Zhang, X.; Zhu, L.-X.; Yan, S.-H.; Jia, A.A.; Luo, Y.-K.; Wang, Y.-N.; Wei, C.-H.; Zhang, H.-K.; Lv, M.-J.; et al. Intelligent and automatic laser frequency locking system using pattern recognition technology. Opt. Lasers Eng. 2020, 126, 105881. [Google Scholar] [CrossRef]
  22. Vojir, T.; Noskova, J.; Matas, J. Robust scale-adaptive mean-shift for tracking. Pattern Recognit. Lett. 2014, 49, 250–258. [Google Scholar] [CrossRef]
  23. Ning, J.; Zhang, L.; Zhang, D.; Wu, C. Robust mean-shift tracking with corrected background-weighted histogram. IET Comput. Vis. 2012, 6, 62–69. [Google Scholar] [CrossRef] [Green Version]
Figure 1. (a) Schematic diagram of the 1550 nm ultra-stable laser auto-locking system; (b) schematic diagram of the electronic control system. AOM, acoustic-optical modulator; EOM, electro-optical modulator; L, lens; λ / 2 , half-wave plate; PBS, polarization beam splitter; λ / 4 , quarter-wave plate; PD, photo-detector; DDS, direct digital synthesis; slow PI, slow proportional–integral controller; fast PI, fast proportional–integral controller.
Electronics 11 01319 g001
Figure 2. (a) Design of the fast PI control loop; (b) noise suppression range of the fast PI module.
Electronics 11 01319 g002
Figure 3. Improved mean shift algorithm for the scanning transmission signal.
Electronics 11 01319 g003
Figure 4. Scanning process for the transmission signal.
Electronics 11 01319 g004
Figure 5. Flowchart of the optimization of the resonance peak.
Electronics 11 01319 g005
Figure 6. (a) Frequency signal during the relocking process; (b) transmission signal during the relocking process; (c) error signal during the relocking process.
Electronics 11 01319 g006
Figure 7. Distribution of the relocking time for 306 groups.
Electronics 11 01319 g007
Figure 8. Comparison of locking time error bar before and after the system improvement.
Electronics 11 01319 g008
Figure 9. (a) Beat signal drift with time; (b) frequency stability measurement.
Electronics 11 01319 g009
Figure 10. Beat linewidth measurement.
Electronics 11 01319 g010
Publisher’s Note: MDPI stays neutral with regard to jurisdictional claims in published maps and institutional affiliations.

