Article

Leakage Current Stability Analysis for Subthreshold SRAM

1
Key Laboratory of Intelligent Computing & Signal Processing, Ministry of Education, Anhui University, Hefei 230601, China
2
School of Integrated Circuits, Anhui University, Hefei 230601, China
3
Engineering Technology Research Center of Internet of Things Spectrum Sensing and Testing, Hefei 230601, China
*
Author to whom correspondence should be addressed.
Electronics 2022, 11(8), 1196; https://doi.org/10.3390/electronics11081196
Submission received: 23 March 2022 / Revised: 31 March 2022 / Accepted: 5 April 2022 / Published: 9 April 2022
(This article belongs to the Special Issue VLSI Design, Testing, and Applications)

Abstract

:
Low-power memories typically operate in the subthreshold region of the device; however, as the supply voltage continues to decrease, the impact of leakage current on SRAM stability becomes more significant. The traditional method of measuring static noise tolerance only considers the effect of voltage, and the measurement results are not accurate enough. Therefore, this paper proposes a leakage-current-based stability analysis that provides better metrics, reads current noise tolerance (RINM) and writes current noise tolerance (WINM) to measure the stability of subthreshold SRAMs. Both currents and voltages were taken into account. The results demonstrate that the method is more accurate than the conventional method under subthreshold levels.

1. Introduction

VLSI testing has been a hot topic in current ICs, especially with the increasing application of low-power memories. Usually, static noise tolerance (SNM) is one of the criteria used to measure the stability of SRAM [1]. However, due to the advantages of low-power designs, low-power memories often operate in the subthreshold region of the device. In the subthreshold region, the on/off current ratio (Ion/Ioff) of the device decreases exponentially as the supply voltage decreases [2]. Therefore, the effect of leakage current on stability becomes one of the factors that must be considered to measure the stability of subthreshold SRAMs [3].
However, static noise tolerance (SNM) usually only considers the effect of voltage, and the stability of SRAM is reflected by the maximum rollover voltage under SRAM read and write operations [4]. Therefore, in a subthreshold environment, static noise tolerance does not fully take into account the effect of leakage current, and the measurement is not accurate. Moreover, at low supply voltages, the SNM metric is limited by Vdd/2 [5], so the static noise tolerance limits the voltage scaling of SRAM designs. On the other hand, the measurement of static noise tolerance is not directly derived from measurements and requires additional mathematical tools for calculation [6]. Considering the limitations of conventional methods, more and more people are adopting new methods to measure the stability of SRAM. The papers [7,8] both use the latest N-curve method to measure the stability of SRAM, but these papers do not compare the two methods in practice, let alone analyze the effect of leakage current on the stability of the memory cell under subthreshold levels.
Therefore, considering the limitations of static noise tolerance at subthreshold levels, this paper proposes a leakage-current-based stability analysis method for the measurement of subthreshold SRAM stability. Unlike the traditional method, the method in this paper proposes four measurement metrics: read voltage noise tolerance (RVNM), read current noise tolerance (RINM), write voltage noise tolerance (WVNM) and write current noise tolerance (WINM). The four metrics reflect, respectively, the maximum rollover current and voltage of SRAM under read and write operations. Moreover, this method does not need to use additional mathematical tools for calculation, and the measurement index is not limited by 0.5 Vdd.
In the second part, this paper first introduces the importance of leakage current, and then introduces the traditional method and the leakage-current-based stability analysis method, and compares the advantages and disadvantages in three aspects: method principle, experimental steps and simulation verification. The results show that the method proposed in this paper is more accurate in terms of results and simpler in terms of experimental steps compared with the conventional method under subthreshold levels. In the third section, the paper performs simulation validation in terms of two aspects: different process angles and different designs, and the results obtained prove the conclusions of this paper. The contribution of this paper is to propose a simpler and more accurate stability simulation method for SRAM under subthreshold levels, which provides a new way of thinking for VSLI testing.

2. Methods

2.1. Impact of Leakage Current on SRAM

Static noise tolerance is one of the most important influencing factors of SRAM stability [9]. The conventional method to measure SRAM stability is static stability analysis, which measures the stability of SRAM by measuring the magnitude of static noise tolerance. However, at subthreshold levels, static stability analysis only considers the effect of voltage on stability and ignores the effect of leakage current, so this is only applicable to operation in the saturation region. In this paper, the TSMC 28 nm hpc process was chosen to measure the on/off current ratio of pch_lvt_mac and nch_lvt_mac transistors, respectively, as shown in Figure 1.
The on/off current ratio (Ion/Ioff) of the device decreases as the supply voltage decreases to 0.117% of the original value for PMOS (from 3.946 × 10⁶ to 5.6 × 10³) and 0.409% for NMOS (from 1.106 × 10⁶ to 4.527 × 10³). In the saturation region, the on/off current ratio of the device is about 106 (PMOS = 3.946 × 10⁶, NMOS = 1.106 × 10⁶), and the accumulated leakage current can be neglected. However, for devices operating in the subthreshold region, the on/off current ratio (Ion/Ioff) is approximately 103 (PMOS = 5.6 × 10³, NMOS = 4.527 × 10³), at which point ignoring the effect of leakage current can cause significant errors in the stability measurements.

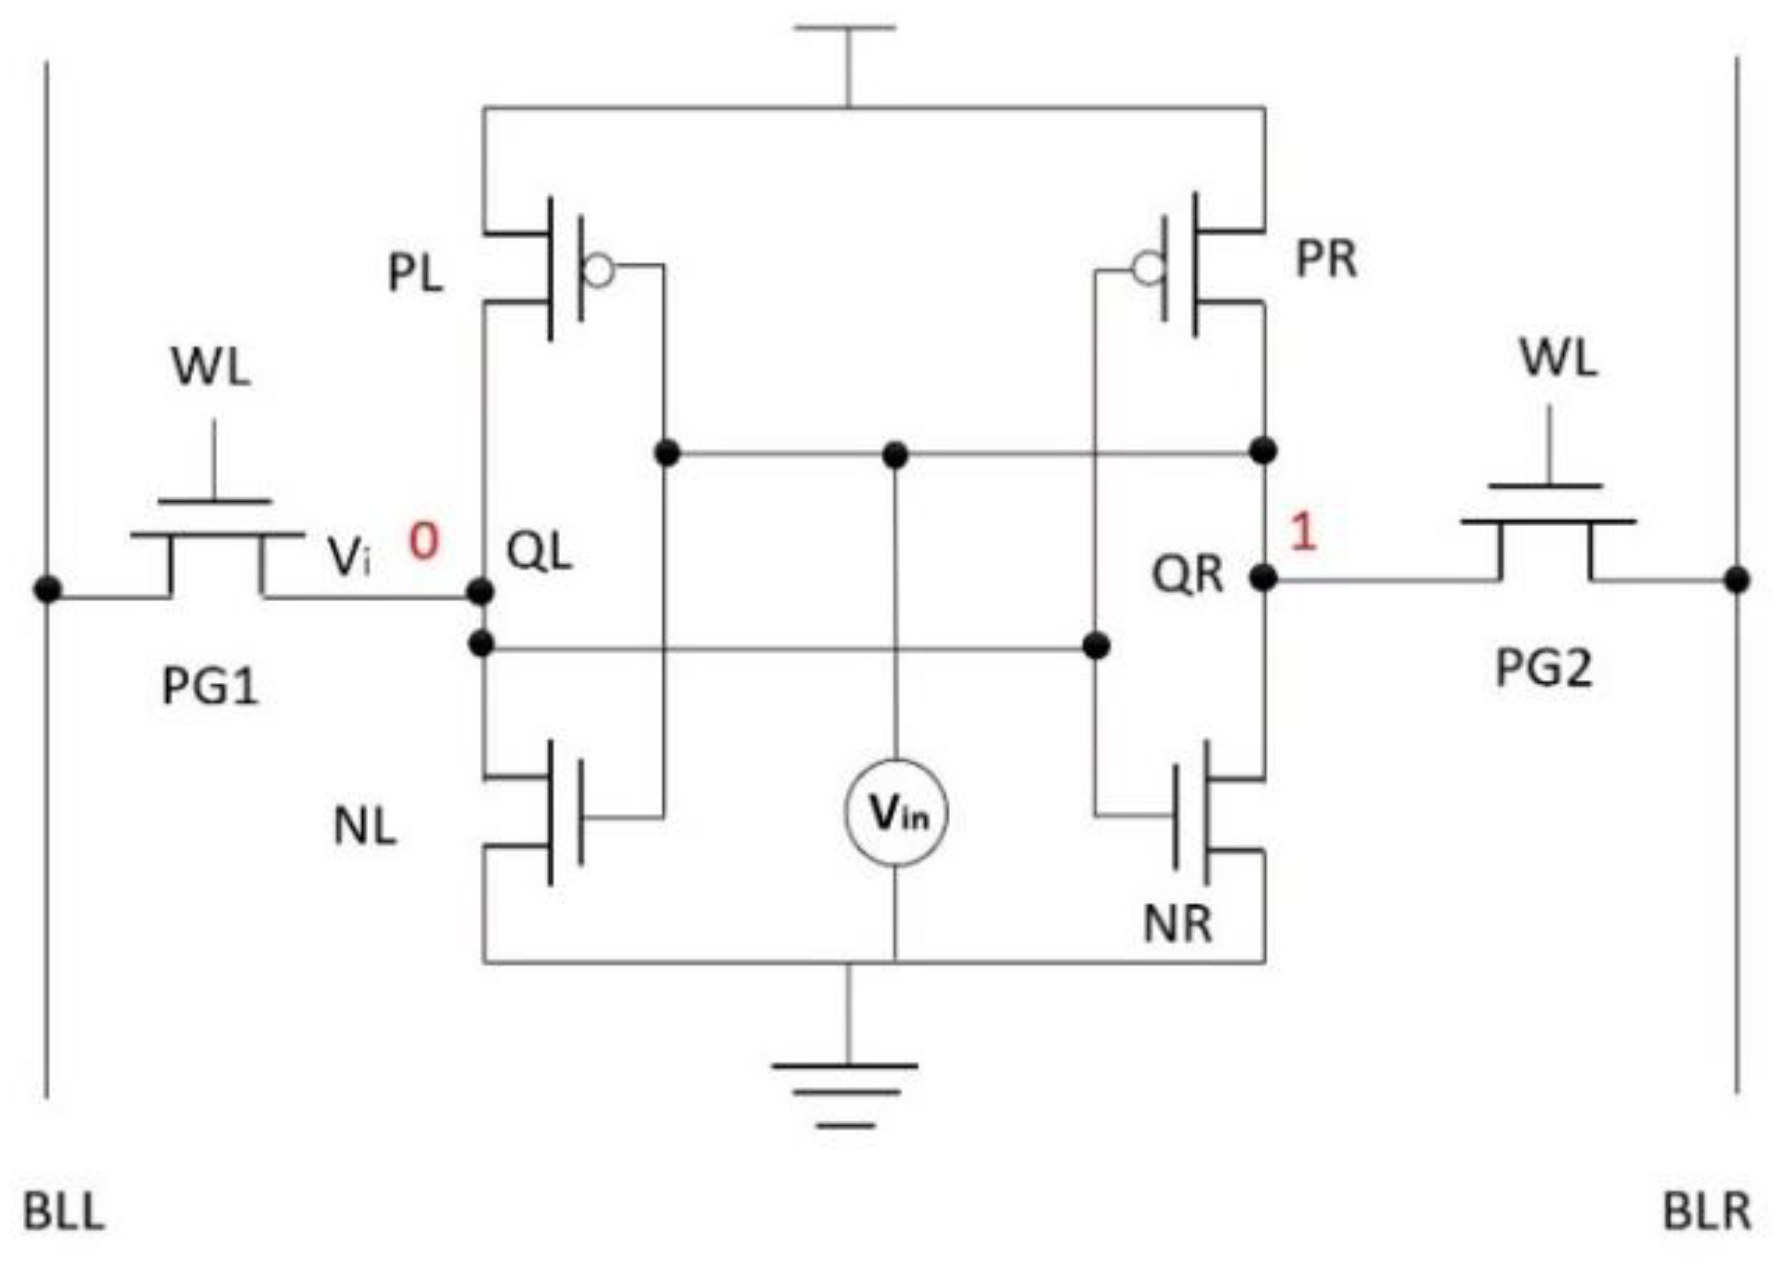
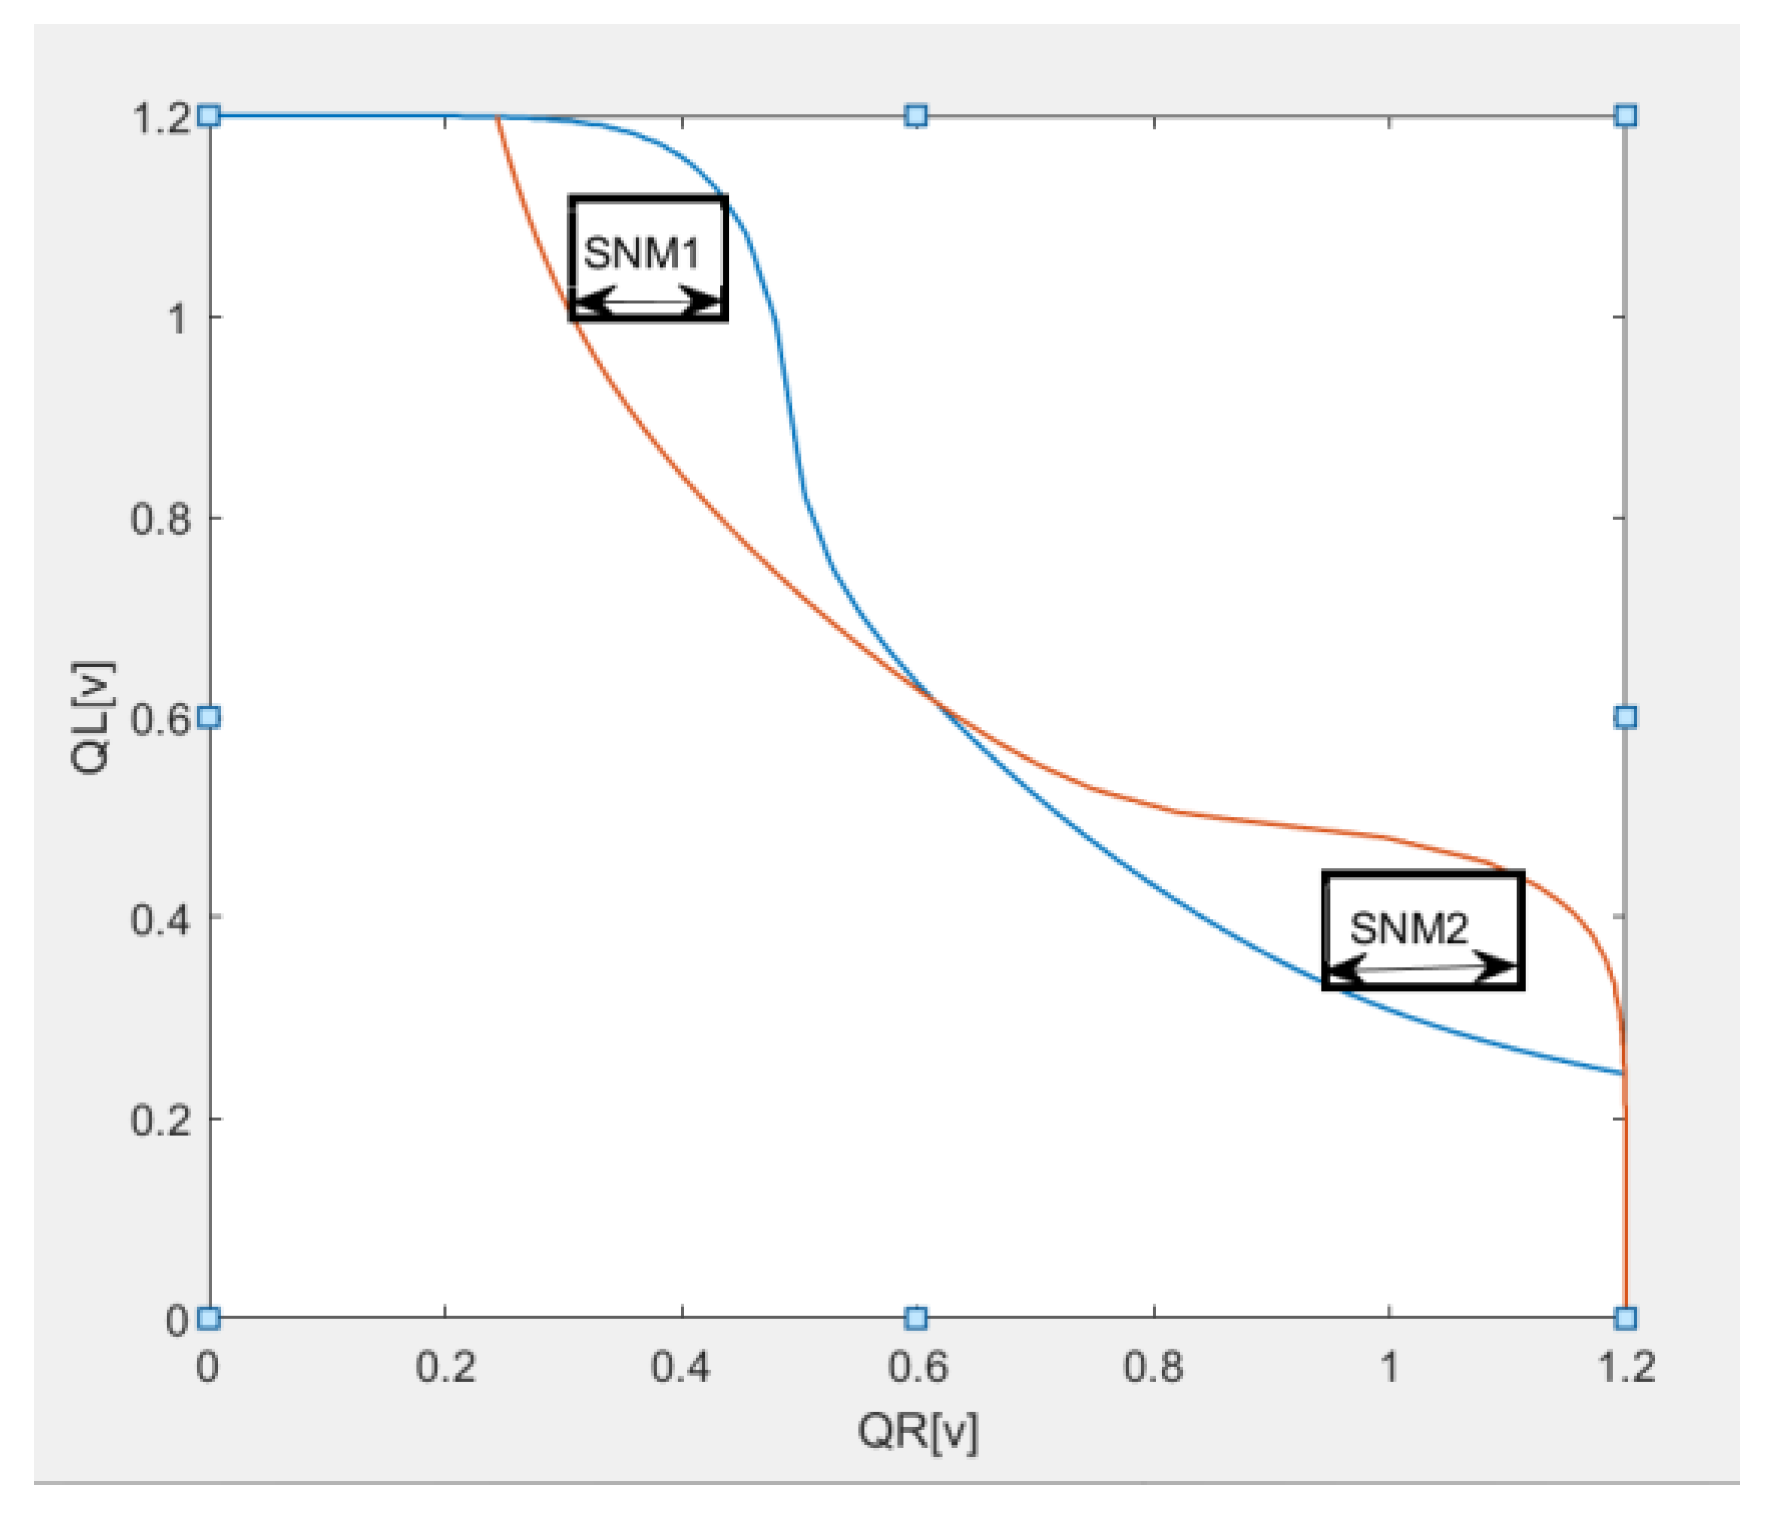
2.2. Conventional Static Stability Analysis Methods

Read, hold and write noise tolerances are the three core indicators of static noise tolerance of conventional SRAM. Considering that the read and hold static noise tolerances are measured in an approximate manner [10], while the read and write stability of the SRAM is more demanding, the comparison of reading and write noise tolerances is mainly considered in this paper.
The static noise tolerance measurement for a conventional 6T SRAM is shown in Figure 2.
During the read operation cycle [11], a scan voltage from 0 to 1.2 V is added at node QR, and the voltage variation at node QL is measured, and a scan voltage from 0 to 1.2 V is added at node QL, and the voltage variation at QR is measured. In the same coordinate system, two voltage transmission characteristic curves are plotted, as shown in in Figure 3.
According to the results of J.R. Hauser’s analysis [12], noise tolerance is the minimum value of the maximum rectangular side length that can be included in the upper left and lower right areas of the graph, specifying the voltage noise tolerance 1 (SNM1) as the maximum side length of the upper left rectangle and the voltage noise tolerance 2 (SNM2) as the maximum side length of the lower right rectangle. Namely:
S N M = m i n [ S N M 1 , S N M 2 ]
For the write operation cycle [13], the voltage transfer characteristic curve, VTC, is plotted by first adding a scan voltage from 0 to 1.2 V at node QL and then by measuring the voltage change at point QR. Similarly, the voltage transfer characteristic curve VTC2 is plotted by first adding a sweep voltage from 0 to 1.2 V at node QR and measuring the voltage change at point QL. The curve VTC2 is made symmetrical at about y = x to obtain the stability simulation plot for the write operation. As shown in Figure 4, the write noise tolerance WSNM can be quantified by embedding the minimum square edge length in the plot.

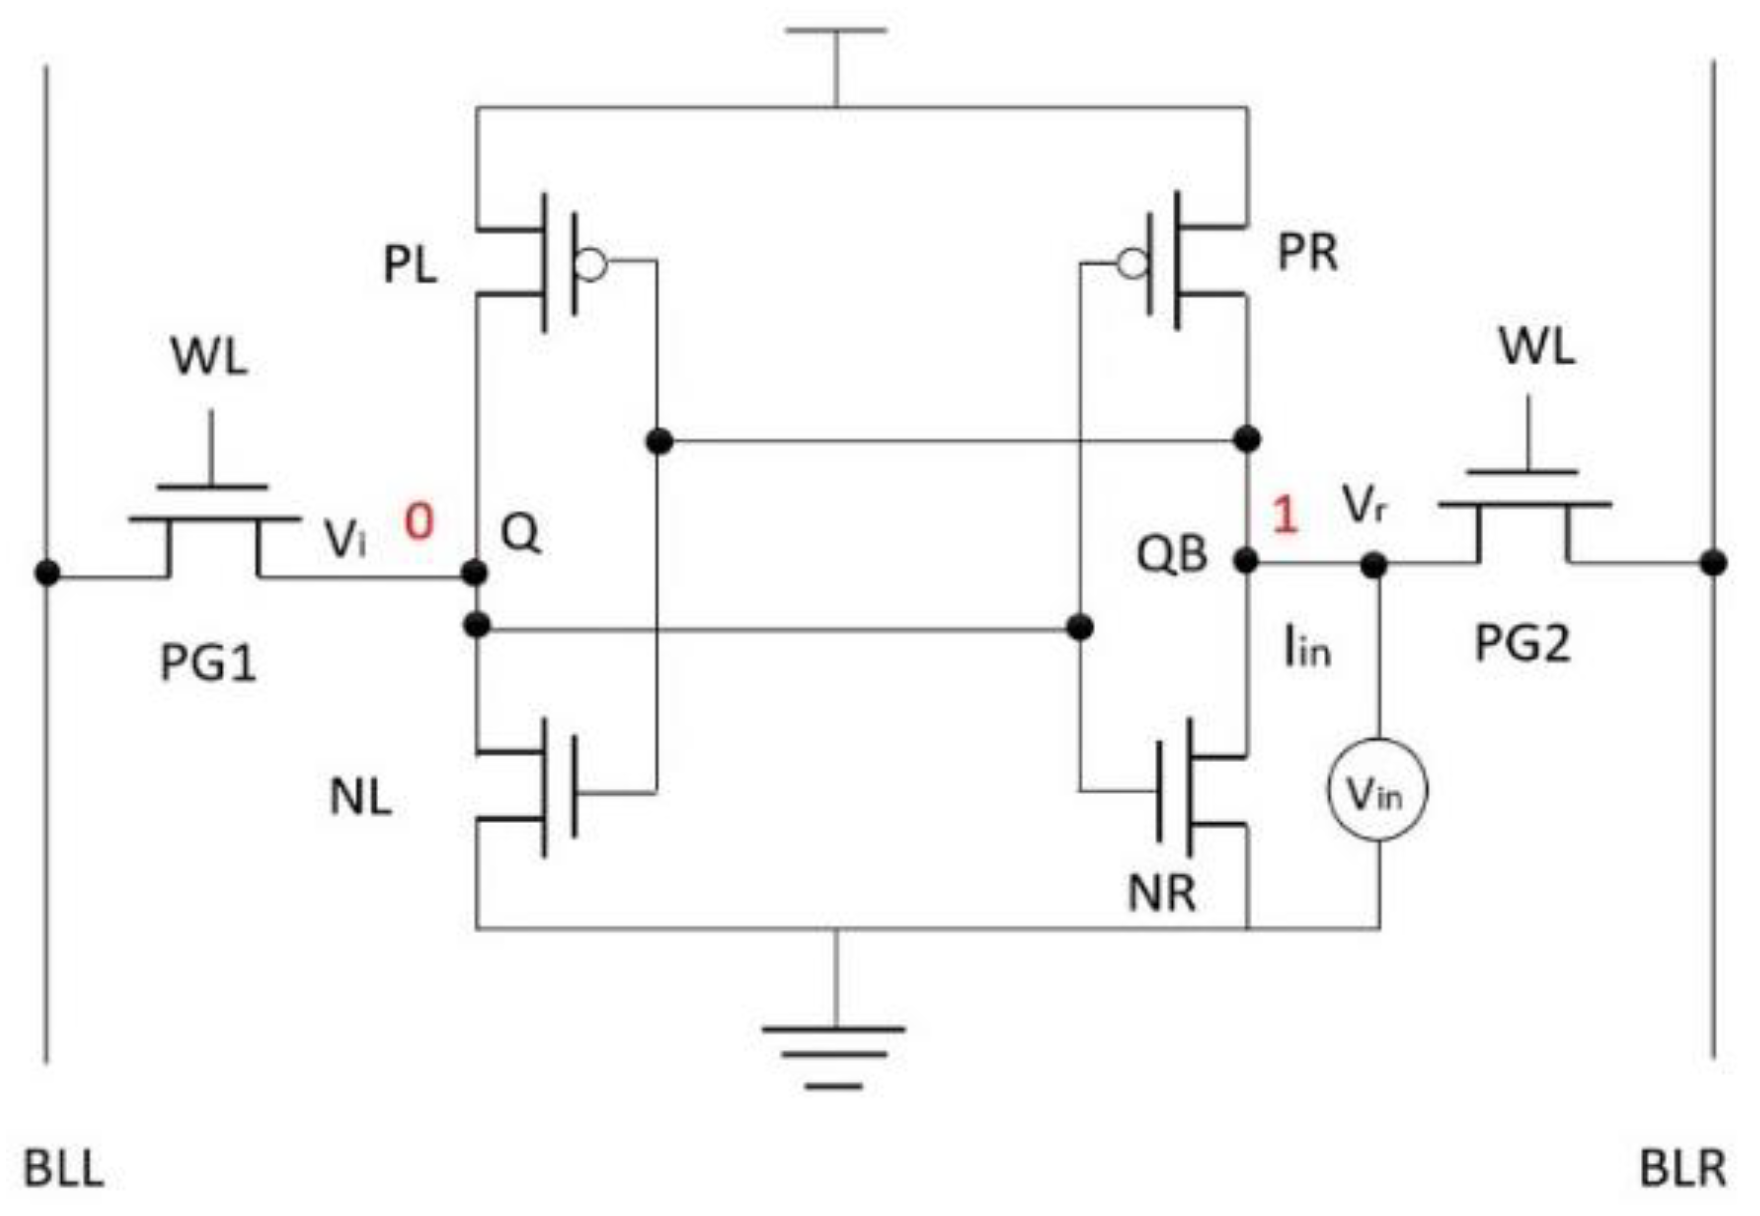
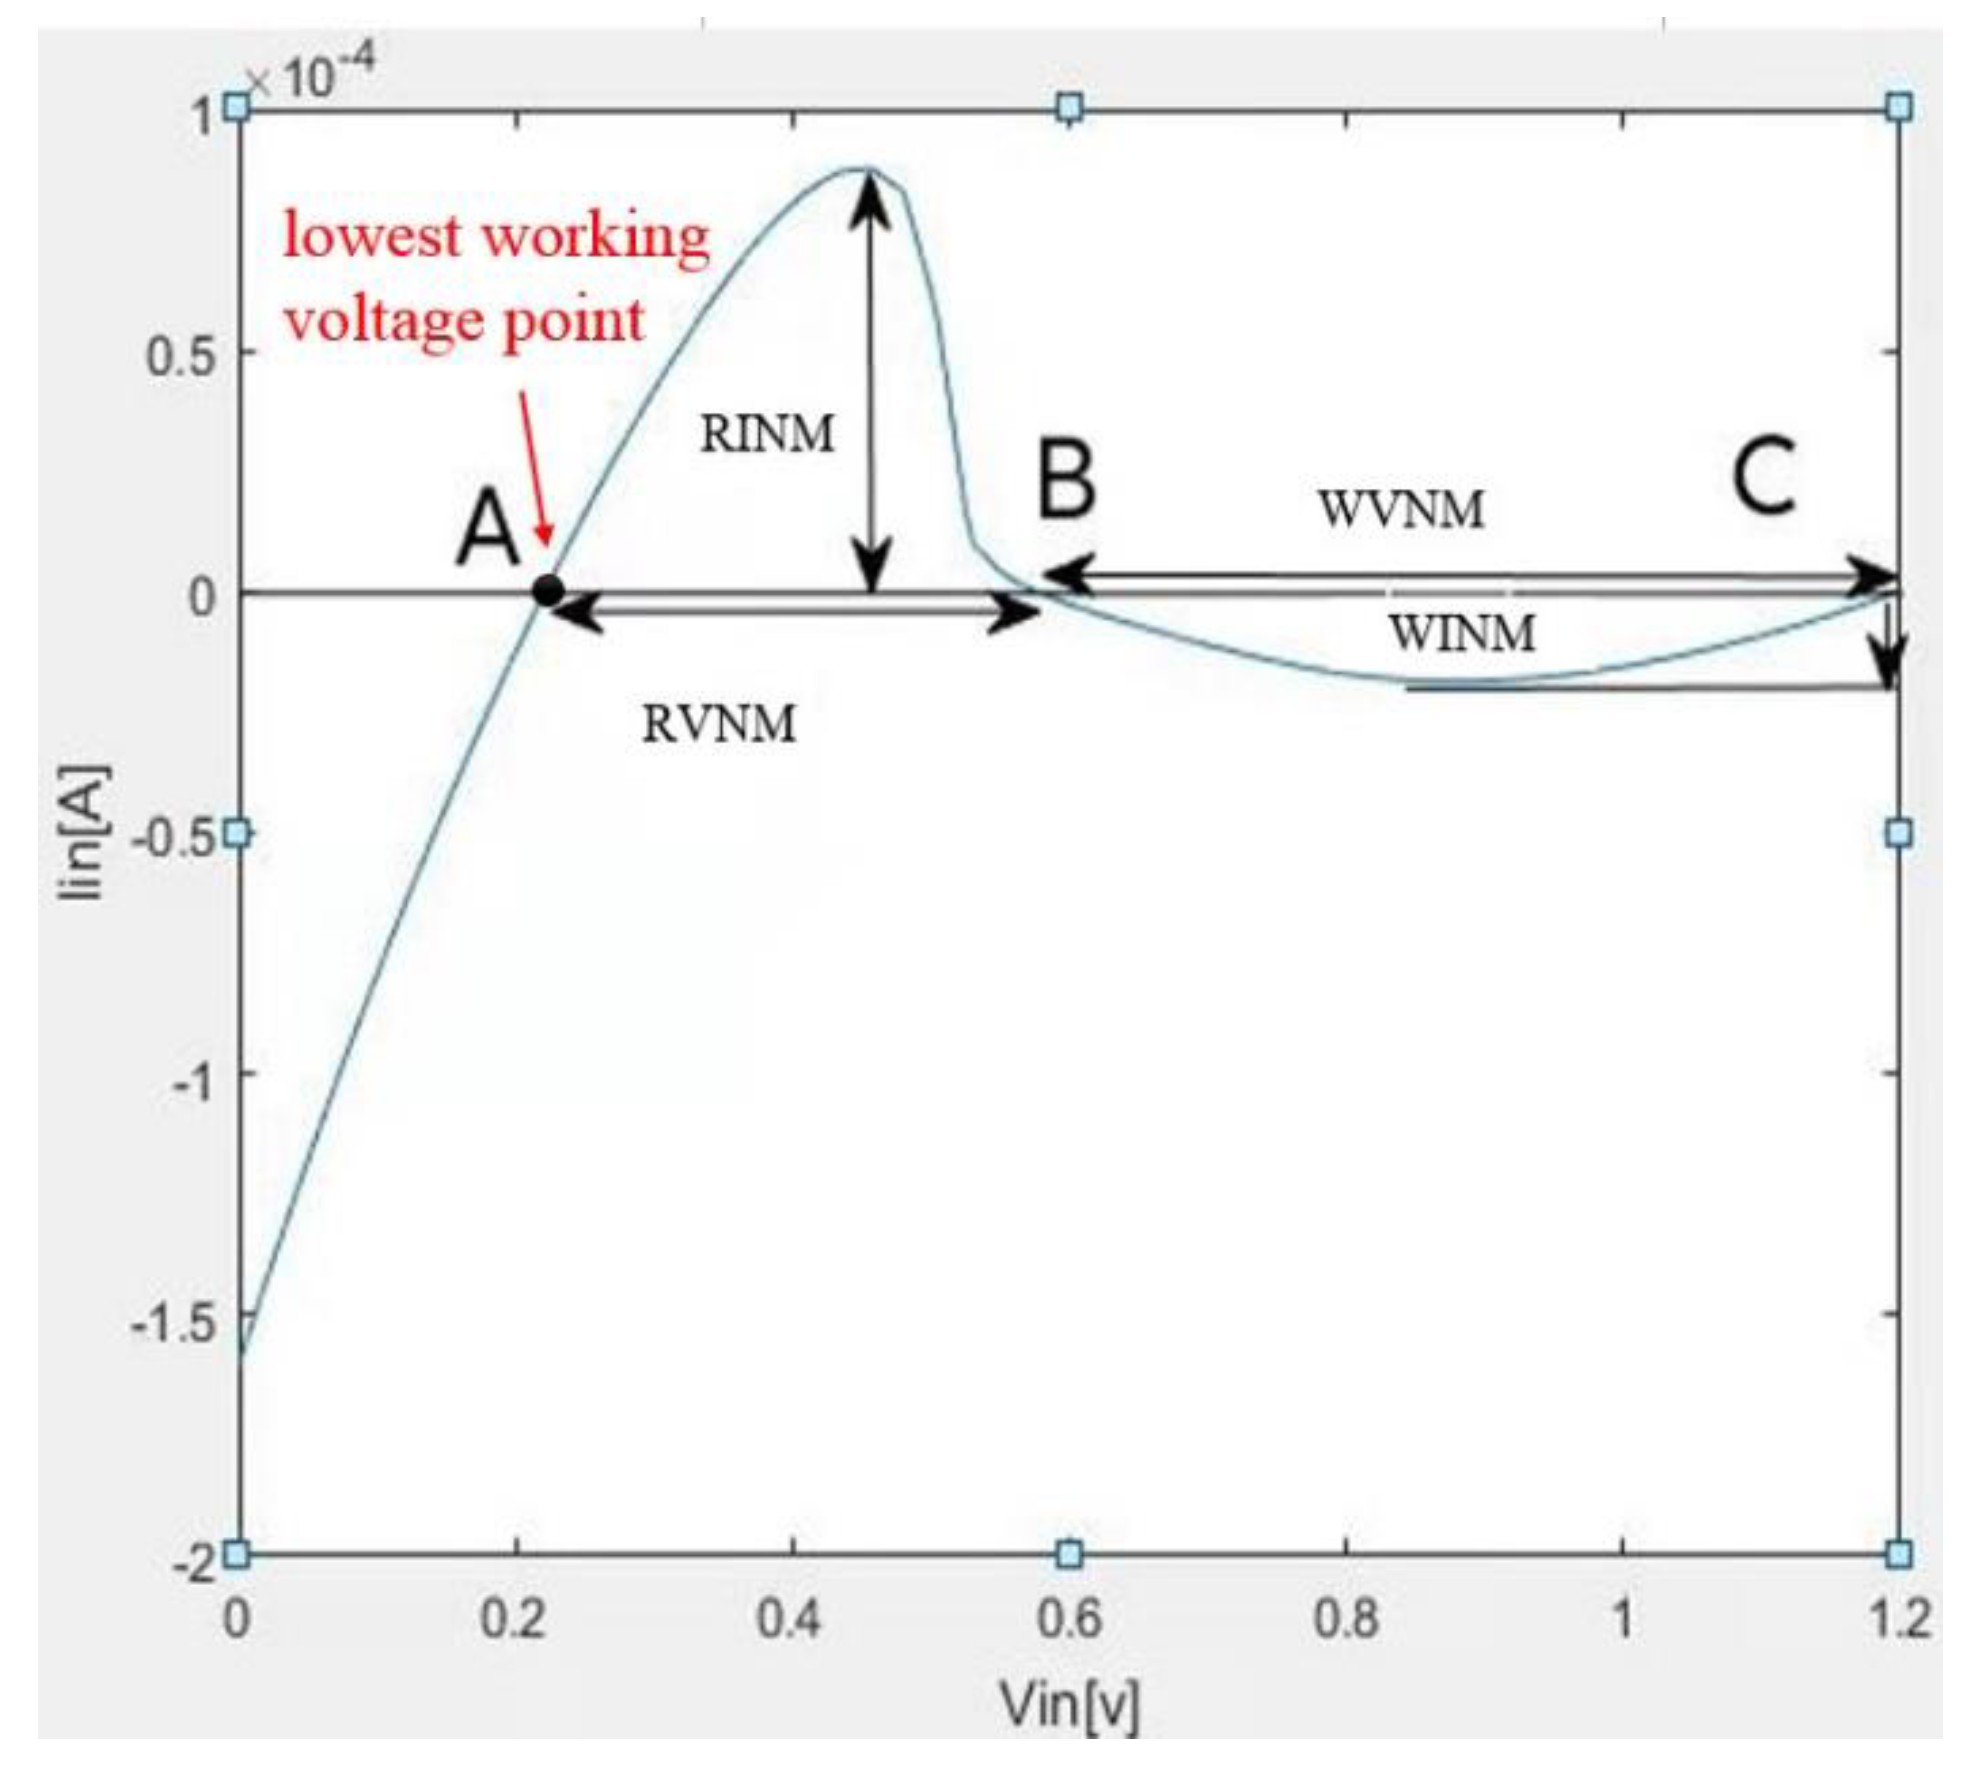
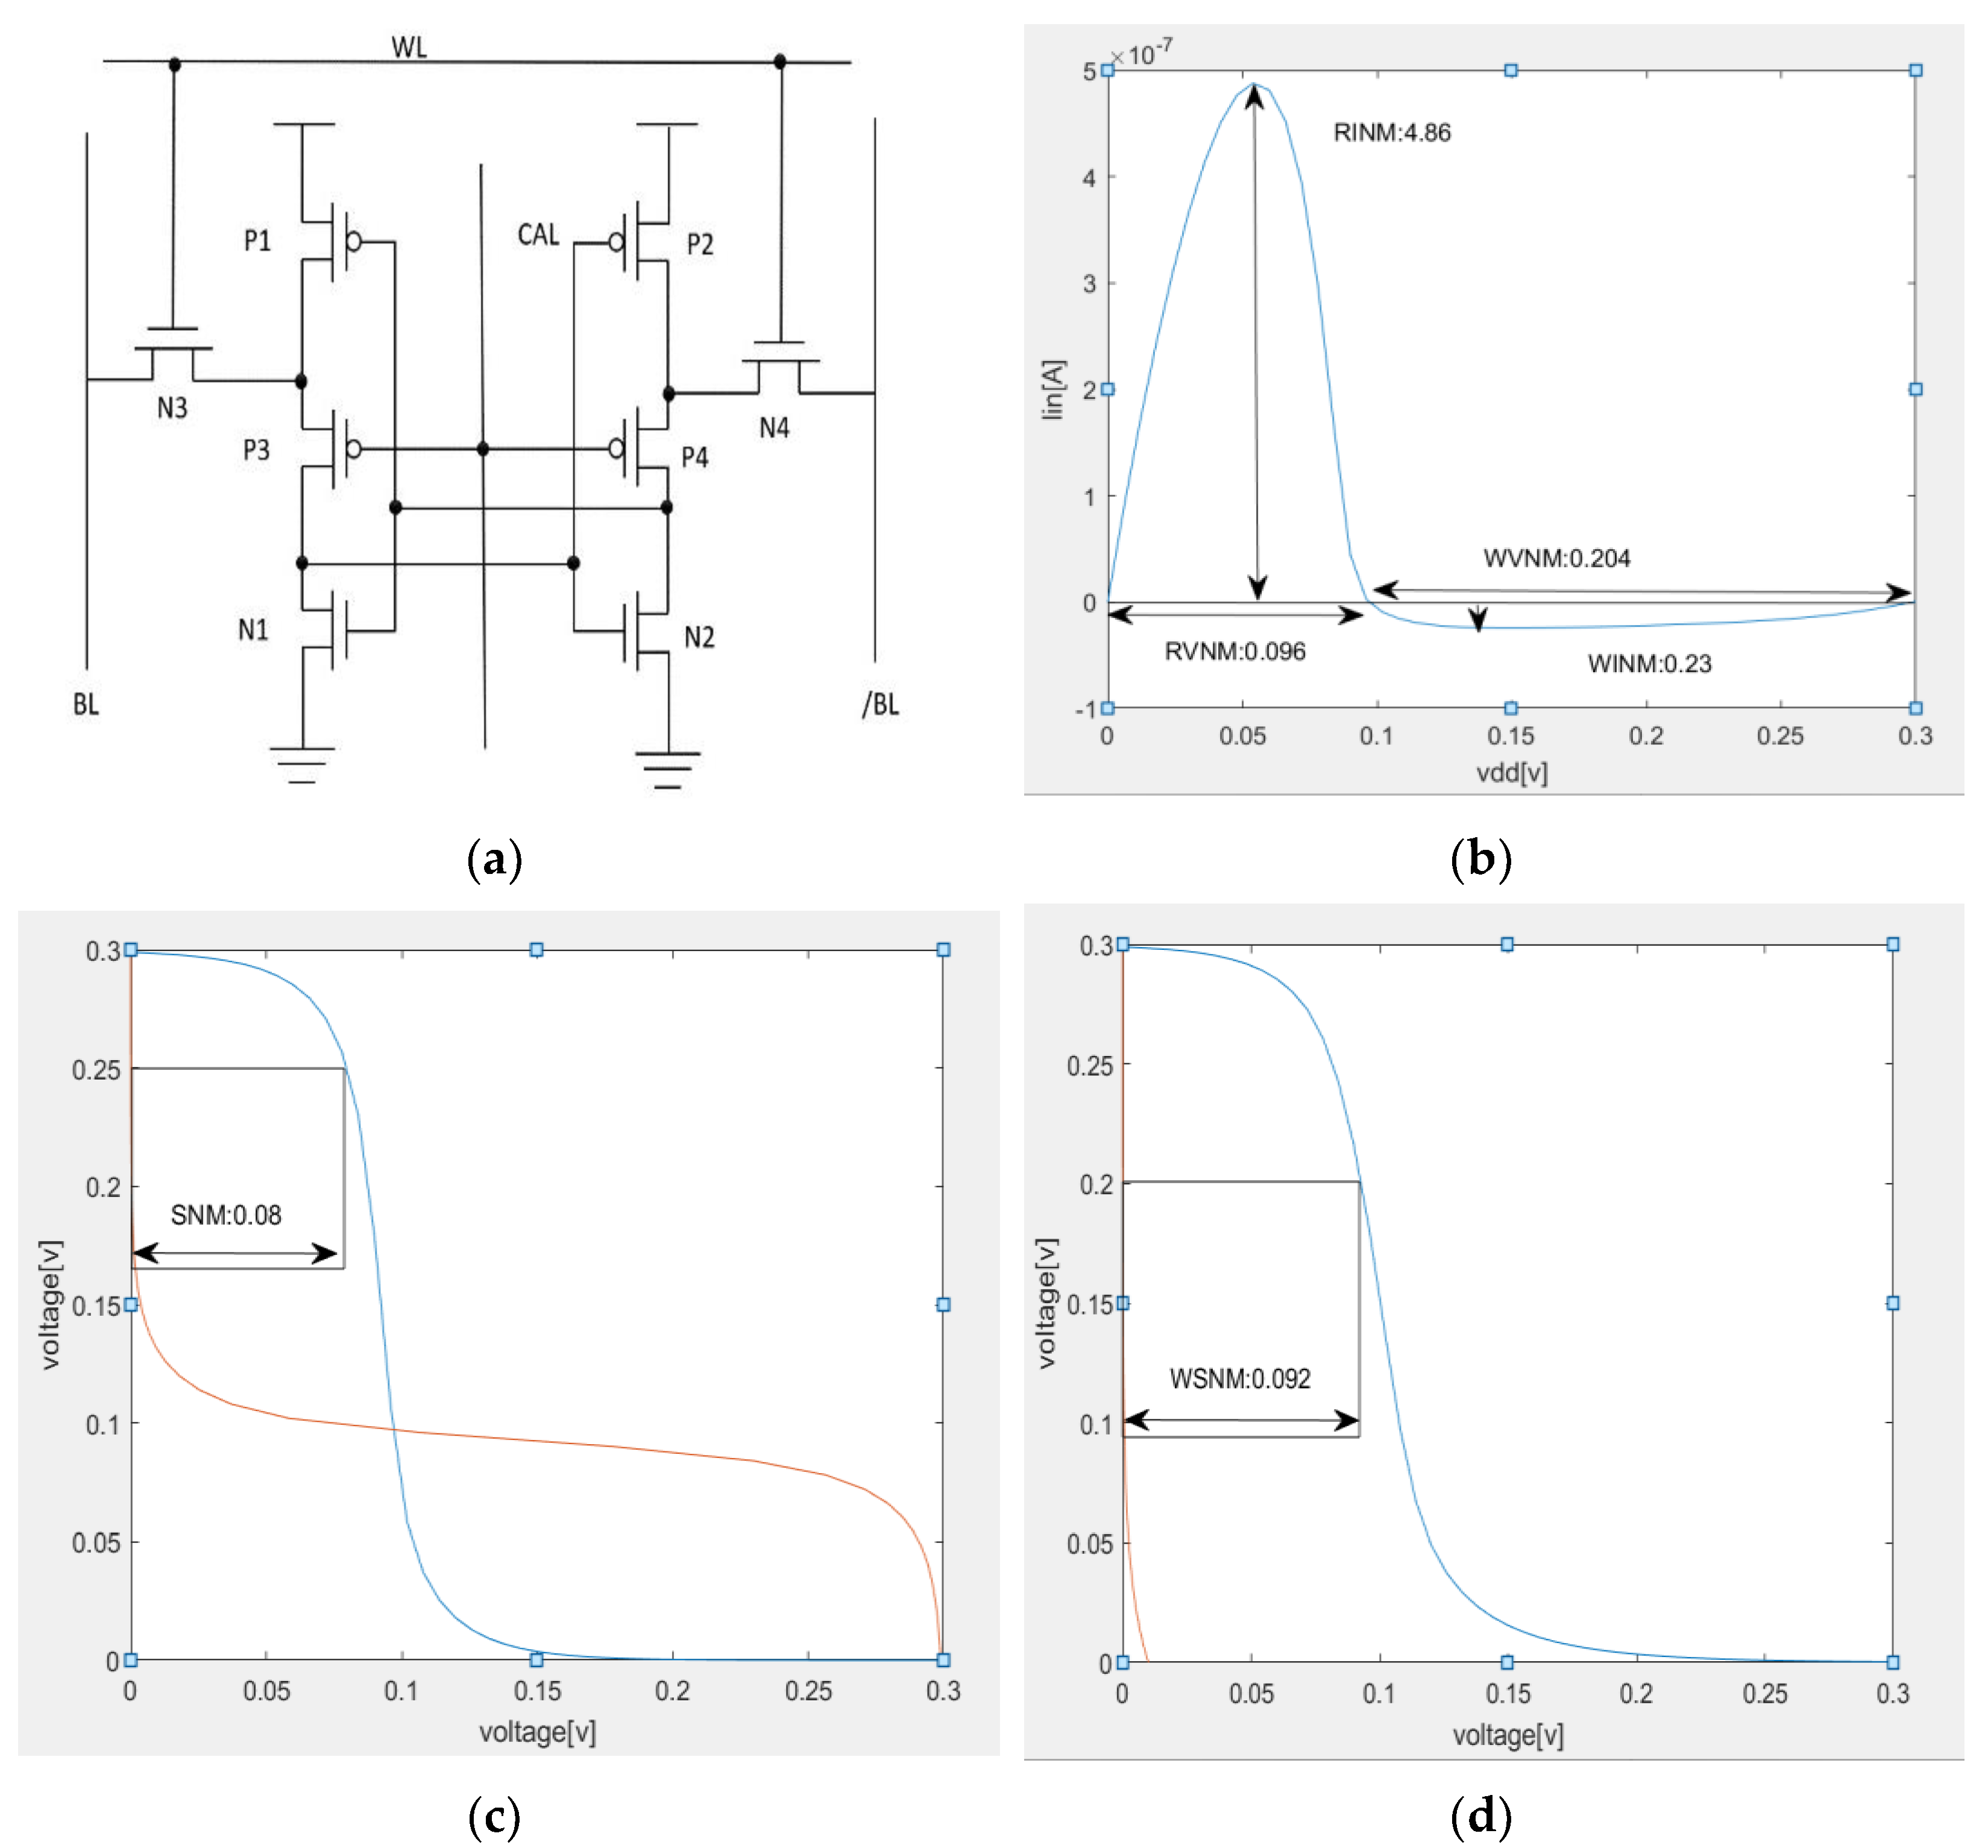
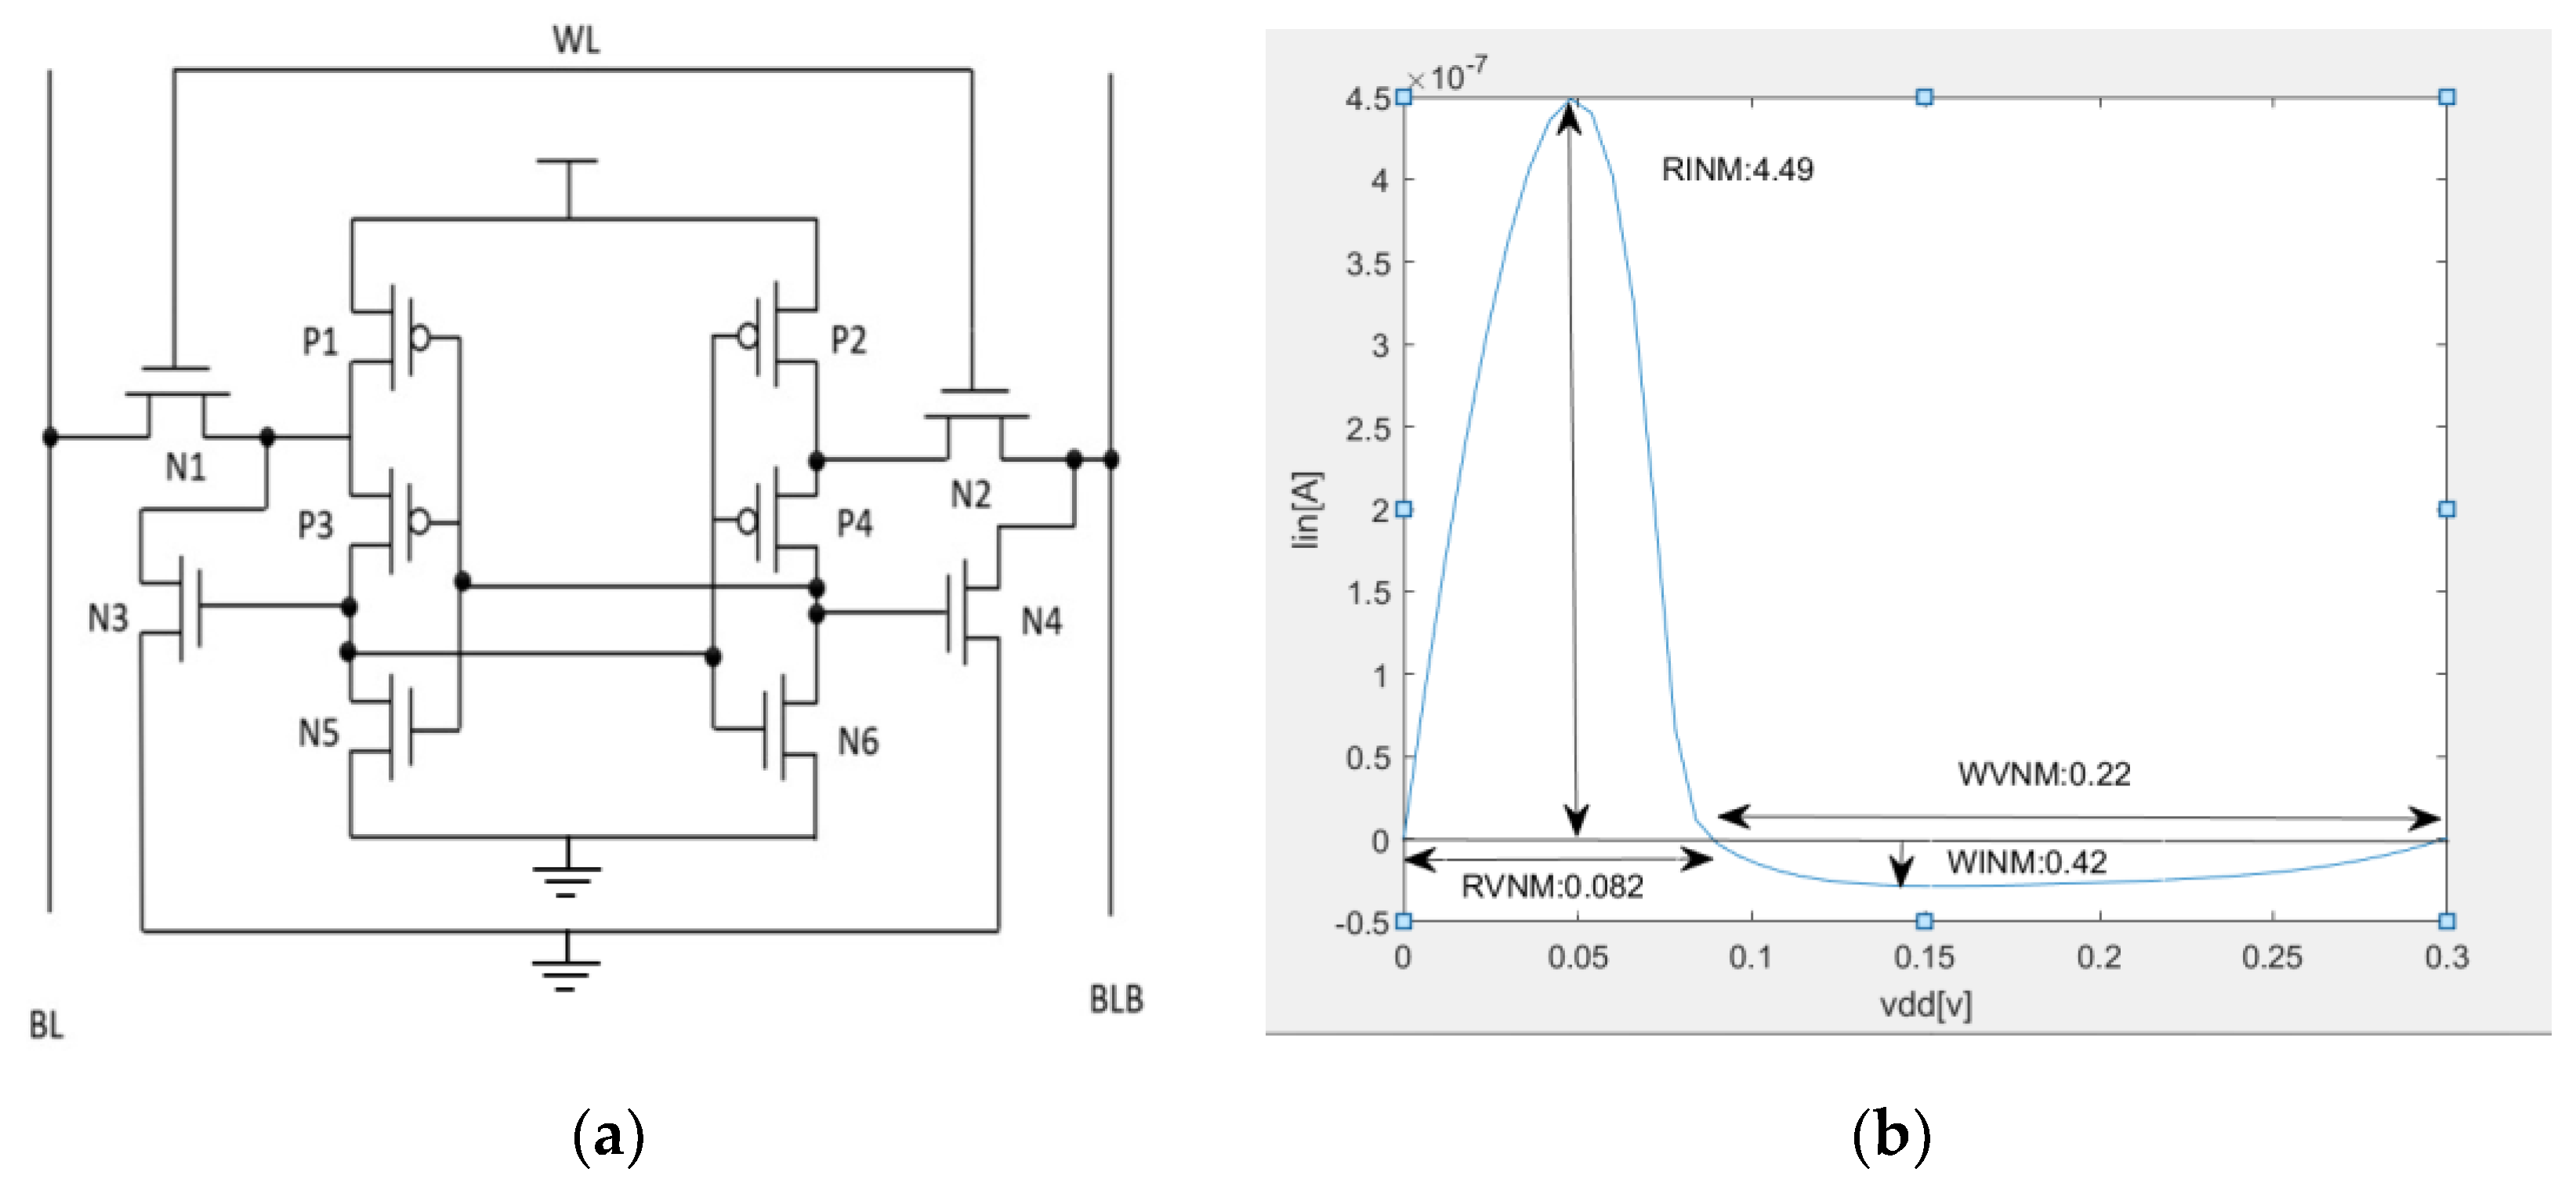
2.3. Leakage-Current-Based Stability Analysis Methods

The stability measurement based on leakage current is shown in Figure 5.
The analytical expression for the transistor leakage current at the subthreshold region is [14]:
I = S exp ( V G S + η V D S m V T ) ( 1 exp ( V D S V T ) )
S = β I O exp ( V T O m V T )
VT is the thermal voltage given by kT/q, β is the W/L ratio of the transistor, VTO denotes the threshold voltage at the source voltage VSB = 0, IO is the process-specific current at VGS = VTO for a transistor with W/L = 1, T is the temperature, η is the potential drop coefficient, and m is the number of systems given by (1 + Csi/Cox) [15].
According to the analytical expression for the transistor leakage current, Vi and Vr are the voltages at Q and QB points, respectively, VT is the thermal voltage given by kT/q, and η is the potential drop coefficient for different transistors. The model for this current is:
I G 2 = S G 2 exp ( ( V d d V r ) + η G 2 ( V d d V r ) m V T ) ( 1 exp ( ( V d d V r ) V T ) )
I P R = S P R exp ( ( V d d V i ) + η P R ( V d d V r ) m V T ) ( 1 exp ( ( V d d V r ) V T ) )
I N R = S N R exp ( V i + η N 2 * V r m V T ) ( 1 exp ( V r V T )
I i n + I G 2 + I P R = I N R
Under reading and write operations, Vin = Vr, respectively, set the derivative of Iin to Vin to zero and obtain the point at which the slope of the stability analysis curve based on the leakage current is zero, which is the highest point of the curve and also the SRAM storage maximum DC noise current and write jump current before the content is reversed.
I i n V i n = 0
During the read operation, it is assumed that the internal memory nodes QB and Q are located at “1” and “0”, respectively. At the beginning of the read access, both bit lines (BLL and BLR) are pre-charged to the supply voltage (Vdd), and the word line is activated. A DC scan voltage from 0 to Vdd is added to the memory node Q. The image plotted with the scan voltage Vin as the x-axis and the current produced by the scan voltage at the same moment, Iin, as the y-axis, is the stability analysis curve based on the leakage current, as shown in Figure 6.
From the graph, it can be concluded that point A is the lowest operating voltage value of the SRAM. When the operating voltage of the SRAM is lower than the voltage value of point A, the SRAM cannot work normally. The voltage difference between the two points, A and B, is the maximum DC noise voltage before the storage content of the SRAM is reversed, which is called the voltage noise margin (RVNM); the read current noise margin (RINM) is the maximum DC before the storage content of the SRAM is reversed, and the noise current is expressed as the peak current between the two points, A and B. The write voltage noise margin (WVNM) is the minimum voltage required to complete the write operation, expressed as the voltage difference between points A and C. The write current noise margin (WINM) is the minimum current required to complete the write operation, expressed as the peak current between points B and C.
According to the equation, it can be concluded that the voltage at point A depends on the pull-down ratio of the SRAM, and the voltage at point B is related to the size ratio of the pull-down transistor to the pull-up transistor and the transfer transistor. The voltage at point C depends on the pull-up ratio of the SRAM, and the current provided by the scan voltage at all three points is zero.
Unlike the conventional static stability, the leakage-current-based stability analysis fully considers the effect of current on circuit stability at subthreshold values. The larger the values of RVNM and RINM, the better the read stability of SRAM; the smaller the values of WVNM and WINM, the better the write capability of SRAM. Therefore, the stability analysis based on leakage current can combine both current and voltage stability factors, which can provide sufficient support for the stability analysis of the ultra-low-power memory operating in the subthreshold region of the device.

2.4. Advantages of Leakage-Current-Based Stability

Low-power memories tend to operate in the subthreshold region when the device turn-on current is comparable to the leakage current, and the accumulated leakage current may have a fatal impact on the design. Therefore, the conventional consideration of the static stability of voltage has limitations, unlike the stability based on leakage current, which combines the effects of current and voltage. To test the effect of different supply voltages on the measured stability of the two methods, the cell ratio and pull-up ratio are kept constant at supply voltages of 1.2 V and 0.3 V. The size of the 6T SRAM transistors is varied by increasing W in equal proportions (so that the transistor aspect ratios reach 1:1, 1:1.5 and 1:2). Then, the stability of the 6T SRAM is simulated.
From the simulation in Figure 7a,b, the static stability of the SRAMs (W:L = 1:1, 1:1.5, 1:2) is measured as 0.15 V, 0.163 V and 0.172 V when the supply voltage is 1.2 V. The stability of the three SRAMs based on the leakage current is measured as 0.28 V, 0.293 V and 0.312 V. Thus, it can be seen that when the device is operating in the saturation region, both methods can adequately detect the difference in the stability of various SRAMs. At a supply voltage of 0.3 V, the stability of the three different memory sizes derived using conventional static stability analysis is consistent (SNM = 0.034 V), as shown in Figure 7c. This is not reasonable. If the leakage-current-based stability analysis is used, different stability values are obtained (RINM1:1 = 1.56 × 10⁻⁷ A, RINM1:1.5 = 1.67 × 10⁻⁷ A, RINM1:2 = 1.82 × 10⁻⁷ A), as shown in Figure 7d. Therefore, the stability analysis based on the leakage current can adequately show the stability index of the subthreshold SRAM.
Meanwhile, Figure 7b,d also characterizes the written stability of the SRAM at the same time. From Figure 7d, the write current of 6T SRAM under the subthreshold region is very small, which can easily cause write errors, so the 6T SRAM faces a great stability challenge under subthreshold levels.
In order to further compare the advantages and disadvantages of static stability analysis and stability analysis based on leakage current, this paper compares the method principle, simulation steps and subsequent simulation results, as shown in Table 1.
As can be seen from the table, the stability analysis based on leakage current is simpler than the static stability analysis steps. No additional mathematical tools are required, and the read and write information is in one set of graphs. Hence, it is more accurate and convenient to measure the stability of the SRAM.

3. Results and Discussion

It can be concluded from the principle of the above measurement method, simulation steps and simulation result that the stability analysis based on leakage current is more convenient and accurate compared to static stability analysis. In order to further prove this point, this paper demonstrates different process angles of the same design, same design, different process and different designs of the same process angle.

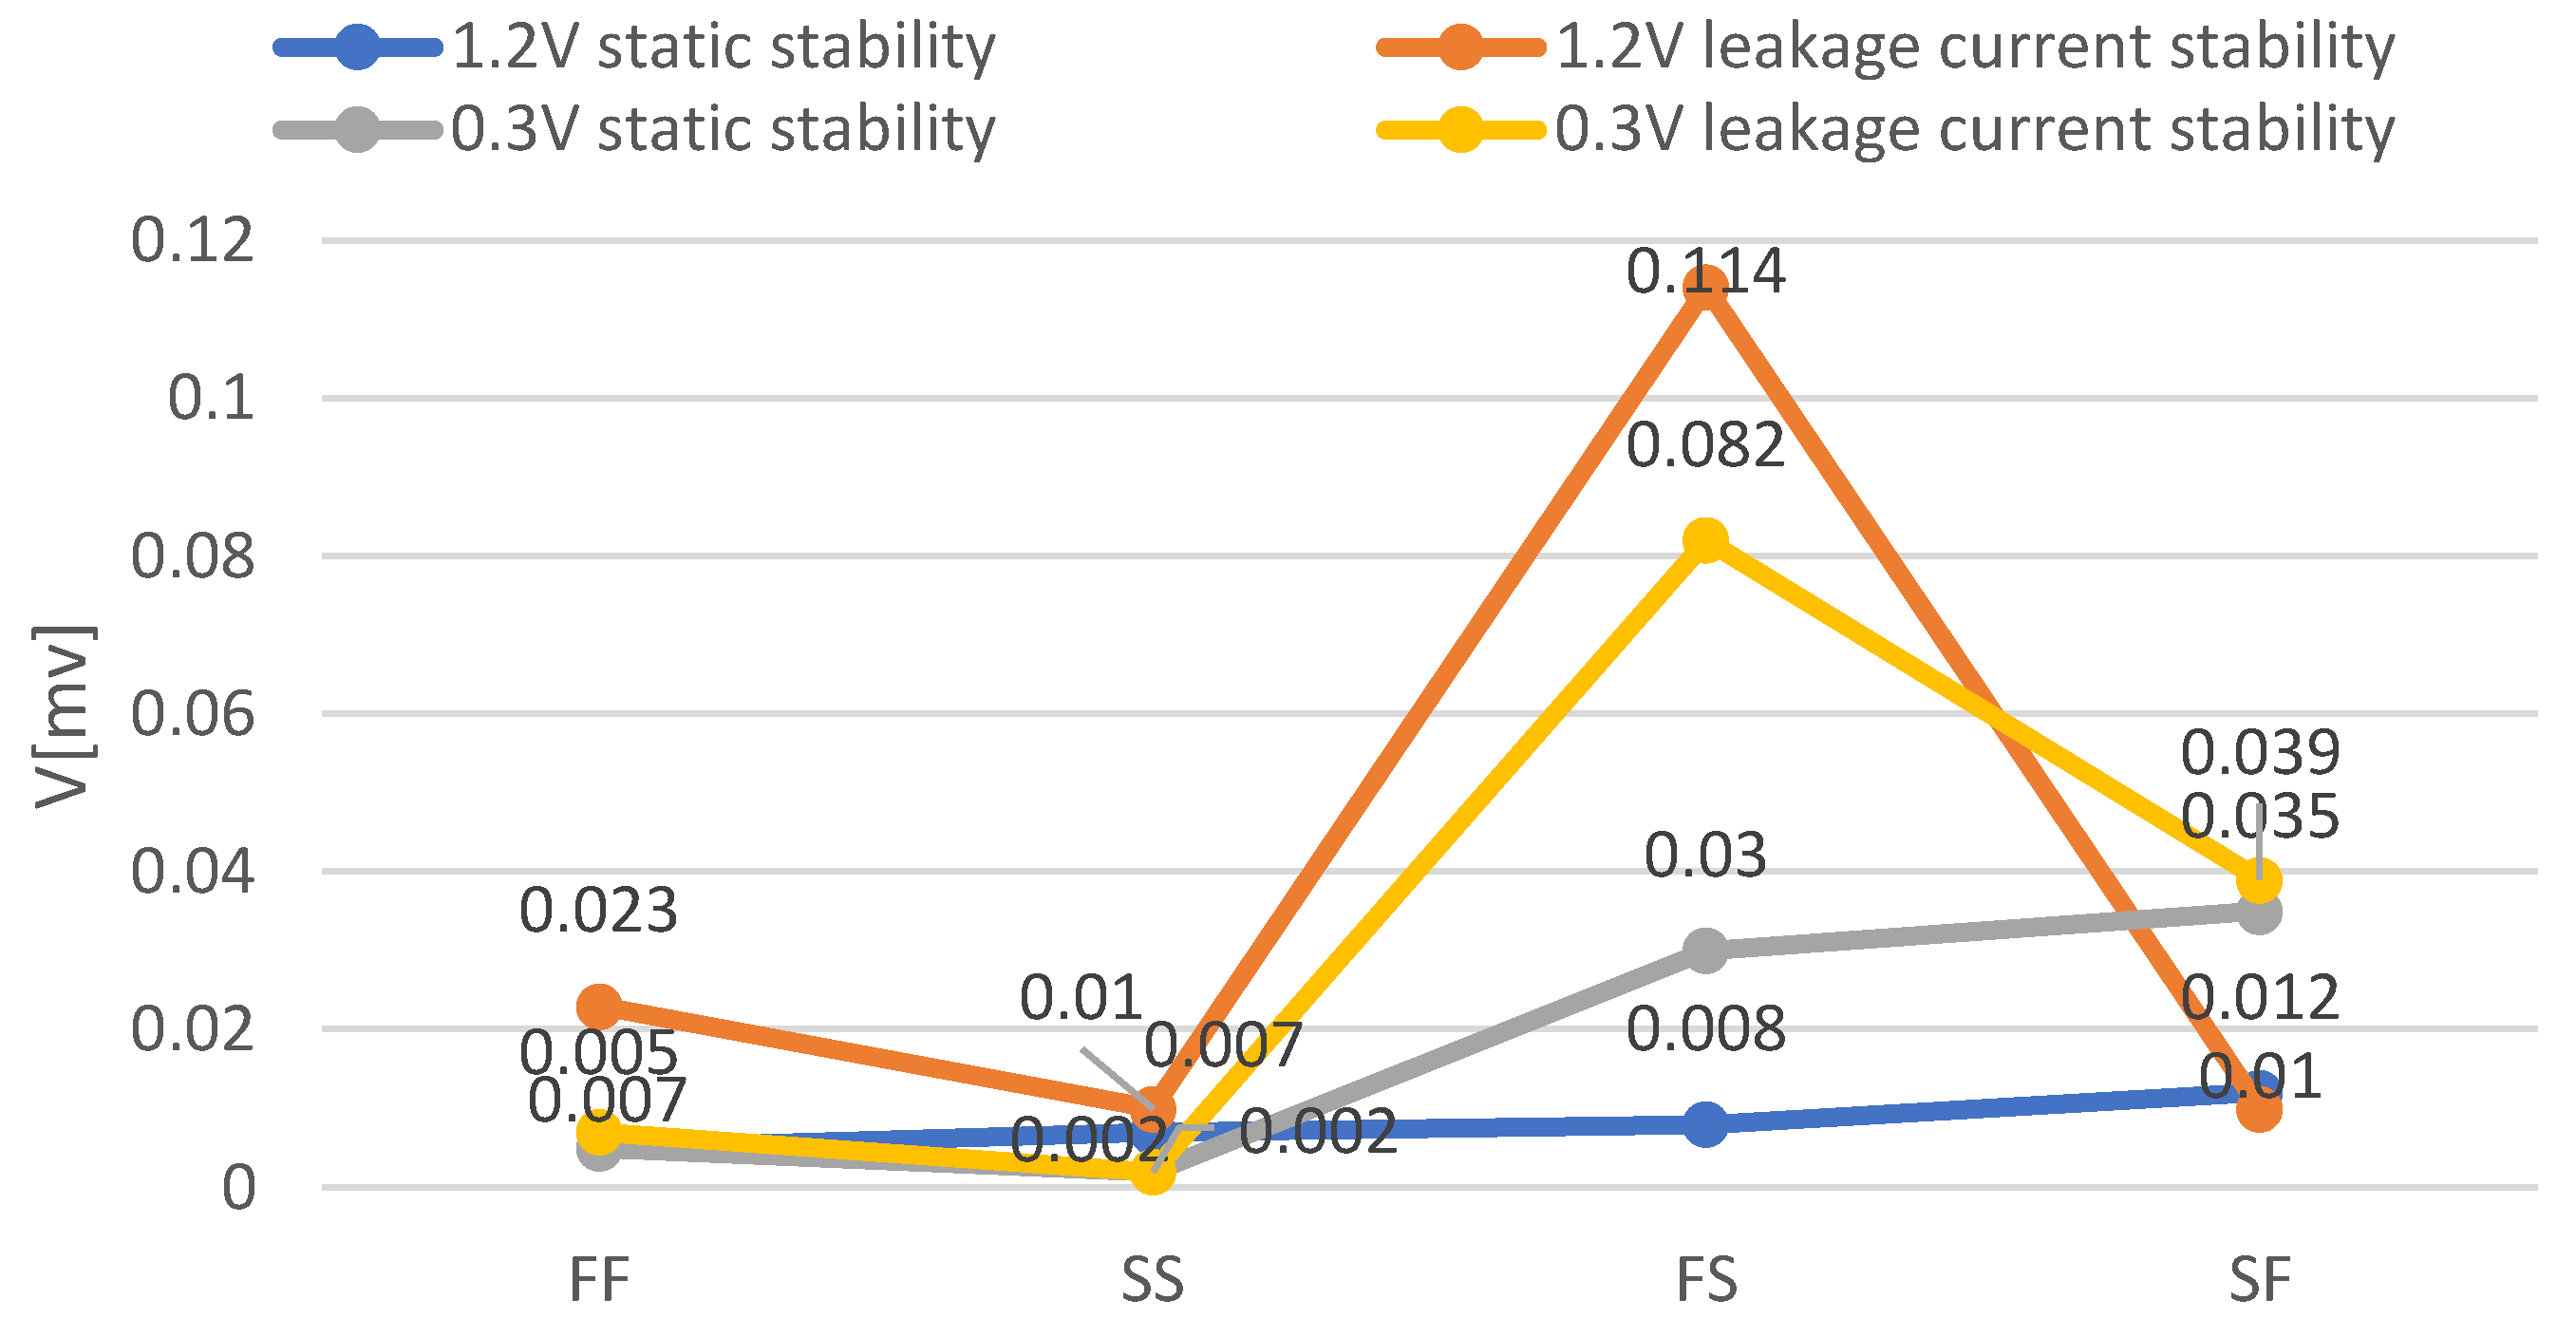
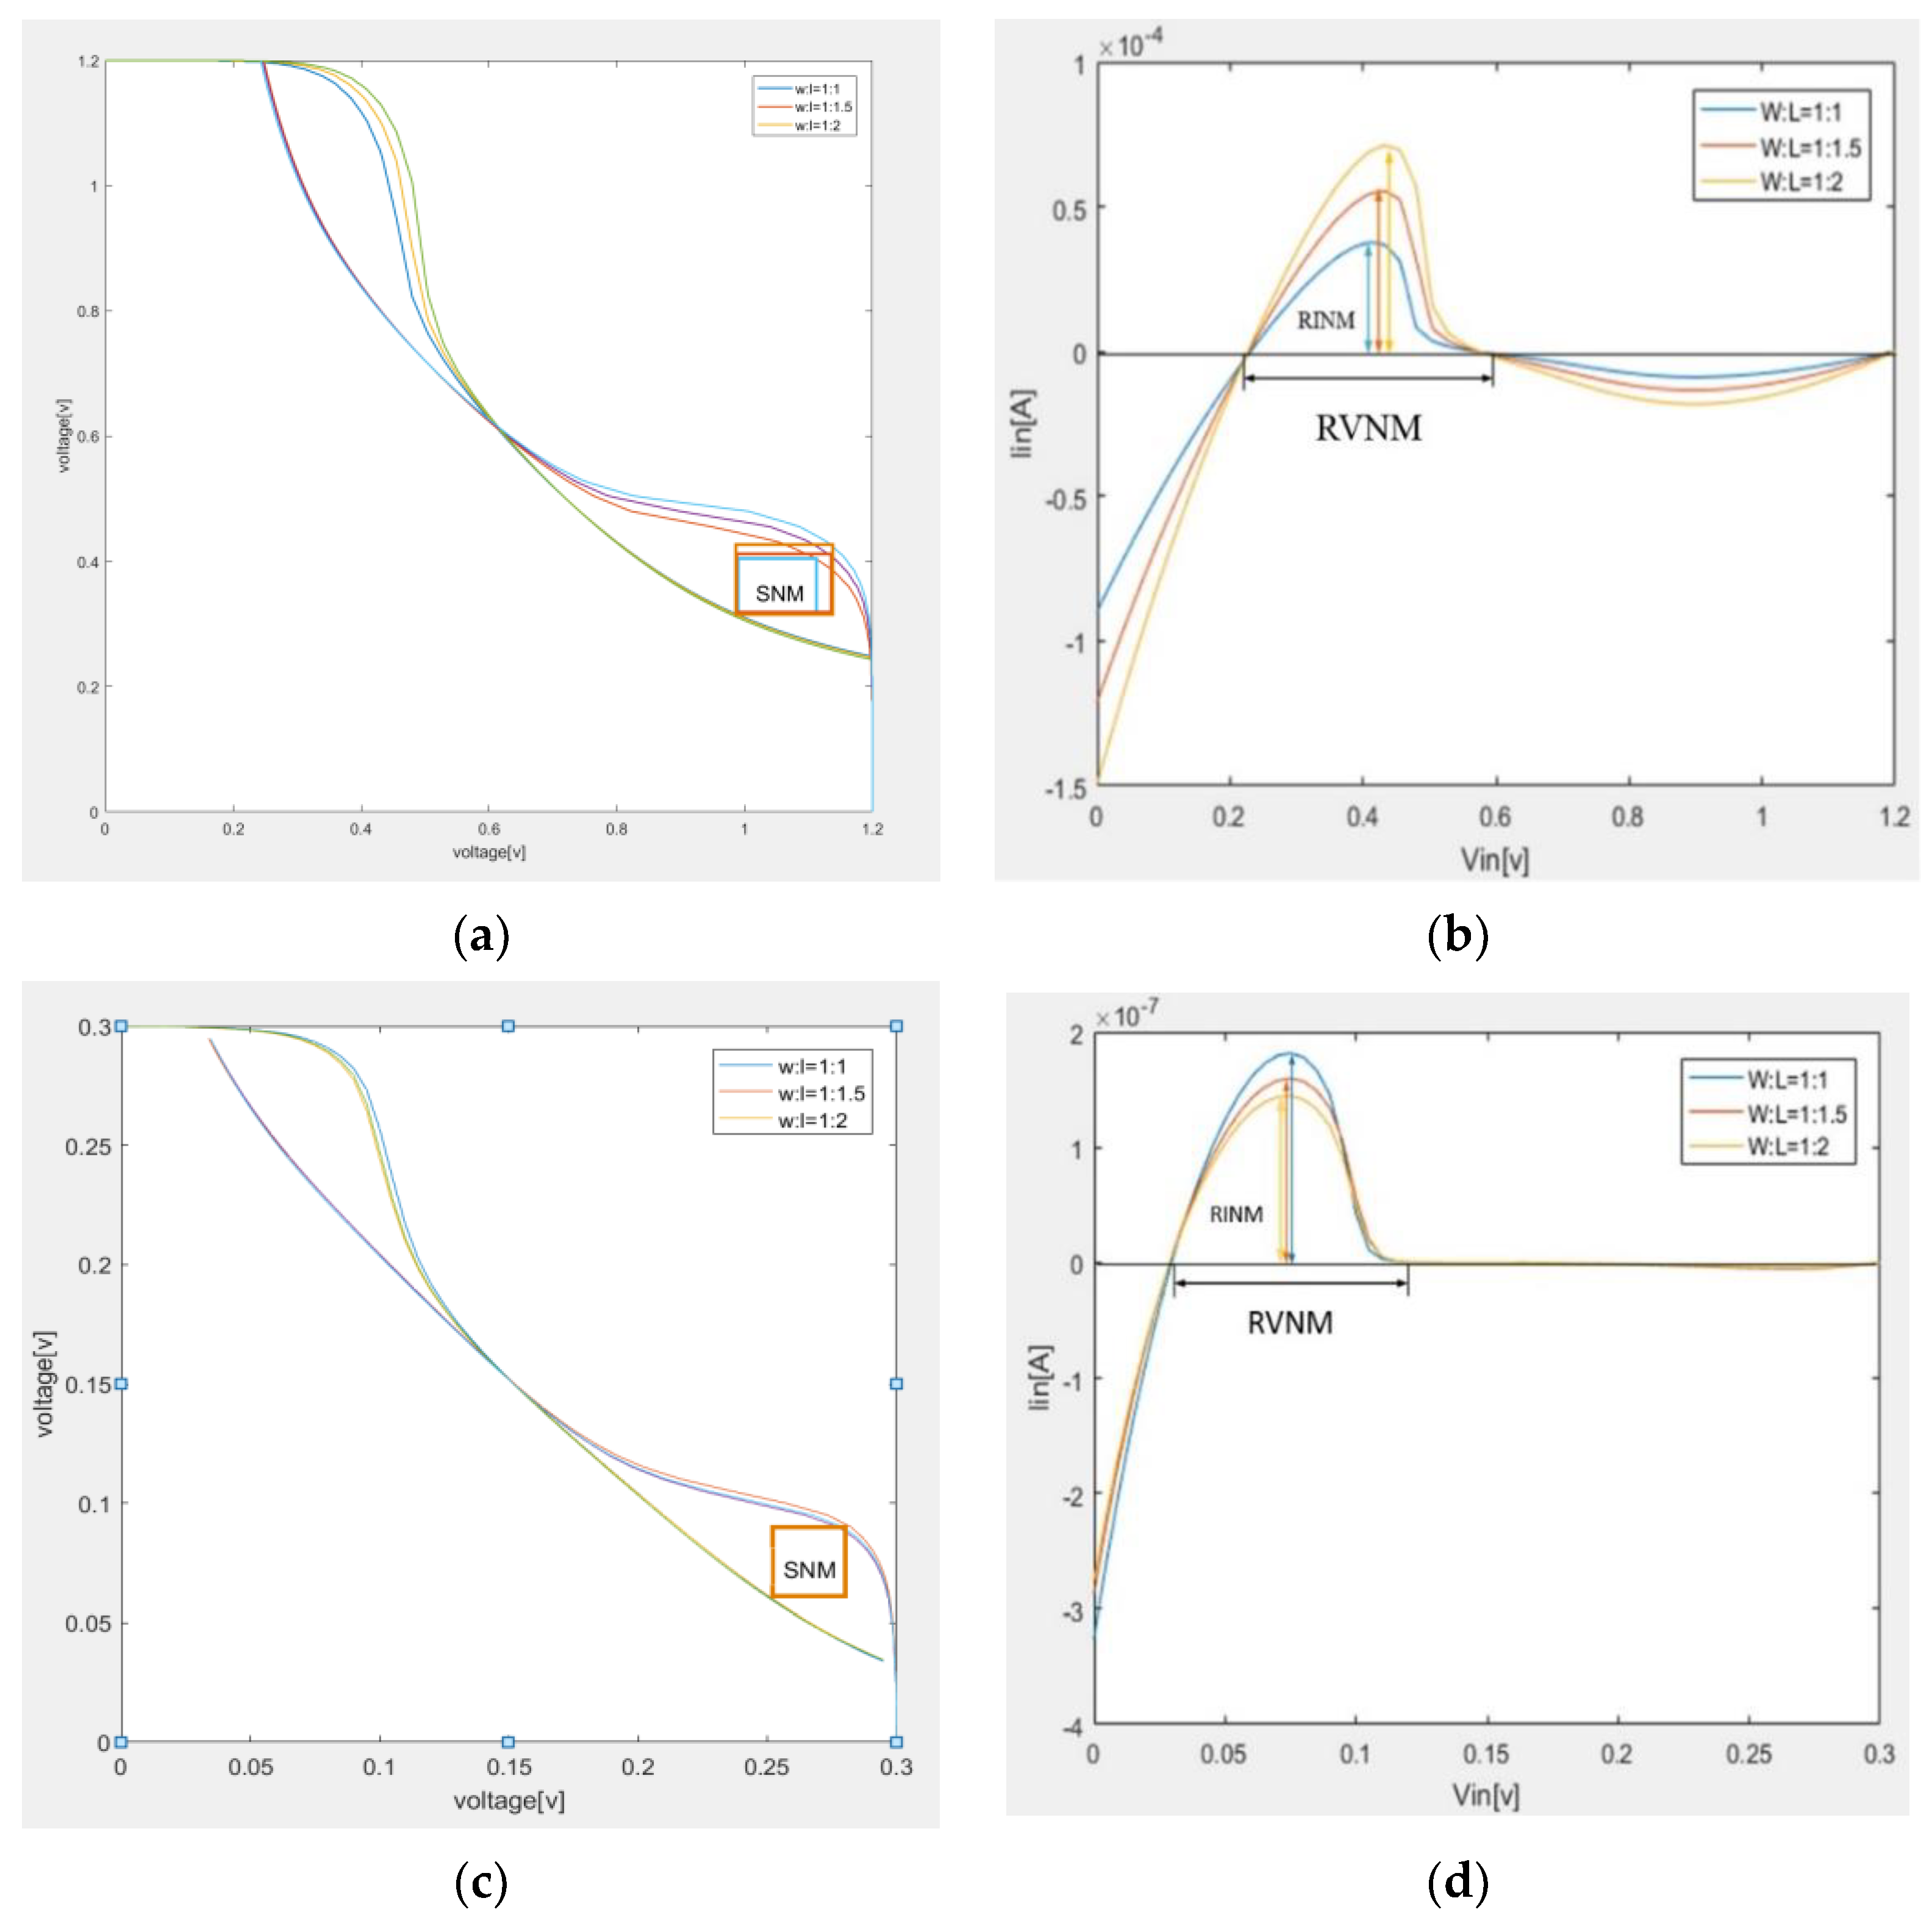
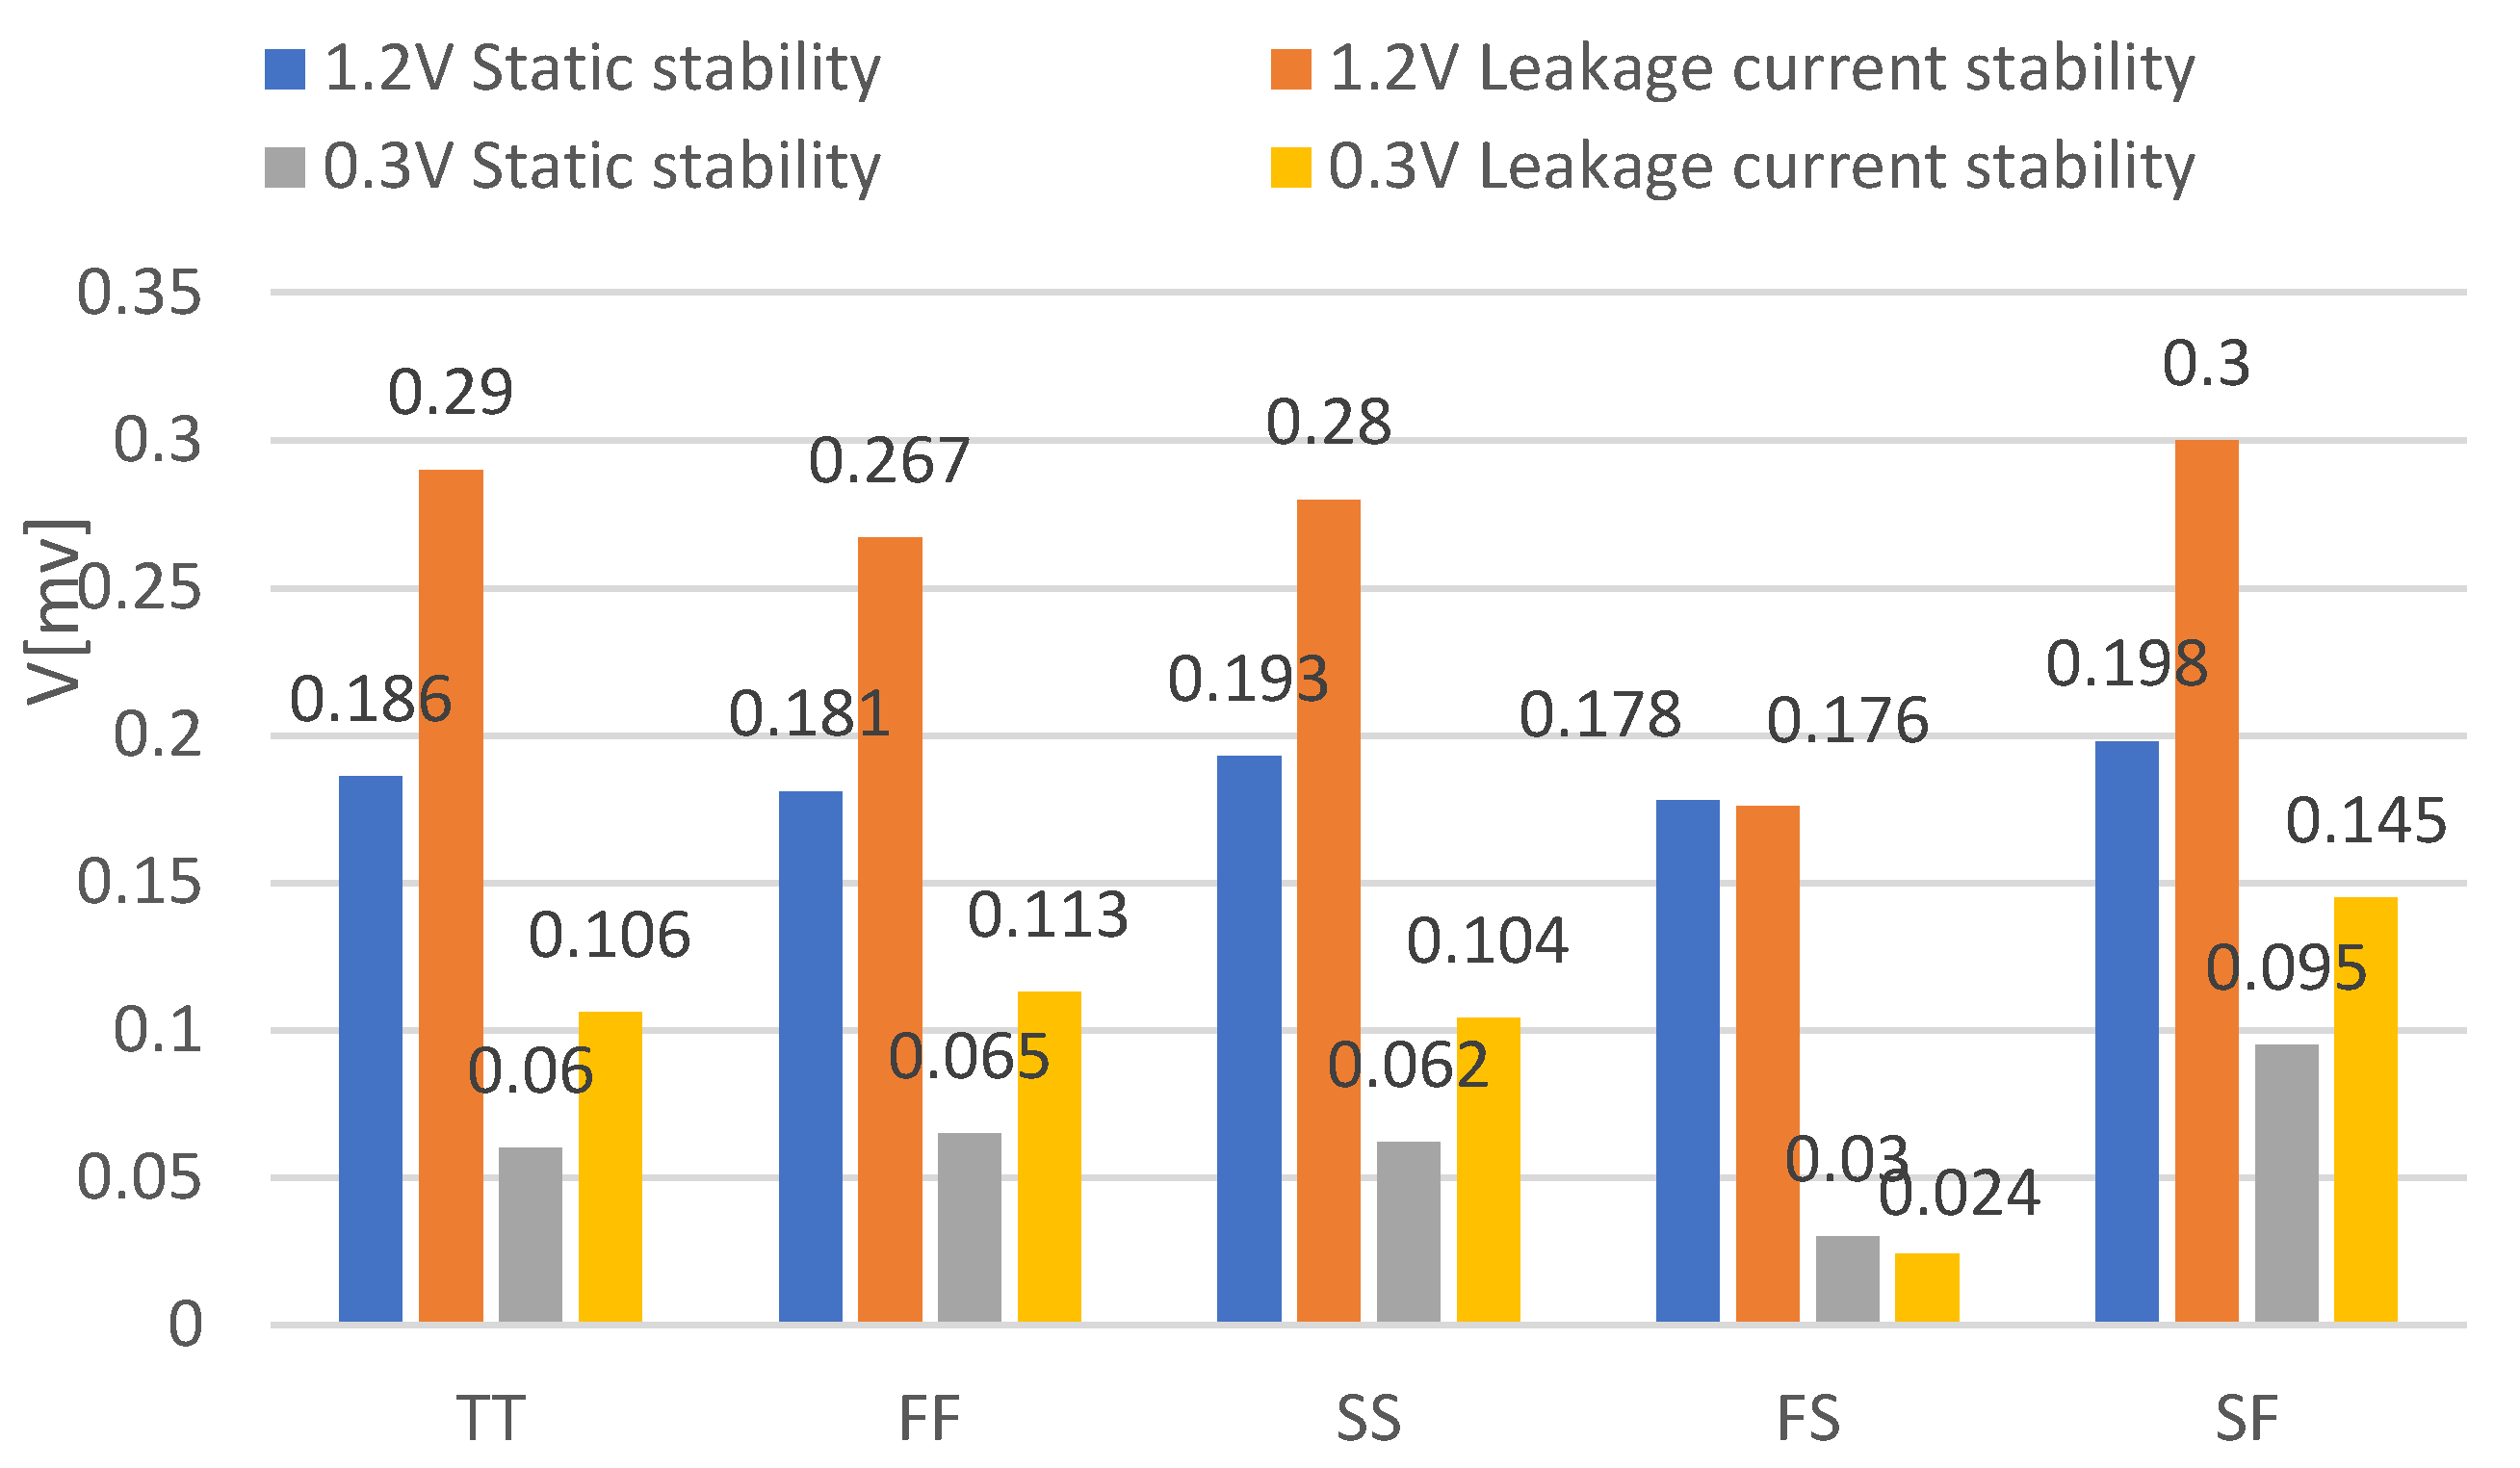
3.1. Different Process Corners in Same Design

In order to detect the difference between the leakage-current-based stability measurement method and the conventional method at different process angles, the stability of 6T SRAM was measured at five process angles, TT (typical nmos and typical pmos), FF (fast nmos and fast pmos), SS (slow nmos and slow pmos), FS (fast nmos and slow pmos) and SF (slow nmos and fast pmos), with the supply voltage of 1.2 V and 0.3 V, respectively. The results are shown in Figure 8.
To better compare the sensitivity of the two methods to the variation in each process angle, the TT process was used as the standard to compare the difference between the static stability and the stability based on leakage current under the remaining four processes and the TT process, and the simulation data are shown in Figure 9 below.
According to the data in the table, under different process angles, the leakage current stability of 1.2 V and 0.3 V changed more than the static stability (under the FS process, the variation in static stability at 1.2 V was 7.5% of the variation in leakage current stability and the variation in static stability analysis at 0.3 V was 36% of the variation in leakage current stability). Therefore, based on the stability of leakage current, it is more sensitive to changes in process angles than static stability. Therefore, when measuring the stability of the SRAM, the stability based on the leakage current is more accurate than the static stability.

3.2. Different Design in Same Process

From the appeal analysis, it can be concluded that the 6T SRAM has strong limitations in subthreshold design and that the leakage-current-based stability analysis is more accurate and convenient than static stability analysis at subthreshold. In this paper, stability simulations were performed for different designs (8T, 9T and 10T subthreshold SRAMs) at TSMC 28 nm hpc process.
Figure 10a shows the simulated 8T subthreshold design SRAM schematic [17], which was simulated by leakage-current-based stability analysis and static stability analysis methods, respectively, and the results are shown in the following figures.
Figure 11a shows the simulated 9T subthreshold design SRAM schematic [18], which was simulated by leakage-current-based stability analysis and static stability analysis methods, respectively, and the results are shown in the following figures.
Figure 12a shows the simulated 10T subthreshold design SRAM schematic [19], which was simulated by leakage-current-based stability analysis and static stability analysis methods, respectively, and the results are shown in the following figures.
The stability measured by the conventional method is expressed as the static voltage noise tolerance (SNM), and the stability measured by the proposed method is expressed as read voltage noise tolerance (RVNM), read current noise tolerance (RINM), write voltage noise tolerance (WVNM) and write current noise tolerance (WINM). The stability simulation data measured by the two methods were collated, and the specific data comparison is shown in the following Table 2.
Combining the above simulation plots and simulation data analysis, it can be seen that the values of SNM and WNM obtained for 8T, 9T, and 10T SRAMs were similar (SNM8T = 80 mV, SNM9T = 80 mV, SNM10T = 75 mV) when the stability was measured using the static stability method; the static stability simulation plots for reading and writing were similar. At this point, it is impossible to accurately determine which SRAM is more stable. However, after using the stability analysis based on the leakage current, we can conclude that RVNM = 107 mV and RINM = 521 nA for 9T are the largest values among the three memories, so SRAM has the best reading stability. Additionally, 9T has WVNM = 193 mV and WINM = 81.4 nA, which are the smallest values among the three memories. Therefore, the SRAM has a higher write capability. However, this information cannot be derived from the static stability, so it can be concluded that in the subthreshold region, the static stability method considering only voltage is not applicable, and the measurement results are not accurate. The leakage-current-based stability analysis, which considers both current and voltage together, further demonstrates that the leakage-current-based stability analysis is more accurate than the static stability method in the subthreshold region.

4. Conclusions

Considering the influence of leakage current on stability under subthreshold levels, the static stability analysis considering only voltage is not accurate enough for measurement under subthreshold levels. In this paper, we propose a stability analysis method based on leakage current for simulating the stability of subthreshold SRAM. This approach considers the effects of current and voltage on SRAM stability in combination and provides better metrics of SINM and WTI so the stability of subthreshold SRAMs may be better evaluated. The proposed method in this paper was compared with conventional methods, and the read and write measurements are displayed on a single graph; without additional mathematical tool processing and breaks the limitation of conventional measurement methods is that the maximum static noise tolerance can only reach 0.5 Vdd. Finally, this paper was validated by simulations for different process corners and different designs. Under different process angles, the stability analysis result of the leakage current was 121.75% of the static stability, which was more sensitive to the change of process angle; under different designs, the stability analysis accuracy of the leakage current was 120.58% of the static stability. Therefore, the leakage-current-based stability analysis method for subthreshold SRAM proposed in this paper is more accurate and convenient, and can be applied to the measurement of low-power memory stability under subthreshold levels, which provides a new idea for the testing of VLSI.

Author Contributions

Y.X. and Z.H. designed the method and wrote the paper; N.B. and Y.W. performed the experiments and analyzed the data. All authors have read and agreed to the published version of the manuscript.

Funding

This research was funded by the National Natural Science Foundation of China (No. 61204039) and the Key Laboratory of Computational Intelligence and Signal Processing, Ministry of Education (No. 2020A012).

Data Availability Statement

All data included in this study are available upon request by contacting with the corresponding author.

Conflicts of Interest

The authors declare that there are no conflicts of interest regarding the publication of this paper.

References

  1. Gaadhe, A.; Shirode, U.; Kanphade, R. The Stability Performance Analysis of SRAM Cell Topologies in 90nm and 130nm CMOS technology. In Proceedings of the 2021 International Conference on Emerging Smart Computing and Informatics (ESCI), Pune, India, 5–7 March 2021; pp. 733–736. [Google Scholar] [CrossRef]
  2. Karamimanesh, M.; Abiri, E.; Hassanli, K.; Salehi, M.R.; Darabi, A. A Write Bit-Line Free Sub-threshold SRAM Cell with Fully Half-Select Free Feature and High Reliability for Ultra-Low Power Applications. AEU-Int. J. Electron. Commun. 2021, 145, 154075. [Google Scholar] [CrossRef]
  3. Gopinath, A.; Ytterdal, T.; Miled, Z.B.; Meagher, R.; Rizkalla, M. Leakage Current and Static Power Analysis of TFET 8T-SRAM Cell—ScienceDirect. Mater. Today Proc. 2019, 7, 878–887. [Google Scholar] [CrossRef]
  4. Nanda, U.; Nayak, D.; Saw, S.K.; KK, A.M.; Jena, B. Analysis of Static Noise Margin of 10T SRAM Using Sleepy Stack Transistor Approach. In Proceedings of the 2021 Devices for Integrated Circuit (DevIC), Kalyani, India, 24–25 March 2021. [Google Scholar]
  5. Rawat, R.M.; Kumar, V. A Comparative Study of 6T and 8T SRAM Cell with Improved Read and Write Margins in 130 nm CMOS Technology. WSEAS Trans. Circuits Syst. 2020, 19, 13–18. [Google Scholar] [CrossRef]
  6. Saun, S.; Kumar, H. Design and performance analysis of 6T SRAM cell on different CMOS technologies with stability characterization. IOP Conf. Ser. Mater. Sci. Eng. 2019, 561, 012093. [Google Scholar] [CrossRef] [Green Version]
  7. Sachdeva, A.; Tomar, V. Statistical Stability Characterization of Schmitt Trigger Based 10-T SRAM Cell Design. In Proceedings of the 7th International Conference on Signal Processing and Integrated Networks (SPIN 2020), Noida, India, 27–28 February 2020. [Google Scholar]
  8. Yadav, S.; Sharma, D. Assessment of read and write stability for 6T SRAM cell based on charge plasma DLTFET. Superlattices Microstruct. 2018, 115, 67–77. [Google Scholar]
  9. Kim, T.; Manisankar, S.; Chung, Y. A Novel 8T Cell-Based Subthreshold Static RAM for Ultra-Low Power Platform Applications. Electronics 2020, 9, 928. [Google Scholar] [CrossRef]
  10. Zheng, Z.A.; Hu, P.H. Improved Read Stability and Writability of Negative Capacitance FinFET SRAM Cell for Subthreshold Operation. In Proceedings of the 2019 IEEE International Symposium on Circuits and Systems (ISCAS), Hokkaido, Japan, 26–29 May 2019; IEEE: Piscataway, NJ, USA, 2019. [Google Scholar]
  11. Huang, X.; Yao, Y.; Peng, S.; Zhang, D.; Shi, J.; Jin, Z. Effects of Charge Trapping at the MoS2–SiO2 Interface on the Stability of Subthreshold Swing of MoS2 Field Effect Transistors. Materials 2020, 13, 2896. [Google Scholar] [CrossRef] [PubMed]
  12. Raychowdhury, A.; Mukhopadhyay, S.; Roy, K. A Feasibility Study of Subthreshold SRAM Across Technology Generations. In Proceedings of the IEEE International Conference on Computer Design: Vlsi in Computers & Processors IEEE, San Jose, CA, USA, 2–5 October 2005. [Google Scholar]
  13. Zamani, M.; Hassanzadeh, S.; Hajsadeghi, K.; Saeidi, R. A 32 kb 90 nm 9T-cell sub-threshold SRAM with improved read and write SNM. In Proceedings of the 2013 8th International Conference on Design & Technology of Integrated Systems in Nanoscale Era (DTIS), Abu Dhabi, United Arab Emirates, 26–28 March 2013; pp. 104–107. [Google Scholar] [CrossRef]
  14. Birla, S.; Singh, R.K.; Pattanaik, M. Stability and Leakage Analysis of a Novel PP Based 9T SRAM Cell Using N Curve at Deep Submicron Technology for Multimedia Applications. Circuits Syst. 2011, 2, 274–280. [Google Scholar] [CrossRef] [Green Version]
  15. Samson, M.; Srinivas, M.B. Analyzing N-Curve Metrics for Sub-Threshold 65nm CMOS SRAM. In Proceedings of the Nanotechnology, NANO ’08, 8th IEEE Conference, Arlington, TX, USA, 18–21 August 2008; IEEE: Piscataway, NJ, USA, 2008. [Google Scholar]
  16. Kingra, S.K.; Majumdar, S.; Suri, M. Stability analysis of hybrid CMOS-RRAM based 4T-2R NVSRAM. In Proceedings of the New Circuits & Systems Conference, Strasbourg, France, 25–28 June 2017; IEEE: Piscataway, NJ, USA, 2017. [Google Scholar]
  17. Kim, H.; Kim, T.; Manisankar, S.; Chung, Y. Read disturb-free SRAM bit-cell for subthreshold memory applications. In Proceedings of the 2017 International Conference on Electron Devices and Solid-State Circuits (EDSSC), Hsinchu, Taiwan, 18–20 October 2017. [Google Scholar]
  18. Gupta, M.; Gupta, K.; Pandey, N. A 32-nm Sub-Threshold 9T SRAM Bitcell with Improved Read and Write performance. In Proceedings of the 2018 International Conference on Advances in Computing, Communication Control and Networking (ICACCCN), Greater Noida, India, 12–13 October 2018; pp. 781–787. [Google Scholar] [CrossRef]
  19. Eslami, N.; Ebrahimi, B.; Shakouri, E.; Najafi, D. A single-ended low leakage and low voltage 10T SRAM cell with high yield. Analog Integr. Circuits Signal Process. 2020, 105, 263–274. [Google Scholar] [CrossRef]
Figure 1. Device turn-on to turn-off current ratio.
Electronics 11 01196 g001
Figure 2. Static stability analysis schematic.
Electronics 11 01196 g002
Figure 3. Static stability simulation curve of reading operation.
Electronics 11 01196 g003
Figure 4. Static stability simulation diagram of the write operation.
Electronics 11 01196 g004
Figure 5. Leakage current stability analysis schematic.
Electronics 11 01196 g005
Figure 6. Simulation of stability curve based on leakage current.
Electronics 11 01196 g006
Figure 7. (a) Static stability at 1.2 V; (b) stability of leakage current at 1.2 V; (c) static stability at 0.3 V; (d) and stability of leakage current at 0.3 V.
Electronics 11 01196 g007
Figure 8. Process angle simulation data.
Electronics 11 01196 g008
Figure 9. Compared with the difference in TT process angle.
Electronics 11 01196 g009
Figure 10. (a) 8T unit schematic; (b) stability based on leakage current; (c) read static stability; and (d) write static stability.
Electronics 11 01196 g010
Figure 11. (a) 9T unit schematic; (b) stability based on leakage current; (c) read static stability; and (d) write static stability.
Electronics 11 01196 g011
Figure 12. (a) 10T unit schematic; (b) stability based on leakage current; (c) read static stability; and (d) write static stability.
Electronics 11 01196 g012aElectronics 11 01196 g012b
Table 1. Comparison of stability and static stability based on leakage current.
Static Stability AnalysisStability Analysis Based on Leakage Current
Read stability indicators:
read voltage noise tolerance (RVNM), read current noise tolerance (RINM)
Read stability indicators:
read static voltage noise tolerance
(RSNM)
Write stability indicators:
write voltage noise tolerance (WVNM),
write current noise tolerance (WINM)
Write stability indicators:
write static voltage noise tolerance
(WSNM)
The maximum noise tolerance that can be measured:0.5 Vdd [16]The maximum noise tolerance that can be measured: no limit
Additional calculation tools required (MATLAB)No additional calculation tools required
Read and write information are separatedRead and write information are in one curve
Data contain only voltage informationData contain both current and voltage information
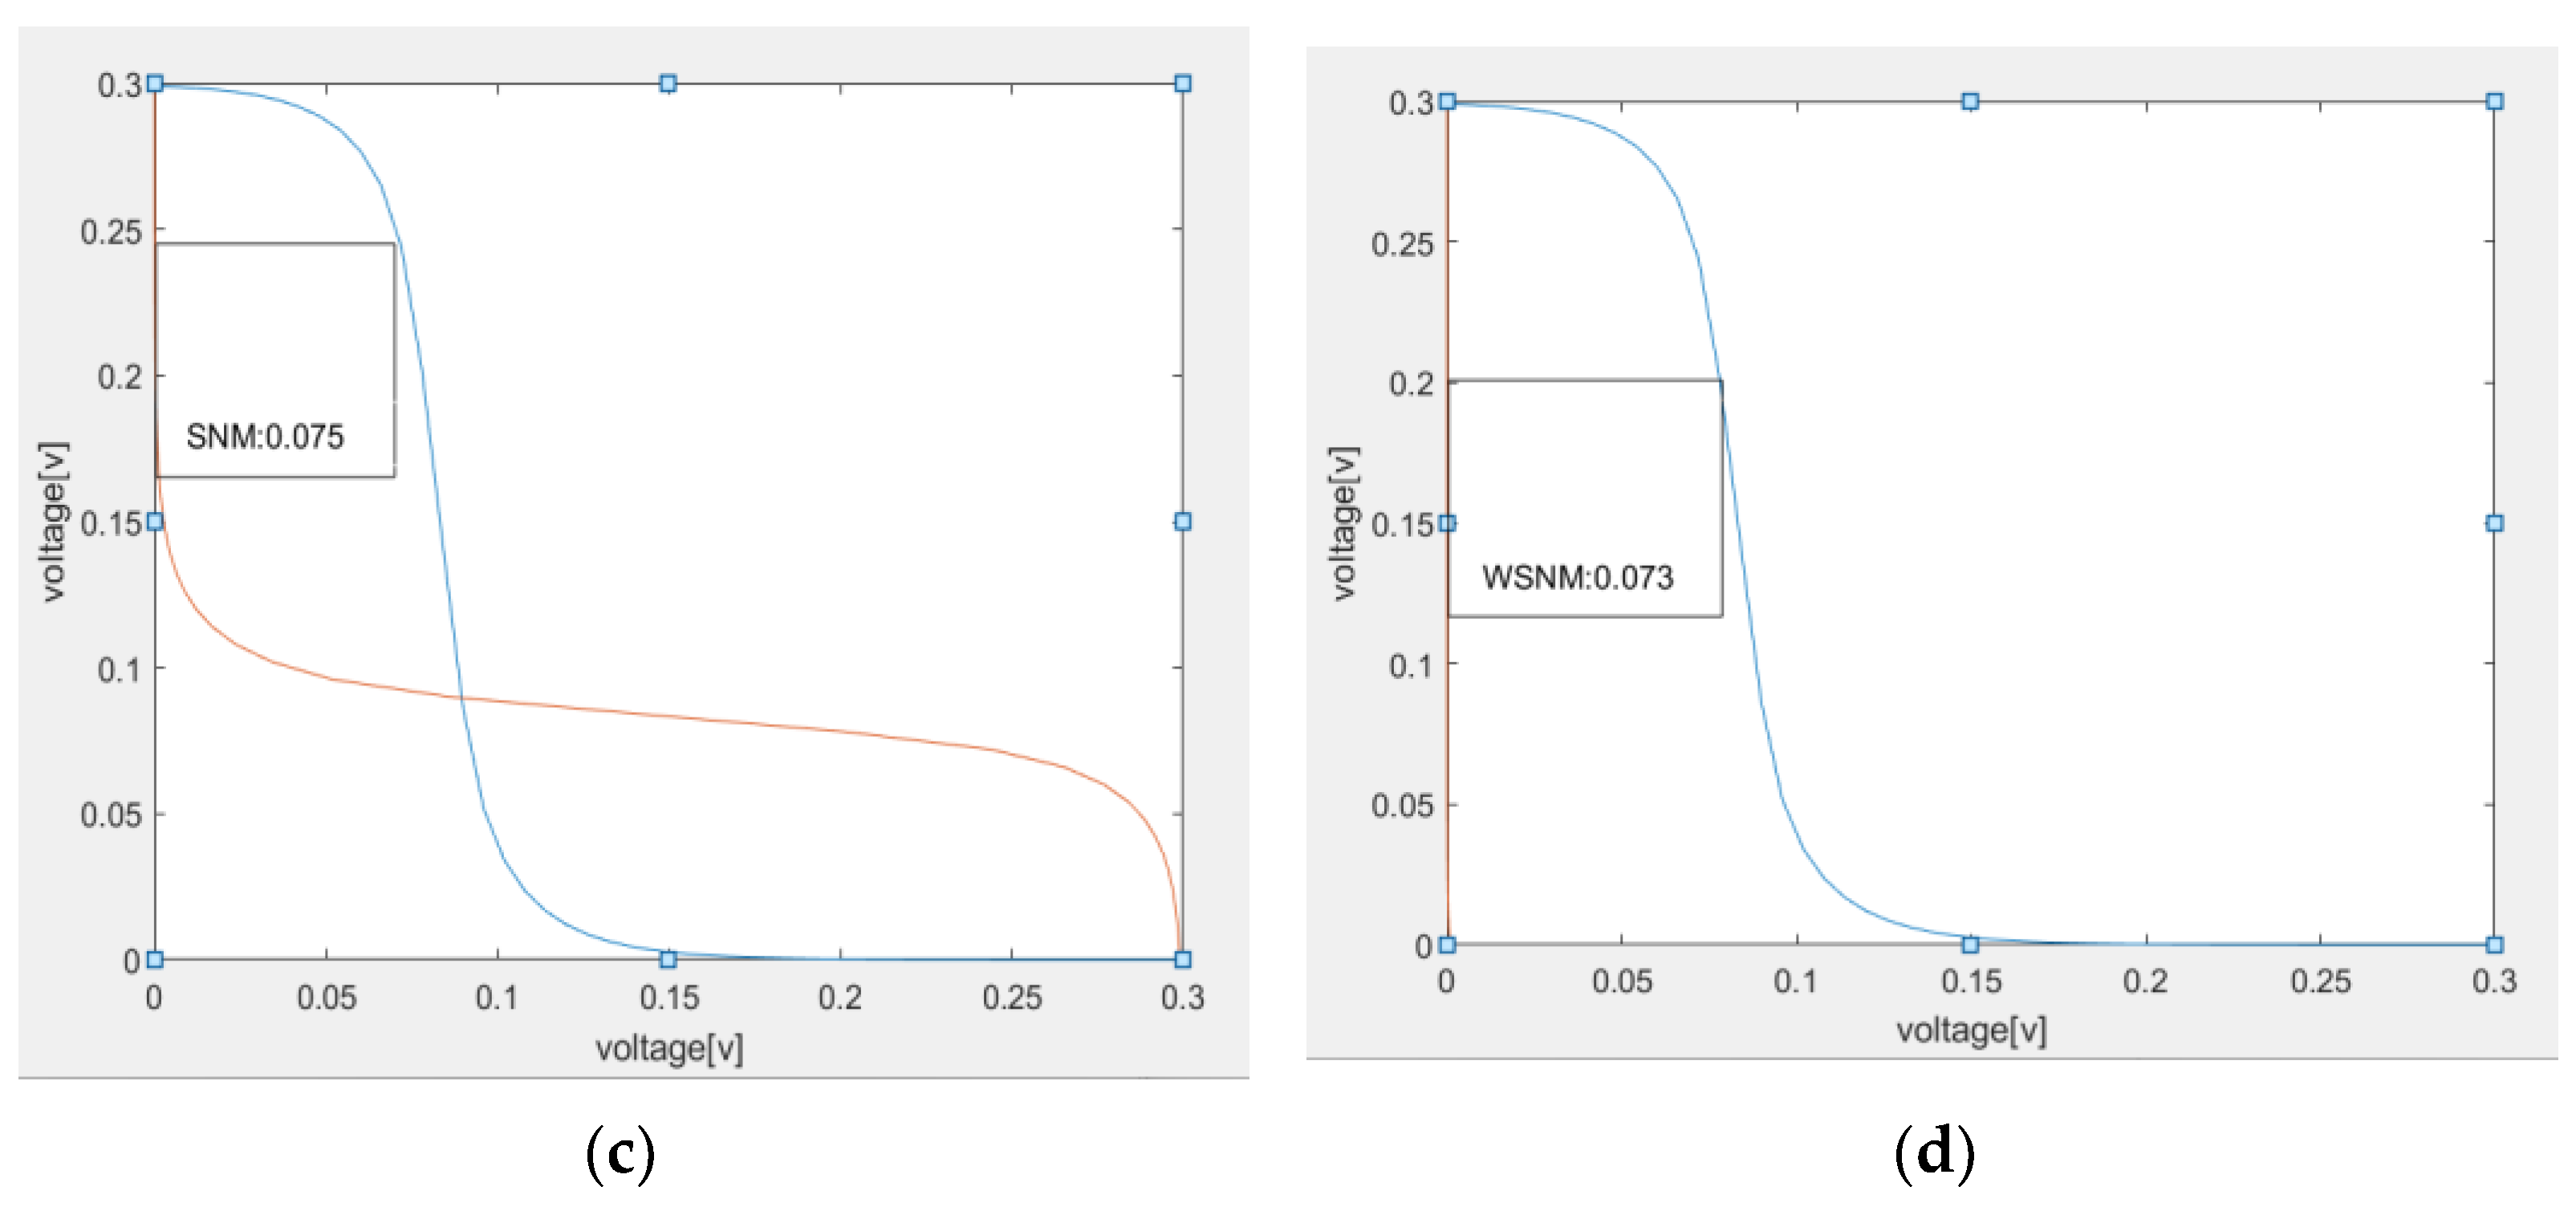
Table 2. Simulation data sheet.
SNM (mV)WSNM (mV)RINM (nA)RVNM (mV)WVNM (mV)WINM (nA)
8T80924869620423
9T807952110719381.4
10T75734498221842
Publisher’s Note: MDPI stays neutral with regard to jurisdictional claims in published maps and institutional affiliations.

