Article

Detection of Impurity Rate of Machine-Picked Cotton Based on Improved Canny Operator

School of Mechanical Engineering, University of Jinan, Jinan 250022, China
*
Author to whom correspondence should be addressed.
Electronics 2022, 11(7), 974; https://doi.org/10.3390/electronics11070974
Submission received: 12 February 2022 / Revised: 17 March 2022 / Accepted: 17 March 2022 / Published: 22 March 2022
(This article belongs to the Collection Electronics for Agriculture)

Abstract

:
Aiming at the real-time detection of the impurity rate in machine-picked cotton processing, a detection method for the impurity rate in machine-picked cotton was proposed based on an improved Canny operator. According to the characteristics of different saturations between cotton and impurities, the impurities were separated by extracting the image S channel. Due to problems existing in the traditional Canny operator’s edge detection, the Gaussian filter was replaced by employing mean filtering and nonlocal mean denoising, which could effectively remove the noise in the image. A YOLO V5 neural network was used to classify and identify the impurities after segmentation, and the densities of various impurities were measured. The volume–weight (V–W) model was established to solve the impurity rate based on mass. Compared with a single thread, the data processing time was shortened by 43.65%, and the frame rate was effectively improved by using multithread technology. By solving the average value of the impurity rate, the anti-interference performance of the algorithm was enhanced, and has the characteristics of real-time detection and stability. This method solved the problems of low speed, poor real-time detection, and ease of interference, and can be used to guide the cotton production process.

1. Introduction

China is a major cotton producer, and Xinjiang is the most important cotton-producing area in China. In northern Xinjiang, the mechanization level of cotton planting and harvesting has reached 97%. The mechanization level of southern Xinjiang, according to data from 2020, has also reached 40%, with the mechanization level increased year by year, but with cotton mixed with impurities also increasing, including machine-picked seed cotton in the presence of bell shells, stiff petals, cotton branches, cotton leaves, dust, and other natural impurities. At the same time, the machine-picked cotton processing technology has gradually developed, and machine-picked cotton processing equipment, the complex process, and the working state of the equipment have a great impact on the cleaning of cotton, such as the machine-picked cotton processing equipment’s rotating speed being too low to achieve a cleaning effect in the cotton, while a high speed will cause damage to the cotton fiber. Therefore, real-time monitoring of impurity content in seed cotton can provide a basis for adjusting the speed of machine cotton-picking processing equipment, and is of great significance for improving the quality of cotton.
In the process of impurity rate detection based on image information, the primary task is to segment impurities from the cotton image. In terms of cotton impurity detection, Lu Xufeng et al. [1] and Zhang Yun et al. [2] detected and identified heterotopic fibers in cotton based on machine vision. Dong Chaoqun et al. [3] analyzed the advantages and disadvantages of various optical imaging technologies in the detection of heterotopic cotton fibers. Shi Hongyu et al. [4] detected heterotopic fibers in cotton based on the method of image multiresolution difference. Cao Zhenjun et al. [5] used raspberry PI to detect fabric defects based on deep learning. Ding Xiaokang et al. [6] used the Canny operator to detect colored foreign fibers. Zhao et al. [7] and Zhao Xuehua et al. [8] selected the characteristics of heterotopic fibers in cotton by improving particle swarm optimization and ant colony algorithms to classify and identify heterotopic fibers. Wang et al. [9] proposed a segmentation algorithm for lint heterotopic fibers. He Xiaoyun et al. [10] used deep learning to detect heterotopic fibers in cotton. Pavani et al. [11] used pattern-recognition technology to classify impurities in raw cotton. Zhang Chengliang et al. [12,13] applied the regional color method and genetic algorithm to optimize the a support vector machine (SVM) parameter model to segment impurities in images of machine-picked cotton. Wang Haopeng et al. [14], Wang Xin et al. [15], and Wei Ping et al. [16] proposed a machine-vision-based method for cotton fiber recognition. In the process of image segmentation, most of the segmentation objects need to have their edges found, and the traditional image edge-detection methods mostly extract high-frequency signals as the main means; for example, the Roberts operator, Sobel operator, Prewitt operator, or LOG operator. Compared with these differential operators, the Canny operator based on an optimization algorithm is widely used due to its advantages of a large SNR and high detection accuracy. Many scholars at home and abroad have studied the optimization of the Canny operator [17,18,19,20,21,22,23]. Wang Zuocheng et al. [24] improved the traditional Canny operator by introducing the Otsu threshold method to select threshold values according to the characteristics of the image itself so that the detected edges were more continuous, and the existence of false edges was reduced. Jin Yanhong et al. [25] improved the precision of edge location by improving the calculation of gradient amplitude and the interpolation direction of the nonextreme suppression process. Zhang Zhishun et al. [26] used a genetic algorithm to automatically optimize the threshold function based on generalized cross-validation (GCV) criteria, and used the evaluation function to adaptively set the high and low threshold value of the Otsu method, which reduced the noise in the image and improved the detection accuracy. Wang Rong et al. [27] and Bai Tingting et al. [28] proposed an edge-detection method that combined the Canny method and a wavelet transform. The edge images obtained by the two methods were fused to ensure the integrity of the edge, but the interference information also increased, and the running time of the algorithm was not considered, which was not conducive to real-time detection. However, because the traditional Canny operator is sensitive to noise and requires an artificial setting of Gaussian filter parameters, it lacks an adaptability to different images, so these methods have achieved experimental results to a certain extent. However, there are still limitations, such as the processing time being too long to carry out real-time detection. In addition, the detection result is also affected by the environment, and the anti-interference is poor.
Domestic and foreign scholars have done a lot of work to solve the problem of noise influence. For example, A Ouahabi [29] used wavelet denoising technology to denoise medical ultrasound and magnetic resonance images. Many questions could be answered by a prospective study using an undecimated discrete wavelet transform as a contourlet transform to facilitate the processing of edge features, and thus achieve a more efficient noise reduction. However, when using wavelet multiresolution analysis, there is a trade-off between noise reduction and preservation of important details. Because wavelet denoising transforms the time domain information to the frequency domain for processing, the number of calculations will greatly increase; this can be applied in static image processing, but cannot be applied in the real-time detection of machine-picked seed cotton.
In this study, based on image-processing technology, the impurity rate in machine-picked cotton was examined, and the impurity content in cotton processing was fed back in real time to guide the cotton processing. In this paper, an improved Canny operator segmentation, a traditional Canny operator segmentation, SVM segmentation, K-means clustering, and other algorithms were used to find impurities in the seed cotton image-segmentation machine, and a YOLO V5 neural network was used to classify and identify the impurities after segmentation and measure the density of various impurities, establish the V–W model, and solve the impurity rate based on quality. In addition, as a comparative experiment, impurities were manually separated and weighed by electronic balance to obtain the impurity inclusion rate of a mass method, which was compared with the impurity inclusion rate based on image information, in order to compare the merits and demerits of various algorithms. Raspberry PI was used to build a detection platform for the impurity rate of machine-picked seed cotton, and the collected images were transmitted to the server for processing to realize the real-time detection of the impurity rate.

2. Materials and Methods

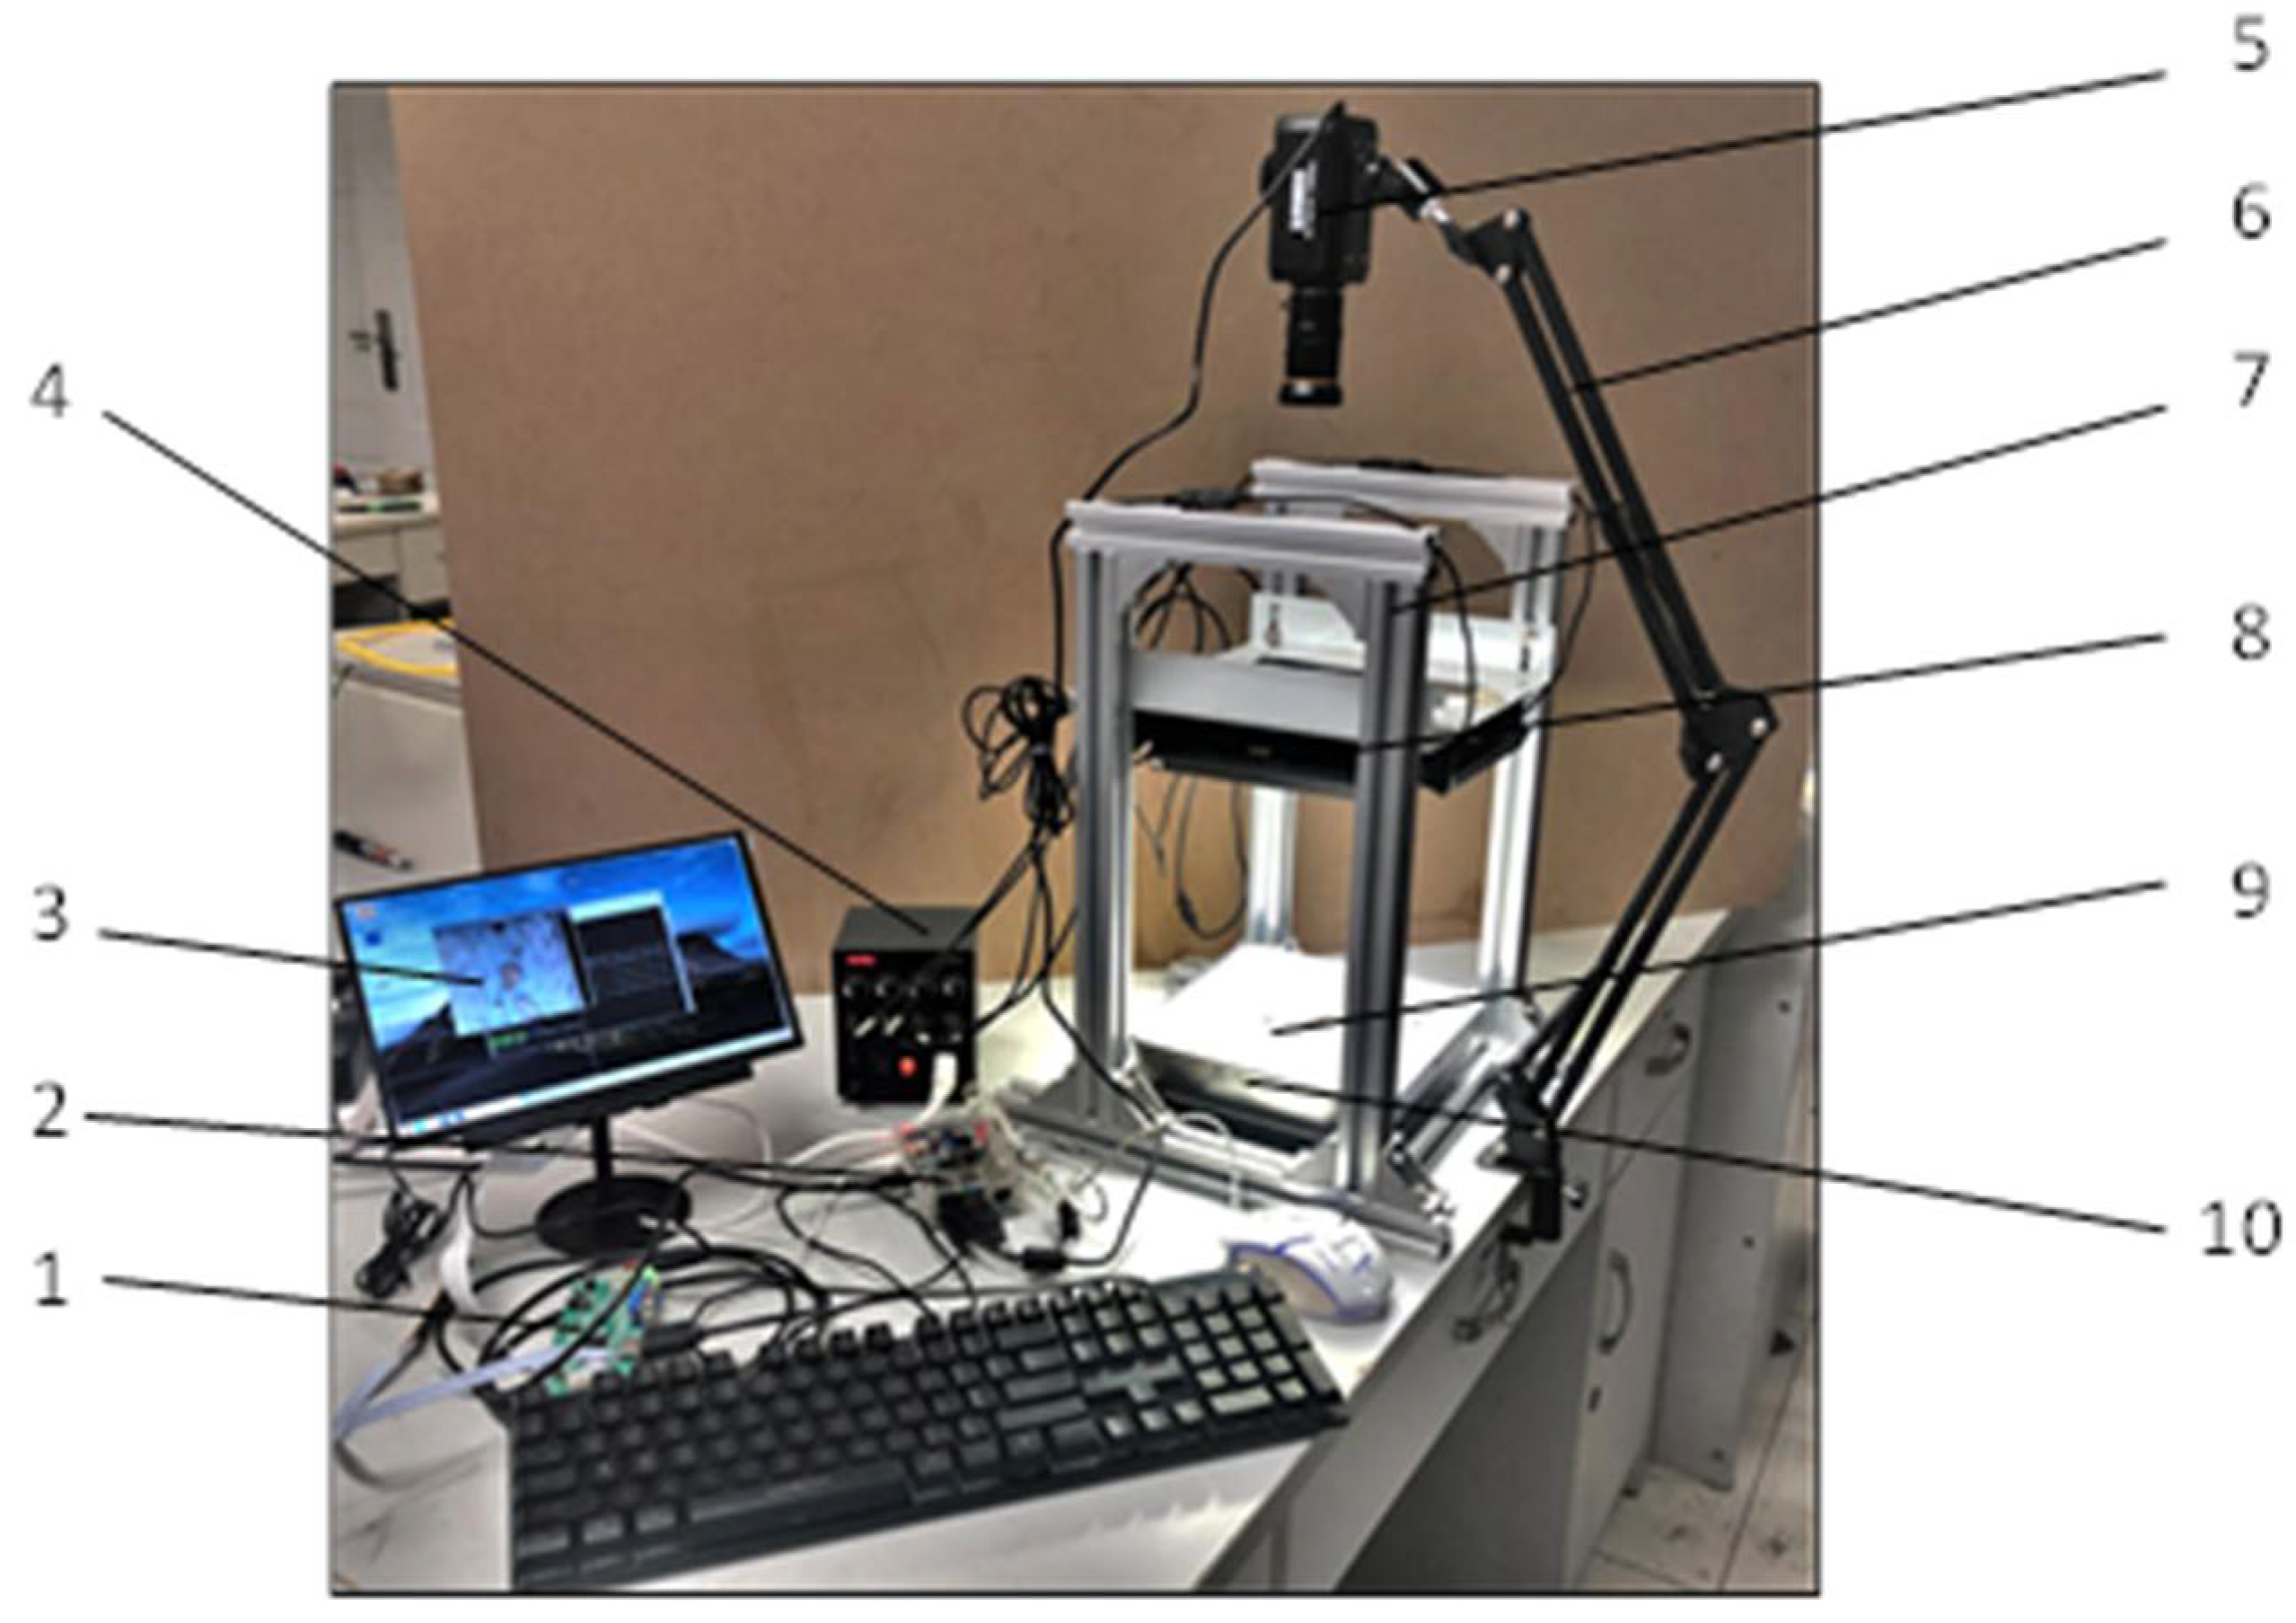
2.1. Real-Time Detection System for Machine-Picked Seed Cotton

The real-time detection system of machine seed-cotton picking was divided into two parts; namely, the lower computer and the upper computer, as shown in Figure 1. The lower computer collected the image in real time through the camera, encoded the image information, and transmitted it to the server of the upper computer through the Raspberry PI. The server decoded the image information first, segmented the image for impurities, classified and identified the impurities in the segmented image using YOLO V5, and processed the data based on the V–W model. The real-time impurity rate and average impurity rate based on quality were obtained, and the results were finally output together with the segmented image.
The test material was seed cotton collected by the Xinluzao No. 59 machine of the 149 Regiment of the Xinjiang Eighth Agricultural Division, and the impurities included bell shells, cotton twigs, weeds, and leaf scraps. The PI model was a Raspberry4B (8 GB). A Ylr-sn85 camera with a resolution of 3840 pixels × 2160 pixels, a CMOS size of 1/2.7 inch, a frame rate of 30 frames/s, and a USB power supply was used. The lens had a maximum aperture of 1.4, a focal length of 5–50 mm, and 3 million pixels. The lighting source was an AFT-WL21244-22W strip LED diffuse light source, and the light source controller was an AFT-ALP2430-02. The processor of the server was an Intel(R) Core(TM) I5-9400F [email protected], the number of cores was 96, the GPU was an NVIDIA GeForce GTX 1660, the memory was 16 GB, the operating system was 64-bit Windows 10, and the algorithm-running environment was PyCharm 2021.1. The programming language was Python, using the open source OpenCV visual library.
The light source was installed on an adjustable bracket, which was convenient to adjust the irradiation angle of the light source. At the same time, the light source bracket was fixed on the bench profile by t-nuts and bolts, which could be used to adjust the distance between the light source and the cotton, providing high brightness and balanced lighting for the system. The camera was attached to the cotton and light source via a cantilever bracket, and was connected to a computer via USB. When the system was operating, the cotton was placed at the bottom of the platform manually, the distance of light source and the angle of irradiation were adjusted, and the real-time collection of machine-picked seed cotton images was carried out by the HD camera. In order to collect the same sample many times and calculate the mean of the impurity rate, the cotton sample needed to be constantly turned. The real-time images were encoded and transmitted to the server, which decoded the image information to detect the impurity rate, and output the detection results.
A photo of the image-acquisition system of the lower computer is shown in Figure 2, and the real-time processing results of the upper computer are shown in Figure 3.

2.2. Detection of Impurity Rate of Machine-Picked Cotton

2.2.1. Detection Process

A detection flow chart of the impurity rate of the machine-picked seed cotton is shown in Figure 4. First, by the image real-time acquisition machine adopted in the seed cotton impurity camera, the collected image color space transformation, the HSV color space S (saturation) channel extracted from image in, and truncation in the S channel of the image segmentation, the improved Canny operator was used for edge detection, and a morphological closing operation was carried out on the edge detection after the image formed the closed area. In addition, fills formed a closed area of the holes due to the existence of impurities associated with image edge images, and the use of the noise image with hole filling after a grey value addition operation for the image, as determined by gray histogram threshold segmentation. Then, for the gray image binarization operation, the processed image was analyzed by the YOLO v5 network model to carry out the classification identification of the impurities. Then it was output to another thread, using the V–W model to solve the real-time and average clutter-containing rate based on quality; and finally, to output the real-time clutter-containing rate, average clutter-containing rate, and segmentation image.

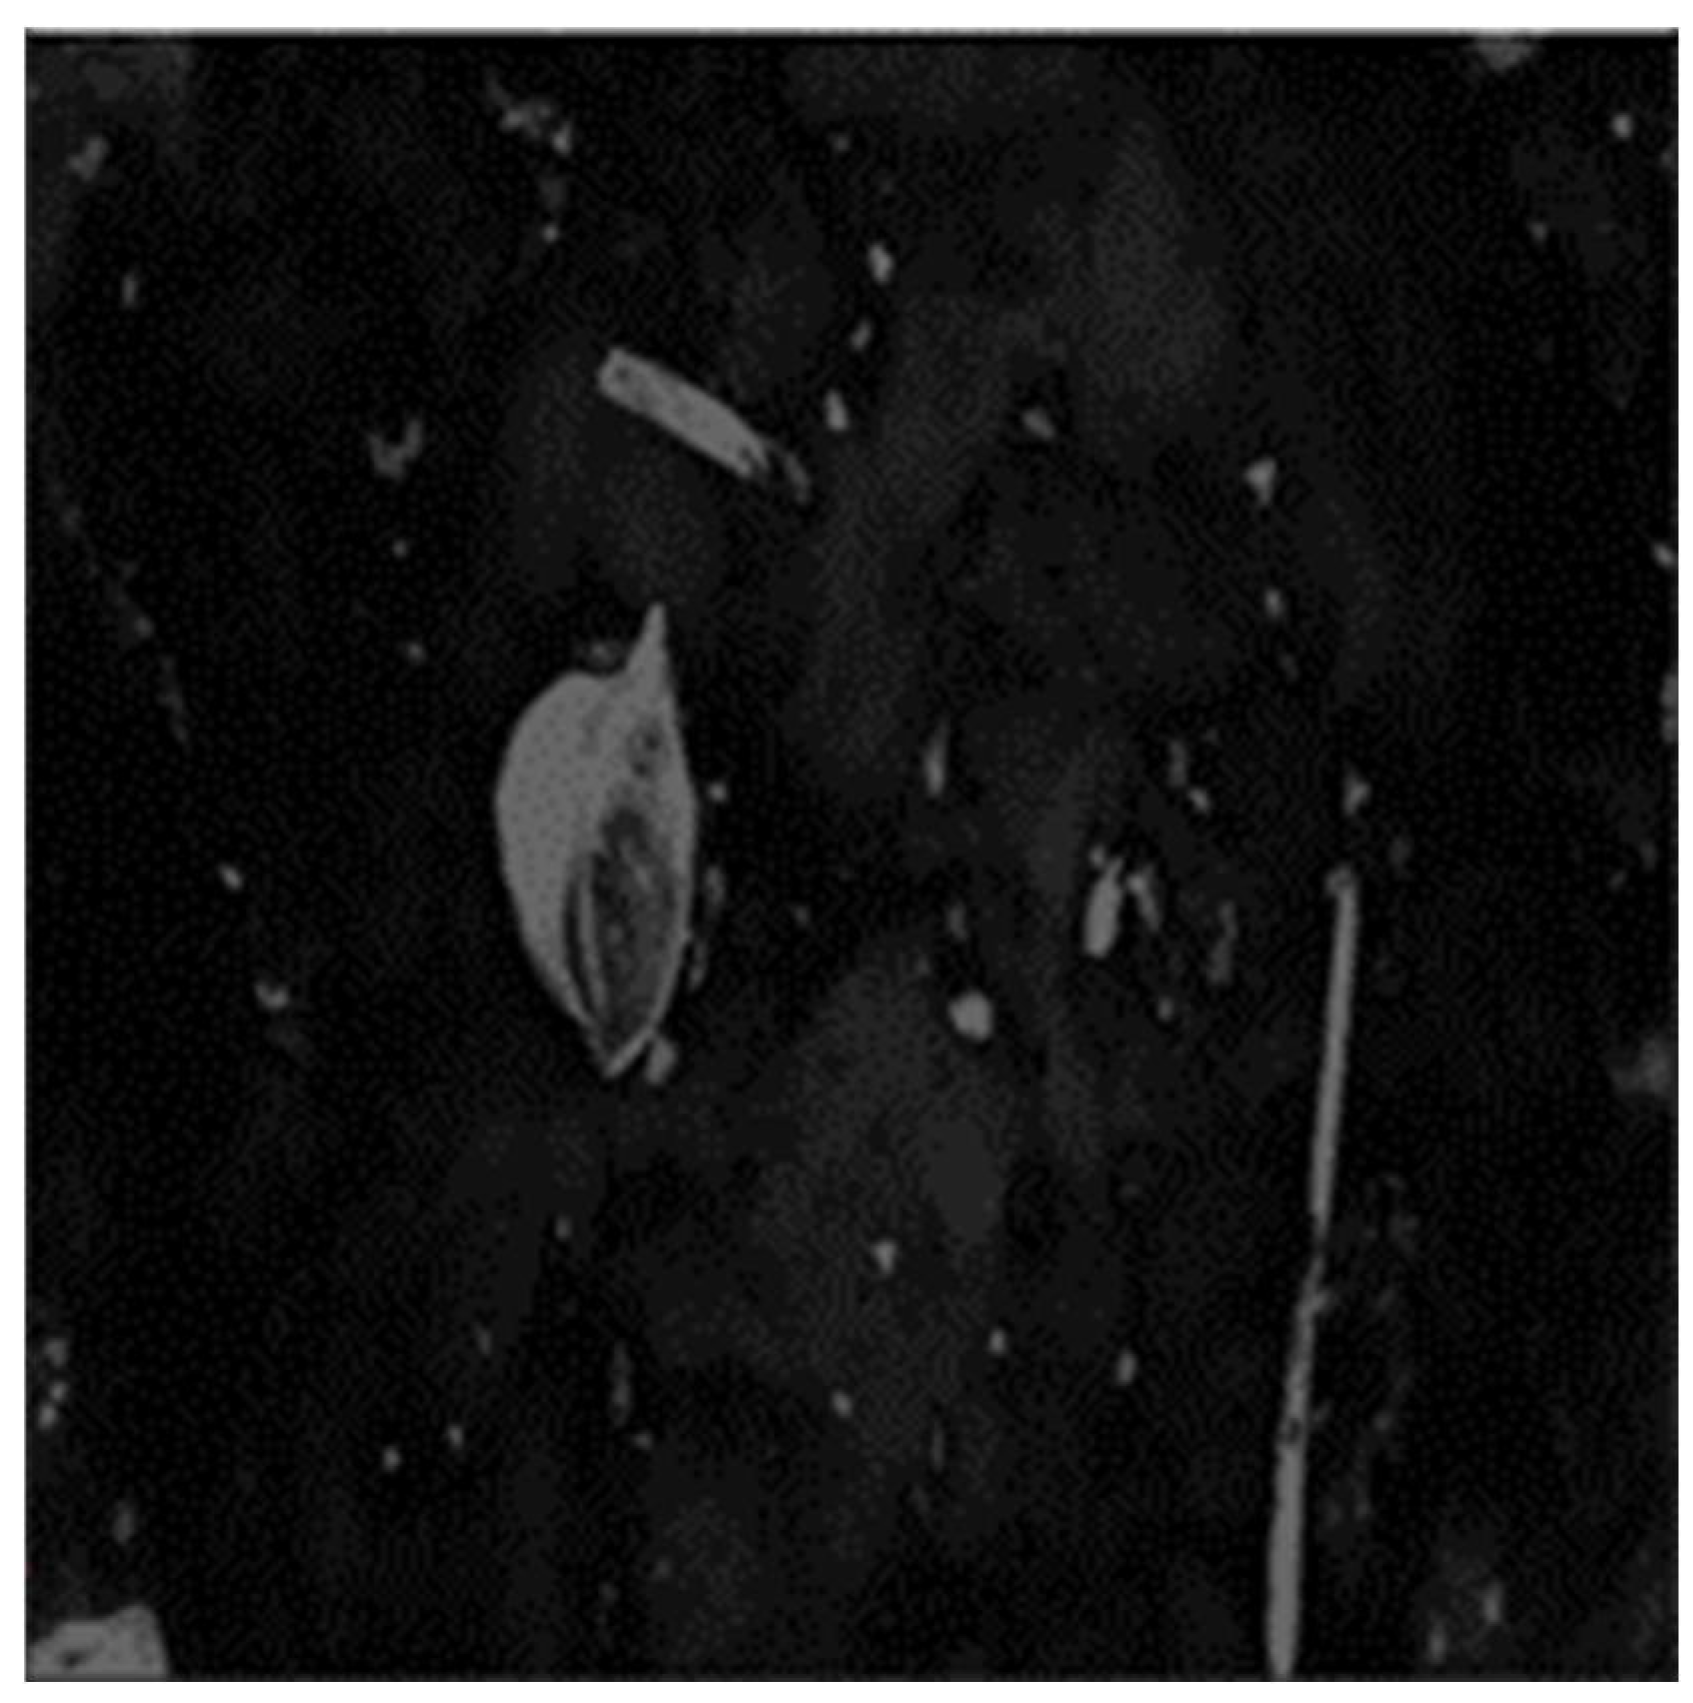
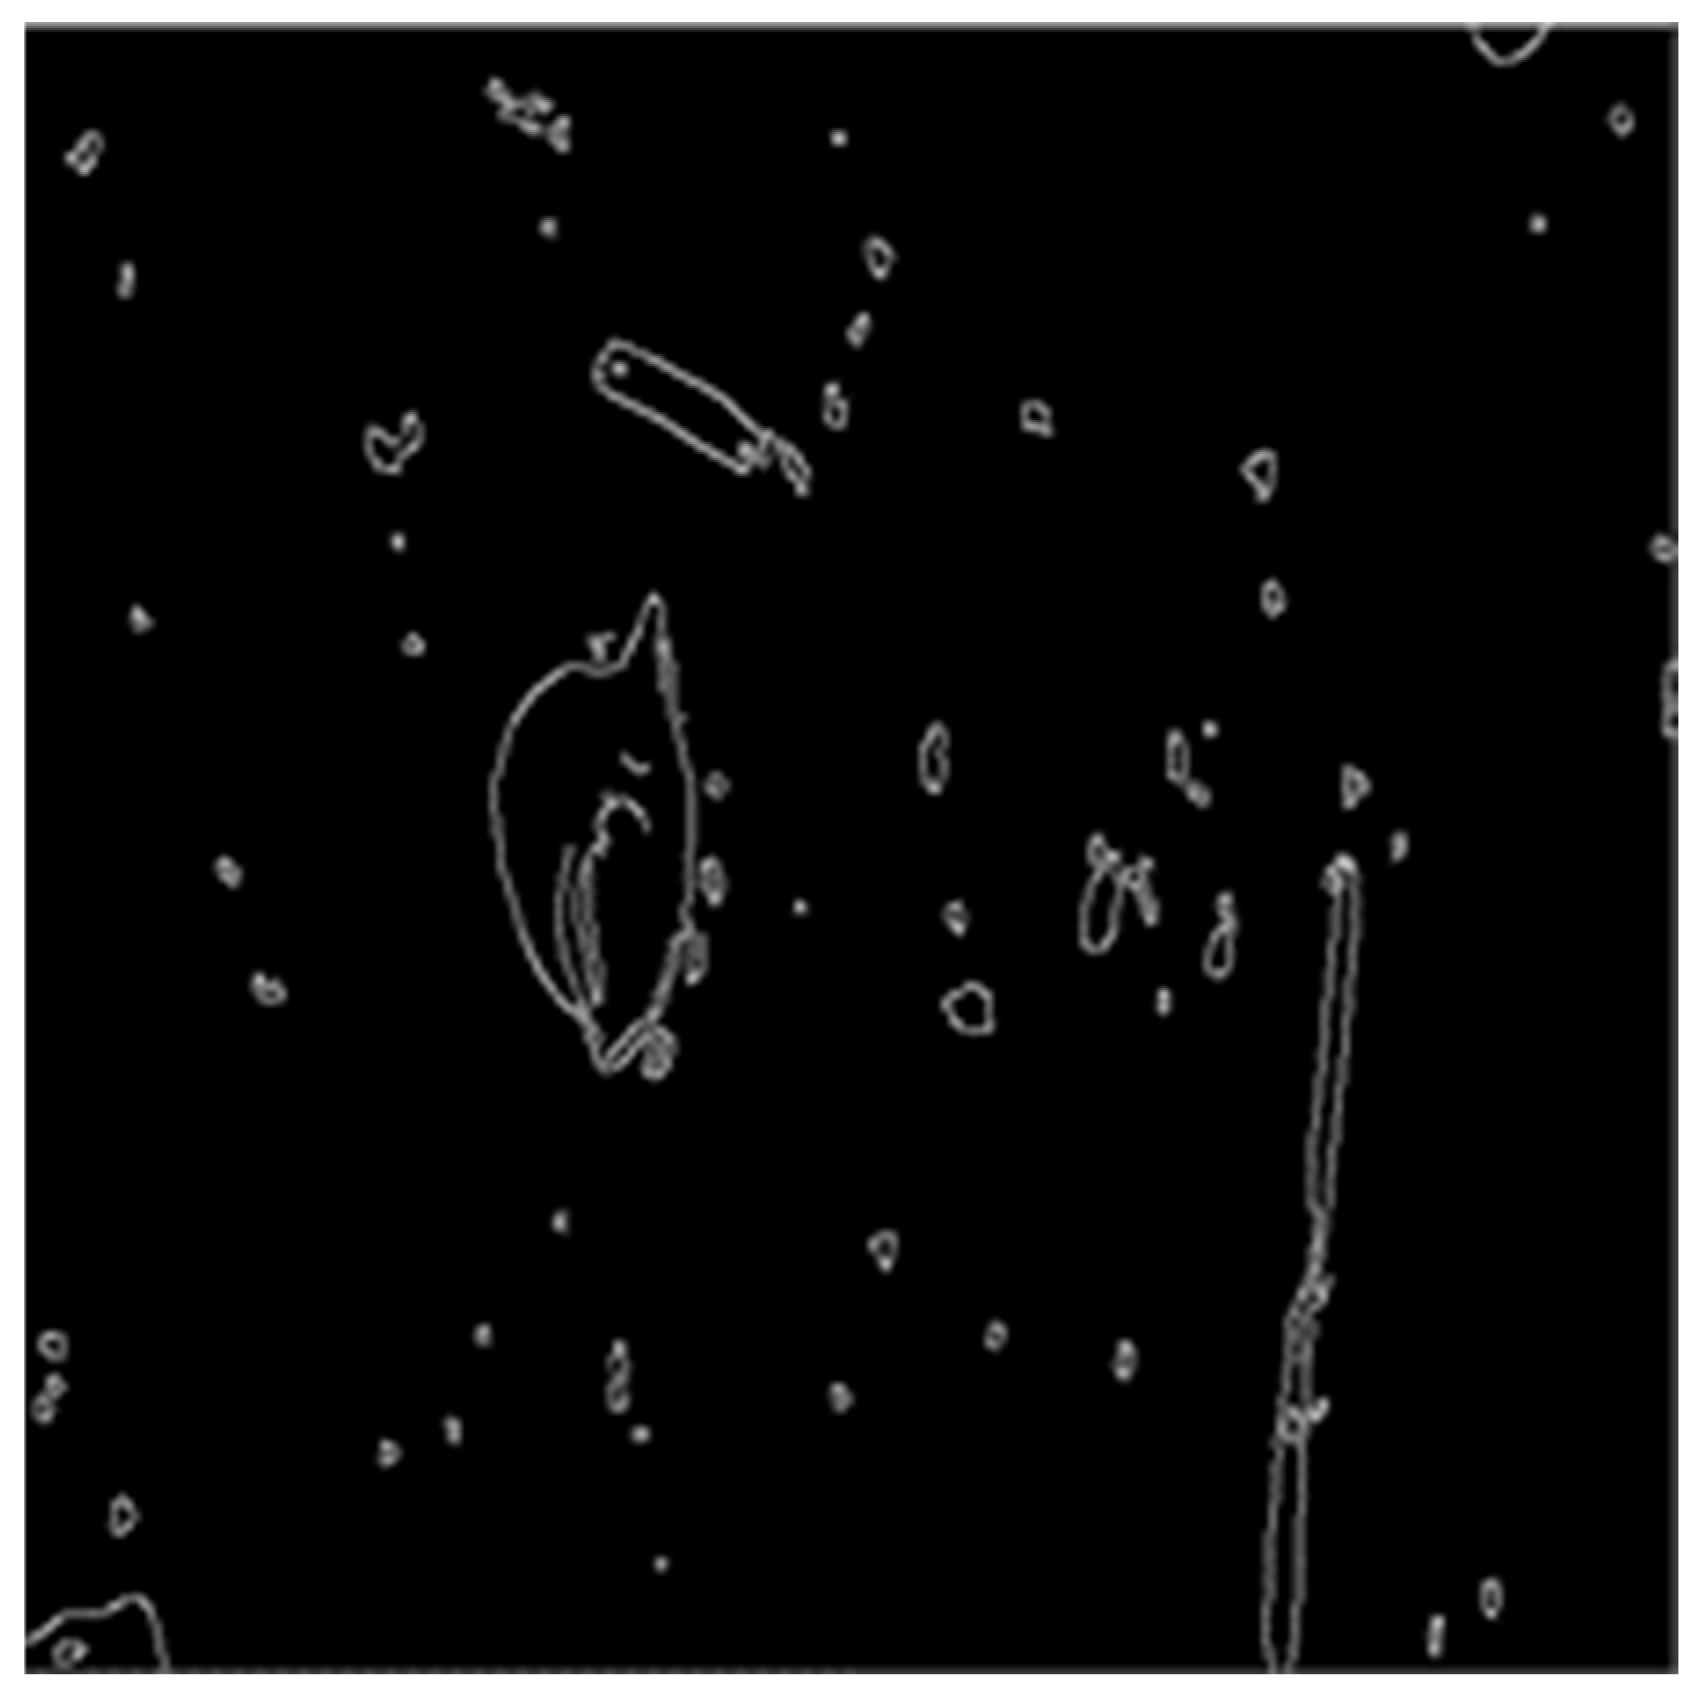
2.2.2. Traditional Canny Operator Edge Detection

In the process of impurity detection based on image information, the primary task was to segment impurities in the cotton images. Due to the large number and variety of cotton impurities in machine-picked seed cotton, the detection of the impurity rate of machine-picked seed cotton encountered great difficulties. Canny operator edge detection could better detect the contour information of impurities.
  • Smoothing images
The Canny algorithm selected an appropriate one-dimensional Gaussian function to smooth and denoise the image F   ( x ,   y ) according to rows and columns, respectively, which was equivalent to convolution of the image signals. The selected Gaussian function [30] was:
G ( x ) = 1 2 π σ e x 2 2 σ 2
where σ is the standard deviation of the Gaussian curve, which controlled the smoothness.
  • Calculate the magnitude and direction of the gradient
The gradient amplitude M ( x ,   y ) and gradient direction   H ( x ,   y ) of smoothed image I ( x ,   y ) were calculated by the finite difference of the first-order partial derivatives of 2 × 2 neighborhood; i.e. [30]:
M ( x , y ) = K x 2 ( x , y ) + K y 2 ( x , y )
H ( x , y ) = arctan ( K x ( x , y ) K y ( x , y ) )
f x = [ 0.5 0.5 0.5 0.5 ] , f y = [ 0.5 0.5 0.5 0.5 ]

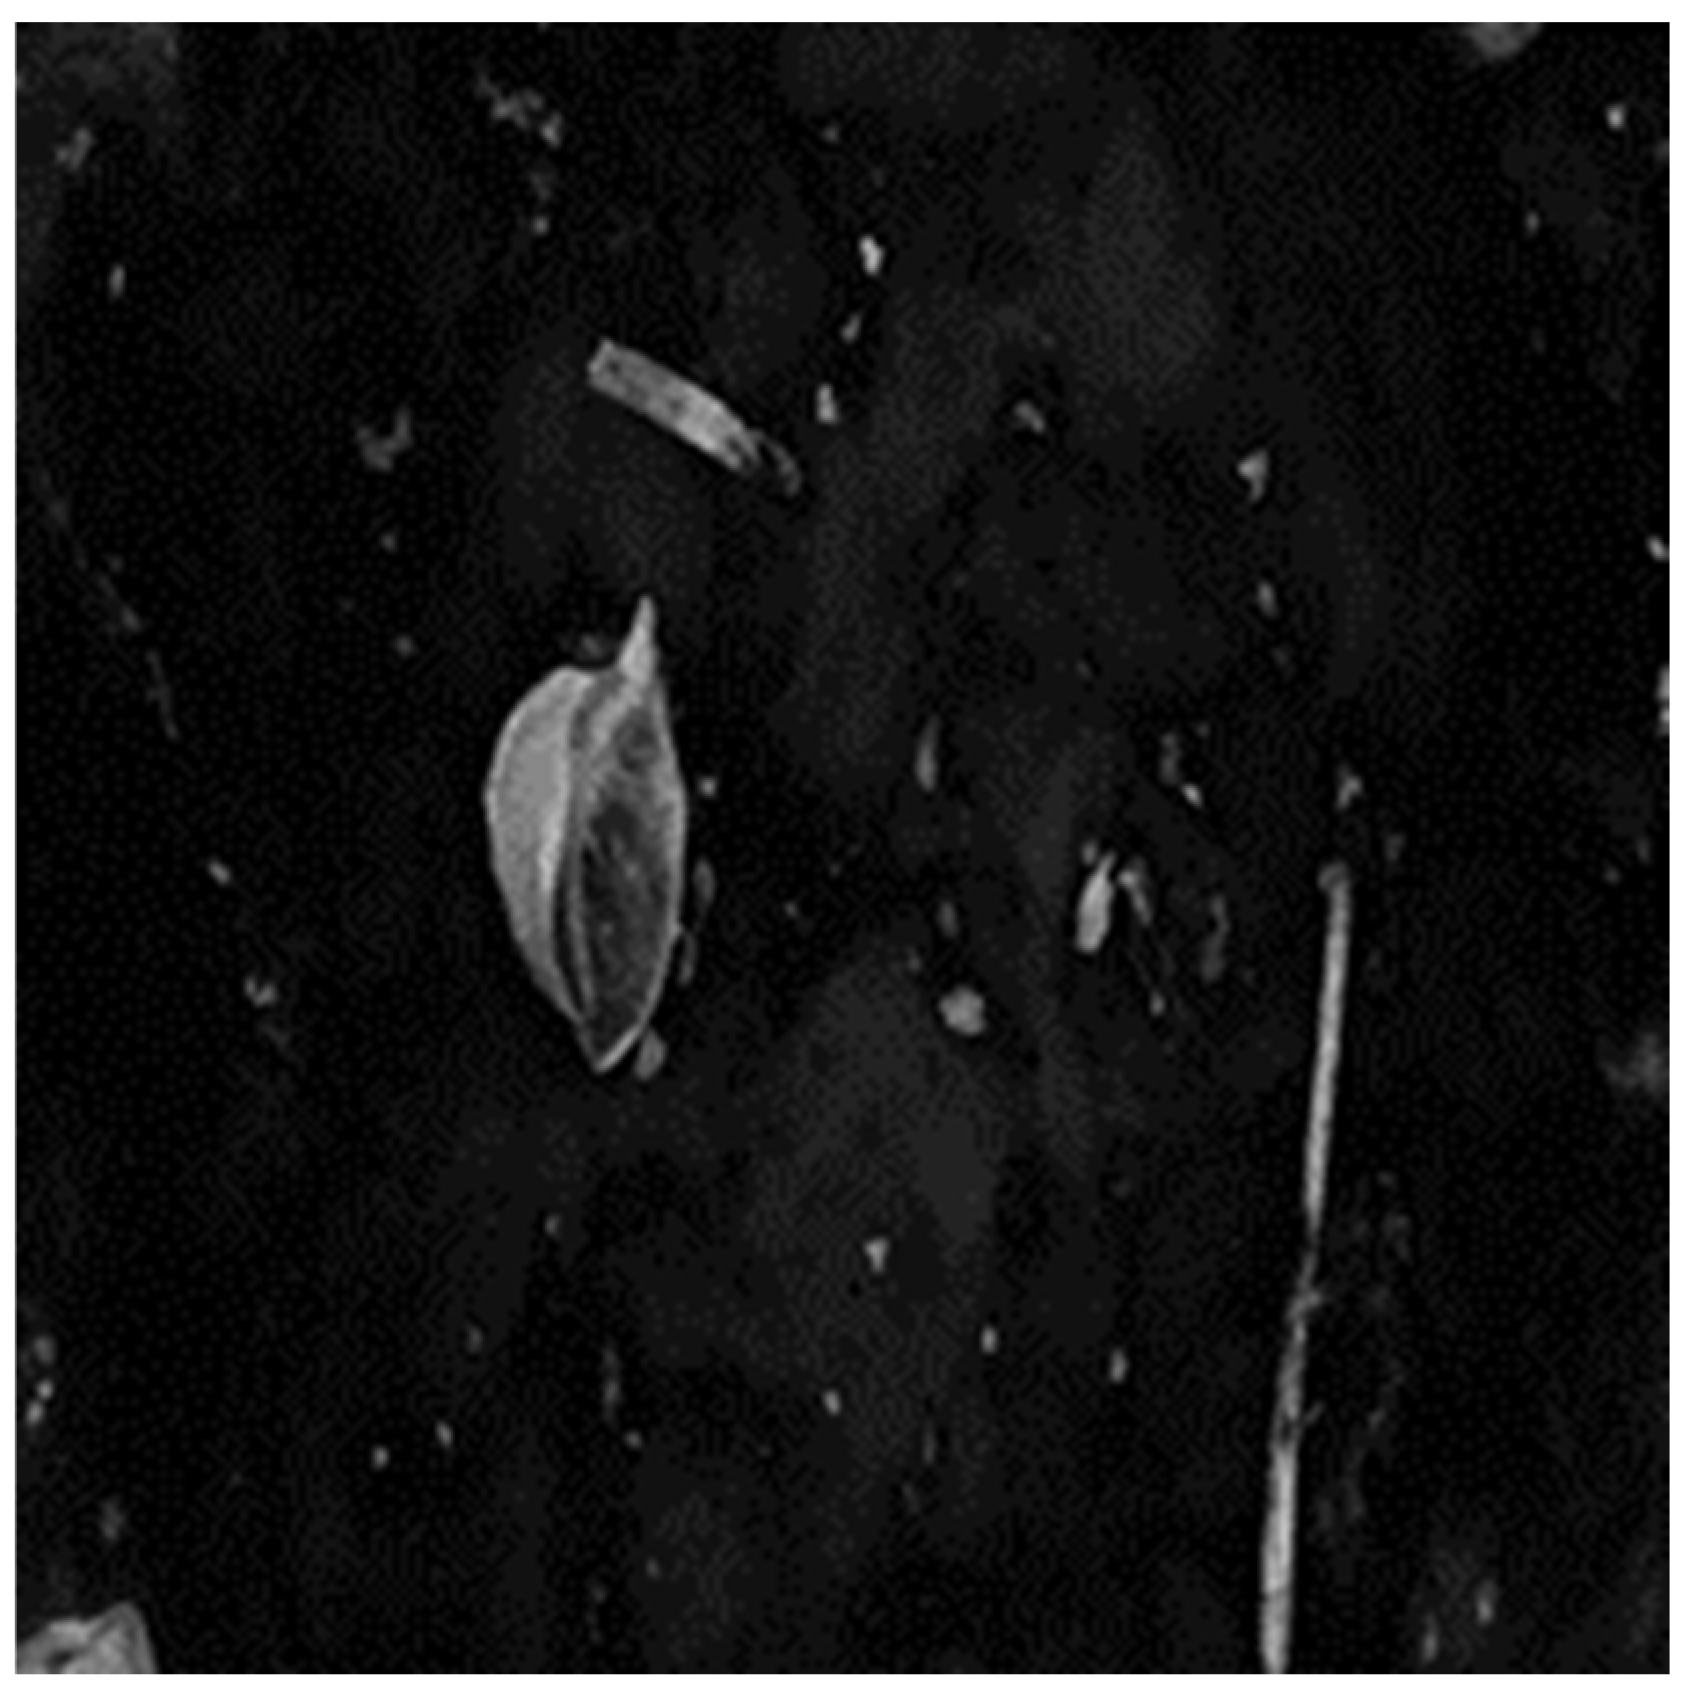
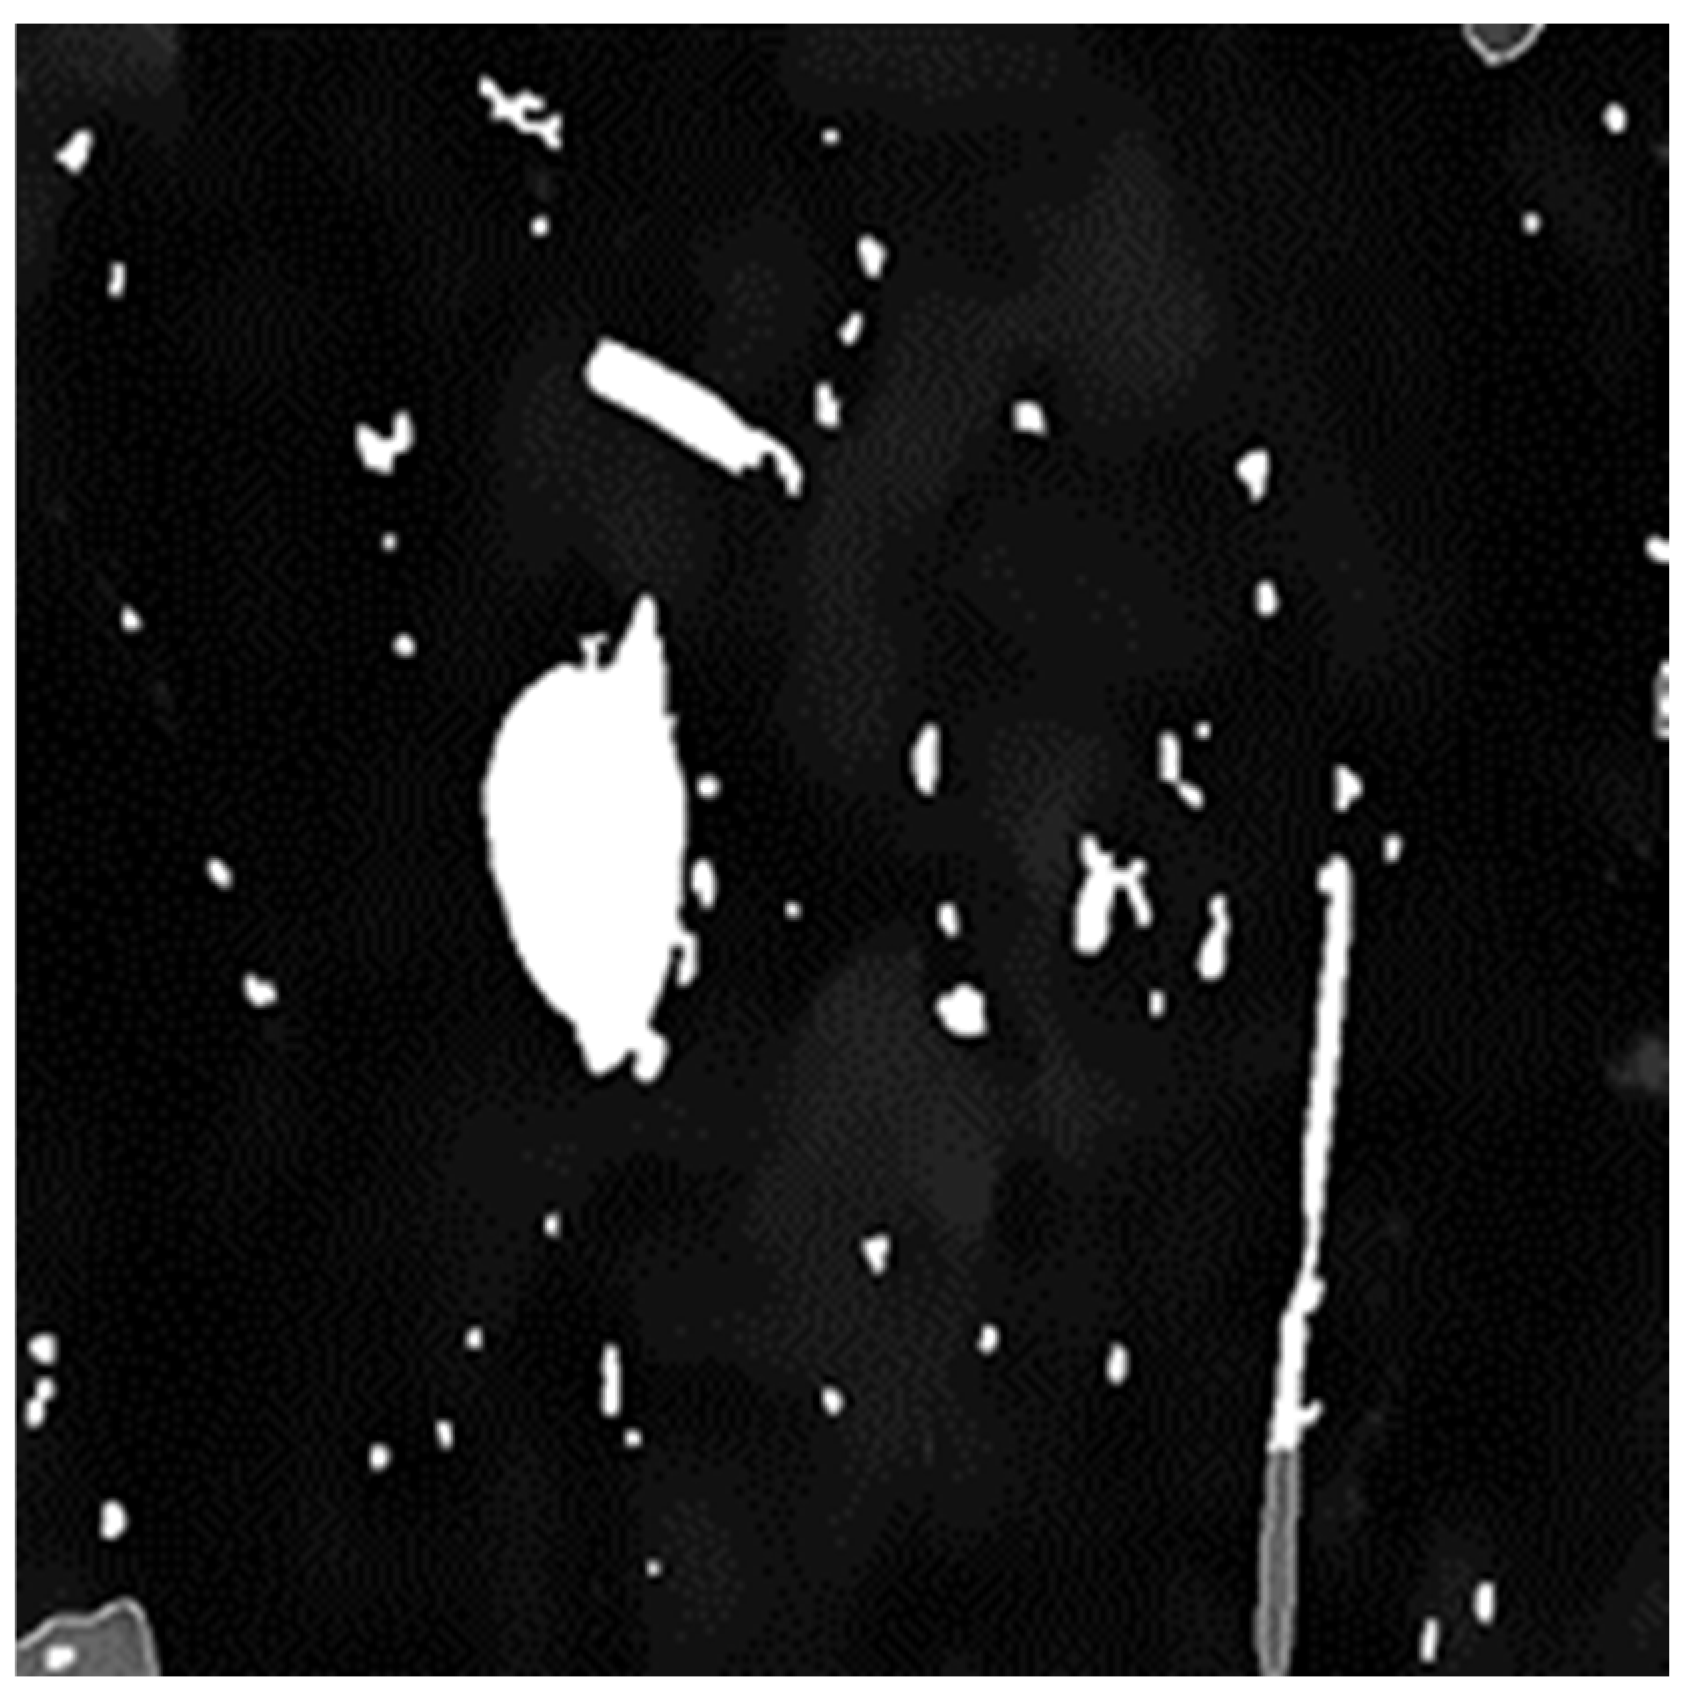
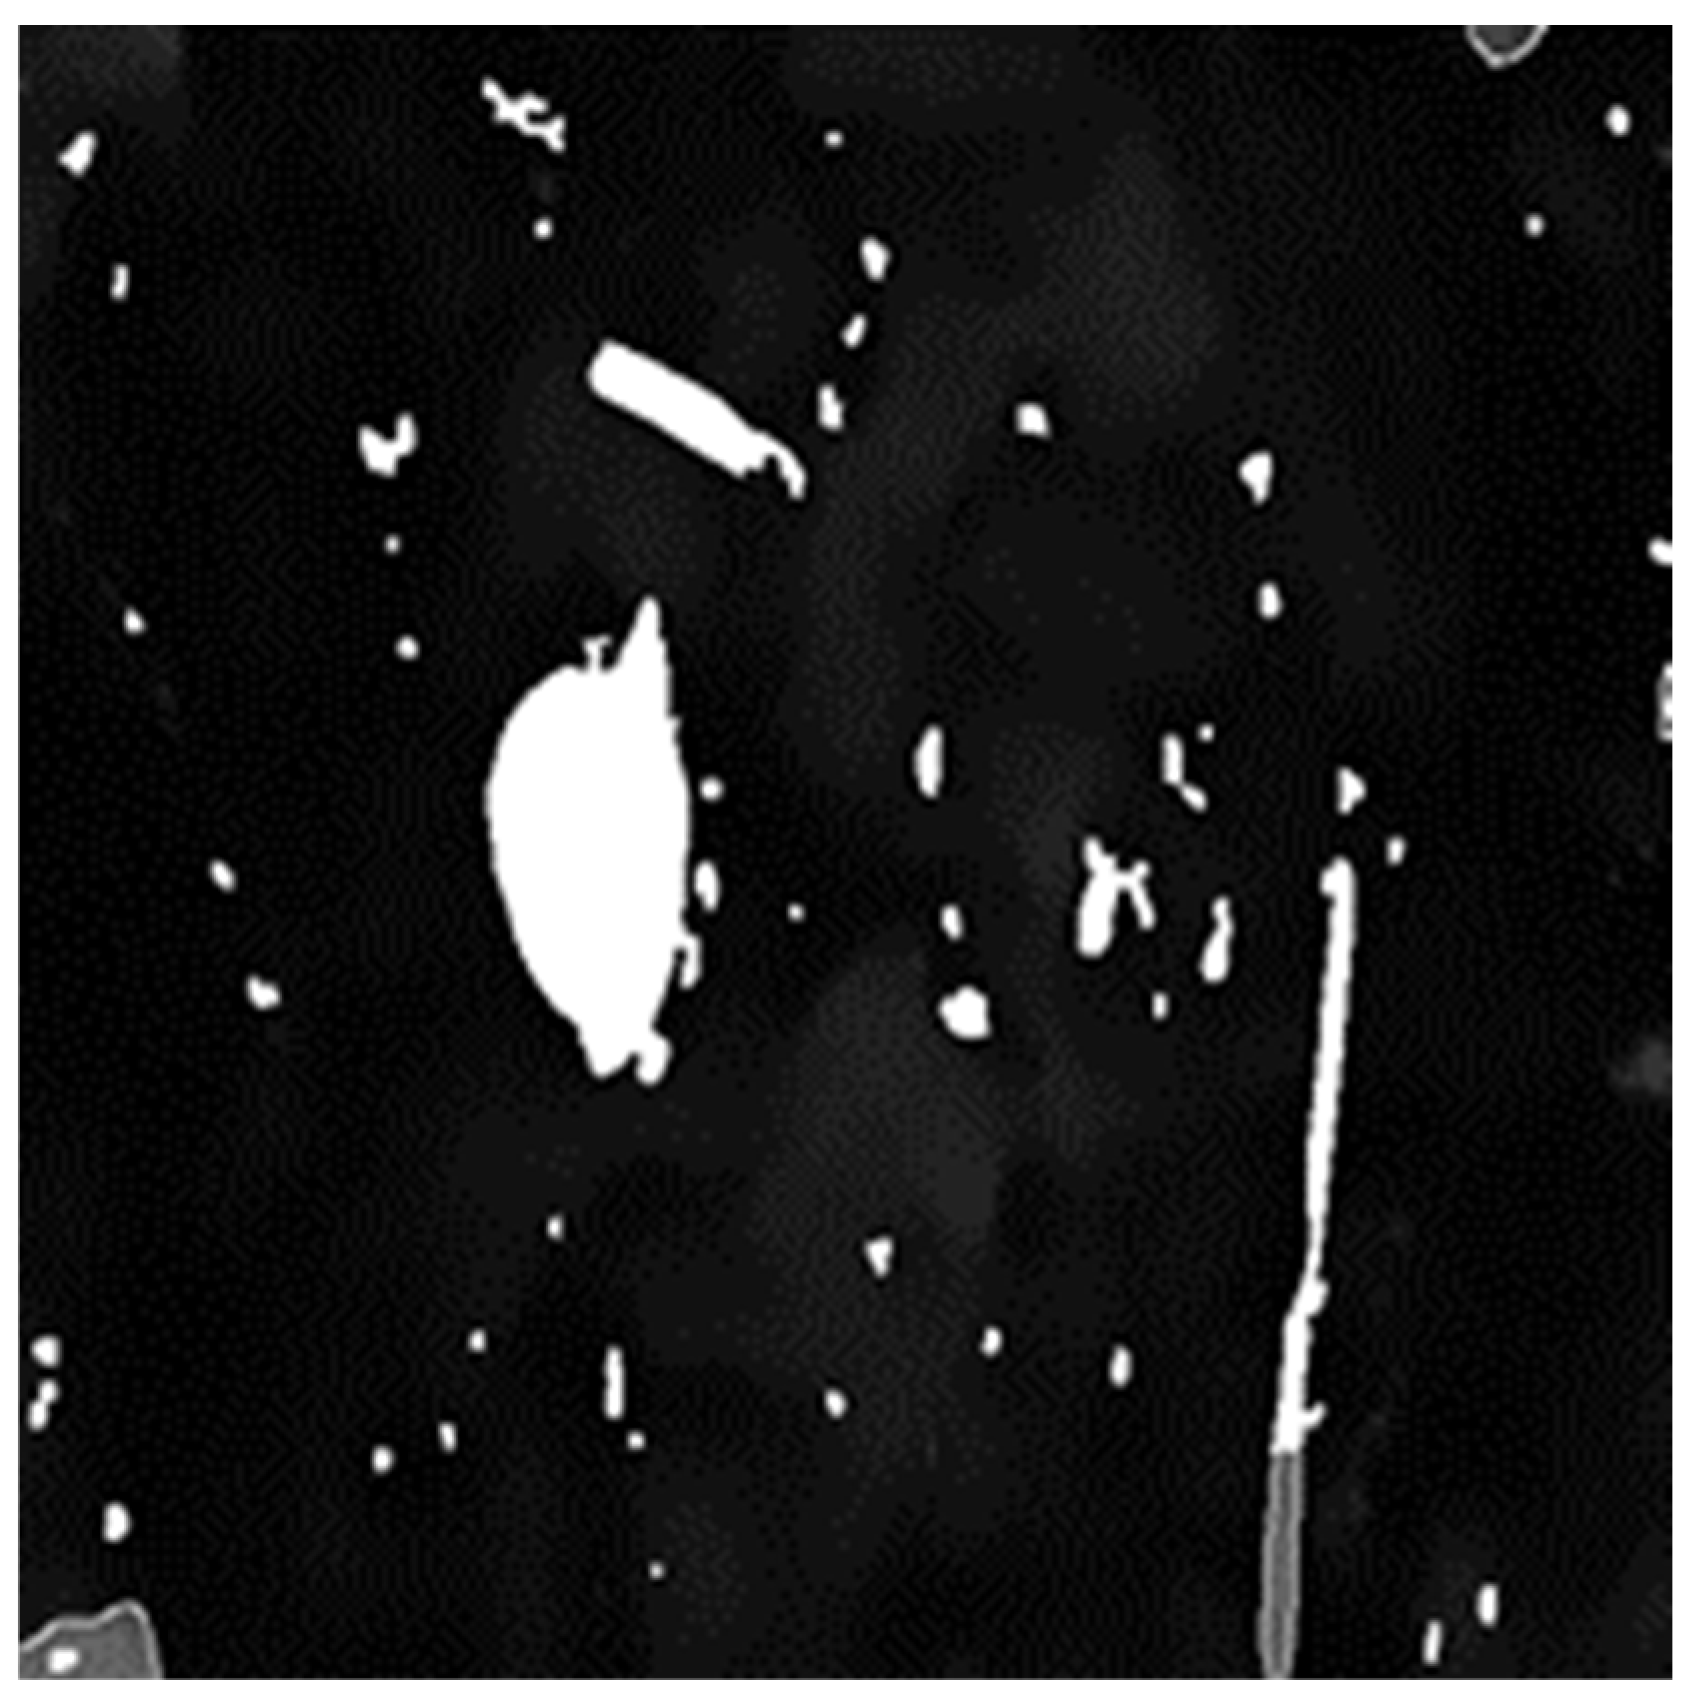
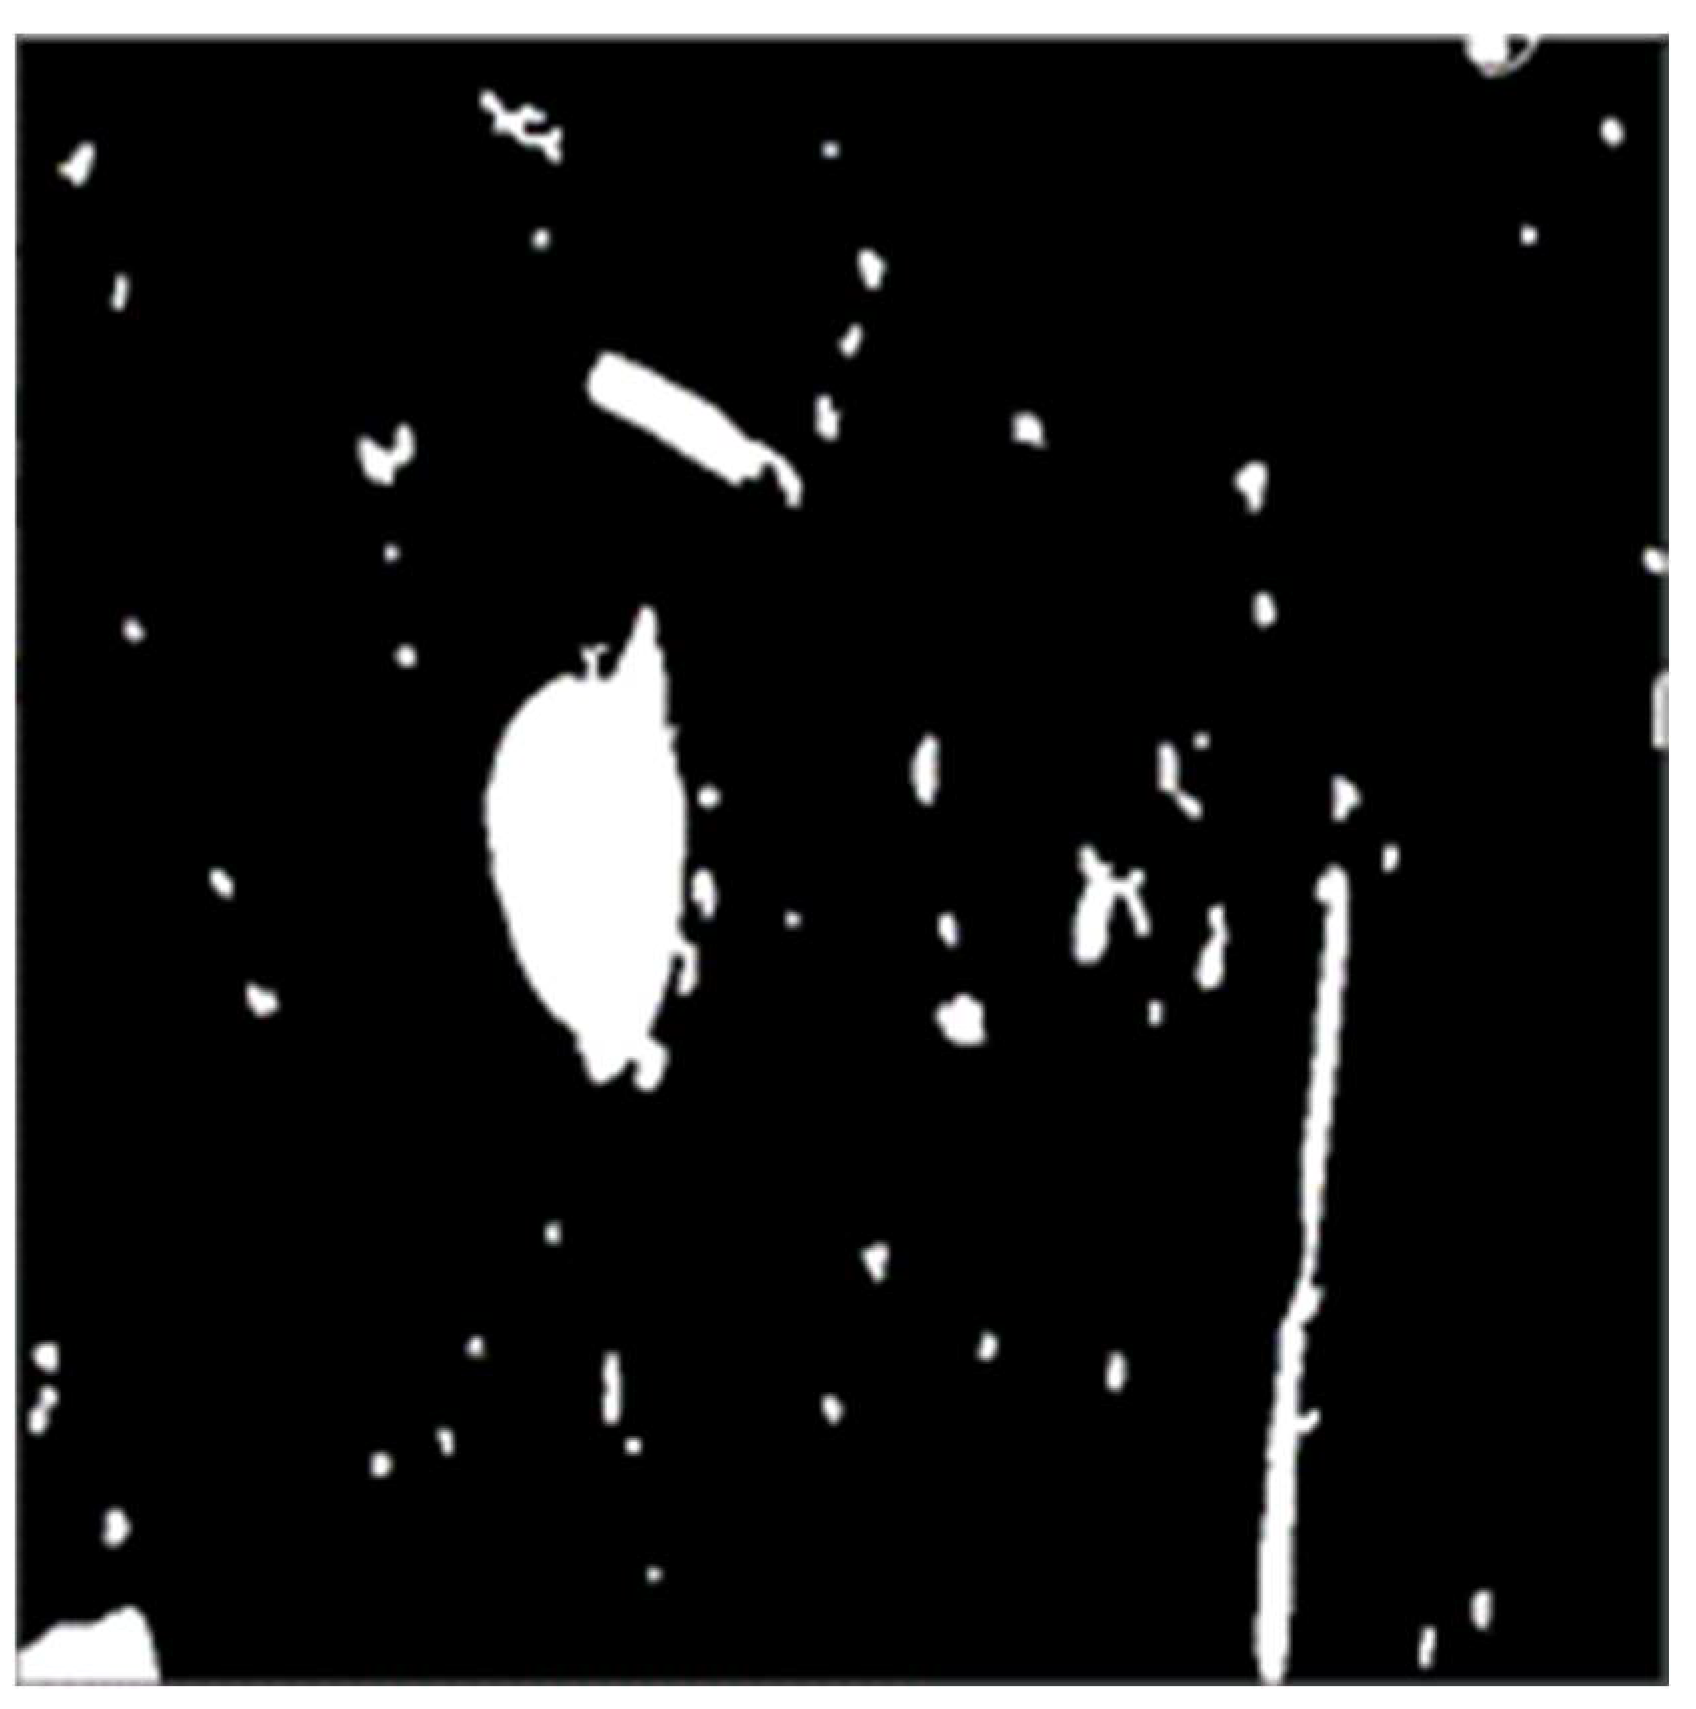
2.2.3. Dark Impurity Segmentation

  • Nonmaximum suppression of gradient amplitude was performed
The purpose of maximum inhibition was to find the I   ( x ,   y ) in all of the possible edge points. The basic idea was to use 3 × 3 neighborhood effects on a gradient amplitude array   M   ( x ,   y ) of all points, if the neighborhood center gradient amplitude   M   ( x ,   y ) of the two adjacent points along the gradient direction amplitude was large, it would be the current center of the neighborhood discriminant for possible edge points, Otherwise, M ( x ,   y ) was assigned as zero and identified as a nonedge point.
  • Double threshold method to detect and connect edges
A dual-threshold algorithm was used to segment the nonmaximum-suppressed images with high and low thresholds to obtain two threshold edge images T 1 [ i ,   j ] and T 2 [ i ,   J ] , respectively. Since the image T 1 [ i ,   j ] had a high threshold value, it contained almost no false edges, but T 1 [ i ,   j ] may have had a break in the contour. Therefore, the double-threshold algorithm connected the edges into contours in T1[i, j]. When the contour endpoint was reached, the algorithm looked for the edges that could be connected to the contour in the eight-neighborhood position of the edge image T 2 [ i ,   j ] of the low-threshold value. Thus, the recursive tracking algorithm continuously collected edges in T 2 [ i ,   j ] until all gaps in T 1 [ i ,   j ] were joined.
  • Defect analysis of traditional Canny operator image edge-detection algorithm
In the image edge detection, image denoising was the first step, and the traditional Canny operator used a Gaussian filter to remove noise. The parameter σ, which controlled the degree of smoothness, was manually set. The larger the parameter σ, the narrower the frequency band became; the high frequency signal is well suppressed, and the occurrence of false edge points may be avoided. Because the signal frequency at the edge was also high, some details would be lost, resulting in unclear image edges. The smaller the σ setting, the wider the frequency band became, preserving edge details but not achieving the desired noise reduction [31]. In practice, it is difficult to find an accurate value for σ, so it presents some limitations in image edge detection.

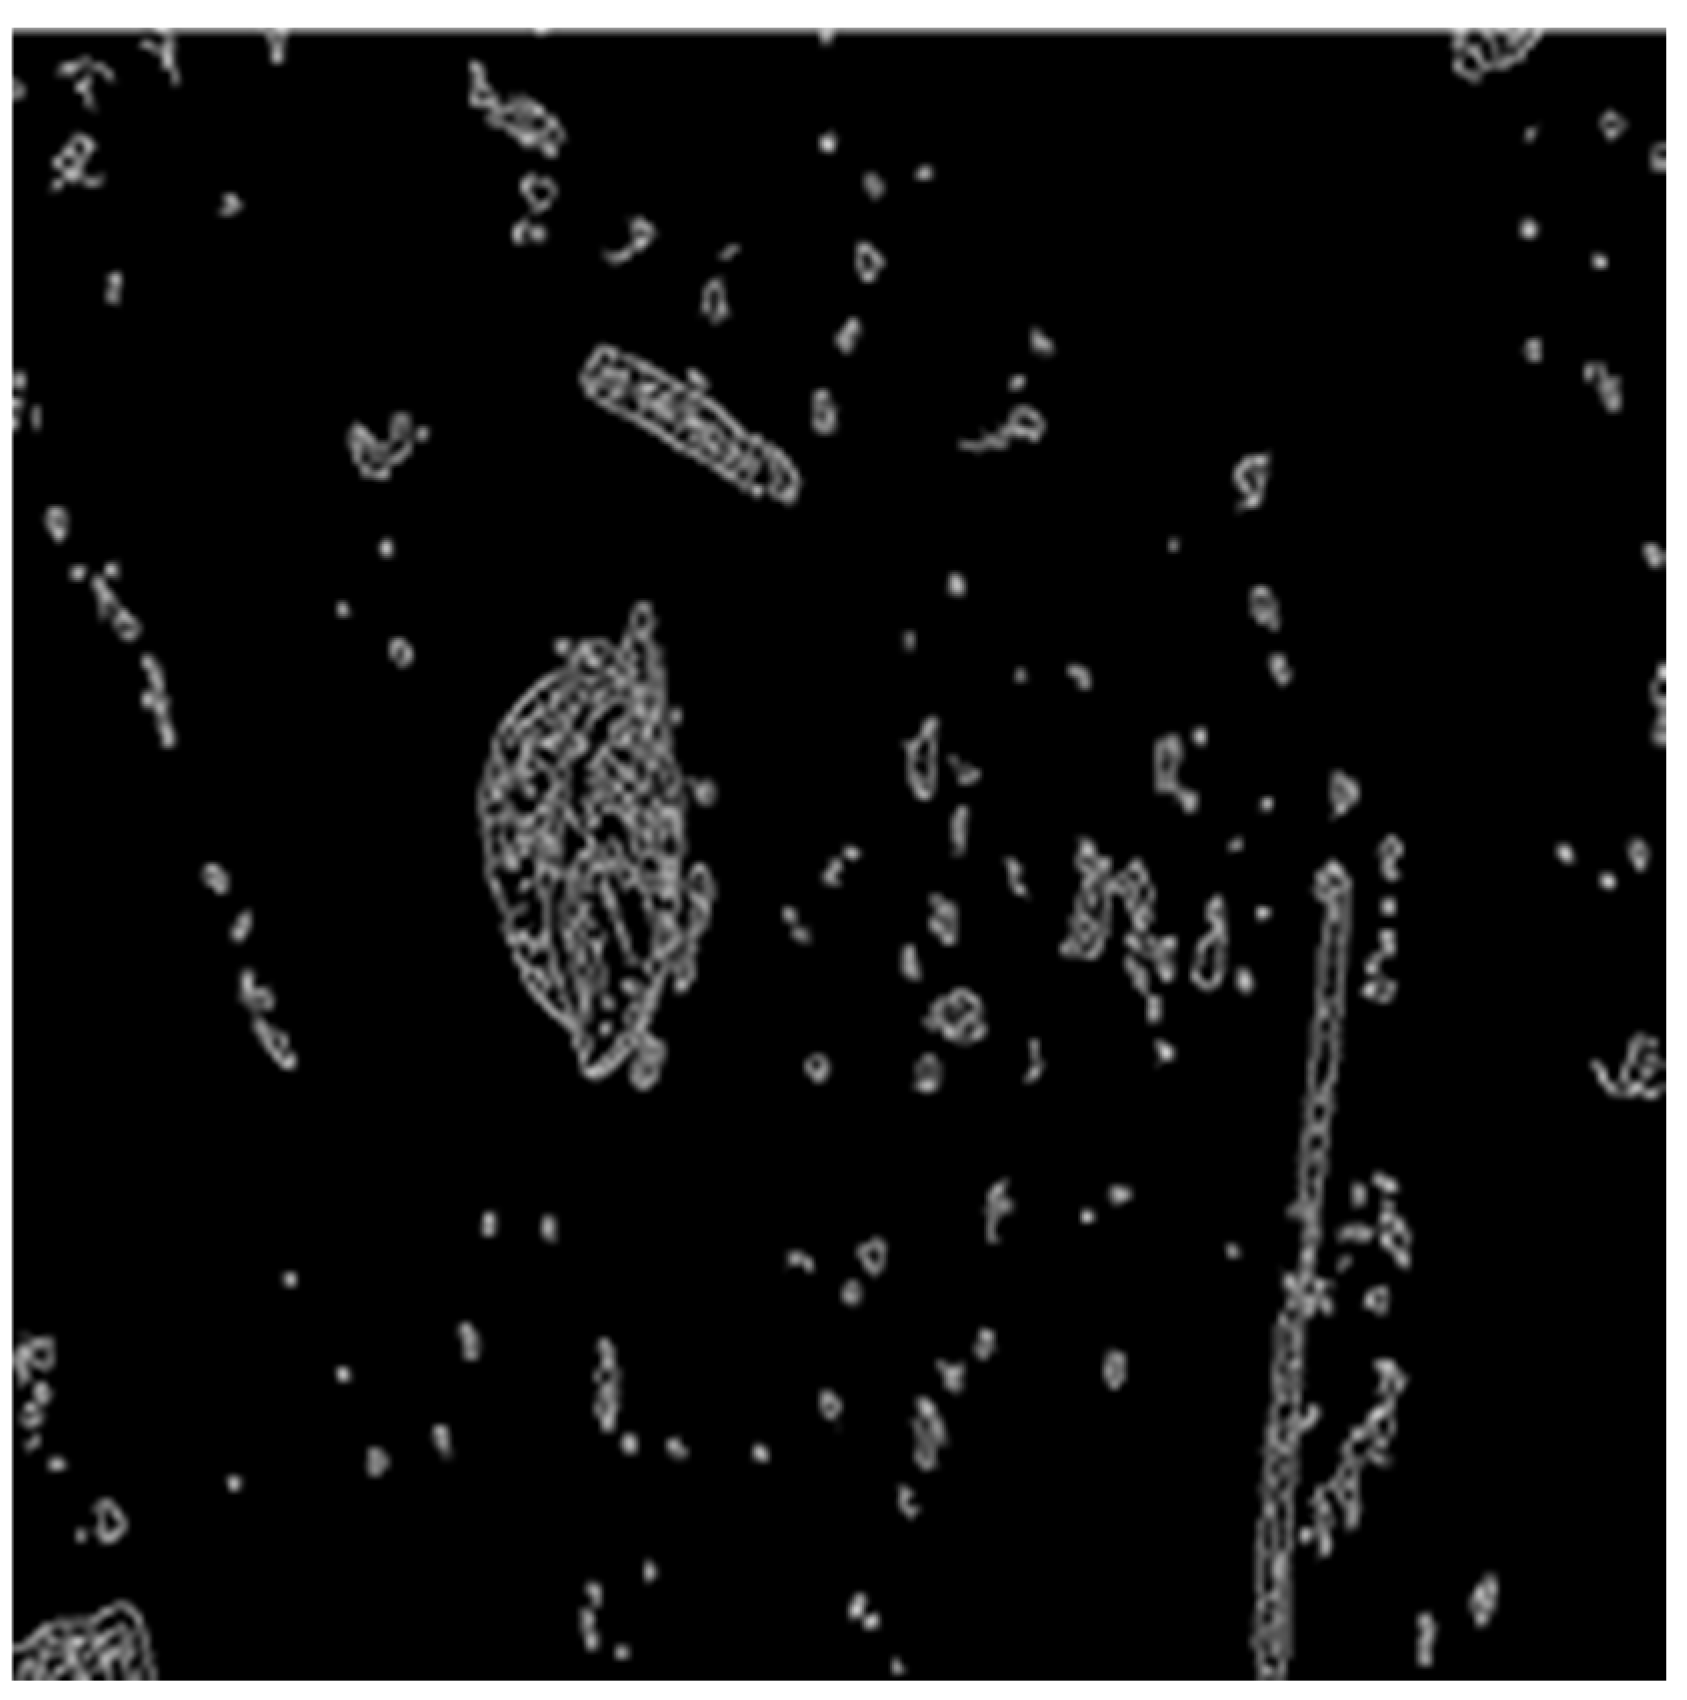
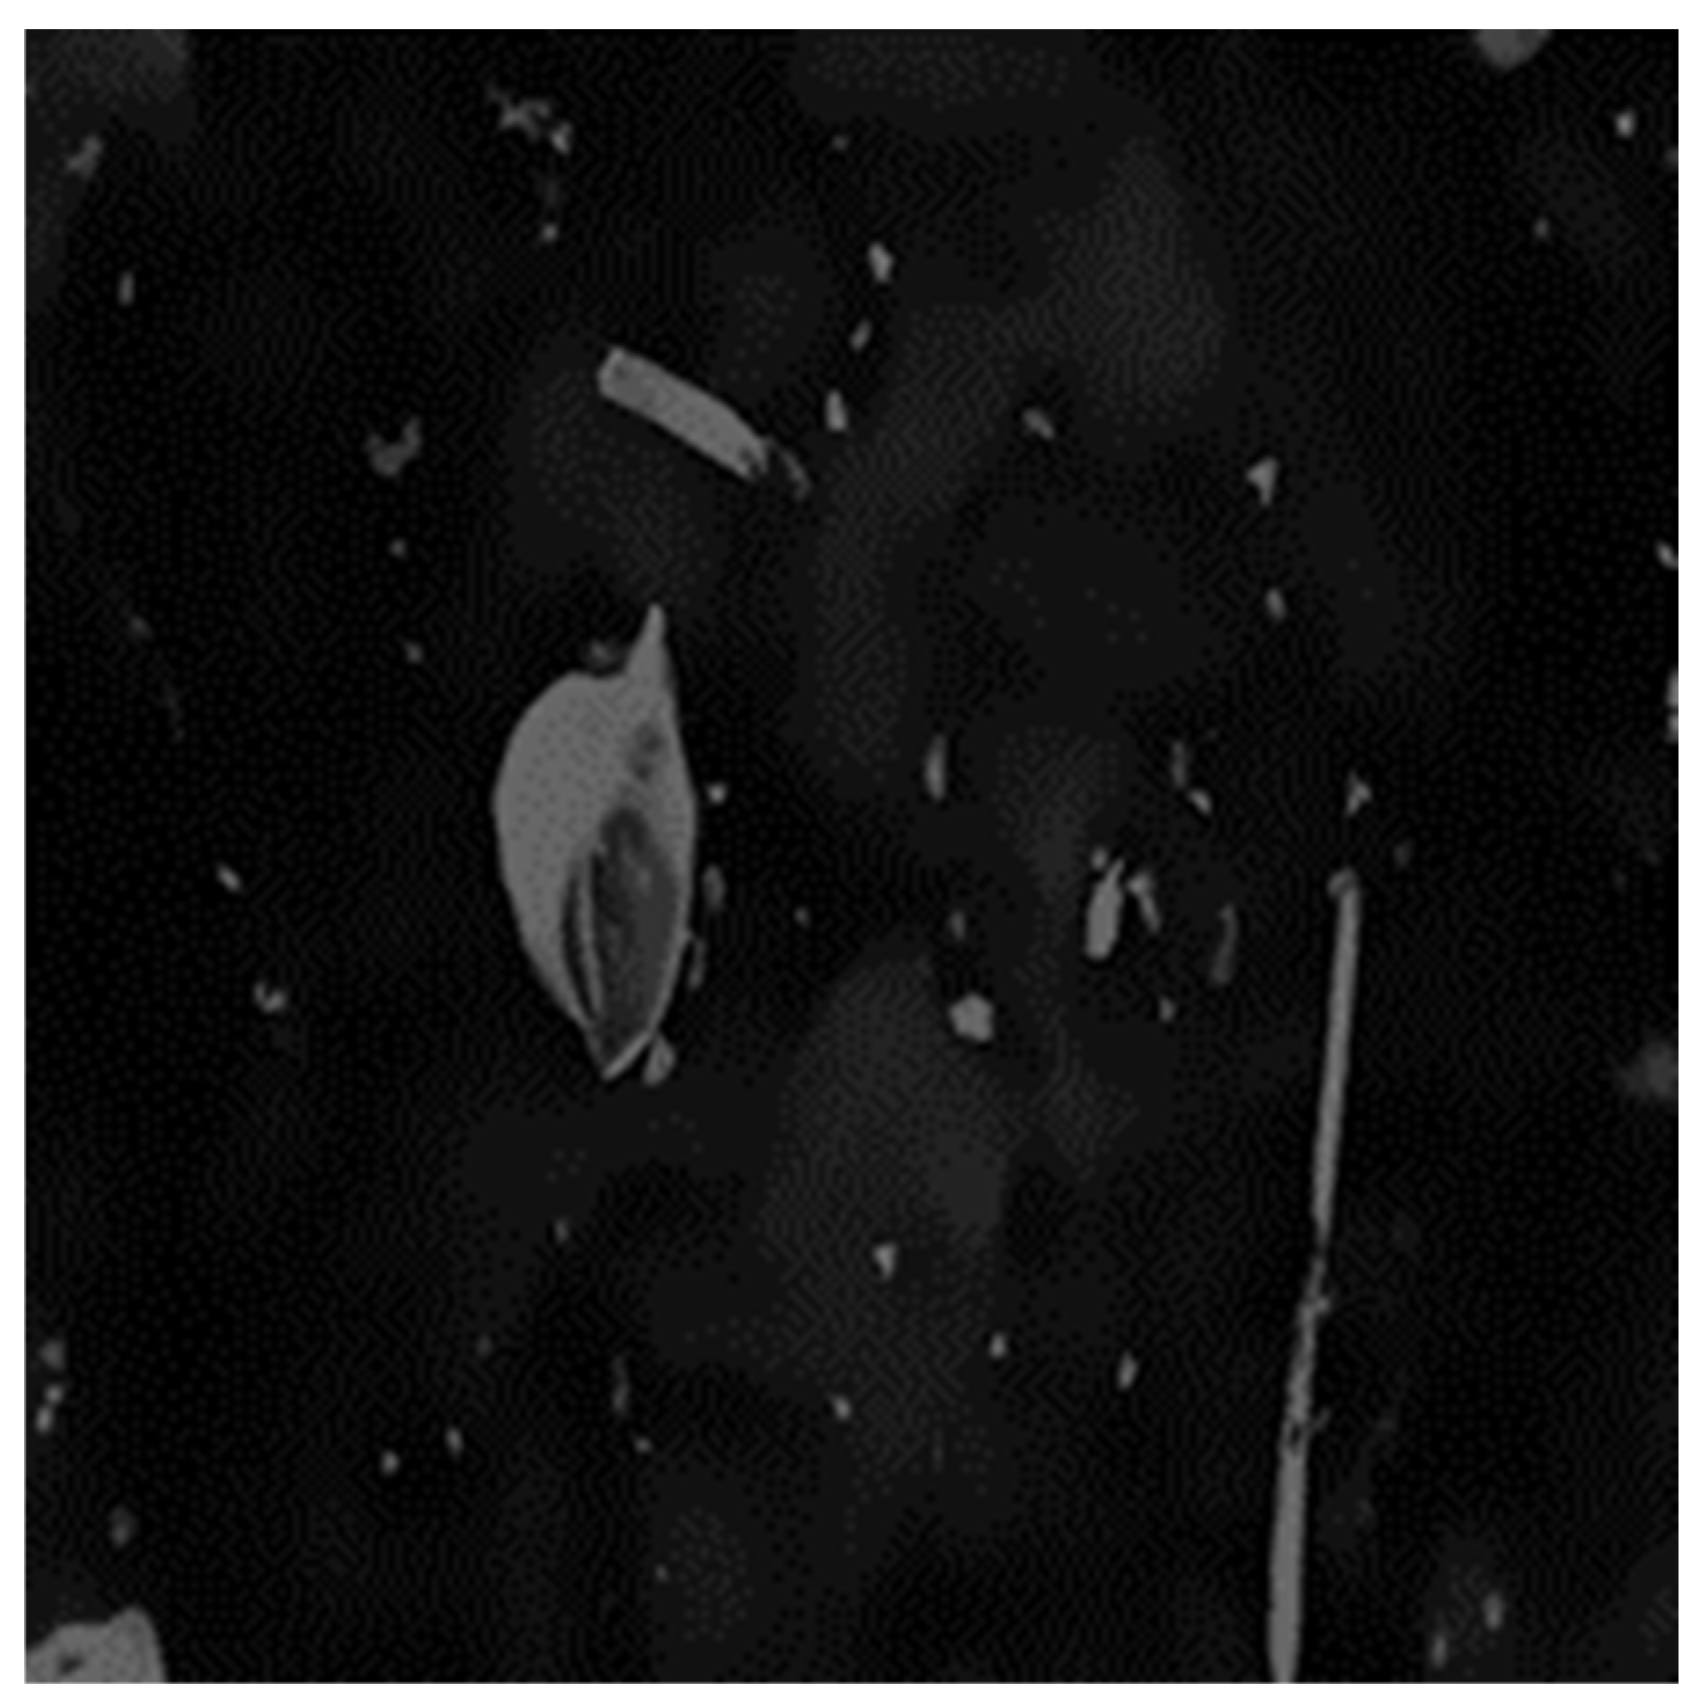
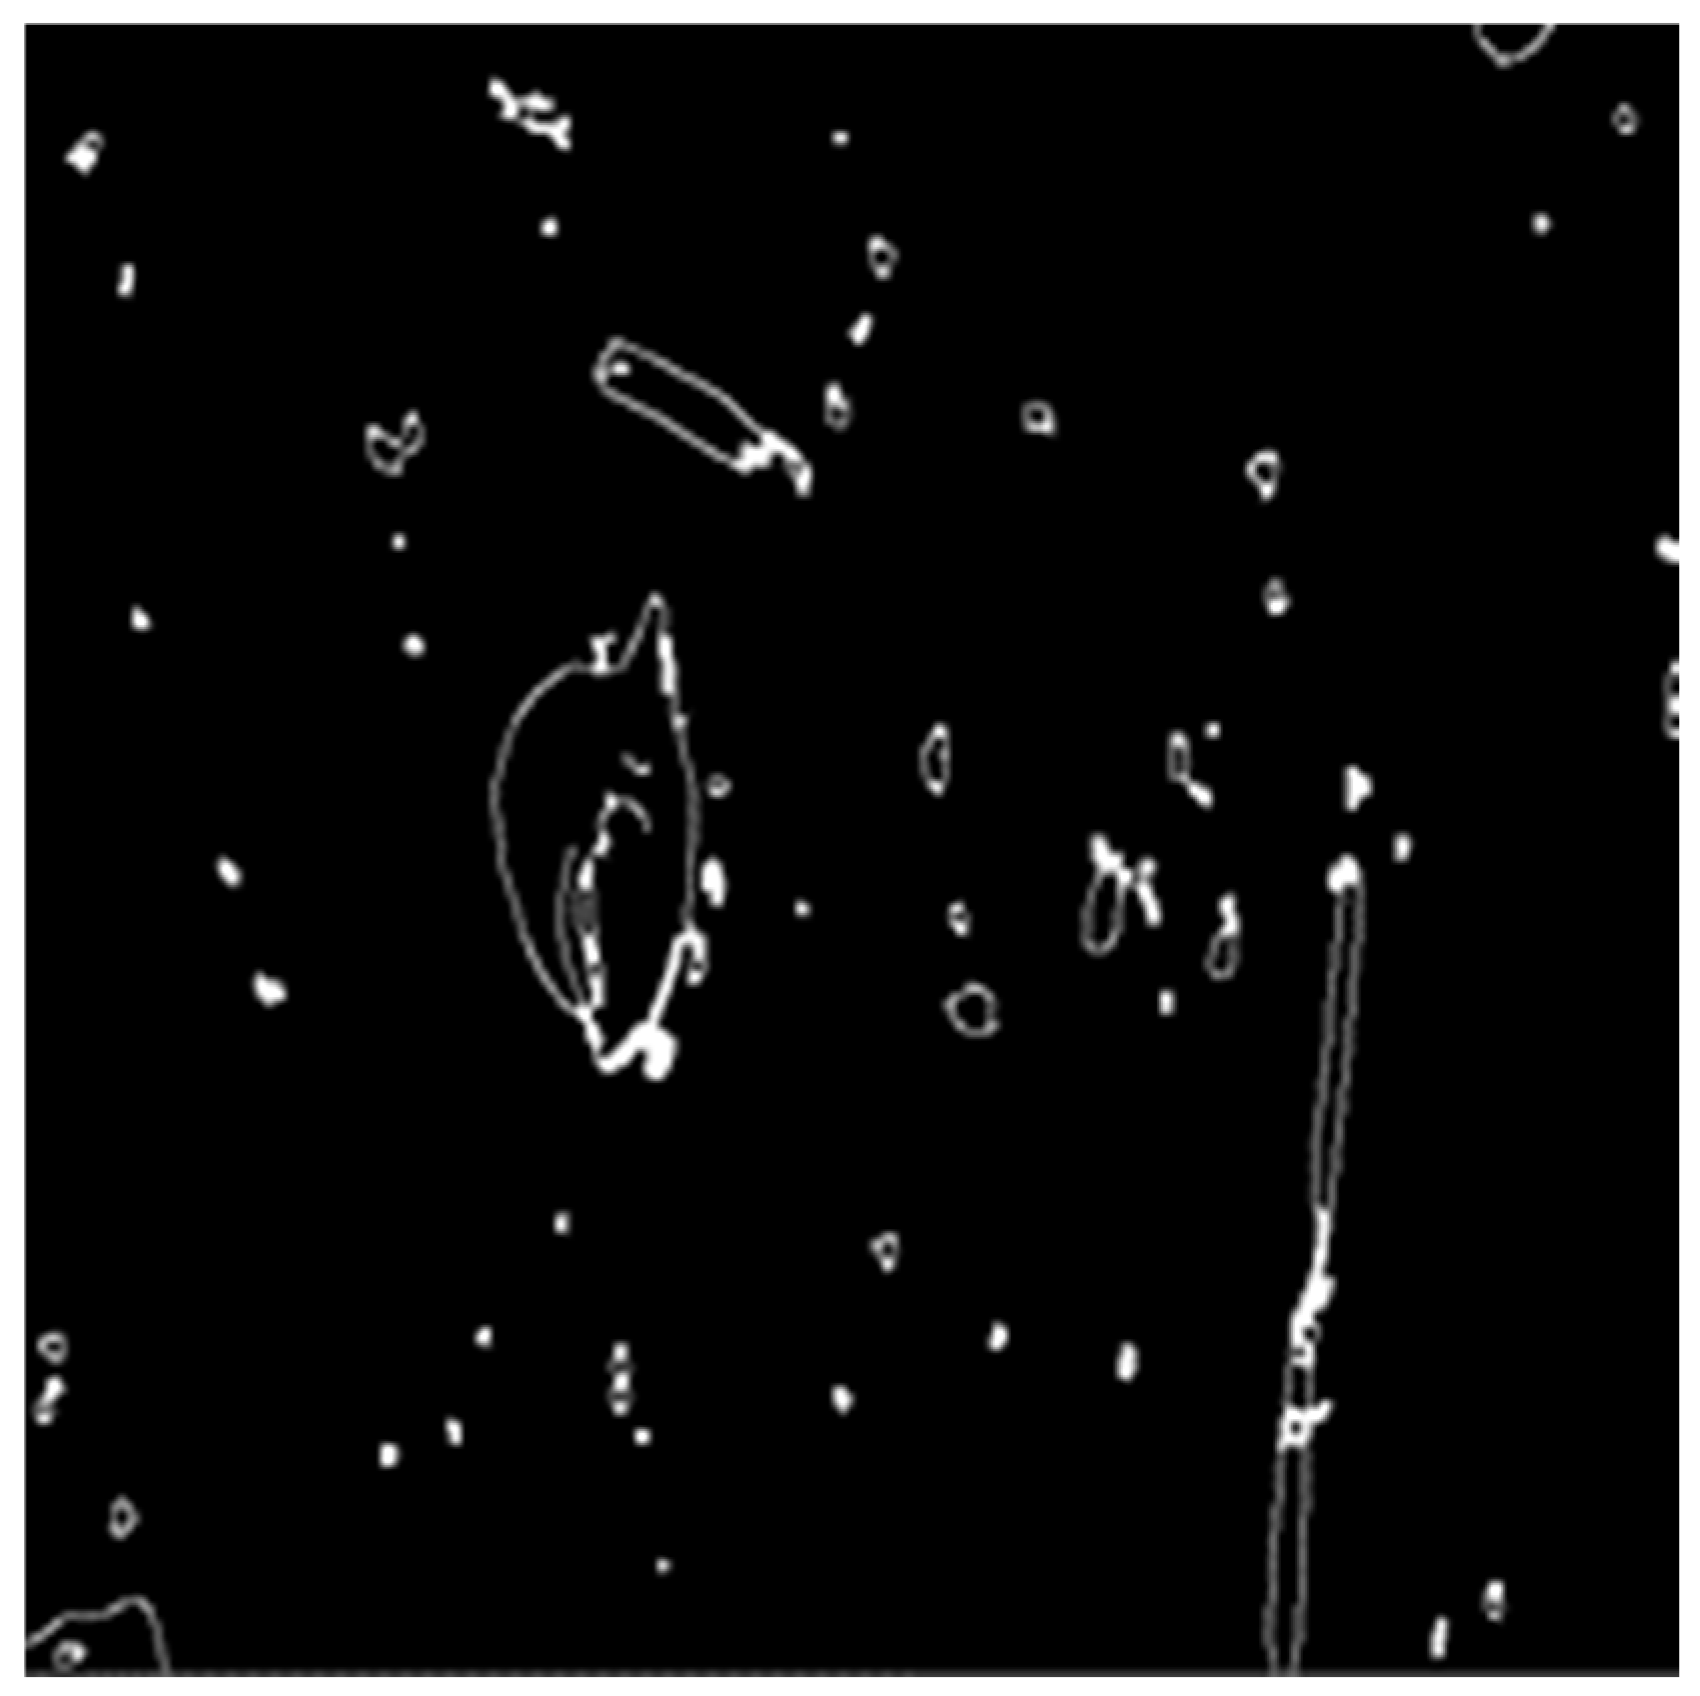
2.2.4. Improved Canny Operator Edge Detection

Because cotton fibers are thin and intertwined with impurities, in the process of image collection of machine-picked seed cotton, even though impurities could be clearly distinguished through color-space conversion, it was still easy to produce a lot of noise, as shown in Figure 5. Due to the interference of noise points, the traditional Canny operator had poor edge detection effect and could not achieve effective segmentation. The processing effect is shown in Figure 6.
Aiming at the edge-detection effect of the Canny operator in machine-picked seed cotton images, this study used mean filtering and nonlocal average denoising to replace Gaussian filtering. This could reduce noise and smooth the impurity area, so as to better realize impurity edge detection.
  • Mean filtering
Mean filtering is also called linear filtering, and the main method adopted was neighborhood averaging. The basic principle of linear filtering is an average instead of the original image for each pixel value, and involves the current pixel I (x,y) and choosing a template; this template was composed of the neighbor number of pixels, strove for the average of all pixels in the template, and then gave the average of the current pixel I (x,y) as a grayscale image at that point in g (x,y); namely:
g ( x , y ) =   f ( x , y ) m
where m is the total number of pixels, including the current pixel in the template.
Because the noise in the machine-picked seed cotton image was a fog noise with a gray value between the background and impurities, the mean filter could be used to distinguish noise, impurities, and background, and the edge details would not be lost due to the high gray value of impurities in the image. An image processed by mean filtering is shown in Figure 7.
  • Nonlocal mean denoising
Buades et al. [32] proposed the nonlocal means (NLM) algorithm by taking advantage of the fact that natural images contain many similar structures. The basic idea of the algorithm is to search the corresponding similar blocks in the global scope for the image blocks where the denoised pixels are located, and to find a weighted average for the similar structures to reduce the random noise, so as to achieve the denoising. The NLM algorithm is superior to many common denoising algorithms.
With noise image f = { f ( i ) | i I } , any of the gray levels of pixels to the I place by filtering f ^ ( i ) were determined as follows:
f ^ ( i ) = j I w ( i , j ) f ( i ) w ( i , j ) = 1 Z ( i ) e | | f ( N i ) f ( N j ) | | 2 , 2 / h 2
where the weight w ( i , j ) satisfies 0 w ( i , j ) 1 and j w ( i , j ) = 1 ; | | · | | 2 , 2 to measure pixels i and j of the similar degree of Gaussian-weighted Euclidean distance; a is the standard deviation of the Gaussian kernel, a >0; h is the parameter controlling the attenuation degree; and N k is the square neighborhood whose center is located at pixel K. The regularization constant Z ( i ) is:
Z ( i ) = j I e | | f ( N i ) f ( N j ) | | 2 , 2 / h 2
To avoid overweighting, when i = j , the weight w ( i , j ) is:
w ( i , j ) = m a x ( w ( i , j ) ) , i j
The NLM algorithm was used to denoise the machine-picked seed cotton images after mean filtering, and as shown in Figure 8, the impurity area became smooth. Using a Canny operator for edge detection could effectively identify the edge information for impurities, as shown in Figure 9. Compared with the detection results of a traditional Canny operator (as shown in Figure 6), it can be seen that the contour was more obvious, and many interference factors were reduced.
  • Improved gradient amplitude calculation
The original Canny operator used a 2 × 2 domain first-order finite-difference operation to calculate the gradient amplitude of the images. Only the gradient values in the horizontal and vertical directions were considered, so it was susceptible to interference from external noise. Therefore, this study added 45° and 135° directions to calculate the gradient amplitude based on an isotropic Sobel operator. The gradient template for the four directions in the 3 × 3 field is shown in the formulas below:
H x = [ 1 2 1 0 0 0 1 2 1 ]           H y = [ 1 0 1 2 0 2 1 0 1 ]
H 45 ° = [ 3 1 0 1 0 1 0 1 3 ]           H 135 ° = [ 0 1 3 1 0 1 3 1 0 ]
The convolution operation was performed on the gradient template in the horizontal direction, vertical direction, 45° direction, and 135° direction using the filtered image to obtain the gradient components M x , M y , M 45 ° , and M 135 ° , respectively, in the four directions. Finally, the gradient amplitude M was obtained as follows:
M = M x 2 + M y 2 + M 45 ° 2 + M 135 ° 2
The total gradient components in the four directions were M x and M y . in the horizontal and vertical directions, respectively, as shown below:
M x = M x + 2 2 M 45 ° 2 2 M 135 °
M y = M y + 2 2 M 45 ° 2 2 M 135 °
The gradient direction δ was obtained from M x and M y , as shown in the following formula:
δ = a r c t a n ( M y 2 M x 2 )

2.2.5. Determination Algorithm of Intersection between Impurities and Image Edge

In the process of edge detection, all that was detected were the edges of impurities. Therefore, the impurity region could be obtained by filling the area enclosed by the edges. However, some edges were still unclosed after edge detection, so it was necessary to perform a morphological closure to form the closed region, as shown in Figure 10. It can be seen in Figure 11 that there were still some unfilled areas in the filled image. An analysis showed that the reason was that the impurity region intersected with the image edge and the impurity edge line was not closed, so the hole filling could not be carried out.
In order to realize the automation of the algorithm, the determination algorithm for the intersection between impurities and the image edge was set as follows:
K = { ( 0 , : ) , ( m a x c , : ) , ( : , 0 ) , ( : , m a x l ) }
f ( k ) = { y e s ,   i f   g ( k ) = 255 n o ,   o t h e r w i s e   k K
where K represents the set of coordinates of the outermost pixels of the image; maxc represents the maximum number of lines of the image; maxl represents the maximum number of columns of the image; The ‘:’ represents all values from 0 to the maxi-mum value of the domain, and g(k) represents the gray value of pixel point K.
First, the gray value of the outermost pixel point of the image after filling the hole was traversed. If there was a point with a gray value of 255, it was judged that the impurity intersected with the image edge.
To determine the impurity and the image-edge images of the intersection, after using the nonlocal average noise of images and hole filling after the image-addition operation, as shown in Figure 12, it can be seen that the unpopulated area had high grey value by looking at the gray histogram of the image; for the segmentation threshold, which was finally in the range of (45, 80), we selected 60. The processed image (as shown in Figure 13) was output to the data-processing thread to find the impurity rate.

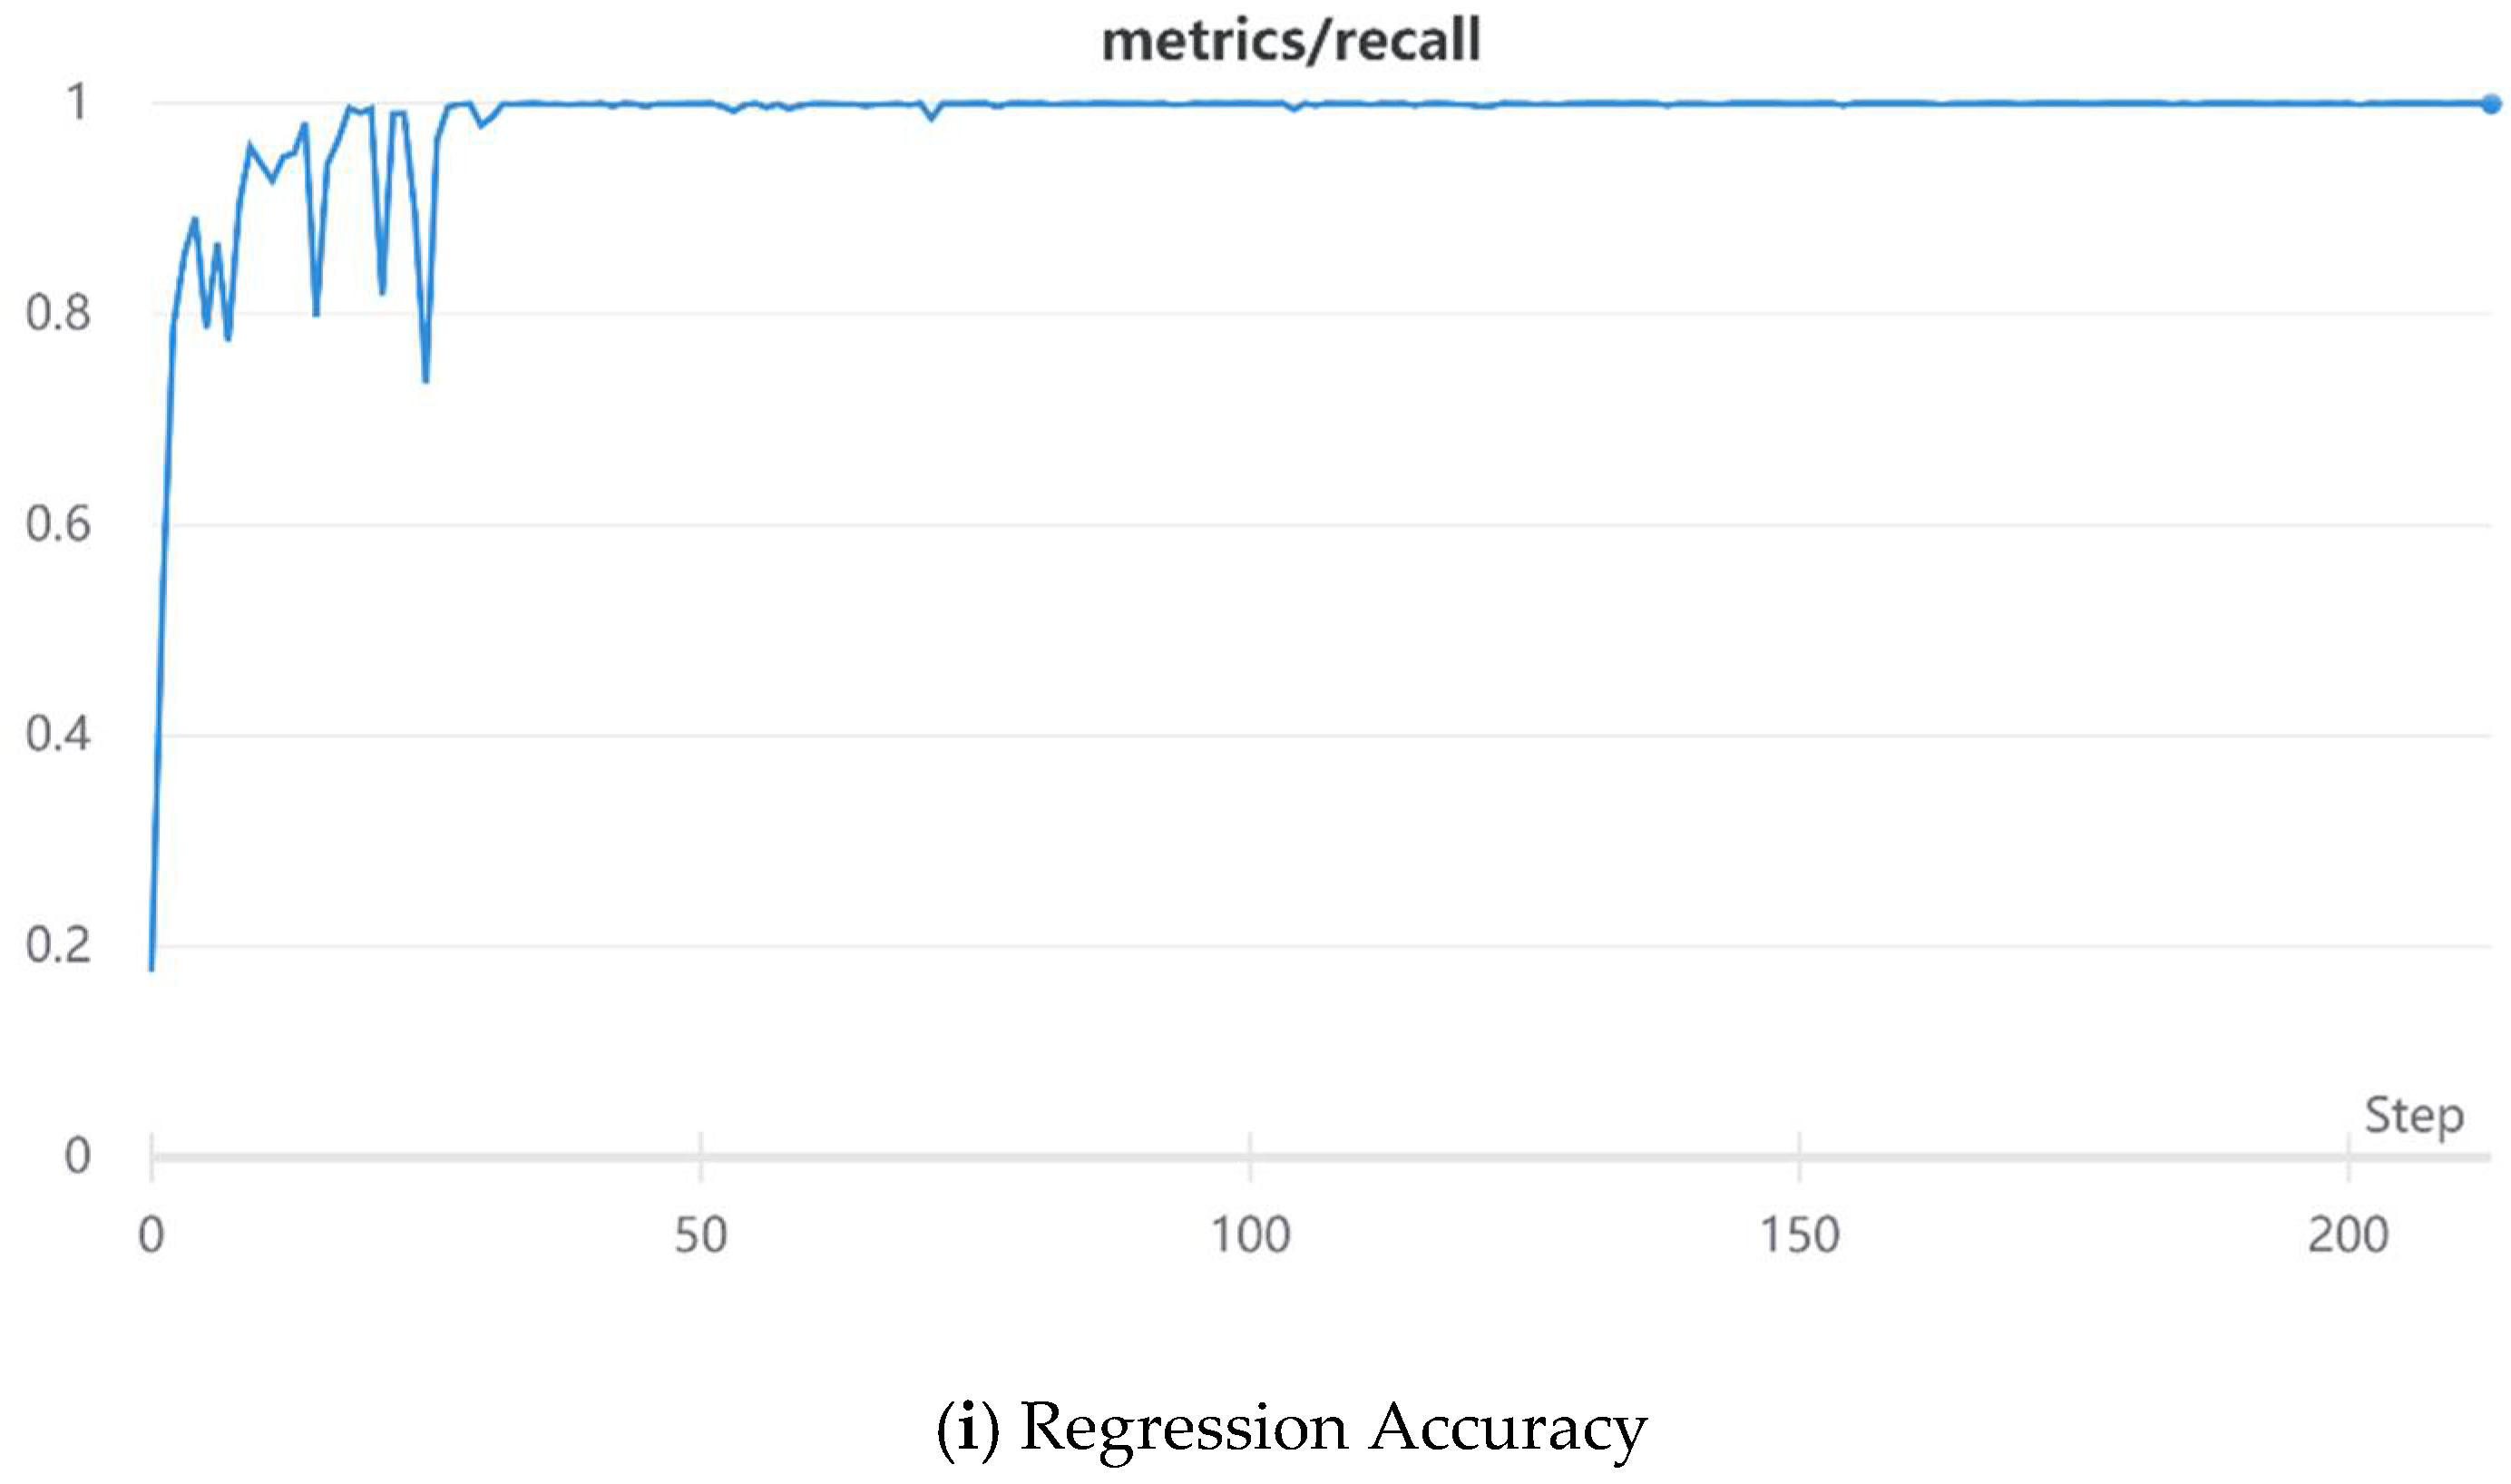
2.2.6. Impurity Classification and Recognition Based on YOLO V5
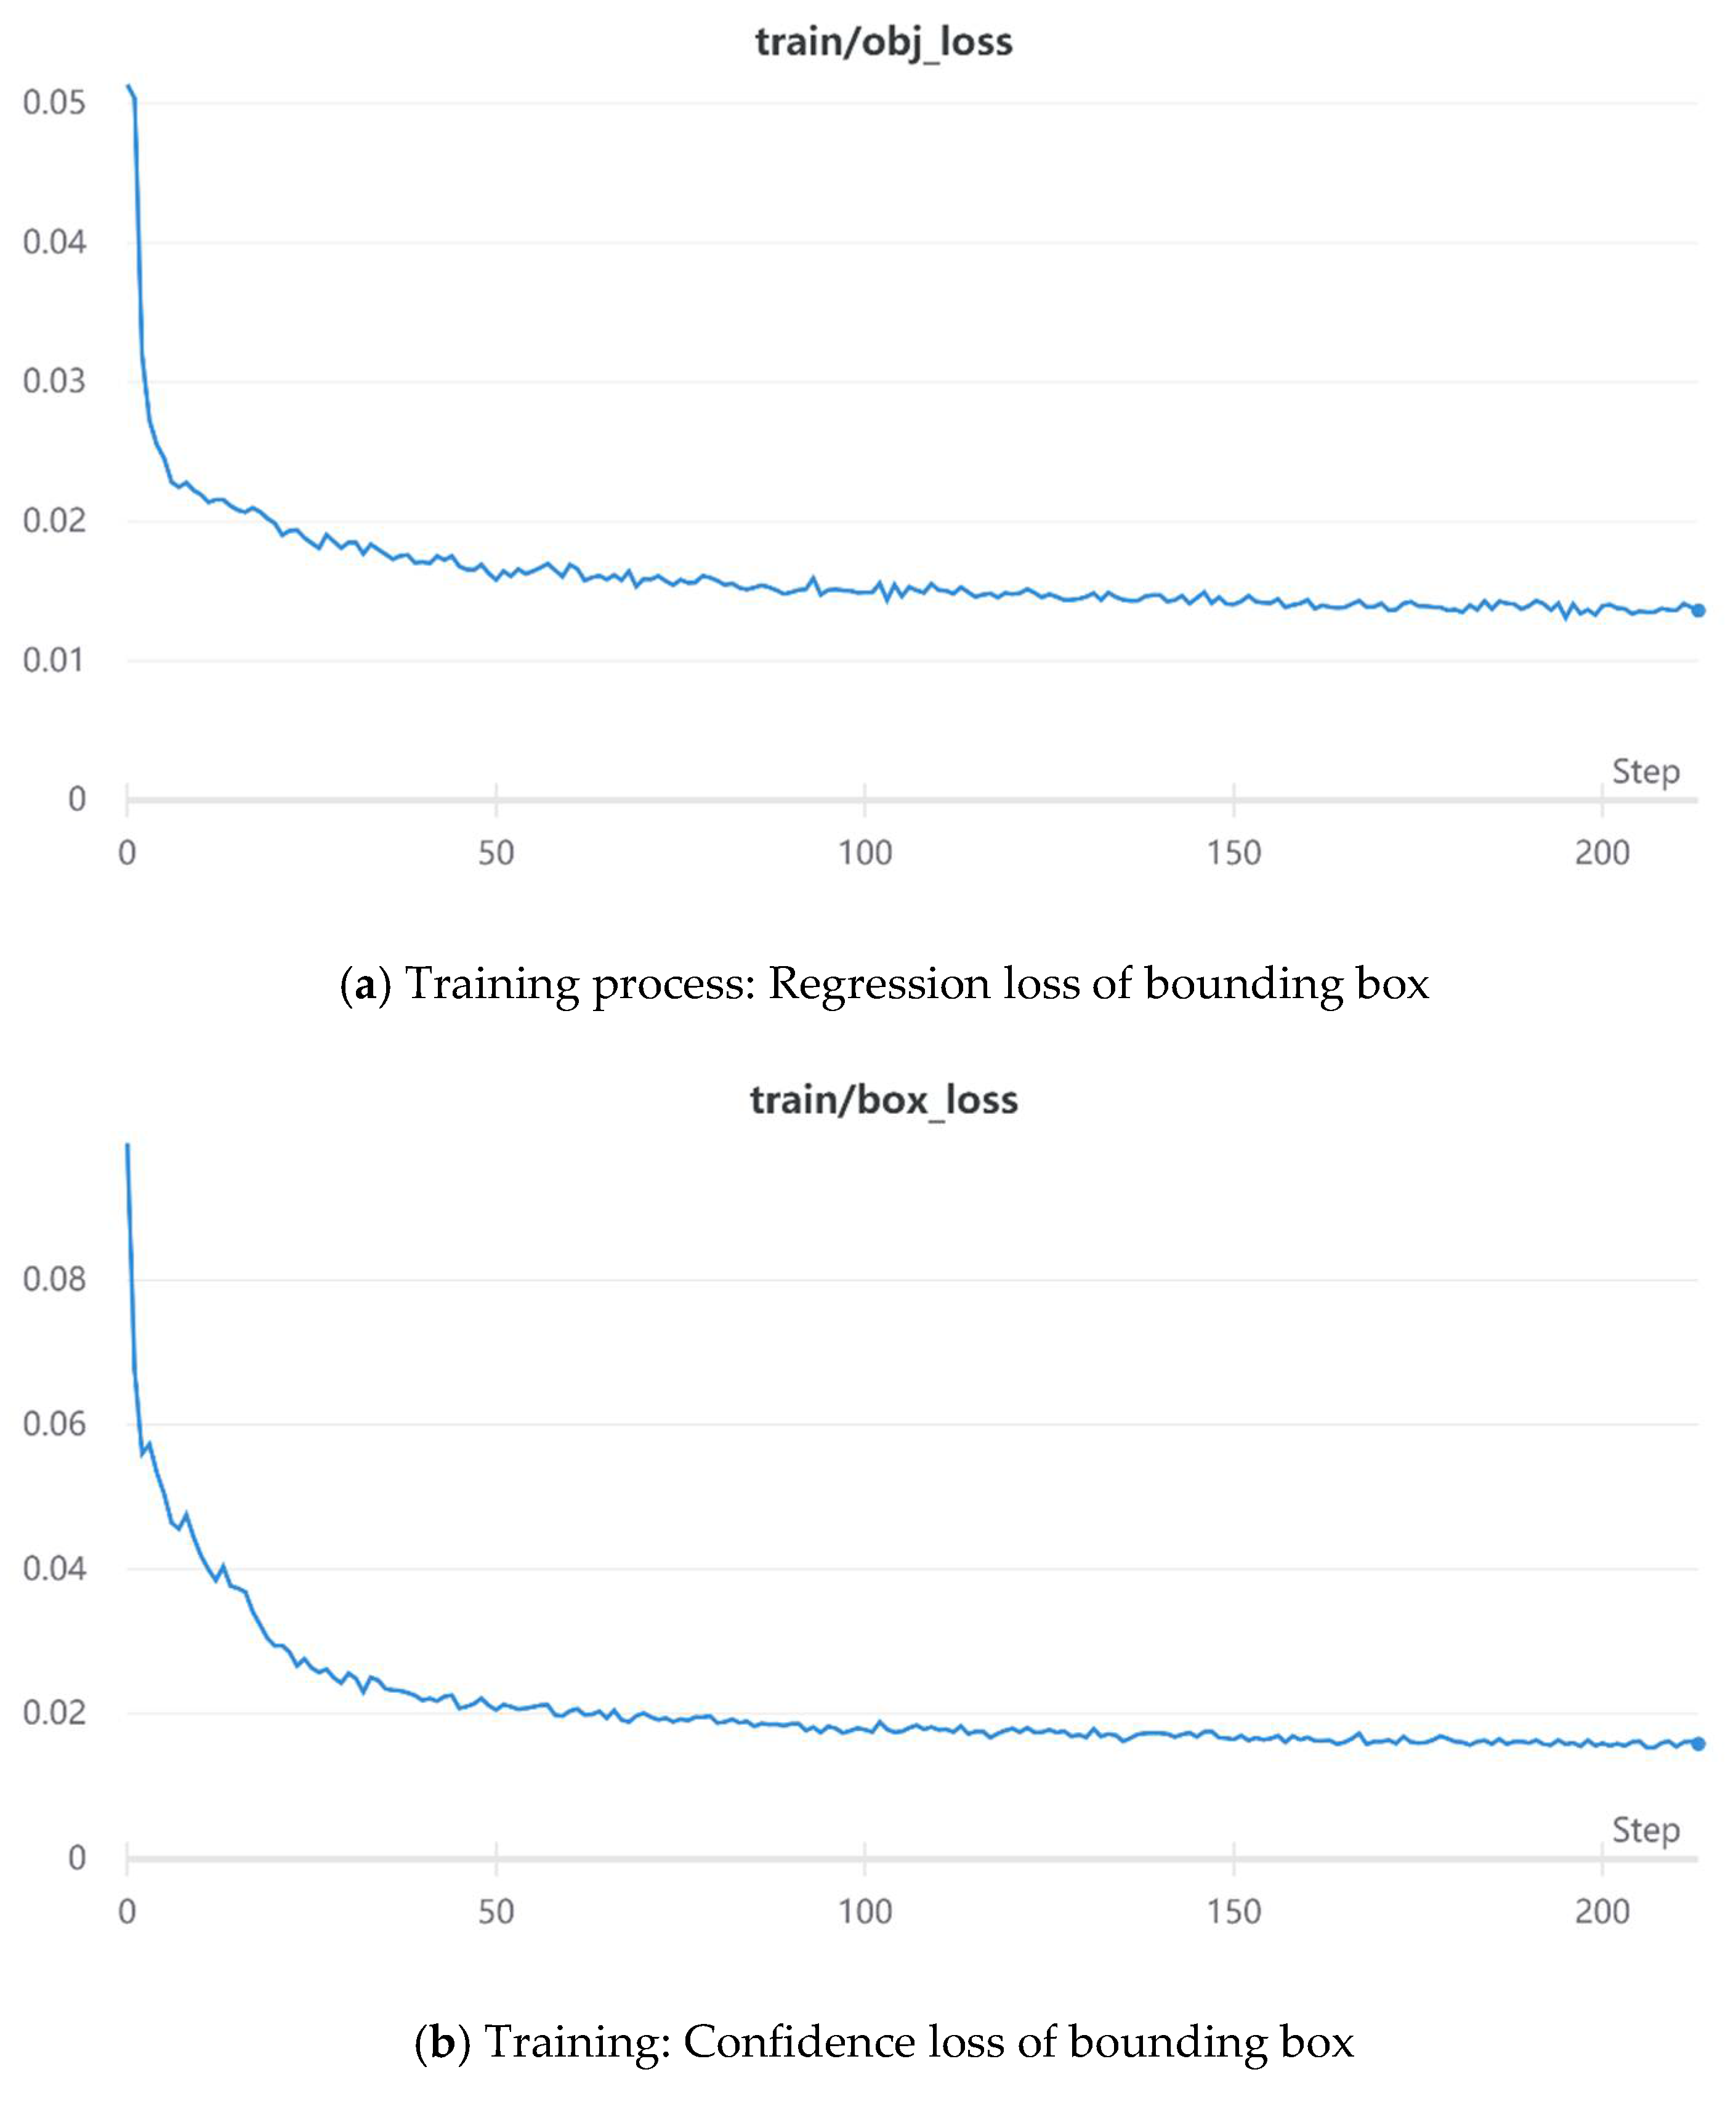
In the classification and recognition of impurities in cotton, earlier studies were mostly based on manually selected features combined with a machine-learning classifier model for training, and the trained classifier was then used to classify impurities according to features. On the one hand, the selected features were one-sided, and it was difficult to find all the features that could distinguish each type of impurities. Therefore, the selection of features directly affected the classification effect of the model. On the other hand, the learning characteristics of early machine-learning models were relatively shallow, and the models’ expression abilities were not adequate. In addition, improvements in their classification performances were less affected by the number of data sets.
A deep convolutional neural network can automatically extract and learn more essential features of images from training data. Applying a deep convolutional neural network to machine-picked seed cotton impurity classification and recognition technology can significantly improve the classification effect. YOLO V5, which integrates the advantages of faster-CNN, SSD, and ResNet models, is the target detection network with the most balanced speed and accuracy so far. It will achieve remarkable results when applied to the classification and identification of machine-picked seed cotton impurities.
In this study, the photos of the machine-picked seed cotton containing impurities were manually marked to construct a training data set. All training and testing took place on a deep-learning workstation with a main configuration of an Intel(R) Xeon Platinum 8277L [email protected], a 24 GB NVIDIA GeForce RTX 3090, and 96 GB of running memory. The program was written in the Python language was run using CUDA, Cudnn, and OpenCV on a 64-bit Windows 10 system. In model training, pretraining weight files on the official website were used to initialize network weight parameters and accelerate model convergence. The training parameters were set according to experience; the training parameter values are shown in Table 1.
The appropriate prior frame size in YOLO V5 directly affected the detection speed of impurities in the machine-picked seed cotton and the positioning accuracy of the target frame. In order to obtain the optimal prior frame size, YOLO V5 automatically learned the prior frame size again. After the image in the model was scaled to 640 × 640, the optimal prior frame sizes were: (12,16), (19,36), (40,28), (36,75), (76,55), (72,146), (142,110), (192,243), (459,401), and these prior frame sizes were used for detection experiments.
  • Model training
The final model was trained 5000 times, which took 9 h, and 1017 images were used in the training. Three enhancement methods; i.e., scaling, color space adjustment, and Mosaic enhancement, were used to increase the training data and enhance the model recognition ability. In the training process, the dynamic training was observed by drawing the model loss curve; the corresponding loss value change curves are shown in Figure 14.
It can be seen in Figure 14 that the loss value of the model decreased rapidly in the early iterations, and the model was fitted quickly. After 50 iterations, the loss value decreased slowly. When the iteration reached 200 times, the loss curve was almost flat, and the accuracy reached 99.8%. In order to prevent overfitting and reduce training costs, the training was immediately ended, and the best weight was saved. The detection picture used in the training process is shown in Figure 15.
It can be seen in Figure 15 that impurities in the image could be detected through image enhancement, and the trained model could be used to classify and identify impurities in the machine-picked seed cotton.
  • Identify the impurities of machine-picked cotton after segmentation
A total of 200 groups of impurities after image segmentation were collected and input into the YOLO V5 model for classification and recognition, and the accuracy was counted. The results are shown in Table 2.
As can be seen in Table 2, the lowest recognition accuracy was 97.285%, which could realize the classification and identification of impurities in the machine-picked cotton.

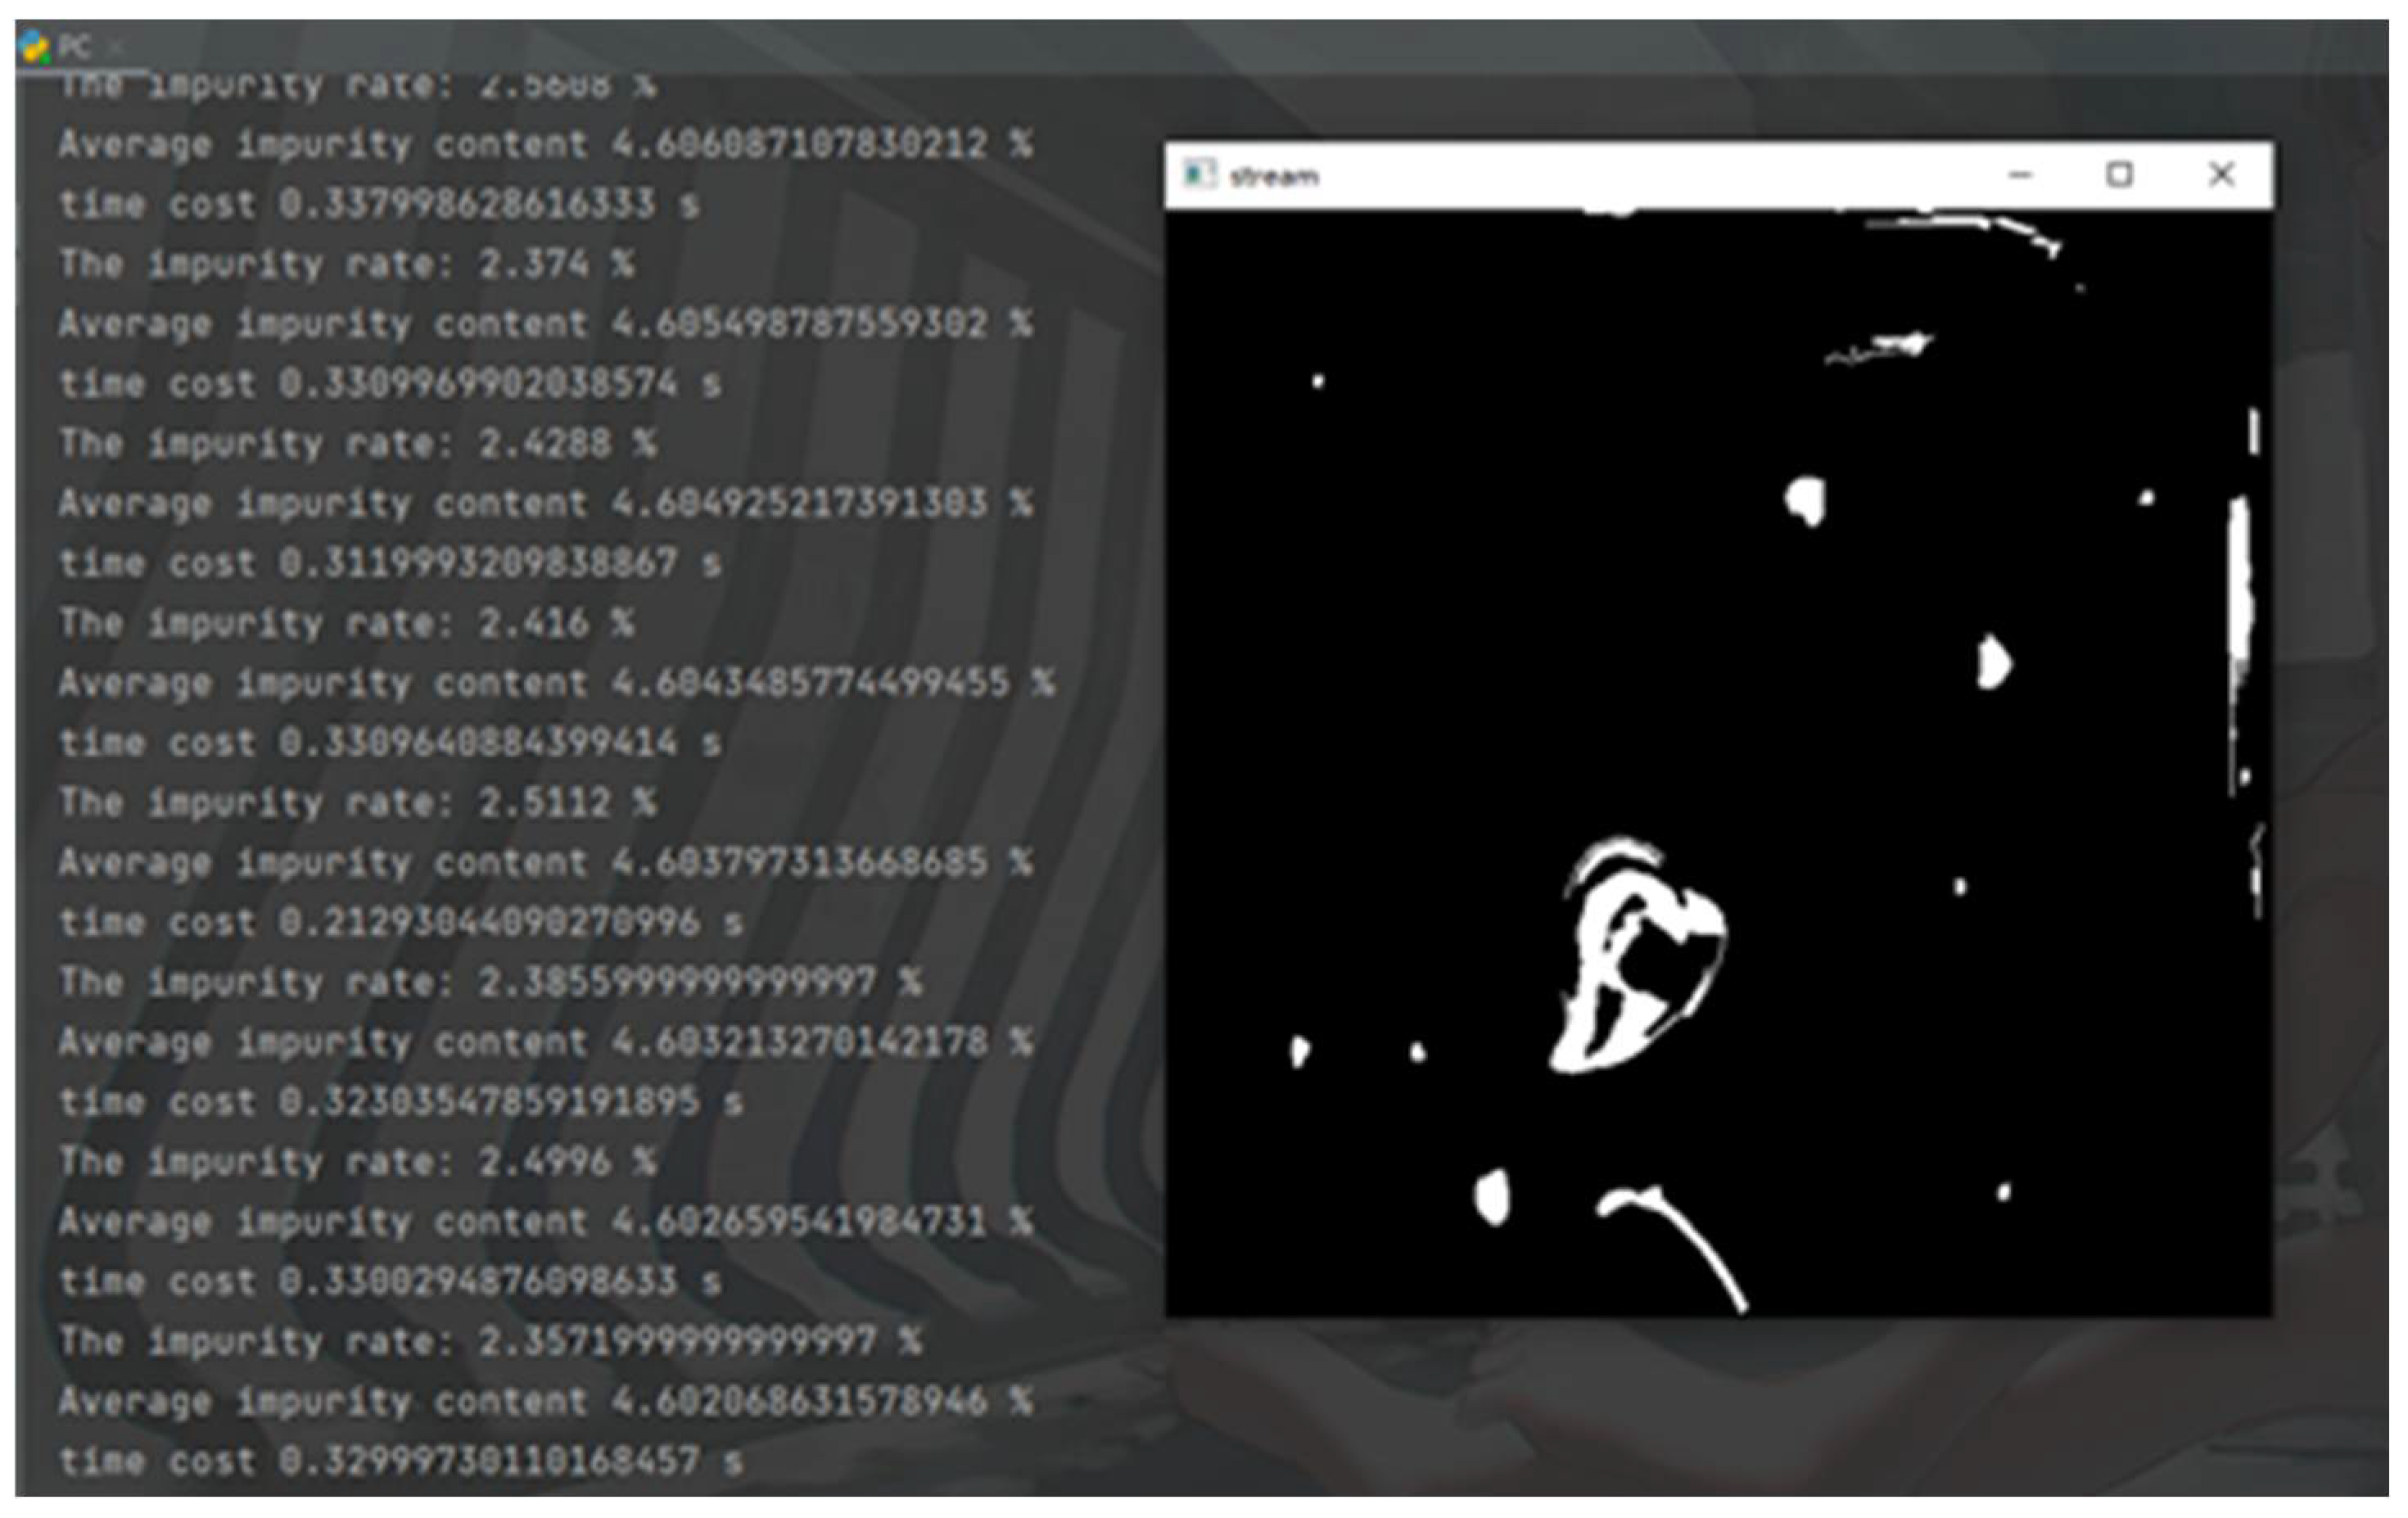
2.2.7. Data-Processing Threads

In this paper, the use of multithreading technology; that is, the image-processing work and data-processing work (calculation of the impurity rate) respectively used the CPU’s two threads for calculation. The CPU model was an Intel(R) Core(TM) I5-9400F [email protected], and the number of cores was 96.The two threads did not interfere with each other, avoiding the congestion problem of one-thread operation. This could speed up and facilitate real-time detection. The process for the data-processing thread is outlined below.
According to the national standard, the quality method is the main method to detect the impurity rate. The so-called quality method refers to the percentage of impurities in the sample to the total mass of cotton containing miscellaneous seeds as the impurity rate. Using to the cotton images collected, the proportion of the impurity area was calculated as the impurity rate of the cotton in the acquisition layer, which reflected the impurity content of the cotton to a certain extent. In order to establish a connection between the image information and quality, based on the area of the image information, the impurity rate was extended to the three-dimensional space, as shown in Figure 16, because in a large pile machine used in the process of picking cotton, the cotton impurity rate value was stable, based on the detection layer impurity rate as a benchmark, and the impurities in the process of a continuous processing rate were same as the rate of the impurity detection layer, Therefore, an impurity rate based on volume was obtained.
The proportion of the impurity area obtained from the image information was used as the proportion of impurity volume, as follows:
P s = s S = v V
where P s is the impurity rate based on area, s is the impurity area in the image, S is the overall area of the image, v is the volume of impurities in seed cotton, and V is the volume of seed cotton.
In addition, by establishing the volume–weight (V–W) model, the impurity rate based on mass could be calculated as:
P v = i Z P s i ρ i ρ s c =   M i m M s c
where P v is the impurity rate based on the V–W model; Z is the impurity type, including bell shells, cotton branches, weeds, and leaf crumbs; impurity Psi is the ith impurity rate based on area; ρi is the first-class i impurity density; ρsc is the natural fleeciness state of the average density of the seed cotton; M i m is the quality of the impurities; and M s c is the machine adopting the quality of seed cotton, measured, and machine mining seed cotton in the density of the material, as shown in Table 3.
The image processed by the image-processing thread was input into the data-processing thread, and the image was traversed by pixel points, the number of points with a gray value of 255 in various impurity areas was recorded, and the real-time impurity rate and average impurity rate based on quality were calculated. Using multithreading technology, the data-processing process was arranged in another thread for the detection of the impurity rate. As a comparison, the single thread was used for the detection of the impurity rate, and the processing time of each image was counted. A comparison of the processing times for each type of thread is shown in Table 4.
When using a single thread to detect the impurity rate, the average time for detecting an image was 0.520 s; when using multithread technology to detect an image, it was 0.293 s, a reduction in processing time of 43.65%. It can be seen that multithreading technology could improve the real-time detection frame rate and feedback of the processing status of cotton in real time.

3. Results

In order to verify the effectiveness of the proposed method, the proposed algorithm was compared with the detection results of the traditional Canny operator detection algorithm, SVM algorithm, and K-means clustering algorithm. The detection results are shown in Figure 17.
As can be seen in Figure 17, the improved Canny operator had a more accurate segmentation effect than the traditional canny operator, avoiding the influence of the cotton background and reducing the part of mis-segmentation. However, the traditional algorithm had a poor segmentation effect on the image in this acquisition environment; large-area impurities were prone to produce defects, and small-area impurities had incomplete segmentation. K-means clustering segmentation was affected by the images, and had poor robustness. It was easy to mis-segment large cotton areas. SVM segmentation required manual selection of the foreground and background, so the segmentation effect was affected by human factors, and large impurities were prone to a lack of holes. Among the above algorithms, the average processing times for a single image using the improved Canny operator and the traditional Canny operator were 0.293 s and 0.506 s, respectively, which were adequate for real-time detection. In addition, the average processing times of the K-means clustering and SVM segmentation for a single image were 1.632 s and 16 s, respectively, which were not suitable for real-time detection.
By preparing 10 samples, the improved canny operator and the traditional Canny operator were used to collect 3 s images of the samples and calculate the average impurity rate. Then, K-means clustering and SVM segmentation were used to detect the impurity rate based on quality. Finally, these were compared with the impurity rate obtained by the mass method. The experimental results are shown in Table 5.
It can be seen in Table 5 that the impurity rate of the detection method with the improved Canny operator was closer to that of the mass method. The traditional Canny operator was prone to mis-segmentation and had poor applicability to machine-picked cotton images. The detection result fluctuated greatly compared with the improved Canny operator. The detection results of the K-means clustering were affected by the images and fluctuated greatly. The detection results of the SVM segmentation were close to the improved Canny operator. Considering the methods comprehensively, the detection method of the improved Canny operator was selected as the core processing algorithm of the real-time detection system.

4. Discussion

In this study, the impurity content of mechanically harvested seed cotton was analyzed based on an image-processing method, and was closer to the real impurity content, which provided a basis for adjusting the parameters of cotton-processing machinery, which will be helpful in improving cotton-processing quality and increasing economic benefits.

5. Conclusions

(1)
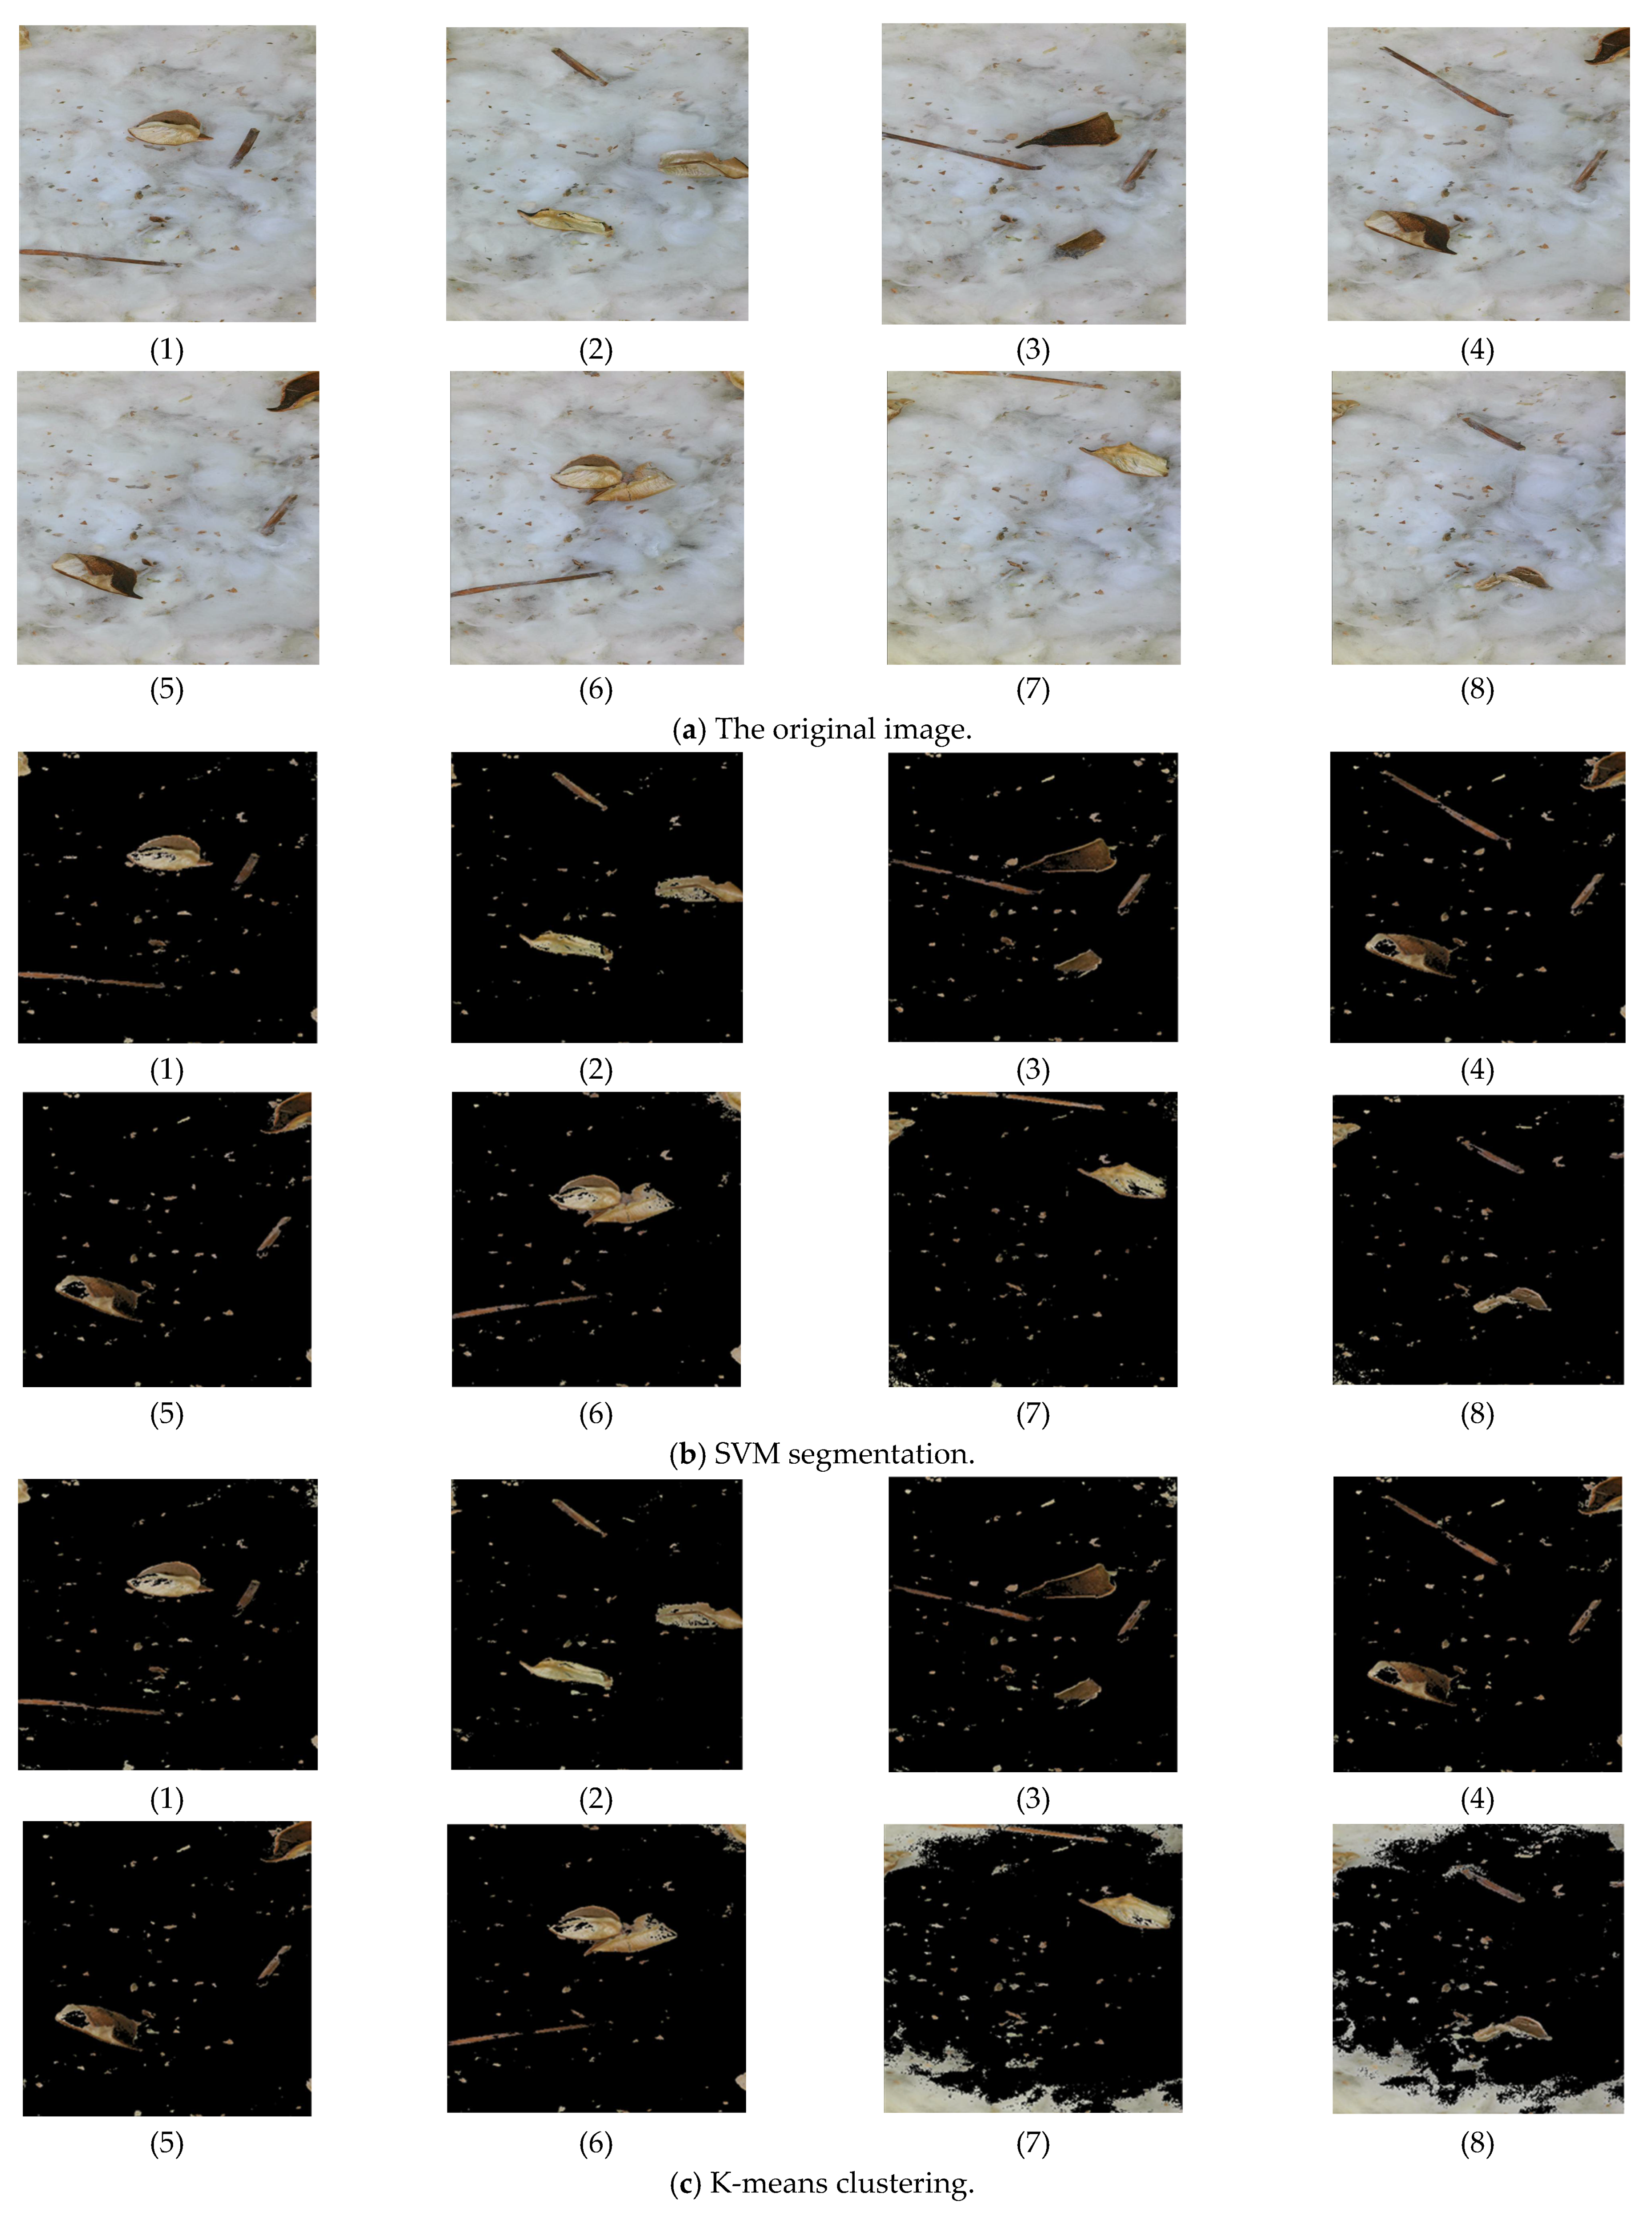
Aiming at the real-time detection of the impurity rate in machine-picked cotton processing, this paper proposed a detection method for the impurity rate in machine-picked cotton based on an improved Canny operator. According to the characteristics of different saturations between cotton and impurities, the impurities were separated by extracting the image S channel.
(2)
In view of the problems existing in traditional Canny operator edge detection, mean filtering and nonlocal mean denoising were used to replace Gaussian filtering; this could effectively remove the noise in the image.
(3)
A YOLO V5 neural network was used to classify and identify the impurities after segmentation, and the density of various impurities was measured. The V–W model was established to solve the impurity rate based on mass.
(4)
Using multithread technology, the processing time was shortened by 43.65% compared with that of a single thread, and the processing frame rate was effectively improved. By finding the average value of the impurity rate, the anti-interference performance of the algorithm was enhanced, and had the characteristics of real-time detection and stability.
This method countered the problems such as a slow solving speed, low detection accuracy, poor real-time performance, and easy interference, and then guided the cotton production and processing processes.

Author Contributions

Conceptualization, C.Z.; writing—review and editing, T.L.; validation, J.L. All authors have read and agreed to the published version of the manuscript.

Funding

This work was supported by the project ZR2019MEE113 supported by the Shandong Provincial Natural Science Foundation and the Key R&D Program of Shandong Province (2019JZZY020616).

Conflicts of Interest

The authors declare no conflict of interest.

References

  1. Lu, X.; Yang, J. Research on foreign fiber Online Detection Technology based on Vision Sensor. Cotton Text. Technol. 2018, 46, 5–8. [Google Scholar]
  2. Zhang, Y.; Xu, J.; Wang, Z.; Shi, P. Optimization of cotton fiber detection Technology based on machine vision. Chin. J. Agric. Mech. 2018, 39, 65–69. [Google Scholar] [CrossRef]
  3. Dong, C.; Du, Y.; Ren, W.; Zhao, D. Research progress of optical imaging technology for detection of heterotropic fibers in cotton. J. Text. 2020, 41, 183–189. [Google Scholar]
  4. Shi, H.; Guan, S.; Wu, N. Image multi-resolution differential detection method for cotton metafiber. Text. J. 2014, 35, 13–18. (In Chinese) [Google Scholar]
  5. Cao, Z.; Jing, J.; Su, Z.; Zhang, H. Research on Deep Learning Color Fabric Defect Detection Based on Raspberry PI. Cotton Text. Technol. 2019, 47, 21–25. [Google Scholar]
  6. Ding, X.; Zhang, Y. Research on color foreign fiber detection method based on image processing. Cotton Text. Technol. 2020, 48, 11–15. [Google Scholar]
  7. Zhao, X.; Li, D.; Yang, B.; Ma, C.; Zhu, Y.; Chen, H. Feature selection based on improved ant colony optimization for online detection of foreign fiber in cotton. Appl. Soft Comput. 2014, 24, 585–596. [Google Scholar] [CrossRef]
  8. Zhao, X.; Li, D.; Yu, H. Online Detection of Cotton fiber Based on Fischer Score and Discrete Particle Swarm Optimization. Trans. Chin. Soc. Agric. Eng. 2014, 107–115. [Google Scholar]
  9. Wang, X.; Yang, W.; Li, Z. A fast image segmentation algorithm for detection of pseudo-foreign fibers in lint cotton. Comput. Electr. Eng. 2015, 46, 500–510. [Google Scholar] [CrossRef]
  10. He, X.; Su, Z.; Deng, B.; Pan, Y.; Chi, Z. An Artificial intelligence Detection Method for Hetero fiber in Seed cotton. Cotton Text. Technol. 2018, 46, 49–52. [Google Scholar]
  11. Pavani, S.K.; Dogan, M.S.; Sari-Sarraf, H.; Hequet, E.F. Segmentation and Classification of Four Common Cotton Contaminants in X-Ray microtomographic Images. In Machine Vision Applications in Industrial Inspection XII; Electrical Engineering Department, Texas Tech University: Lubbock, TX, USA, 2004; p. 79409. [Google Scholar]
  12. Zhang, C.; Li, L.; Dong, Q.; Ge, R. Method for detecting impurities in machine-picked cotton by region color segmentation. J. Text. Sci. Technol. 2017, 38, 135–141. [Google Scholar]
  13. Zhang, C.; Li, L.; Dong, Q.; Ge, R. Recognition of impurities in machine-picked cotton based on ga-svm model. Trans. Chin. Soc. Agric. Eng. 2016, 32, 189–196. [Google Scholar]
  14. Wang, X.; Li, D.; Yang, W.; Li, Z. Identification method of cotton pseudo fiber based on visible light machine vision. Trans. Chin. Soc. Agric. Mach. 2015, 46, 7–14. [Google Scholar]
  15. Wang, H.; Li, H. Classification and recognition of seed cotton impurities based on local Binary mode and gray co-occurrence matrix. Trans. Chin. Soc. Agric. Eng. 2015, 31, 236–241. [Google Scholar]
  16. Wei, P.; Zhang, L.; Liu, X.; Wang, D.; Su, Z. Dual-light source imaging detection method of foreign fiber in seed cotton. J. Text. Res. 2017, 38, 32–38. (In Chinese) [Google Scholar]
  17. Alaknanda Anand, R.S.; Kumar, P. Flaw detection in radiographics weld images using morphological approach. Ndt E Int. 2006, 39, 29–33. [Google Scholar] [CrossRef]
  18. Kiranyaz, S.; Ferreira, M.; Gabbouj, M. Automatic object extraction over multiscale edge field for multimedia retrieval. IEEE Trans. Image Process. 2006, 15, 3759–3772. [Google Scholar] [CrossRef]
  19. Yu, H.; Wang, Y. An Improved Canny Edge Detection Algorithm. Comput. Eng. Appl. 2004, 40, 27–29. [Google Scholar]
  20. Wei, H.; Zhao, B.; Tang, L.; He, P. Improvement of Canny algorithm and implementation in hardware. Opt. Tech. 2006, 32, 263–266. (In Chinese) [Google Scholar]
  21. Demigny, D.; Kamle, T. A Discrete Expression of Canny’s Criteria for Step Edge Detector Performances Evaluation. IEEE Trans. Pattern Anal. Mach. Intell. 1997, 19, 1199–1211. [Google Scholar] [CrossRef]
  22. Zhang, X.; Yang, D.; Liu, Y. Improved Edge Detection Algorithm Based on Canny Operator. Comput. Eng. Appl. 2003, 39, 113–115. [Google Scholar] [CrossRef]
  23. Zheng, X.; Ding, T. Improved Adaptive Threshold Canny Edge Detection. Opto-Electron. Eng. 2009, 36, 106–111. [Google Scholar]
  24. Wang, Z.; Liu, X.; Xue, L. An Improved Method for Edge Detection of Canny Operator. Comput. Eng. Appl. 2010, 46, 202–205. [Google Scholar]
  25. Jin, Y.; Meng, J. An Improved Edge Detection Algorithm Based on Canny Operator. Chongqing High. Educ. Res. 2011, 30, 27–30. [Google Scholar]
  26. Zhang, Z.; Xi, J.; Liu, Y. Research on Canny Operator Based on GCV Criterion and Otsu Method. Comput. Sci. 2013, 6, 279–282. [Google Scholar]
  27. Wang, R.; Gao, L.; Chai, Y.; Tian, L. Edge Detection Method Combining Canny Method and Wavelet Transform. J. Northeast. Univ. 2005, 26, 1131–1133. [Google Scholar]
  28. Bai, T.; Deng, C.; Geng, Y. Image Edge Detection Method Based on Fusion of Wavelet Transform and Canny Operator. J. Harbin Univ. Sci. Technol. 2010, 15, 44–47. [Google Scholar]
  29. Ouahabi, A. A review of wavelet denoising in medical imaging. In Proceedings of the 8th International Workshop on Systems, Signal Processing and Their Applications (IEEE/WoSSPA), Algiers, Algeria, 12–15 May 2013; pp. 19–26. [Google Scholar]
  30. Canny, J. A Computational Approach to Edge Detection. IEEE Trans. Pattern Anal. Mach. Intell. 1986, PAMI-8, 679–698. [Google Scholar] [CrossRef]
  31. Wang, W.; Wang, L.; Yuan, Z. Canny Edge Detection Algorithm Based on Maximum Category Posterior Probability. Comput. Appl. 2009, 29, 962–965. [Google Scholar]
  32. Jin, W.; Guo, Y.; Ying, Y.; Liu, Y.; Peng, Q. Fast Non-Local Algorithm for Image Denoising. In Proceedings of the IEEE International Conference on Image Processing, Atlanta, GA, USA, 8–11 October 2006. [Google Scholar]
Figure 1. Real-time detection system for machine-picked seed cotton.
Electronics 11 00974 g001
Figure 2. Photo of image-acquisition system. 1—Display driver board; 2—Raspberry PI 4B; 3—display; 4—Light source controller; 5—camera; 6—camera fixer; 7—bench; 8—light source; 9—Seed cotton sample; 10—material storage box.
Electronics 11 00974 g002
Figure 3. Real-time processing results of upper computer.
Electronics 11 00974 g003
Figure 4. Flow chart of impurity content detection of machine-harvested seed cotton.
Electronics 11 00974 g004
Figure 5. S-channel image in HSV color space.
Electronics 11 00974 g005
Figure 6. Traditional Canny operator.
Electronics 11 00974 g006
Figure 7. Mean filtering.
Electronics 11 00974 g007
Figure 8. NLM algorithm noise reduction.
Electronics 11 00974 g008
Figure 9. Improved Canny operator edge detection.
Electronics 11 00974 g009
Figure 10. Closing operation.
Electronics 11 00974 g010
Figure 11. Hole filling.
Electronics 11 00974 g011
Figure 12. Image-addition operation.
Electronics 11 00974 g012
Figure 13. Threshold segmentation.
Electronics 11 00974 g013
Figure 14. Training-process curves.
Electronics 11 00974 g014aElectronics 11 00974 g014bElectronics 11 00974 g014cElectronics 11 00974 g014d
Figure 15. Test picture used in training process.
Electronics 11 00974 g015
Figure 16. Schematic diagram of image information expansion.
Electronics 11 00974 g016
Figure 17. Comparison of processing results of different algorithms.
Electronics 11 00974 g017aElectronics 11 00974 g017b
Table 1. Training parameter values.
Parameter NameParameter Value
batch16
subdivisions8
iterations5000
steps4000 times and 4500 times
img-size640 × 640
depth_multiple0.67
width_multiple0.75
nms0.25
Table 2. Classification and recognition accuracy of various impurities.
Type of ImpuritySample SizeNumber of Wrong/Missing SamplesRecognition Accuracy/%
Bell housing186398.388
Cotton branch174298.851
Weeds221697.285
Blackjack9462597.357
Table 3. Density of each substance in machine-picked seed cotton.
Material TypeDensity (g/cm3)
Bell shell0.461
Cotton branch0.152
Weeds0.803
Leaf crumbs0.642
Machine-picked seed cotton in a natural fluffy state0.481
Table 4. Comparison of single- and multithread processing times.
Single-Thread Processing Time (s)Multithreaded Processing Time (s)
0.5010.285
0.5310.293
0.5220.301
0.5120.299
0.5220.297
0.5230.281
0.5310.296
Table 5. Detection results of impurity rate of different algorithms (%).
Detection MethodImproved Canny OperatorTraditional Canny OperatorK-Means ClusteringSVM SegmentationQuality Standard
Sample 16.263777.633467.727114.170135.37385
Sample 26.766386.67146.722574.564556.99251
Sample 36.714227.3069410.09765.21156.84337
Sample 46.128336.354436.483375.114295.12907
Sample 56.713526.893947.89154.380556.55075
Sample 66.3497.541746.301835.947646.1273
Sample 76.792626.4065813.167724.714046.70949
Sample 86.038546.665277.154226.79676.01452
Sample 96.334587.199027.192945.495166.86348
Sample 106.189186.4700111.000825.423046.98239
Publisher’s Note: MDPI stays neutral with regard to jurisdictional claims in published maps and institutional affiliations.

