1. Introduction
The design process of modern lighting equipment should—in addition to ensuring the required functional parameters—guarantee adequate immunity to electromagnetic disturbances characteristic for their operating environment. It should also minimize the generation of disturbances, which determines the essence of electromagnetic compatibility for this type of device. One of the major aspects of widely understood electromagnetic compatibility is protection of the environment against unintentionally generated electromagnetic disturbances. The other—equally important—one is to ensure the proper operation of the device in the real environment in the presence of electromagnetic disturbances.
The subjects of the research were commercial LED lamps and the effects related to the impact of 1.2/50 µs (8/20 µs) surge impulse on their operation. This disturbance is a standardized one used to check the immunity of electrical and electronic devices to impulses that arise in the network during lightning discharges, switching processes and emergency states. The procedure for testing devices for this type of disturbance is described in the EN 61000-4-5 standard. In the case of a device meeting its requirements, it can be assumed that the device will operate properly with this type of disturbance in the target operating environment.
Currently, LEDs are becoming the main source of light. They allow for the arrangement of lighting effects with unlimited possibilities. However, despite the manufacturers’ declaration of lifetime usage, expressed by claimed thousands of hours of trouble-free operation, very often LED lamps lose their ability to operate properly much earlier.
Several research works and tests carried out by the authors for commercial purposes have become the basis for the question of how the process of damaging elements in a specific population affects the increase in the level of stress, especially in the case of the one leading to permanent damage to the tested device. The normalized surge pulse of 1.2/50 µs (8/20 µs) is an example of a disturbance which, due to its high energy nature, can lead to permanent parametric changes and catastrophic failures in an electronic system. Having conducted research for basic electronic components, i.e., resistors, capacitors, diodes, transistors, etc., it was observed that by increasing the surge level for each tested element, it is possible to determine the disturbance threshold value for which elements in the population begin to fail, as well as its value for which in a given population all would be damaged. When testing these discrete elements, a certain pattern of regularity was observed between the disturbance value for which one element failed and the disturbance value for which all the damaged elements failed. For a given level of disturbance in this range, it can be described by a mathematical function, which can be used to determine the probability of failure of an element, system, device or system in the presence of an electromagnetic disturbance.
In search for answers, selected publications and studies on this topic were analyzed. In papers [
1,
2], the authors presented the issues of LED durability and its determinants. They showed how environmental factors influence the state of degradation in the structure of light-emitting diodes (LEDs), dedicated to the construction of LED lamps. In the form of generalizations, they showed how mechanical, thermal, hydromechanical and electrical factors can affect the durability of LEDs. In publications [
3,
4], the authors characterized the methods of testing the lifetime of LEDs and, in mathematical terms, showed how to estimate their reliability coefficients on the basis of the test results. They also presented the results of accelerated aging techniques of the accelerated life test (ALT), accelerated degradation test (ADT) and step-stress accelerated degradation test (SSADT). In [
5], the authors show a study about currently available LEDs’ electrical and mechanical characteristics, which evaluates different possible causes of failure and their implication with explosive atmospheres. In these publications, there is no reference to the influence of electromagnetic disturbances on the operation of LED lamps. The essence of this problem was signaled in [
6]. The factors include overvoltages in power grids, material properties and physical and mechanical conditions. All of them can measurably modify the time of the correct operation of the diodes and influence permanent or partial loss of the ability to emit light flux. However, in the end, they are not the weakest parts in this type of lamp.
The elements most susceptible to damage in the structure of the LED lamp are the electronic components of the controller that supply the LEDs in the lamp. The reliability of an LED driver is defined as the probability that a certain number of units will pass (or fail) within a specified period at a given failure rate. It can also be measured by mean time between failures (MTBF) or mean time to failures (MTTF for nonrepairable products). With a proper failure distribution model, the failure rate, MTBF/MTTF, reliability and lifetime can be represented as a function of the parameters of the specific distribution model [
7,
8]. When estimating the MTBF/MTTF, the real factors that have a significant impact on the operating time are temperature, humidity in the surrounding of the lamp and change in voltage and current supplying LED in the lamp [
9]. The fact that they have a measurable impact on the operation of lamps and the duration of their serviceability was presented in publications [
9,
10,
11], where their selected types were tested under extreme conditions. The authors’ experience shows that the declared and estimated durations of correct operation of LED lamps in many cases differ significantly from those observed in reality. This duration can be significantly modified by disturbances coming from the power grid in which the LED lamps operate [
12,
13,
14].
2. Test Object
Two types of LED lamps (named A and B for research purposes) from the same manufacturer in the A+ class with a power of 9 W, emitting a luminous flux of 806 lm, with a color temperature of 3000 K (warm white) were selected as the research object. Lamps had the same type of housing with an E27 cap and were intended to be supplied from the 220–240 V/50 Hz network. According to the manufacturer’s declaration, they had the same declared operating time of 30 thousand hours. However, they differed in the declared guarantee of correct operation. In the case of the A lamp, the manufacturer has declared a guarantee for a period of 2 years, and for the B lamp—5 years. LED A lamp had a declaration of 15,000 switching cycles, while the LED B lamp had 20,000. In the price class, these are LED lamps, the so-called economical ones, with a price of up to EUR 3.
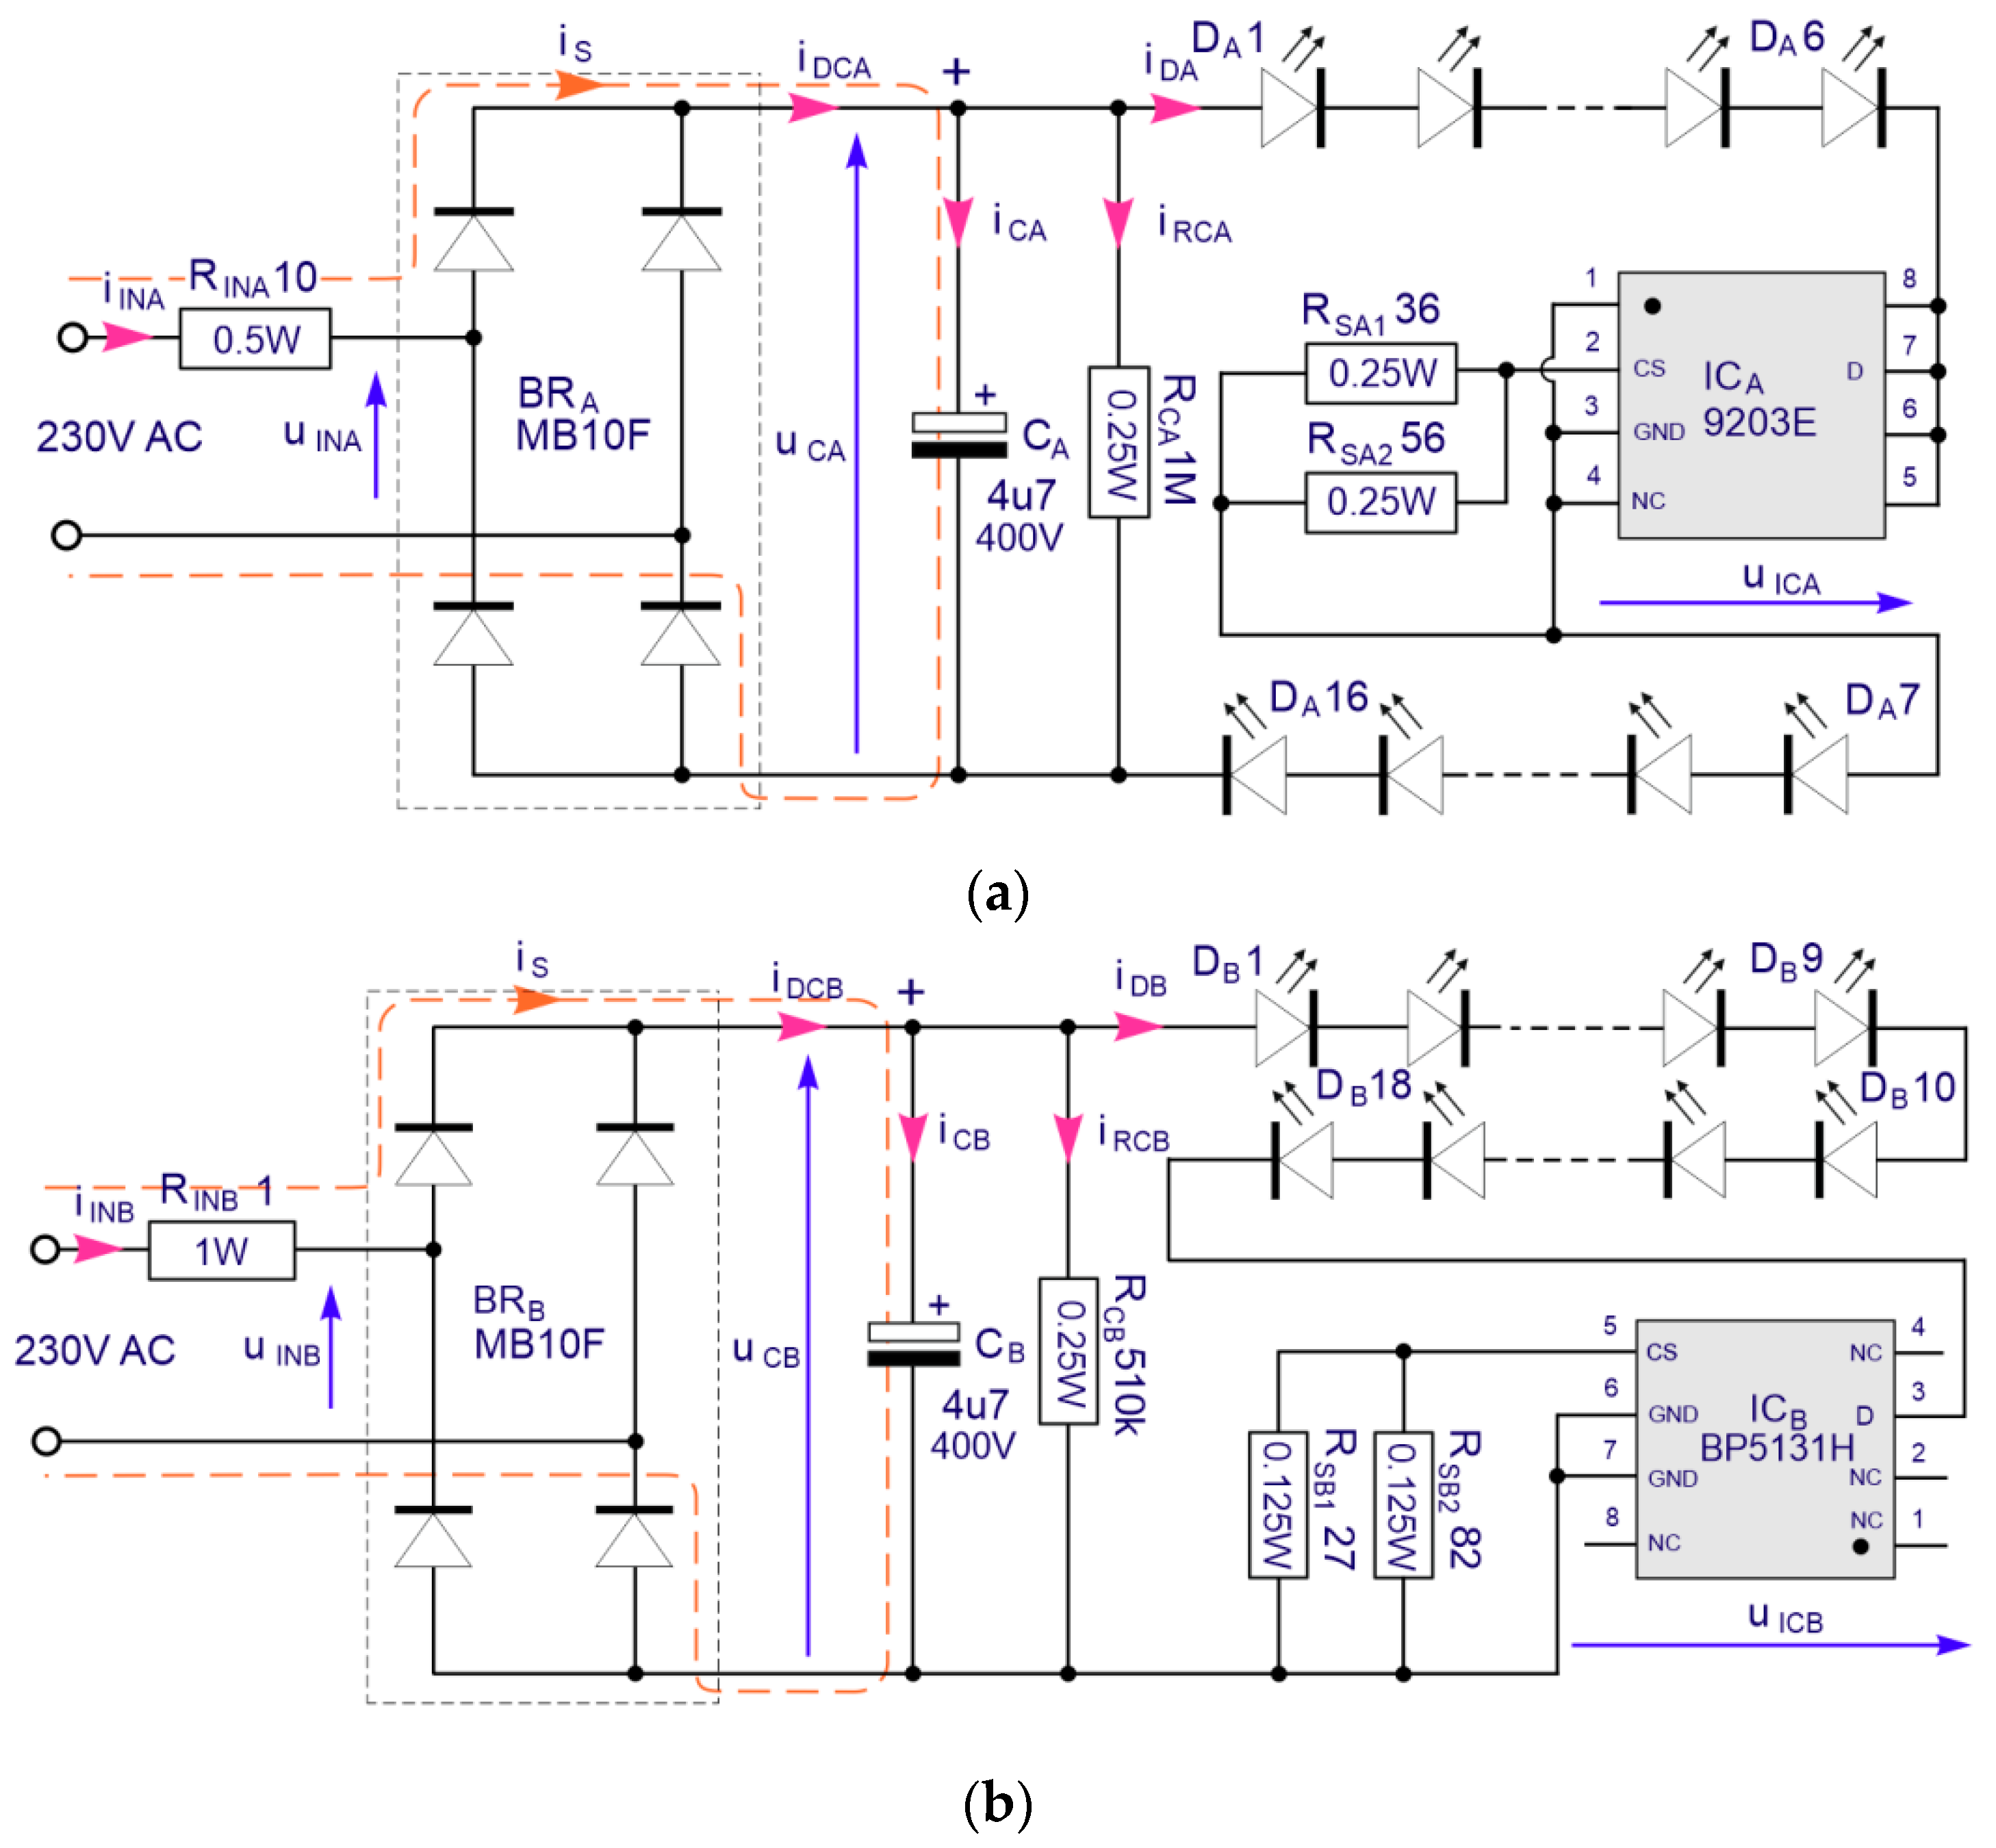
The economy class is reflected in the simple circuit applied in the power supply. Currently, in most of this type of lamp, in economic versions, specialized current stabilizers are used. The role of such a stabilizer is to ensure a constant value of the current through the LED chip, regardless of the changing power supply conditions. The circuit applications of such lamps are characterized by their simple construction. The application systems of the tested lamps are shown in
Figure 1. In the case of the first lamp, the current stabilizer system 9203E was used, while in the case of the B lamp, the integrated circuit BP5131H from Bright Power Semiconductor with the Samsung declaration was applied [
15].
Each application contains four basic functional blocks: a rectifier, a ripple smoothing filter, a current stabilizer and LEDs with a number appropriate to the declared luminous flux. In both types of lamps, in the input stage they had the same type of MB10F rectifier bridge and a 4.7 µF/400 V capacitor with the same temperature class of 105 °C, but they differed in design. The capacitor for THT mounting was used in lamp A and, in the case of lamp B, that for SMD. A 1 MΩ resistor was used to discharge the capacitor in lamp A, and in the case of lamp B it was 510 kΩ in the SMD version. The current stabilizer circuit requires only one element to operate properly—a resistor that allows for setting the value of the current supplying the LEDs. In lamps A and B, the LEDs were connected in a series. Lamp A contained 16 LEDs, while lamp B contained 18 LEDs. The resistance value of the resistors setting the stabilized current value was A-22 Ω and B-20 Ω, respectively. In the A lamp, the RINA resistor with a resistance of 10 Ω is used in the input circuit, while in the B lamp, 1 Ω. This resistor plays an auxiliary role and allows for meeting the requirements of the EMC standard in terms of harmonic emissions by this lamp model as well as limiting the charging current of the C capacitor when the lamp is turned on.
3. Surge Propagation Analysis in Power Supply Drivers of the Tested LED Lamps
All requirements for immunity to standardized types of electromagnetic disturbances for lighting technology devices are specified in the EN 61547: 2009 standard [
16]. This standard applies to all lighting devices, which—supplied from the power grid—are exposed to the influence of a number of electromagnetic disturbances characteristic of their operating environment. In order to reach the required level of immunity in the device design phase, the EN 61547: 2009 standard specifies a number of tests. Their positive results suggest that such a device is able to handle it at the target place of operation. For a surge of 1.2/50 µs (8/20 µs), the tests should be carried out following the requirements of the current standard EN 61000-4-5: 2014-10E [
17].
According to the EN 61547: 2009 standard, in the case of LED lamps with a power lower than 25 W supplied from the AC mains (this criterion was met by the tested lamps), immunity tests should be carried out for an impulse of 0.5 kV. According to the note in Chapter 5.7 of the standard, the tested object should be exposed to five surges with both positive and negative polarity, injected for the voltage phase angles of 90° and 270°, respectively. Criterion C (which states that during and after the test, any change in the luminous intensity is allowed and the lamp(s) may be extinguished) ought to be applied in the analysis of the results of the tests. Within 30 min after the test, all functions shall return to normal. Temporarily interrupting the mains supply and/or operating the regulating control is allowed, if necessary.
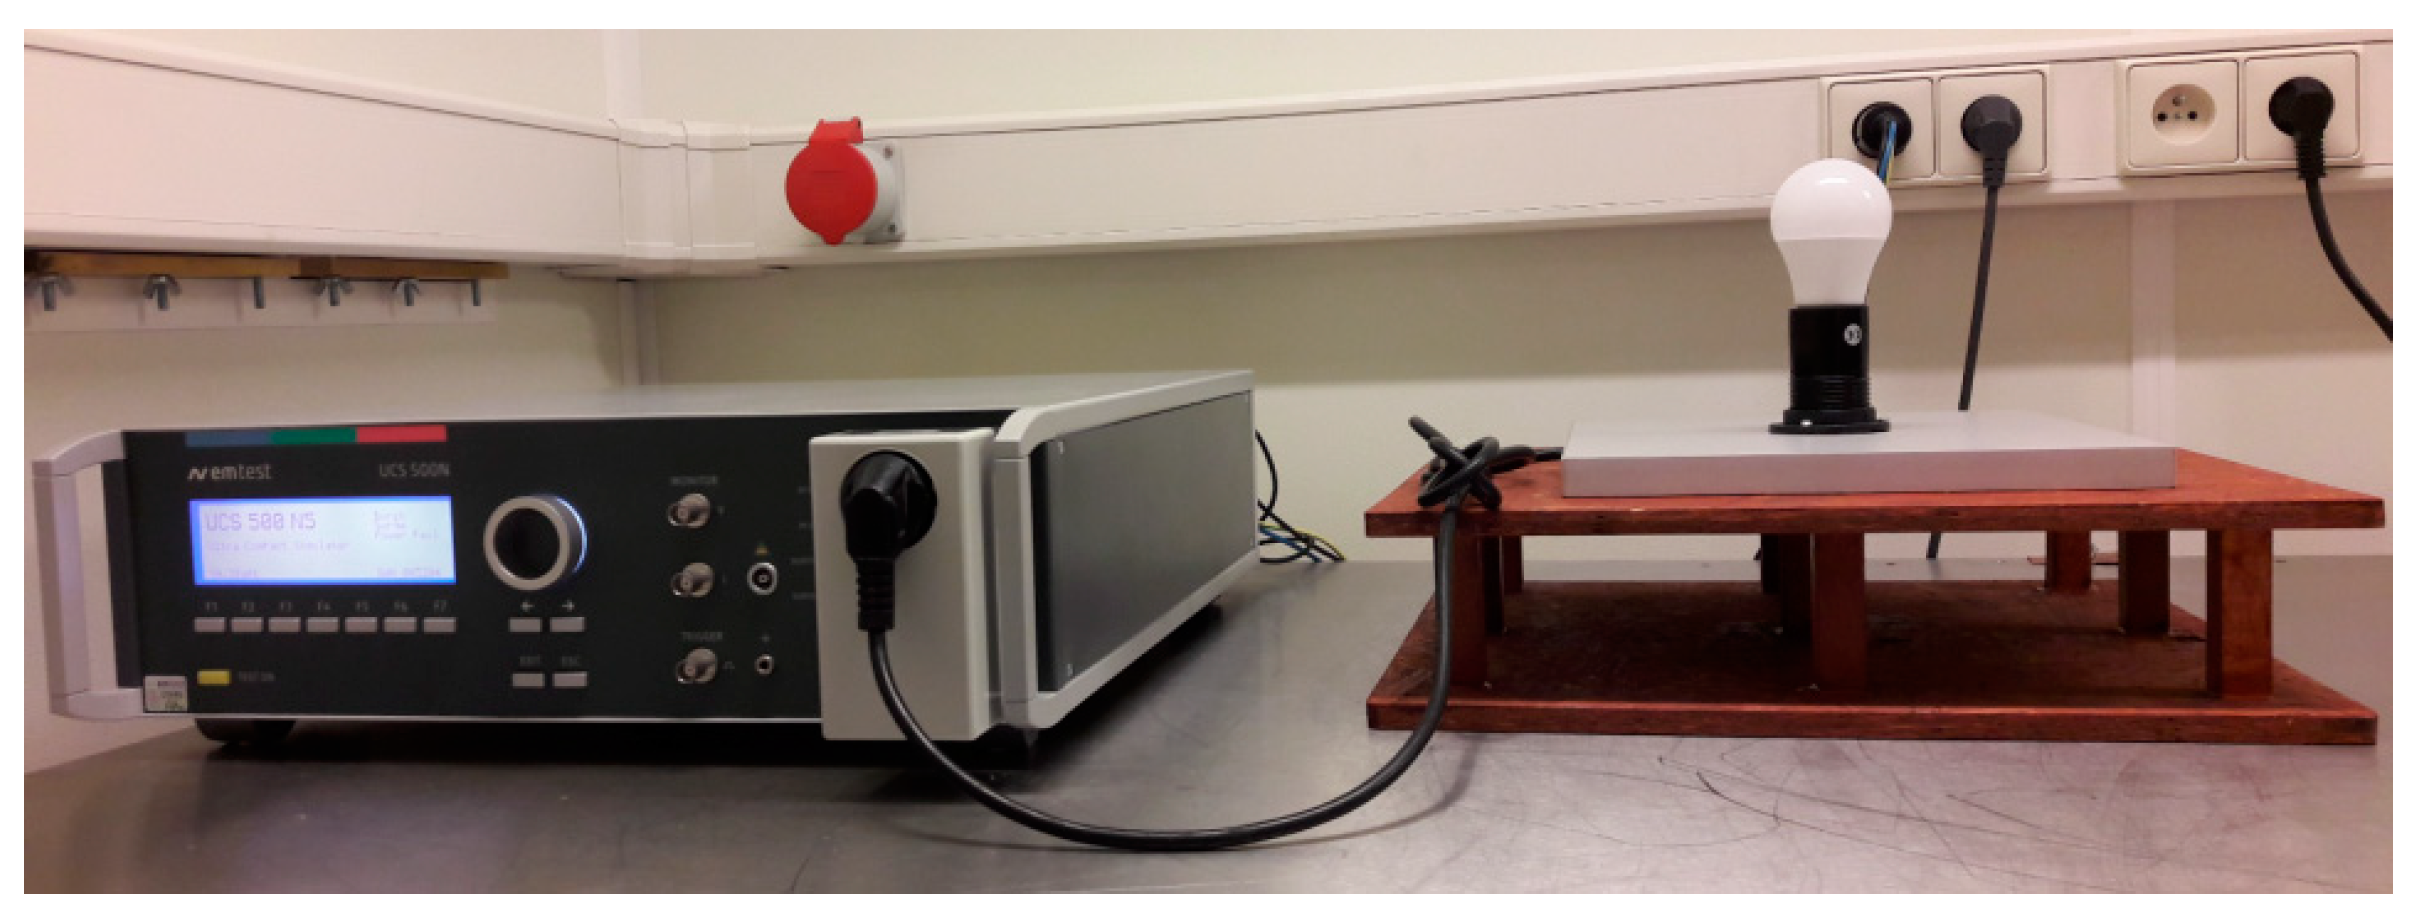
In the first stage of the tests, lamps’ accordance with standard’s requirements was checked on the test stand (
Figure 2). The tests were conducted using the EMTest UCS500N5 generator controlled by the iec.control application. Following the requirements of the standard, model lamps were exposed to five surges with positive polarity and five with negative polarity injected at the top and the minimum of the supply voltage sinusoid, respectively. Tests on the model LED lamps allowed us to state that they meet the requirements of the standard in this regard. Only at the time of injection of the disturbing pulse did each of the lamps, for a moment with a comparable pulse duration, emit an additional pulsed beam of light—there was a flare effect. After the interference subsided, it returned to stable operation very quickly (
Table 1).
In order to determine the cause of such a reaction of the lamp and the surge impulse propagation in its supply system, test systems were built that allowed the analysis of current and voltage waveforms at selected characteristic points as a function of time. A Tektronix MSO 4104 oscilloscope and a set of two P5205A differential voltage and TCP030A current probes were used to measure the waveforms. The points where the current and voltage waveforms were analyzed are illustrated in
Figure 1. The measured voltage and current waveforms at selected points of the tested lamps are presented in
Figure 3 and
Figure 4.
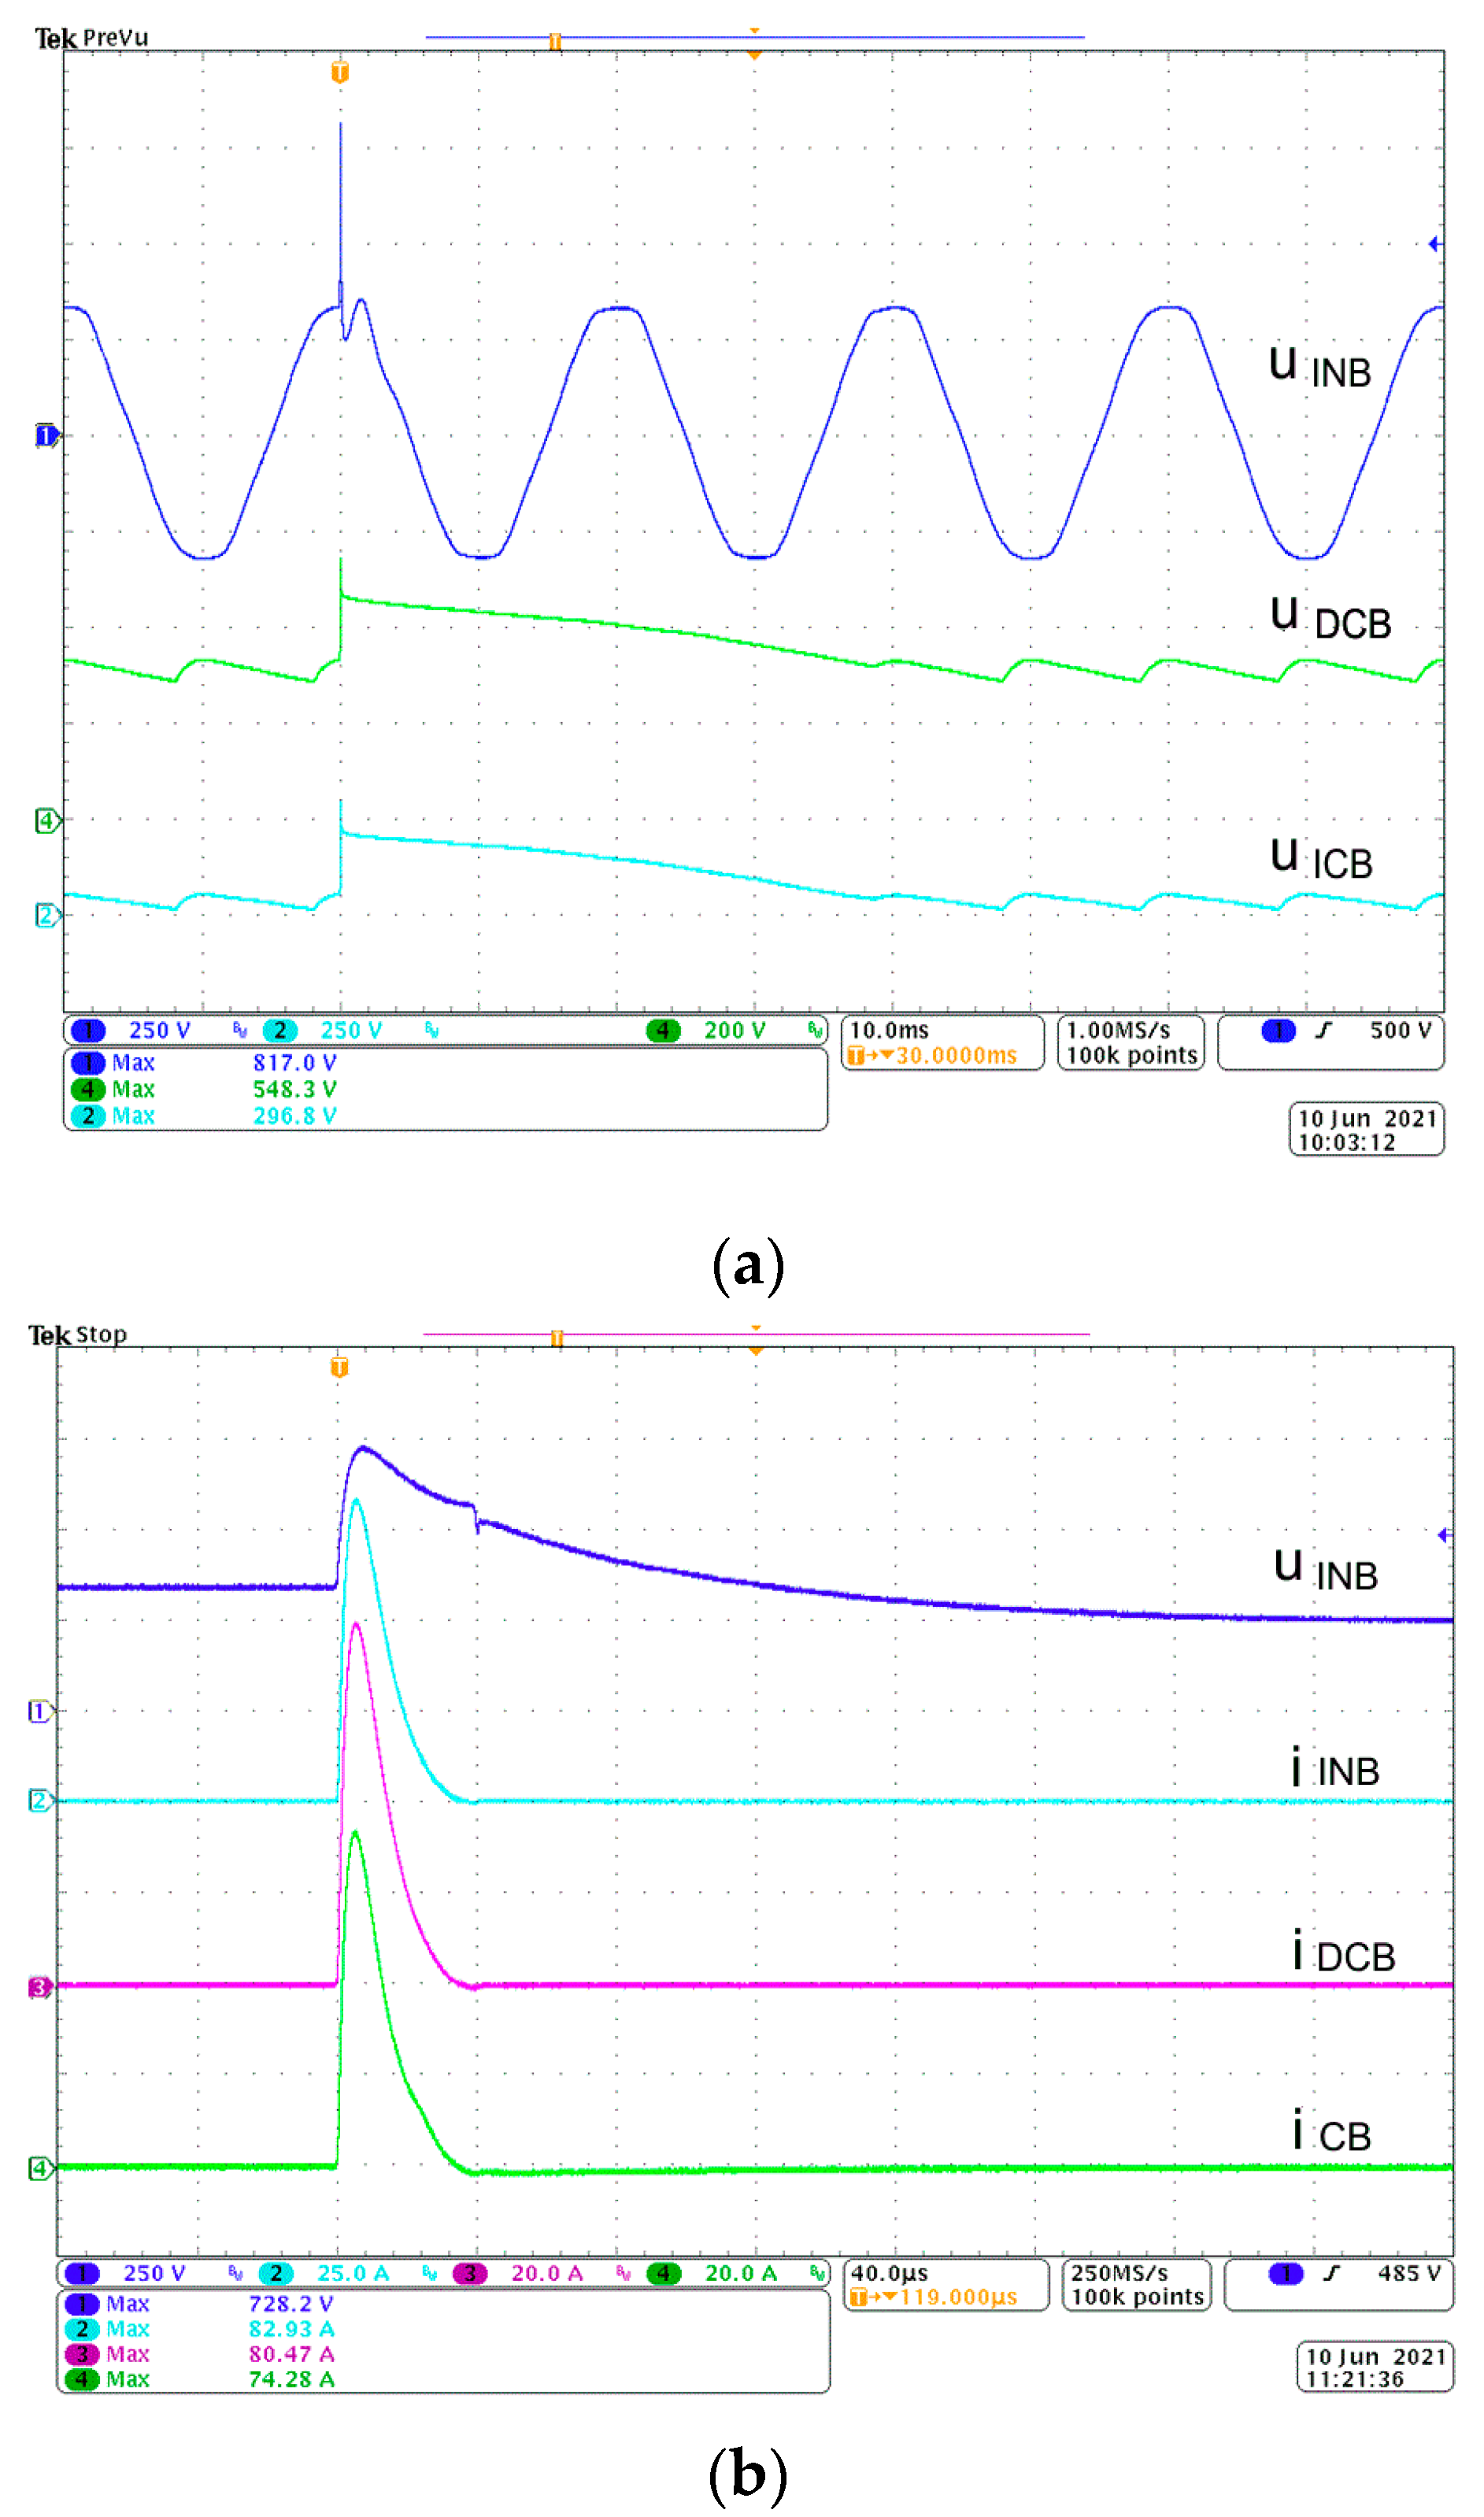
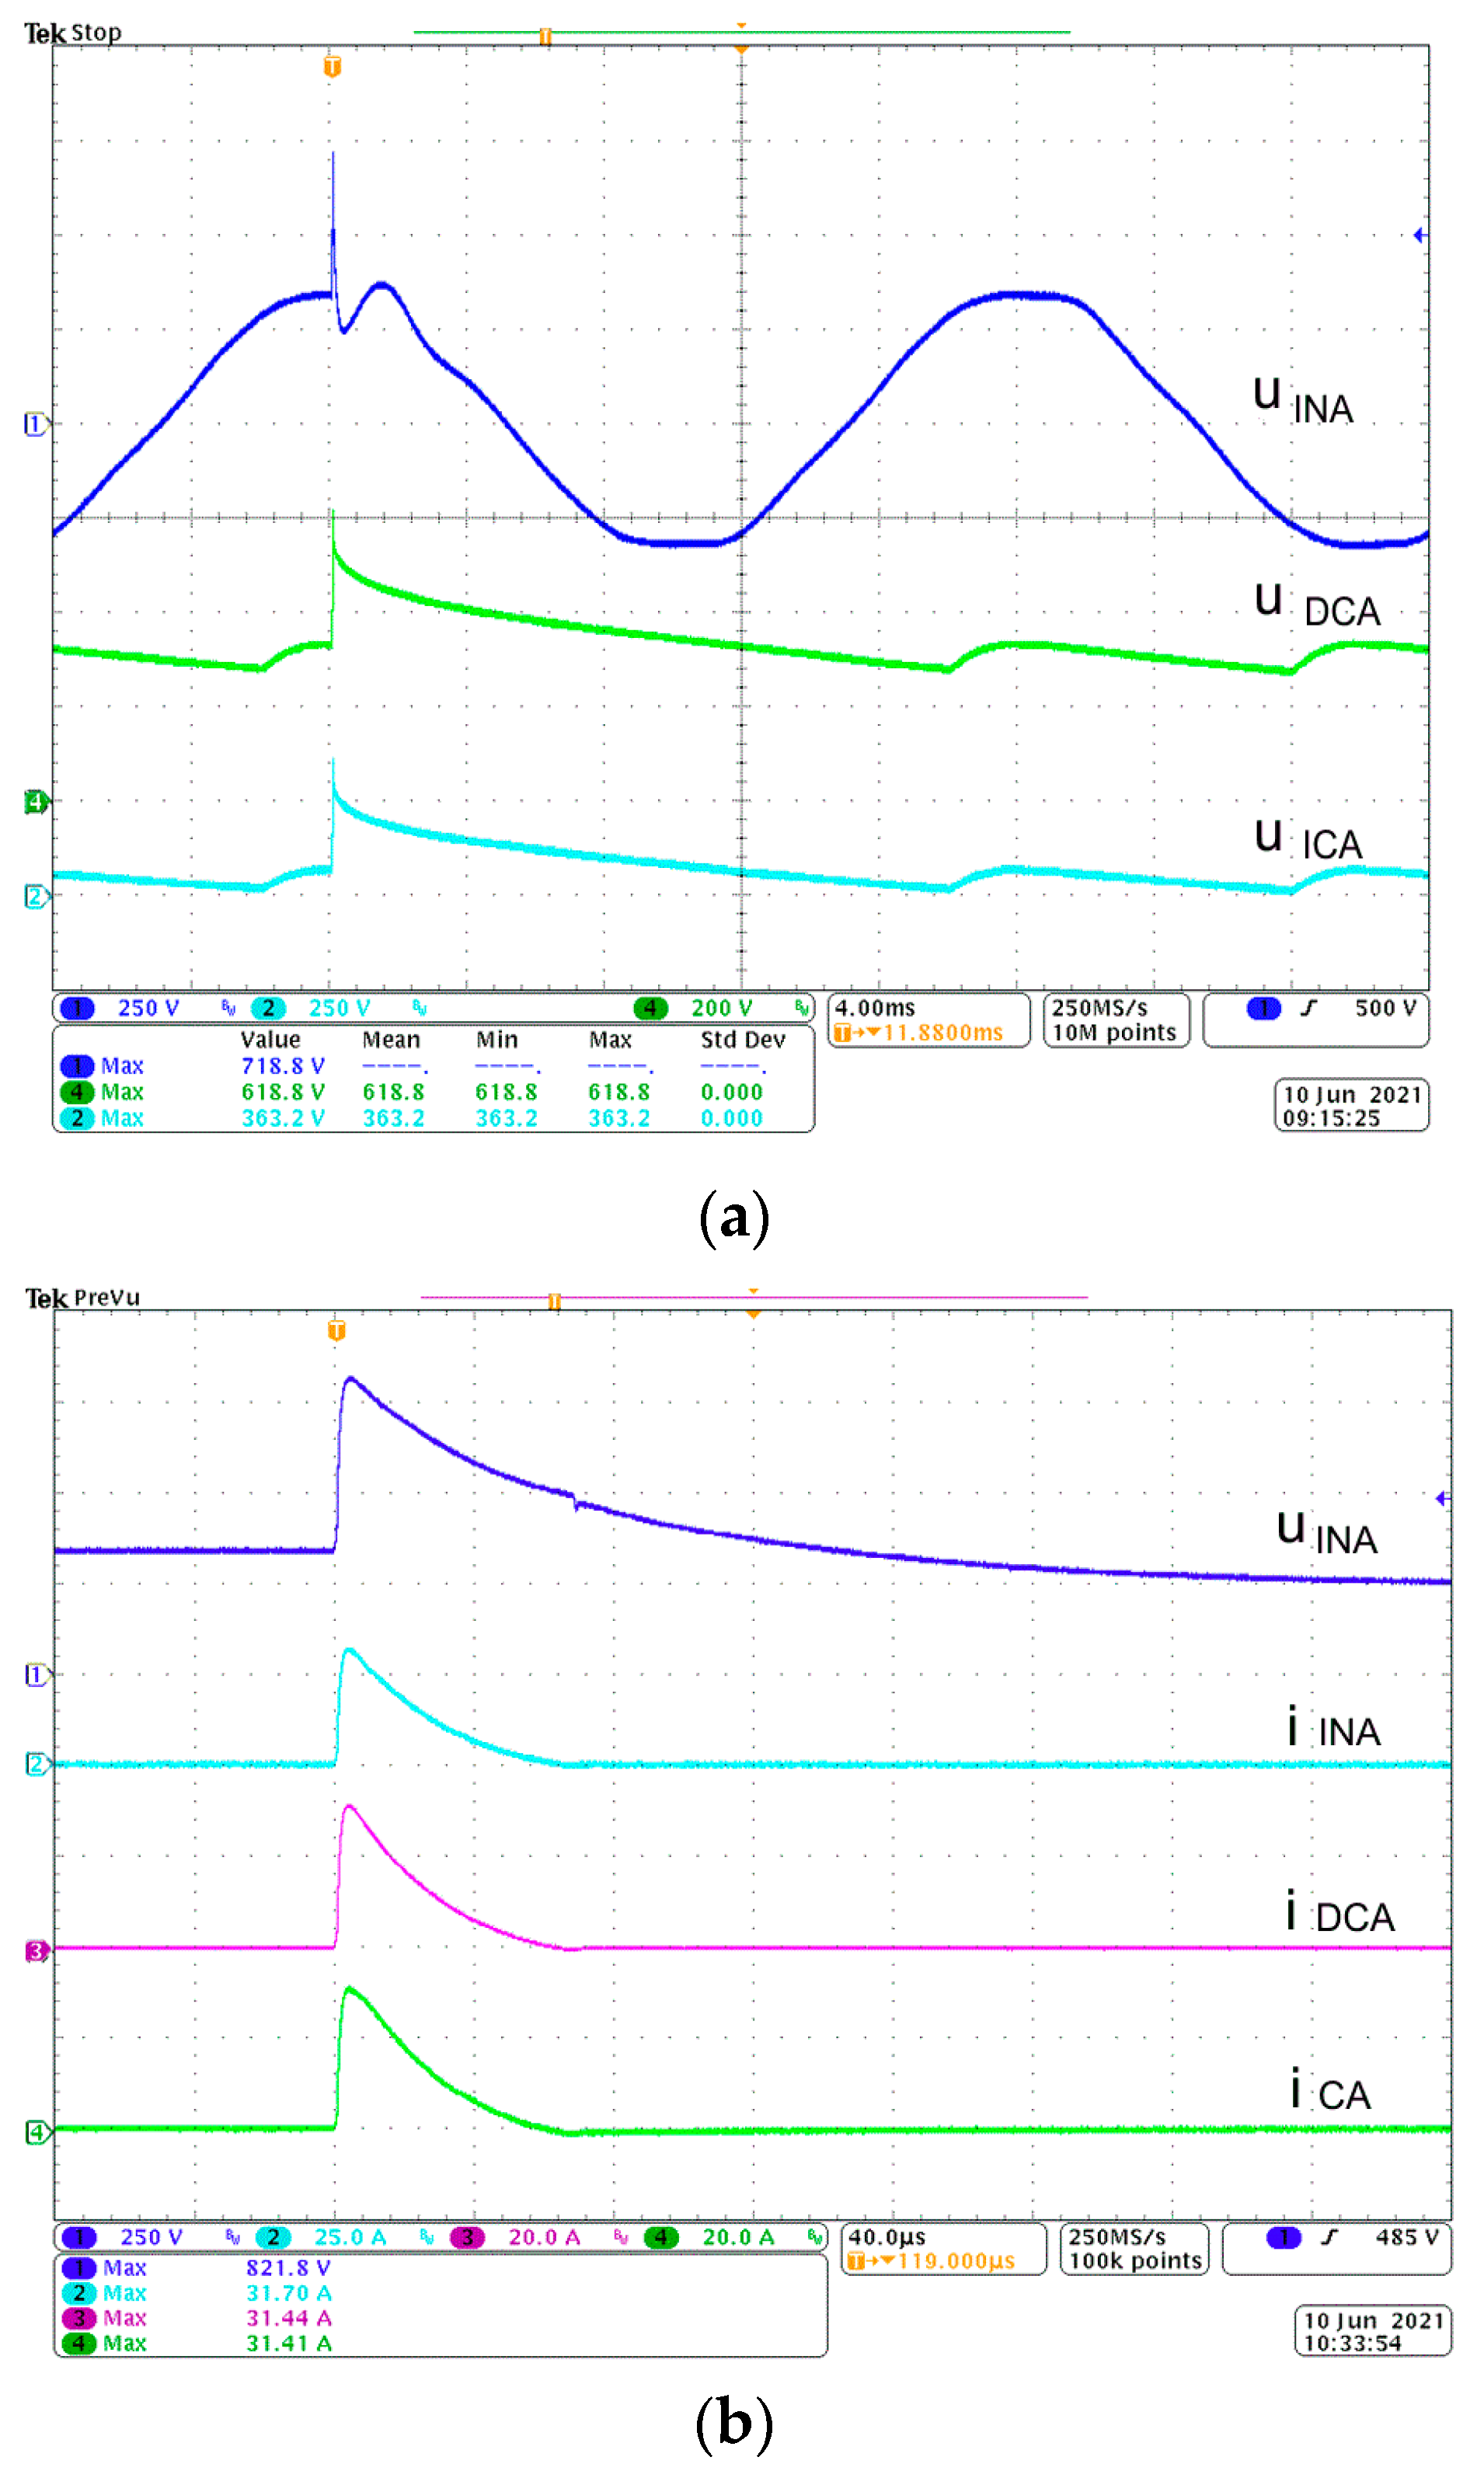
Having analyzed the obtained waveforms, it can be noticed that the surge impulse is modified by passing through individual elements. The voltage waveforms at the characteristic points of the power supply system for the tested lamps A and B are presented in
Figure 3a and
Figure 4a. The u
INA, u
INB curves show the voltage waveforms at the input terminals of the tested lamps; u
CA, u
CB at the terminals of the electrolytic capacitor and u
ICA, u
ICB at the terminals of the current stabilizer. The waveforms of currents i
INA, i
INB, i
DCA, i
DCB, i
CA and i
CB caused by a disturbing pulse are illustrated in
Figure 3b and
Figure 4b. The energy carried by the surge is transferred to the capacitor C. This condition leads to a temporary increase in the voltage at its terminals. This transient state lasts from one mains voltage period for lamp A to two periods for lamp B. This excitation state is accompanied by a current surge of 60 µs for lamp A and 40 µs for lamp B. For this surge, the circuit for i
S is closed through the resistor R
IN, bridge BR and capacitor C (
Figure 1). The currents i
DA and i
DB that flowed in the diode circuit were below 1 A (peak). Depending on the configuration of the system, the peak value of the overvoltage generated at the controller terminals is three times lower than the peak value of the surge superimposed on the mains voltage waveform and twice lower than the peak value of the voltage waveform on the C capacitor terminals. In such a situation, it can be concluded that the potential elements that may be damaged are the R
IN resistor, BR bridge, C capacitor and R
C shunt resistor.
4. Analysis of the Influence of 1.2/50 µs (8/20 µs) Surge Impulse on Internal Components of Tested LED Lamps
The second part of the research concerned the analysis of the surge sensitivity of all internal elements of each of the tested lamps. The aim of these tests was to determine for each of the elements the minimum, maximum and average value of the surge for which the elements were damaged. The knowledge of these values is helpful in predicting the probability of damage to the weakest element in the lamp as well as determining the cause of the lamp failure.
The maximum level of disturbance signal, responsible for the immunity of the electronic element, and the minimum value, which determines the sensitivity of the element, are separated by the range of values of this signal for which parametric changes in the properties of the elements are observed. The disturbance signal that reaches the electronic element transmits the energy. The energy of the rapidly changing pulses causes degradation changes in the structure of the component materials. When the level of disturbance exceeds the system compliance level, changes in the parameters of the elements become irreversible. The resistance of the resistors, the capacitance of the capacitors and the value of the threshold voltage of the semiconductor junction of a diode or a transistor change in a significant range. Changes in parameter values lead to parametric changes in the properties of the system made of these elements.
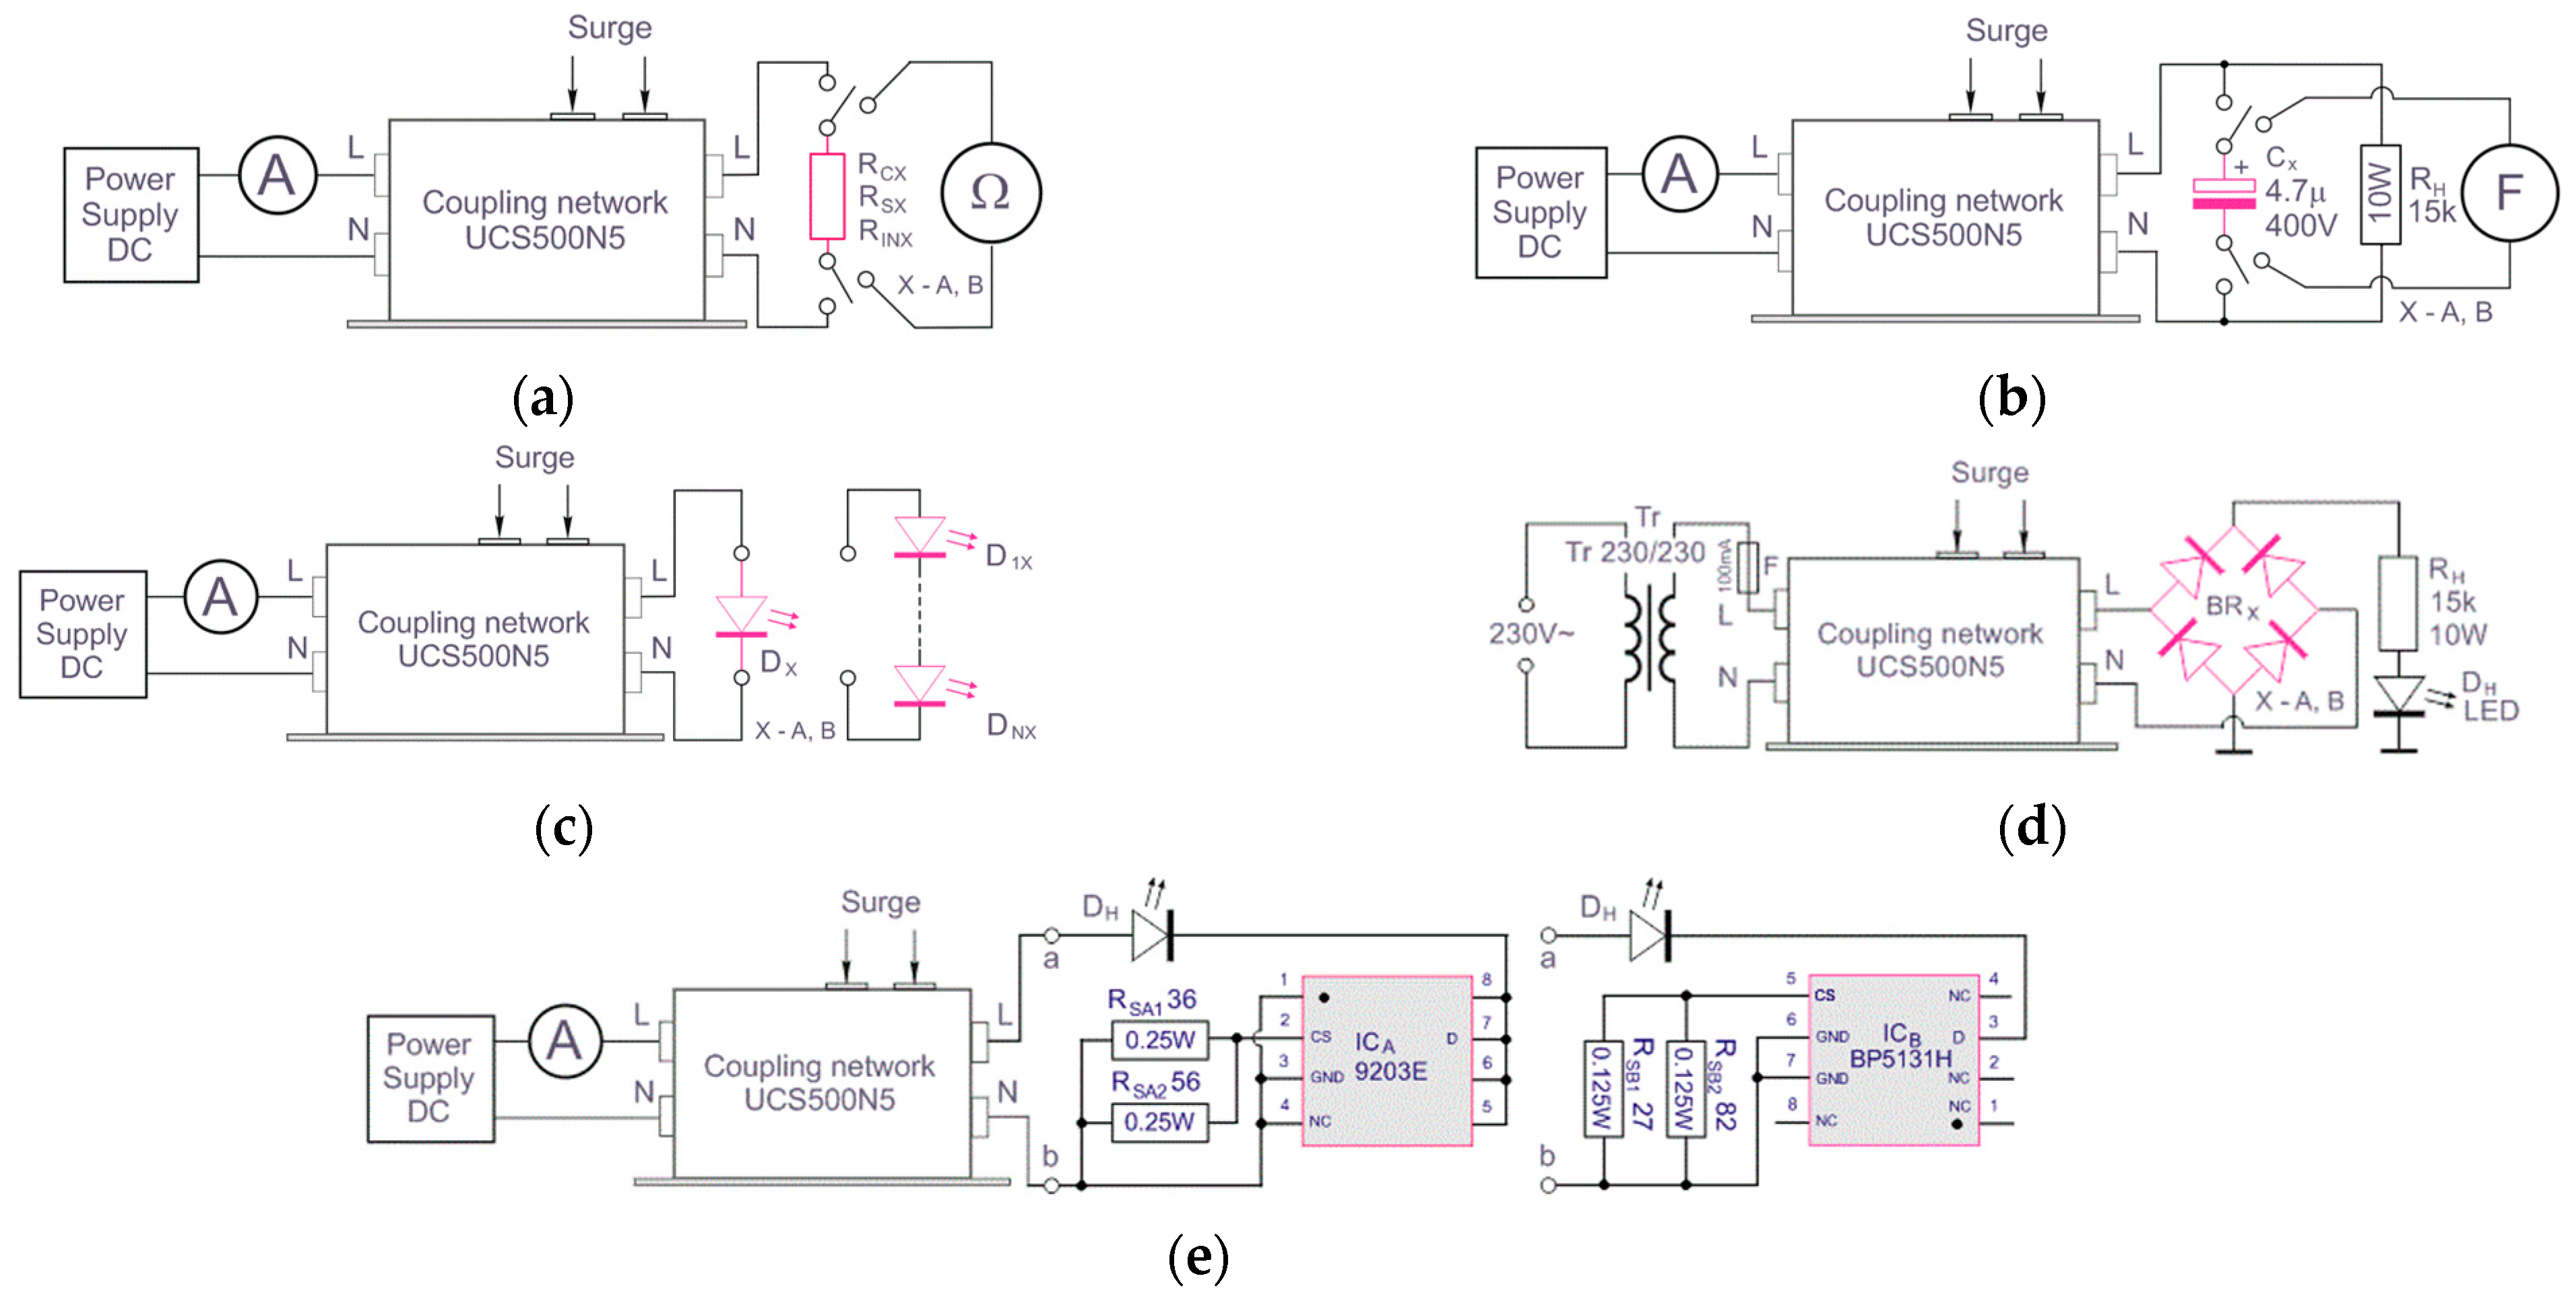
In order to determine how each of the components of the tested lamp reacts to surge impulse, 15 LED lamps of type A and B were randomly selected for the tests. The lamps were disassembled. As a result of this operation, sets of 15 pieces of each component were obtained for each lamp. The measurement stands were built to determine their degree of sensitivity. Their schematic diagrams are presented in
Figure 5. For each of the stands, the selected element was tested in its appropriate application system. During the tests, each element of the sample was exposed by increasing the pulse level from 160 V to the critical value for which the element was permanently damaged or its characteristic parameter was outside the tolerance range. Depending on the function of the element, its characteristic parameters were examined after injection of a surge impulse. In the case of a resistor, these were its resistance, the capacitor’s capacity, LEDs and its condition of light emission, and in the case of a current stabilizer, the value of the stabilized current in the circuit. The EMTest UCS500N5 generator was used to generate disturbing signals.
Each tested resistor was exposed to a single surge impulse during the tests. In the state of exposure, a DC current flowed through the resistor, adequate for its rated power (
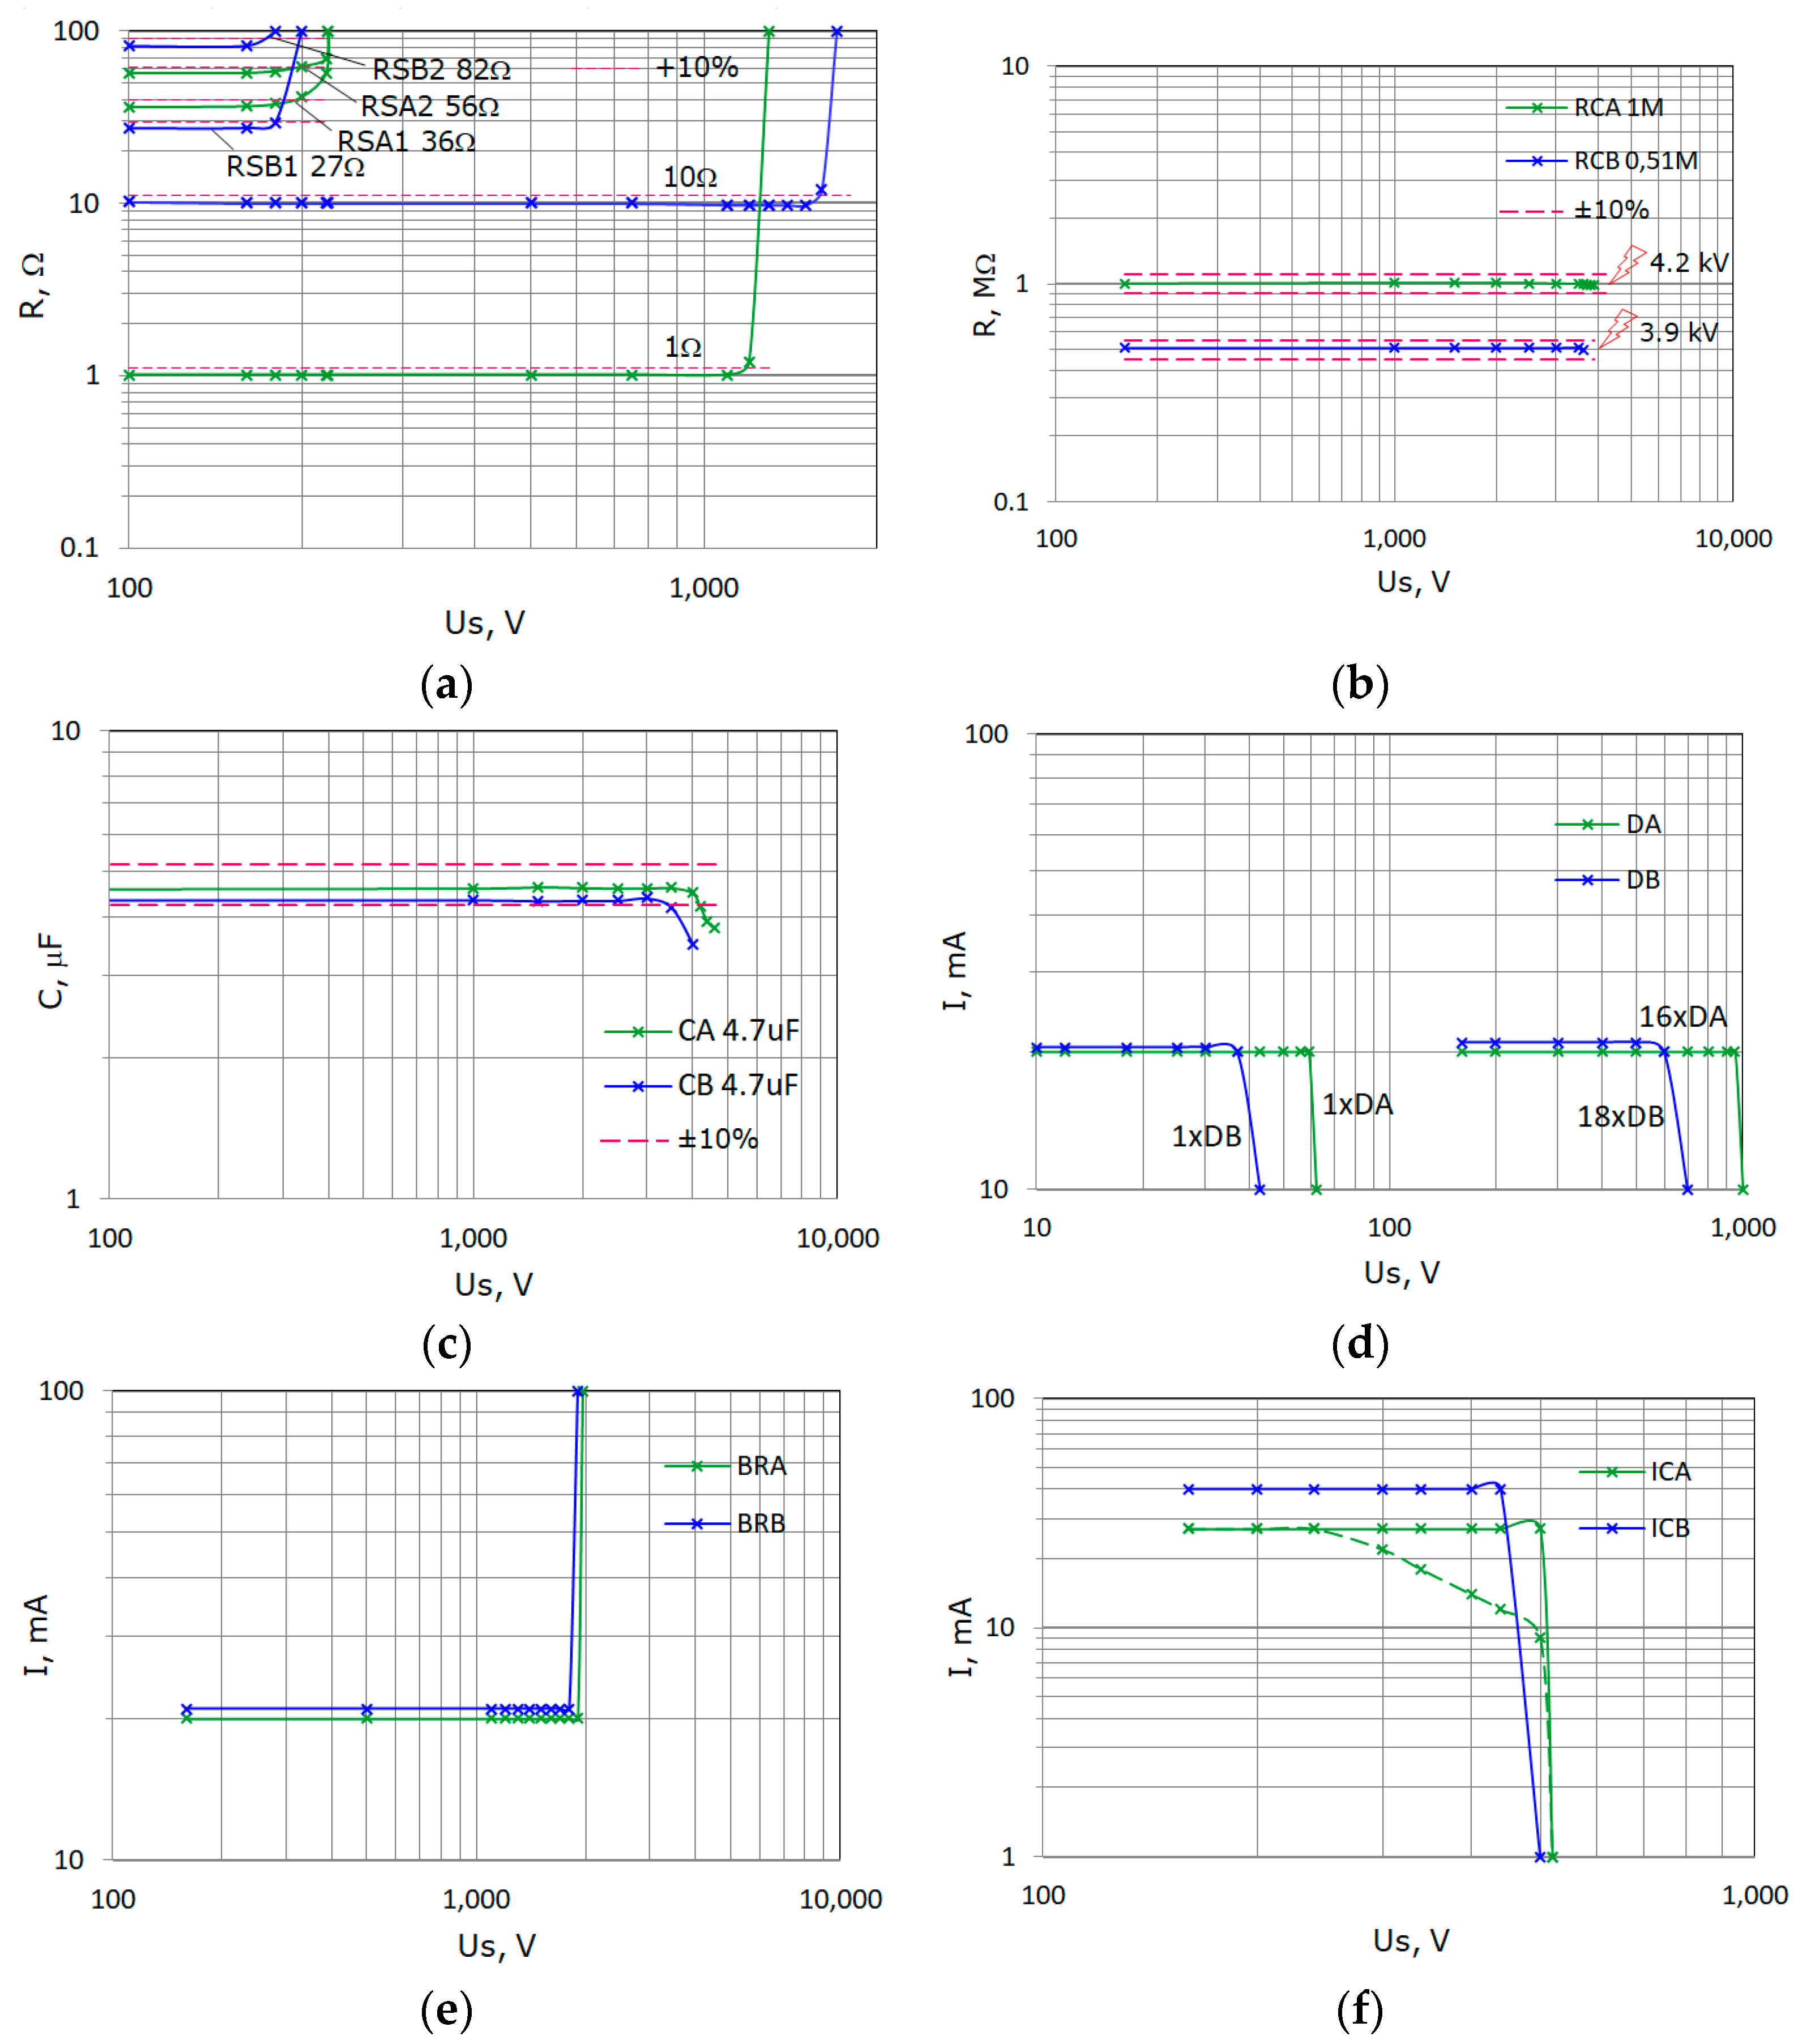
Figure 5a). The resistor’s resistance value was checked after each surge exposure. The results of the resistance value analysis for the R
INX, R
S1X, R
S2X resistors, which are integral parts of the A and B lamps, are presented in
Figure 6a. Having analyzed the measurement results, it can be observed that each resistor has a characteristic surge voltage threshold value for which its resistance exceeds the tolerance range. The state of permanent damage was the burning of the resistive layer and the appearance of a crack in it. The R
SB1 and R
SB2 elements were the most sensitive resistors. These elements had the 0805 housing allowing for energy dissipation of 0.125 W, while the R
SA1 and R
SA2 elements had the 1206 housing with the rated power of 0.25 W. The larger housing and thus the rated power of the tested resistors were reflected in their greater durability.
The test results for R
CA and R
CB resistors that shunt C
A and C
B capacitors are presented in
Figure 6b. In the case of these resistors, their resistance did not exceed the value specified by the tolerance. For the critical surge values of about 4 kV, there was a spark flashover effect between the terminals. These resistors had the SMD package in the 1206 standard.
In the case of the C
A and C
B capacitors, they were polarized with a voltage of 320 V from the DC power supply during the tests (
Figure 5b). The capacitor supply circuit on the input side of the UCS generator is protected by an automatic overcurrent fuse. As in the case of resistors, the capacitor was exposed to a given level of surge—its capacitance value was controlled. The capacitor reaching the threshold of sensitivity was synonymous with exceeding the value of its capacitance beyond the tolerance range (
Figure 6c). A further increase in the surge level to the next critical value resulted in breaking the A capacitor casing, while for the B capacitor, it resulted in increasing its volume in the upper part of the casing. The C
A batch of tested capacitors had a sensitivity of 4.2 kV, while for the C
B—3.4 kV.
The LEDs were tested with a current of 20 mA flowing through their junction (
Figure 5c). In this state, the diodes emitted the maximum light flux. Individually tested LEDs were characterized by the lowest immunity. Exposed to the minimum level of impulse of 160 V, they were permanently damaged after the first impulse. Therefore, it was decided to test them in the configurations in which they operate in the tested lamps. In the case of lamp A, there were 16 LEDs connected in series, while for lamp B it was 18 LEDs. The results of the investigations are presented in
Figure 6d.
The Graetz bridge was tested in the circuit shown in
Figure 5d. The R
H resistor in the bridge circuit forced a current flow close to the current required by the LED lamp. In most cases, for the critical surge value, the bridge housing was mechanically damaged and—as a result—a short-circuit occurred (
Figure 6e). In order to limit the effects of a short-circuit condition during the tests, the current limiting function was enabled in the power supply.
For I
CA and I
CB stabilizers, the state of their operation was identified by measuring the value of the current stabilized by the circuit. According to the application, the R
SX1 and R
X2 resistors allowed one to set the required value of the stabilized current. By automatically increasing the surge level, the value at which the system lost the ability to stabilize the current was recorded. In each of the cases, the stabilizer was in the opening state. The transistor built inside the stabilizer was permanently damaged. The D
H diode connected in series with the stabilizer indicated the stabilizer state of damage to the tested stabilizer (
Figure 6f). In the case of stabilizer A, when injecting the surge pulse into the test circuit with the stabilizer, it responded to its value. At the time of injection of the surge, the stabilizer reacted by reducing the current flowing through the diode. After the surge had subsided, the current assumed the nominal value. After reaching the critical impact value, the stabilizer was permanently damaged. It led to an open circuit. This effect is illustrated by two curves for system A (
Figure 6f). System B did not respond to surge to the critical value.
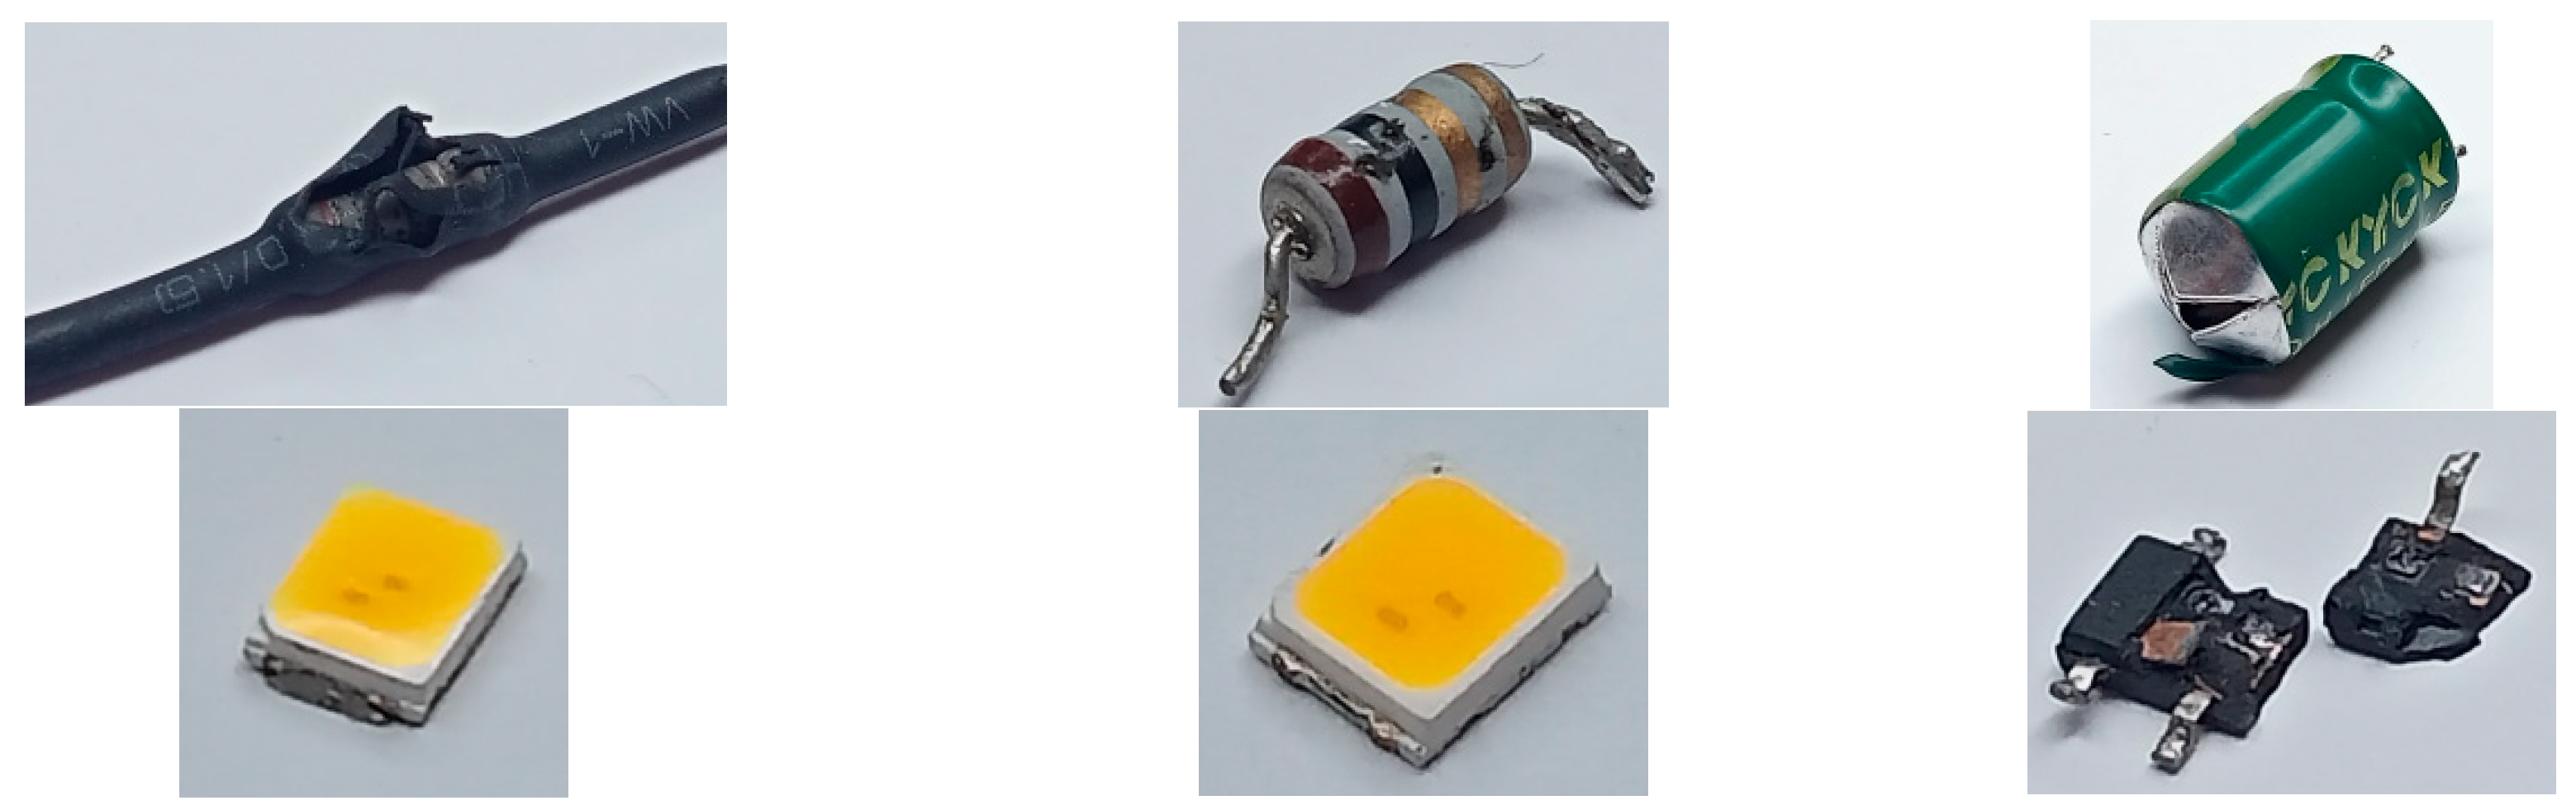
The photos for selected, tested elements with the effects of the influence of surge with a critical value are presented in
Figure 7. In the case of the resistor, the effect of the burnout of the enamel layer protecting the coating of the resistive layer is visible, whereas for the capacitor it is the tearing of the package, the LEDs, the characteristic burnt point of the structure, and the bridge, damage (tearing) of its package. As for the stabilizers, no effects of their mechanical damage were observed. This was due to the low level of surge, for which they lost the ability to stabilize the current as a result of damage to internal, unidentified elements of the chip structure.
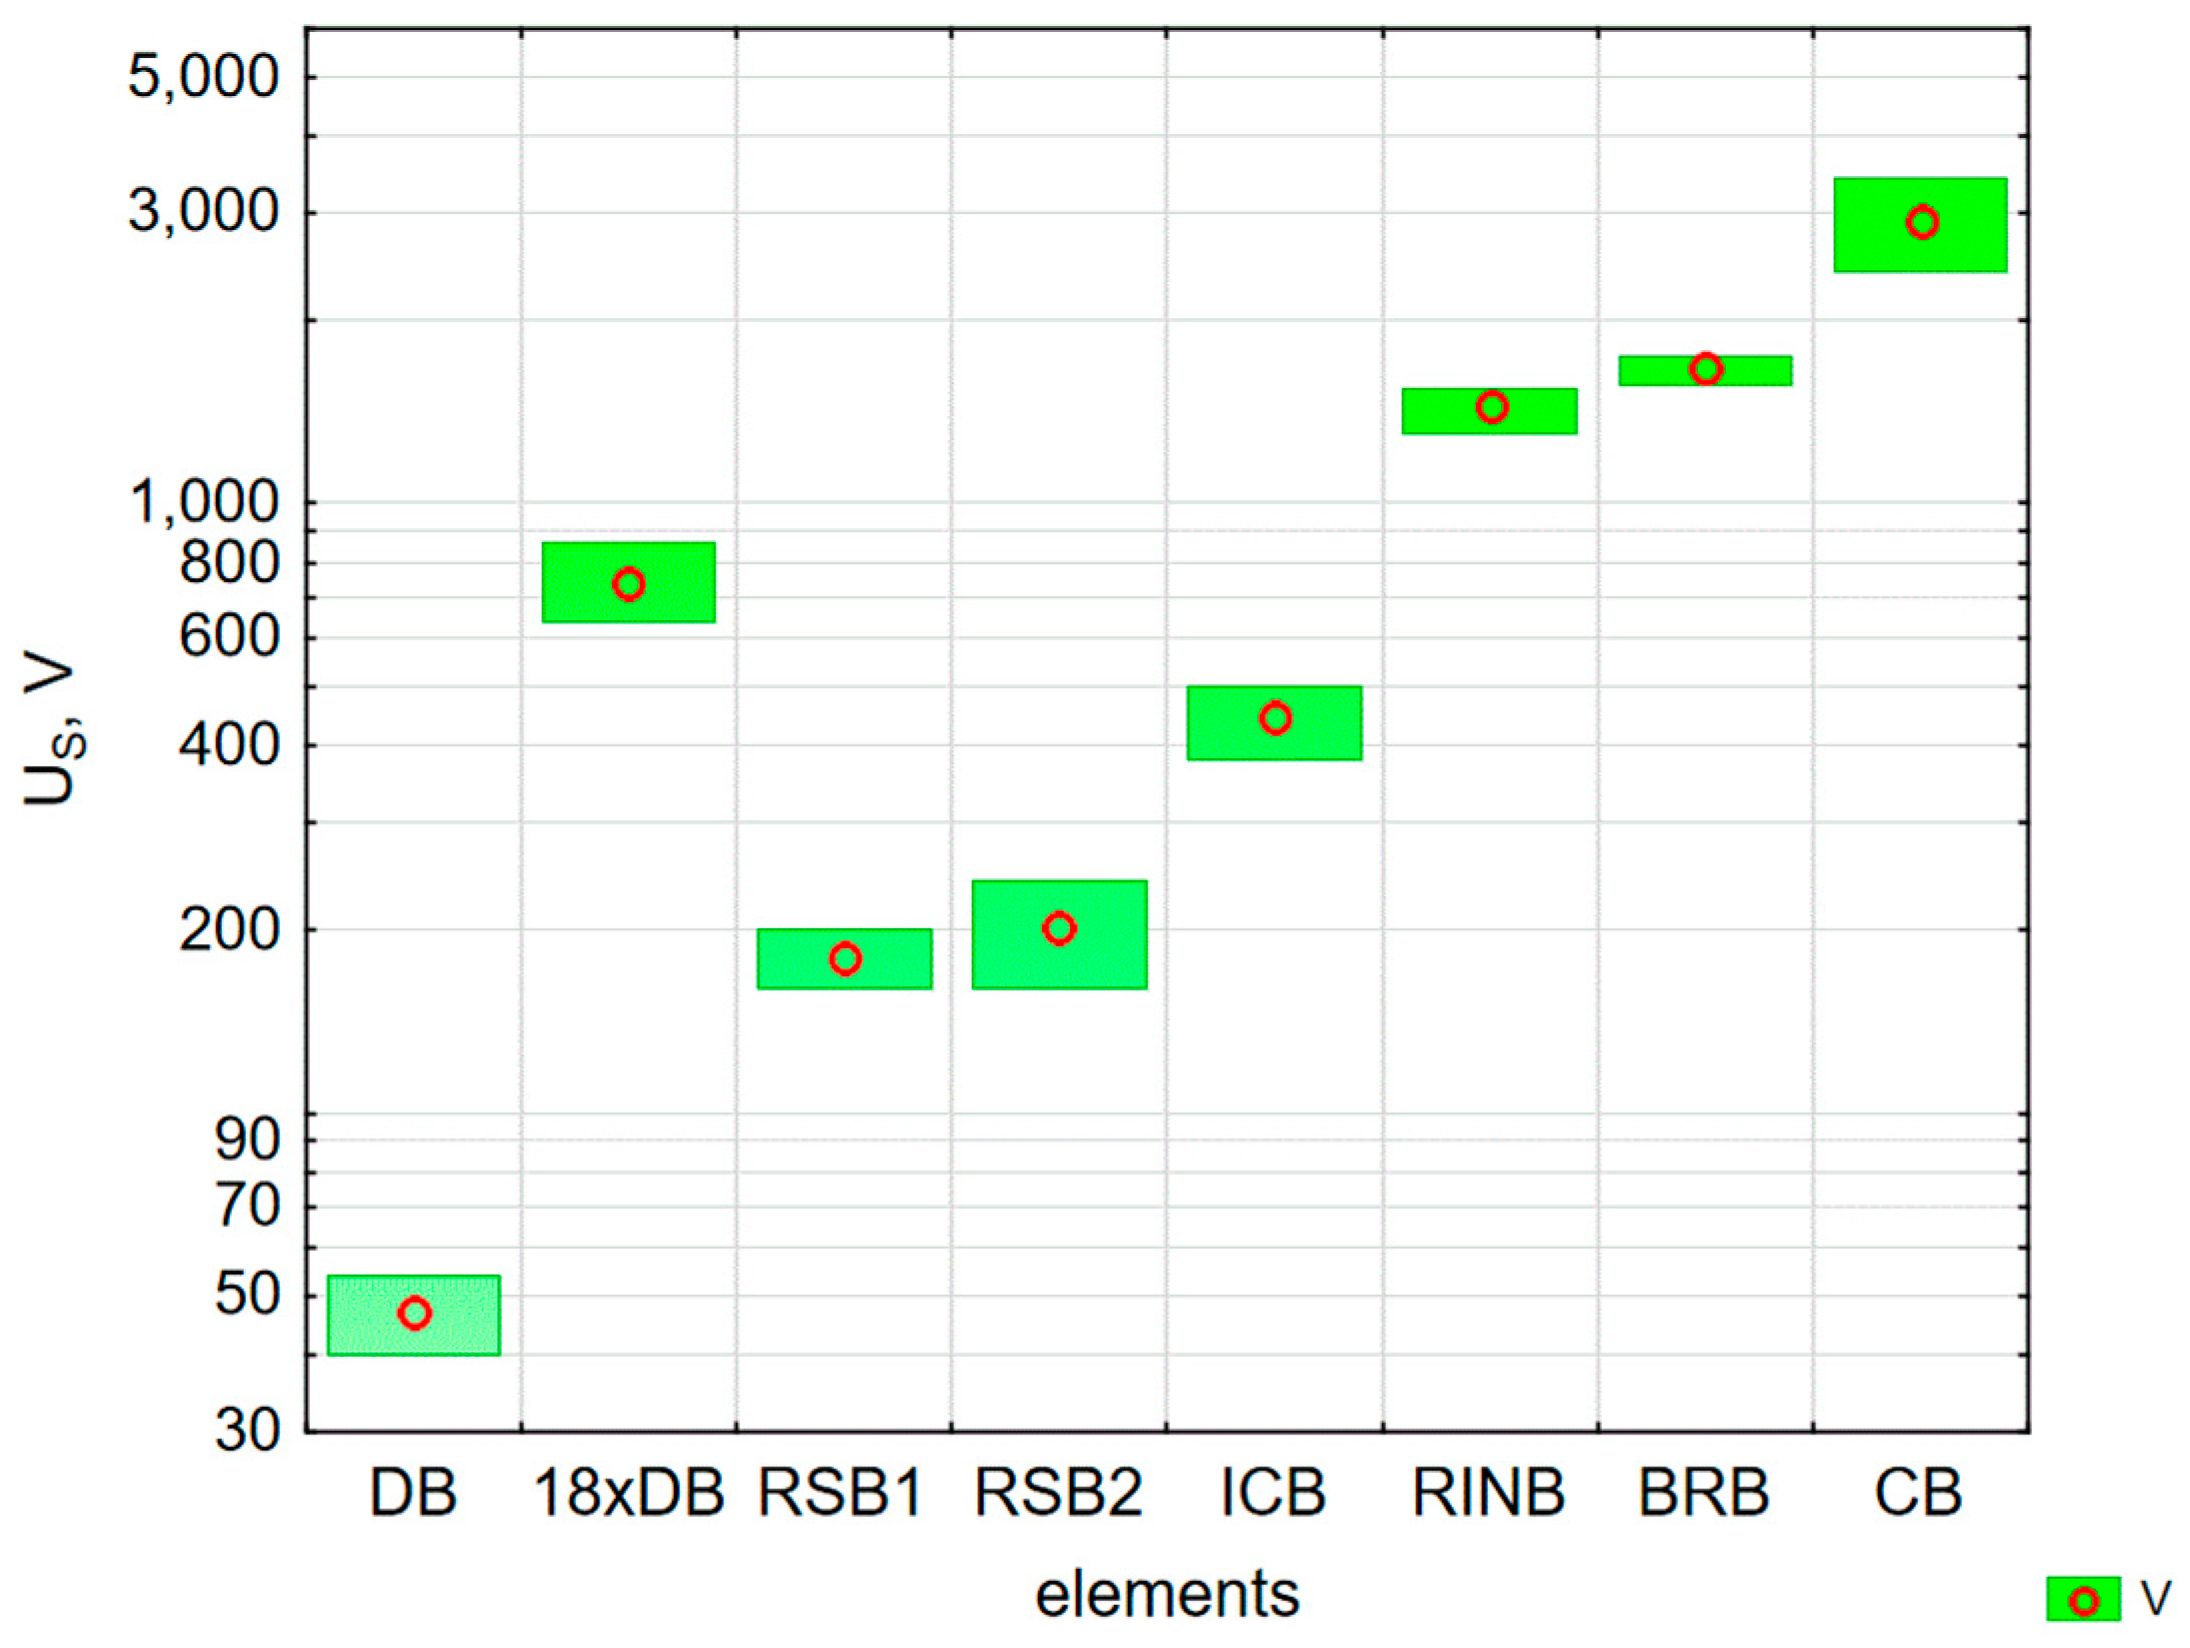
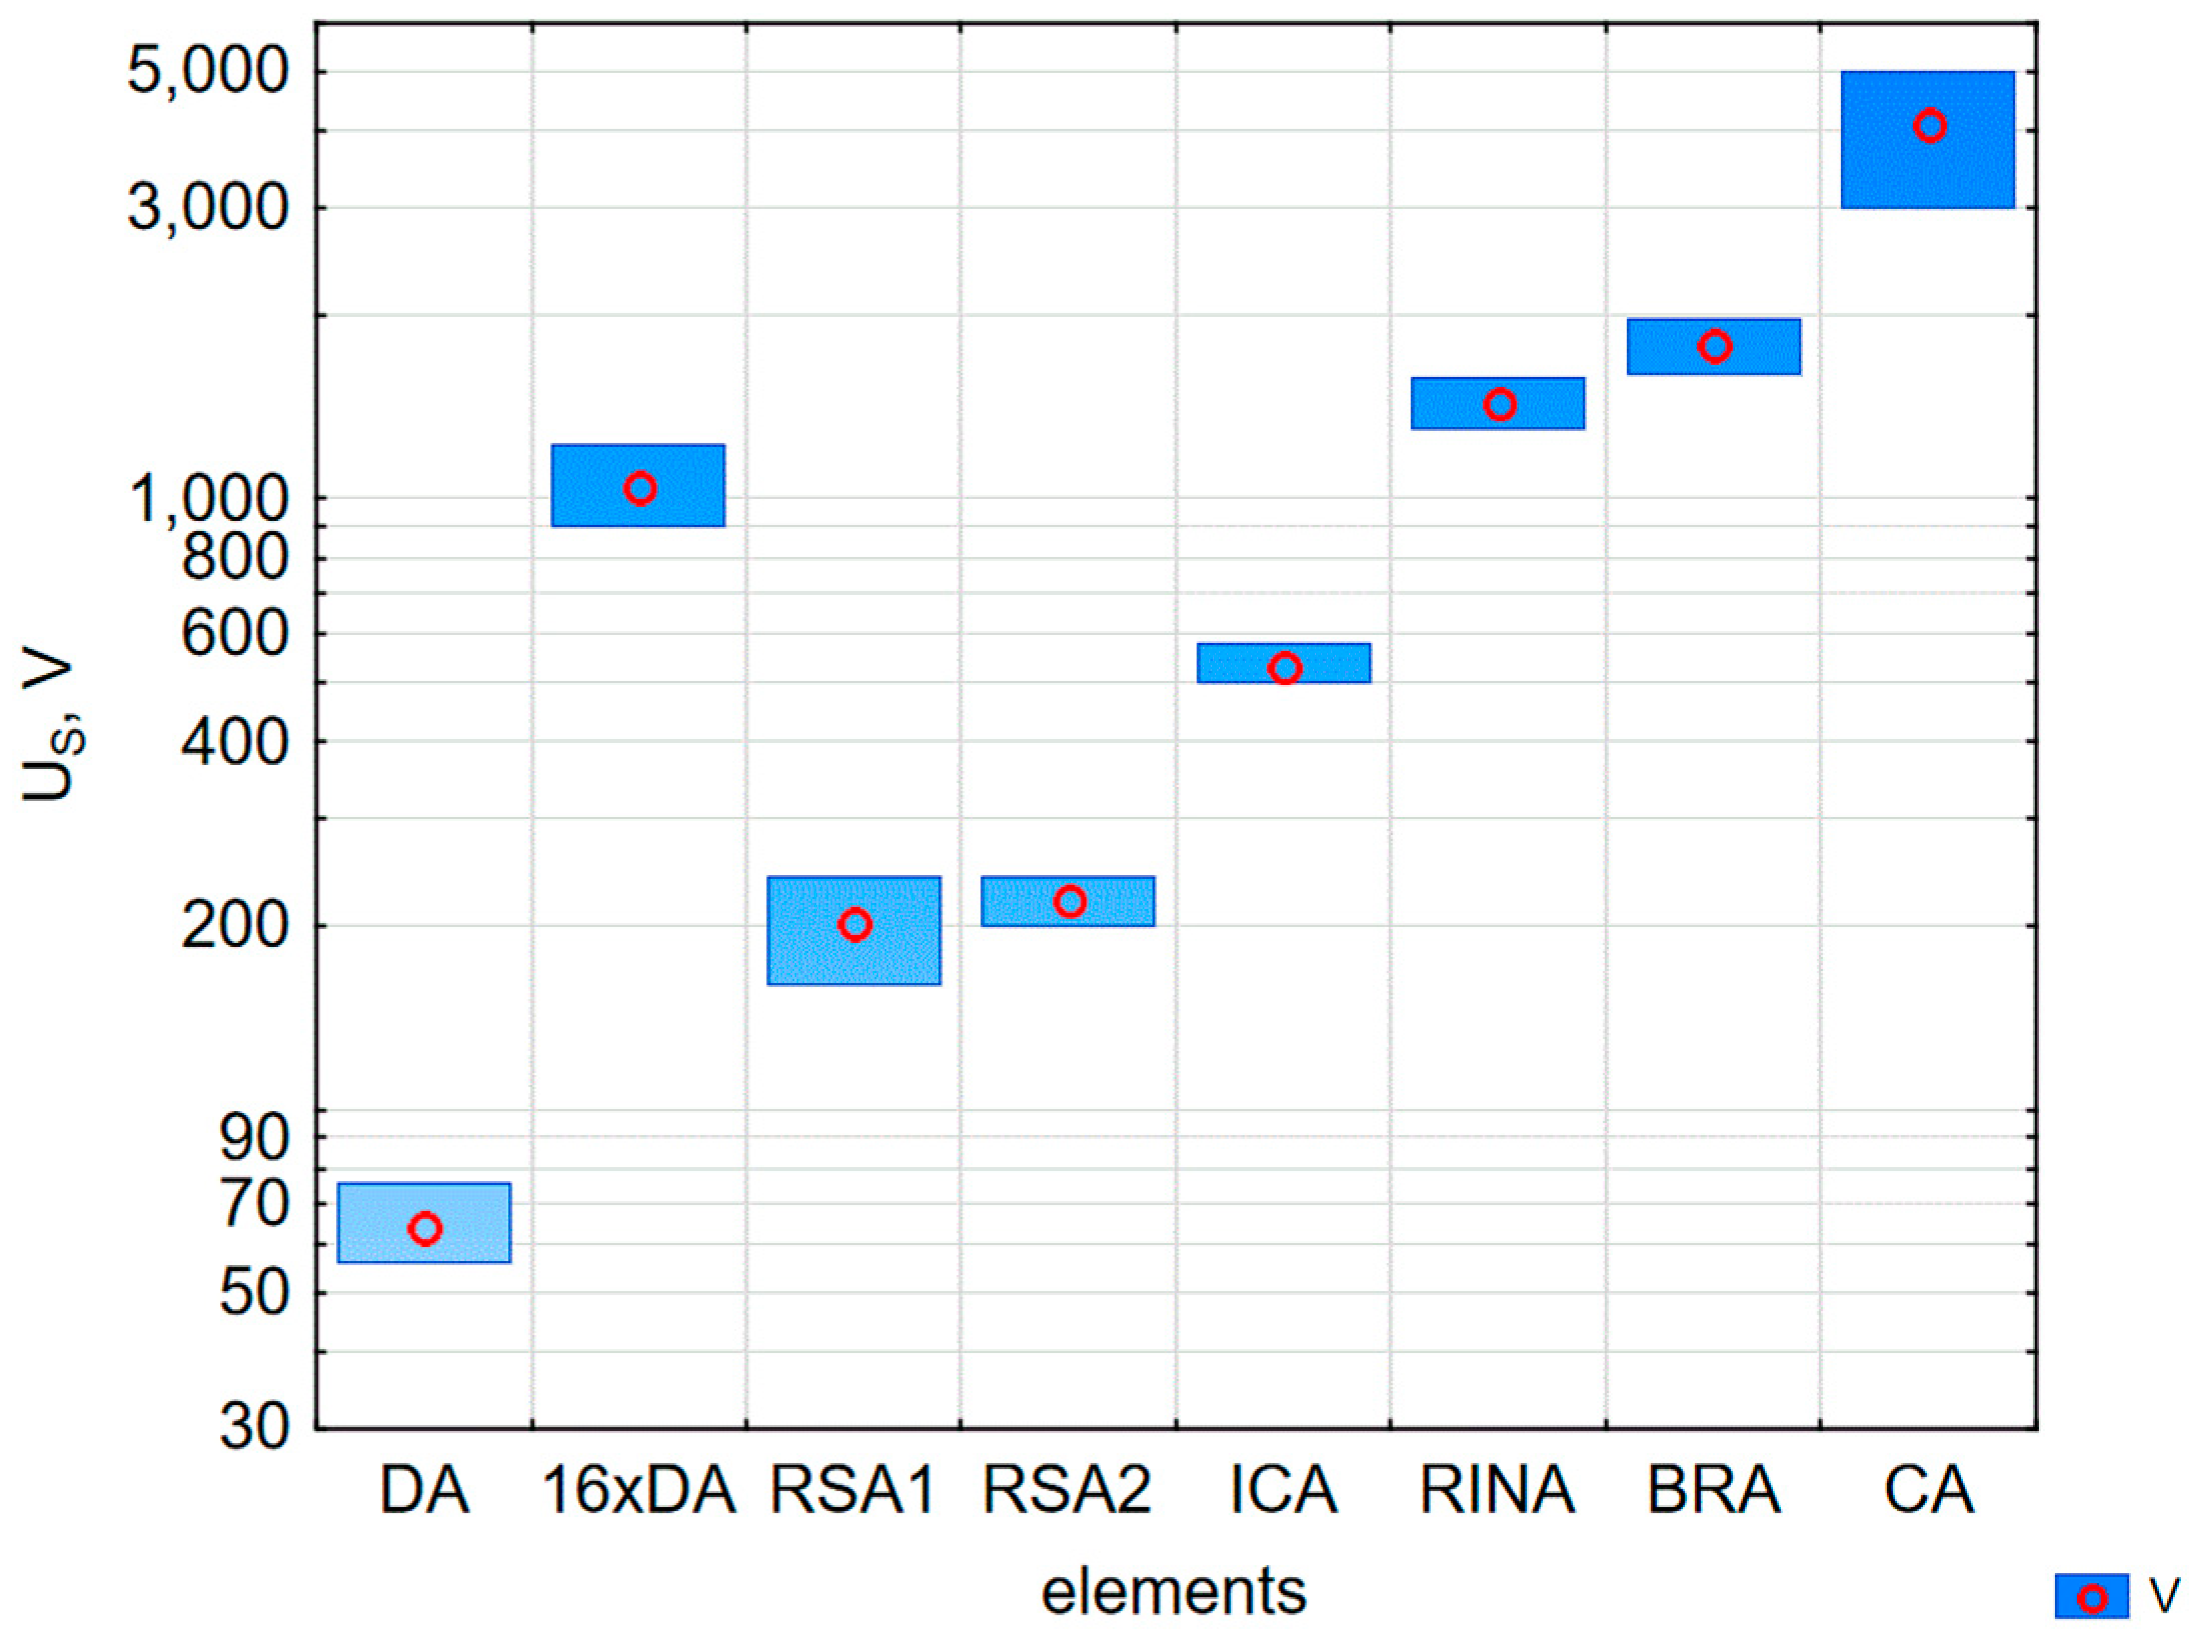
The research was carried out on 15-element groups of each integral element. The results are random. Each of the elements has its own characteristic way of losing the ability to operate properly. The resistors permanently changed their resistance and the capacitors permanently changed their capacitance. When these components reached resistance/capacitance outside the tolerance range, they were considered damaged. Semiconductor elements, i.e., diodes, rectifiers and current stabilizers, were permanently damaged and lost their functional properties. The minimum, maximum and average values of the surge for which the parts failed were specified for each 15-element group. The results of the sensitivity tests of integral elements for A and B LED lamps are presented in
Figure 8 and
Figure 9, respectively.
When analyzing the obtained results, it can be noticed that each of the elements has a strictly defined range of values for which the elements are damaged. Relating those results to the impulse value required by the EN 61547: 2009 standard (red line in
Figure 8 and
Figure 9), current setting resistors have immunity thresholds below the value described in the standard. However, series-connected LEDs ultimately have this threshold above the boundary line. In the case of the B LED lamp, its stabilizer was characterized by a sensitivity below the required threshold.
Additionally, and in particular for those relating to the elements that have a level of immunity below the level prescribed by the requirements of EN 61547, it could be concluded that they should be damaged first. However, their location in the structure of the system and the distance from the disturbance penetration point is essential for the correct operation of the element.
5. Statistical Analysis of the LED Lamp Damage Process
The last step of the research was the analysis of the LED lamp damage process when the surge level was changed. The aim of the investigation was to determine the threshold of its sensitivity to the disturbance and to identify the elements that led to the damage of the lamp in the event of its failure. The effect also allowed us to verify the results of the tests for individual elements and to indicate their participation in the destruction process of the whole device.
The results of the tests carried out on representative random samples of 150 light-emitting diode (LED) A-type lamps and 150 light-emitting diode (LED) B-type lamps are presented in
Table 2 and
Table 3. The minimum number of a randomly drawn sample was estimated using the Statistica program. For the assumed significance level α = 0.05 and the accuracy of the estimation of the number of failures d = 1, the sample number for lamp A was 127 pieces and for lamp B 148 pieces. During the tests, each batch of 150 LED lamps was divided into ten random series of M = 15 lamps in which—at disturbance levels close to the critical value—the number of damaged N lamps was analyzed using an alternative classification method. Each of the series of M = 15 lamps was exposed once to a surge of 1.2/50 µs with the same U
S level generated by the EMTest UCS500N5 generator. The tested lamp after exposure to a critical disturbance value was considered to be operational if it retained its basic functional properties after the exposure. The inefficiency assessment was done visually. At the moment of injection of the surge, each of the lamps reacted with a momentary change in the intensity of illumination with a duration of less than one second. After the disturbance finished, it returned to its normal operating state, unless it was a critical value. On the other hand, the state of damage was determined by the type of lamp tested.
For the A-type lamps, the effect of permanent damage was observed in the U
S range from 1900 V to 2600 V. Only one lamp failed for the exposure level of 1900 V, while all of them were damaged for the value of 2600 V. Upon injection of the critical surge, lamp A was permanently damaged and broke. In some samples, an audible crackling effect was heard from the inside, accompanying the physical damage to the weakest element. It was the R
INA resistor in most cases in lamps A. The destruction of its resistive layer led to a circuit break and the lamp went out. For U
S values above 2200 V, the effect of arc discharge was audible from the lamp for some samples. Physical damage to the B
RA bridge was observed. A crack in its package was most frequently visible (
Figure 7). Referring to the test results obtained for individual elements, one can ask why the weakest elements were not damaged. As shown in
Figure 1a, the surge current I
S flows along the path with the lowest impedance. In the case of lamp A, this path consists of: the R
INA resistor, the BR
A bridge and the C
A capacitor. Elements such as R
SA1, R
SA2 and D
A diodes are protected by their connection method. The surge energy flows through the R
INA resistor, the BR
A bridge and the C
A capacitor. This is the reason why these elements are mainly damaged.
In the case of the B-type lamps, the process of permanent damage was different from that of the A lamp. The first damage was observed at the level of 800 V, and for 1200 V all lamps were damaged. For surge values from 800 to 900 V, the lamps were damaged in such a way that the level of the lamp’s luminous flux dropped to 5–10% compared with the efficient lamp. The lamp shone, but with very little intensity. Having inspected these devices, it turned out that their LEDs were damaged. Most of the time, one to three LEDs were damaged in a row. The failure of one LED caused the fading state of all other LEDs in the series. The damage in this type of LED occurred due to their greater sensitivity to surge (
Figure 9). For an impulse level of 900 V to 1200 V, an additional lasting effect appeared in the form of increasing the intensity of the light beam generated by the lamp after exposure to the surge. It was caused by damage to the LED in such a way that the threshold voltage dropped when the LED emitted the maximum luminous flux. In the tested lamps, the LEDs had a threshold voltage of 18–19 V. In the case of their damage, the voltage ranged from 13 V to 15 V. For lamp B, the effect of damaging the R
INB resistor was very critical. It was accompanied by the effect of a sparkover, a short circuit and the activation of the overcurrent protection located in the generator supply circuit. Inside the lamp, it was possible to observe the destruction effect near the R
INB resistor and the BR
B bridge.
The process of damaging LED lamps is a stochastic process, but as has been shown in the research, it is characterized by a certain regularity. For each device, in this case LED lamps, it is possible to define the minimum level of disturbance at which they will be permanently damaged and the maximum level for which all of them will fail. Statistically, the process of their damage for the examined random sample is similar to the normal distribution. Nevertheless, the failure of the elements included in the tested group can be illustrated by a theoretical and empirical distribution. This state was confirmed by the analyses run in the Statistica program with the use of the available distribution analysis.
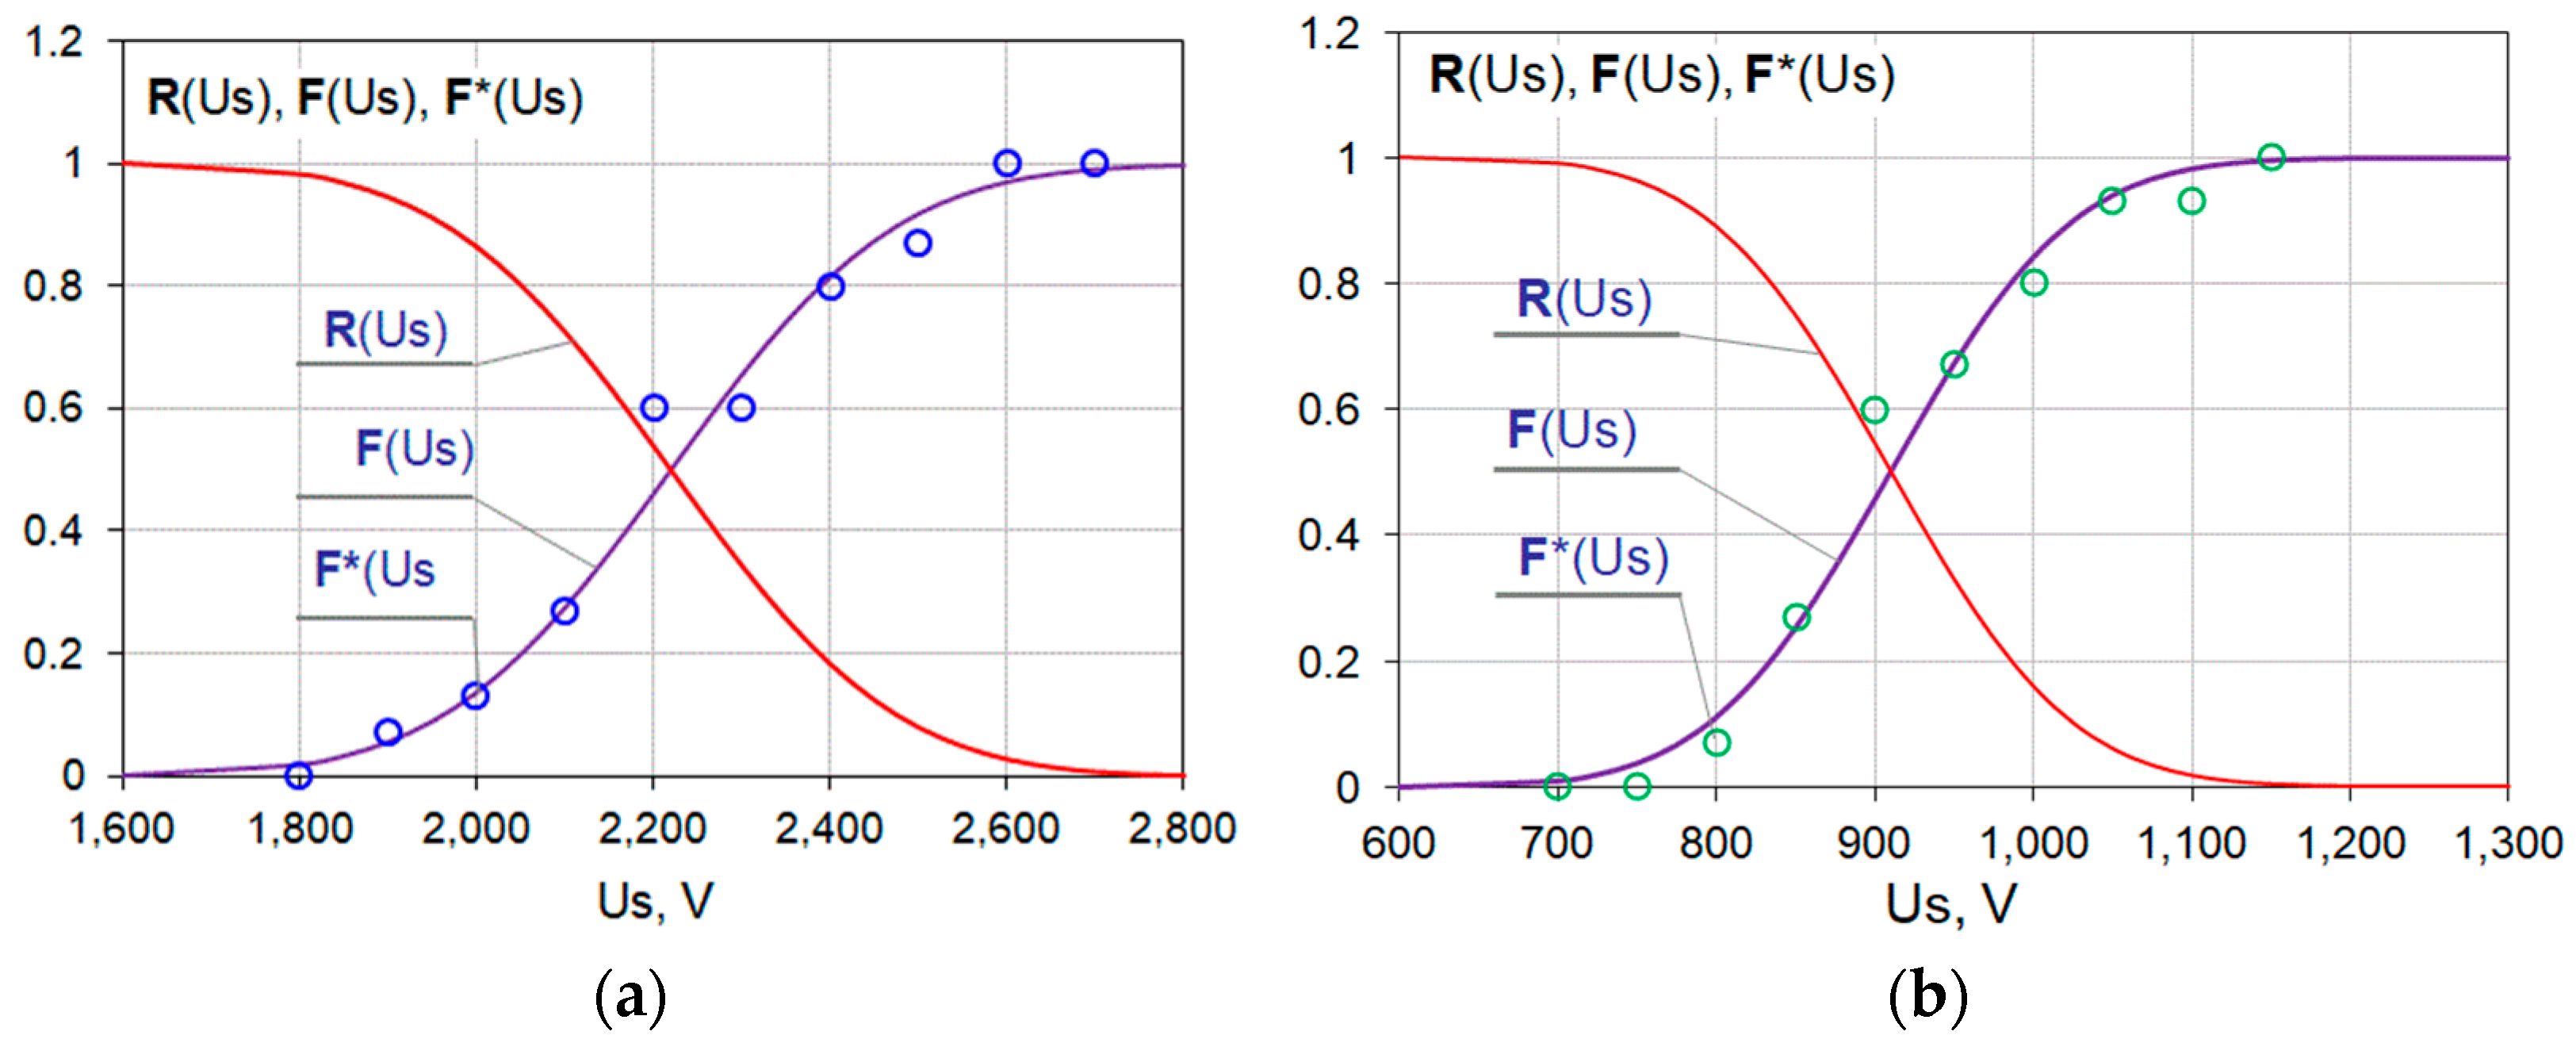
As a result of the course of the empirical F *(Us) and theoretical F(Us) distribution function (
Figure 10), the number of damaged lamps in a given set increases with increasing surge level. Automatically, the R(Us) = 1 − F(Us) function shows how the probability that the lamp fulfills its assigned operation function decreases. The analysis in the Statistica program (
Table 4) was made for the empirical data presented in
Table 2 and
Table 3. As the results of calculations indicate, the LED B lamps were sensitive to surges in the range of 700 V to 1200 V. The average value of the exposure voltage was 930 V. The LED A lamps were sensitive in the range from 1800 V to 2700 V of disturbance value. Despite the differences in the exposure values, a similar number of failures were obtained, i.e., 8 and 7.9 for LED A and LED B, respectively.
The same applies to the calculated values of the standard deviation. It should be noted that the LED B lamp, despite the longer manufacturer warranty, was more sensitive to the surge impulse of 1.2/50 µs (8/20 µs). The data included in
Table 4 are sufficient to define the immunity factor for lamps A and B on this type of disturbance. Knowing that the lamp damage process follows the normal distribution and knowing its parameters, i.e., the mean and standard deviation, the immunity factor of lamps A and B can be written as:
WIS LA = (2250 V, 303 V)
WIS LB = (930 V, 160 V).
With its value known, it is theoretically possible for each disturbance value to determine the probability of permanent damage of an element, device or system (in this case, tested LED lamps). If the failure process is of a normal distribution, then using the commonly known relationships describing it, it is possible to determine the probability density function, the failure intensity function and the cumulative failure intensity. These functions allow us to characterize the process of damage to an element, device or whole system.
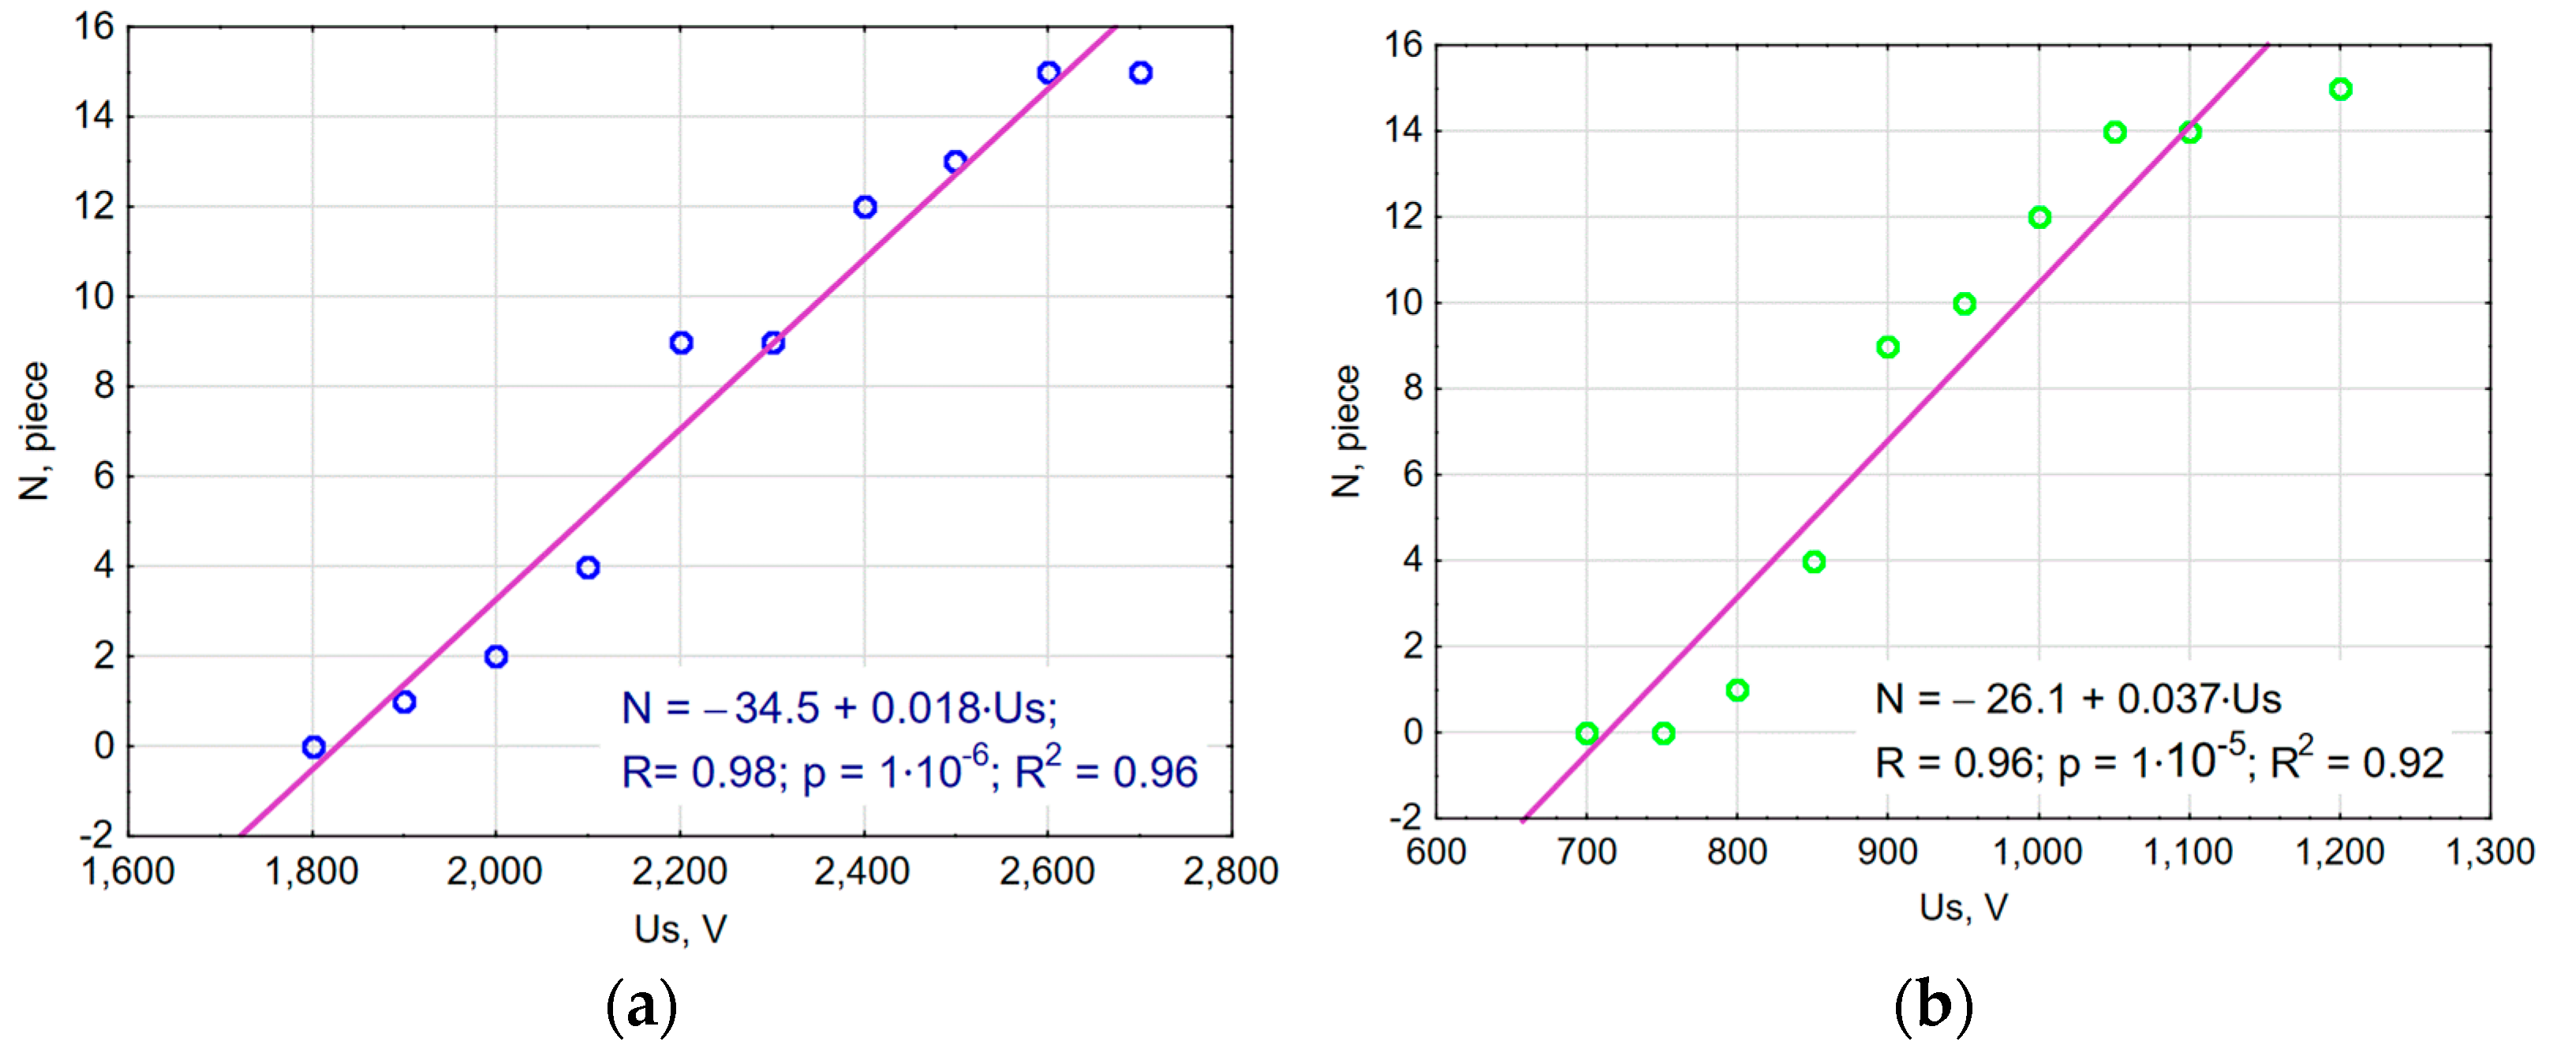
Additionally, a linear correlation analysis was made for the obtained data in the Statistica program. It showed that the number of failures strongly depends on the value of the surge voltage. The correlation diagram of the scattering of the amount of obtained damage (dependent variable) and the surge voltage value (independent variable) is presented in
Figure 11. The Pearson linear correlation coefficient obtained for lamp A has a positive value of R = 0.98. This means that increasing the surge value increases the number of damaged LED lamps. The calculated determination coefficient R
2 = 0.96 indicates that the number of damaged lamps is approximately 96% dependent on the value of the applied disturbance voltage. On the other hand, from the linear regression equation of the number of failures N = −34.5 + 0.018·Us, it can be calculated that an increase in the exposure voltage by 100 V will increase the number of damaged lamps by 2 pcs.
6. Conclusions
The analysis of the impact of a normalized surge impulse of 1.2/50 µs (8/20 µs) on the operation of LED lamps has shown that each of them has a strictly defined level of sensitivity to this type of disturbance. Exceeding the critical value of the surge led to an increase in their permanent damage. Despite the fact that each of them had a similar electronic circuit, they were fundamentally different in range of sensitivity (1900 V for lamps A and 800 V for lamps B).
Statistical calculations of the damage process for the batch of 150 LED A lamps and 150 B lamps indicated that the process has a normal distribution and can be described using statistical functions. Using these characteristics, it is possible in a simple way to characterize the immunity of the device to a determined type of disturbance. Having calculated the mean value and standard deviation, it is theoretically possible to estimate the failure probability of the tested element and all the quantities characterizing this process, i.e., the probability density function, failure intensity function, cumulative failure intensity, etc.
The tests carried out on the stand in accordance with the requirements of the EN 61000-4-5: 2014-10 standard for the 0.5 kV impulse level specified in the EN 61547: 2009 standard showed that each of the LED lamps tested met its requirements. However, the margin that separates lamp type A from the level specified in the standard is 1300 V, while in the case of lamp type B, it is as low as 300 V. In many cases, in a network that is not adequately protected against impulse disturbances, the level of these disturbances can be much higher. Therefore, the B type lamps, despite a longer warranty period and being made of higher-class components, will not necessarily be able to perform their function even during the warranty period.
As presented in the paper, the weakest elements on the surge path where the energy of surge is transported will be potentially exposed to possible damage. The presented analysis of the sensitivity of LED lamps to disturbances can be applied to any device or system. The assumptions of such a generalization and the mathematical basis for the developed method of estimating the reliability level of exposed devices will be the subject of another publication.


