1. Introduction
Intelligent manufacturing is an important application under Industry 4.0. In particular, after the outbreak of the COVID-19 pandemic, the monitoring system can be quickly set up through Artificial Intelligence Plus the Internet of Things (AIoT), and the management can be conducted remotely, for the purpose of reducing the cases of human-to-human transmission. Specifically, in response to the rise of the Internet of Everything (IoE), factories generally construct SCADA systems based on the IoT. This study proposes a safety stock management model (i.e., the VMI), with a view to improving the utilization and the on-time delivery of the factory itself. In addition, the AI prediction is conducted by interfacing with the product sales data of downstream manufacturers. Thus, the consumption of key materials and inventory requirements can be effectively estimated; when necessary, the manufacturer can actively report the quantity demanded to upstream key material suppliers, so that they can quickly provide sufficient inventory. This is also the intelligent application of intelligent factories in Industry 4.0: C2B safety stock services that integrate the value chain.
In the past, the production mode of the factory was that after the retail industry placed a purchase order to the manufacturing industry, the factory would schedule the production line for production, then issue the manufacturing order, and place the orders for materials separately, and the operation process was all manual operation. However, with the popularization of AI and IoT technologies, the C2B model has also emerged. C2B stresses the customer engagement business model, and the customer engagement C2B model would take the application of AIoT as the implementation model/approach. In the C2B model, firstly, the sales data of downstream manufacturers would be collected from the factory side through IoT services, which would be combined with SCADA data for analysis. Then, AI is used to estimate the usage of key materials and indicate whether they are sufficient or not (the notice is sent to upstream manufacturers or connected to upstream manufacturers’ MES/SCM systems). This allows us to achieve a management model of key materials safety stock, improving the on-time delivery of production lines, and implementing the C2B service model that integrates downstream manufacturers. In this study, under the model of C2B integrated manufacturing order arrangement and management, SCADA is used to acquire information on the production line capacity, and combined with the sales prediction of downstream manufacturers, the usage of key materials and parts can be accurately estimated, thus practicing the management mode of C2B safety stock of key materials.
2. Literature Review
In the production model of consumer electronics, the manufacturing industry takes orders and then the factory manufactures the consumer electronics. However, in the future, the production characteristics of electronics will gradually move towards a trend of small-quantity but diverse electronics, which requires the ability to adjust the capacity of the production line with high flexibility. In the manufacturing industry, it is a standardized process to manufacture products after taking orders, for the purpose of delivering the products on time. In particular, the key raw materials for the products are generally stocked, because if there are no key materials in the production process, the production will be seriously delayed. However, the procurement specialists of different factories procure raw materials from the supply chain partners. In addition to long procurement times and slow response times at the supply side, there is no standard for raw material preparation quantities. These problems may cause excess inventory or insufficient material preparation, thus increasing the cost of the supply chain. The manufacturing industry has also begun to assist production management through various information and communication technologies (ICTs): predicting the quantity of materials demanded based on the orders of downstream manufacturers, which is an application that uses sales prediction to assist in estimating capacity requirements. In the past, the prediction model was mainly manual, which also resulted in the application effect of prediction in most enterprises being lower than expected [
1]. Generally speaking, the manufacturing industry cannot grasp the sales status of downstream manufacturers. If the quantity of key materials cannot be estimated, it will cause the hoarding or shortage of key materials. The hoarding of materials would increase the cost of the enterprise, while the shortage of materials would make the enterprise unable to deliver the products on time. Thus, the enterprise would lose its competitiveness [
2].
The production processes in the manufacturing industry consist of such steps as order taking, material requirement exploration, material and part management, material procurement, factory production, transportation management, and delivery. However, from the perspective of the strategy of the entire product value chain, the manufacturing industry responsible for production in the value chain should establish close integration with upstream suppliers and downstream customers to form a collaborative supply value chain. Collaborative Planning, Forecasting, and Replenishment (CPFR) [
3,
4] is a value chain collaboration model. CPFR focuses on efficiency, so the practice of Just-In-Time (JIT) is promoted and discussed [
5,
6,
7]. JIT can reduce costs and waste, while it can increase flexibility and many interactions [
8,
9,
10], such as delivery time and delivery quantity.
In addition, from the perspective of the manufacturing industry, the manufacturing industry is facing the trend of market globalization. The manufacturing industry does everything possible to reduce the costs of production and product development. Therefore, predicting the upstream material quantity based on the downstream orders is a collaboration that saves manufacturing costs, and it is also regarded as a C2B [
11,
12] model. This is particularly true for consumer electronics due to the high market volatility. Furthermore, the degree of digitalization of the manufacturing industry is not high, the basic environment is still in great demand, and the establishment rate of intelligent software is not high. Therefore, the top priority for using CPFR in the manufacturing industry is to transform the traditional supply chain into digital and intelligent information and communication services [
13,
14], interface the systems, and use the joint prediction model to predict the material inventory [
15], with a view to improving the efficiency of collaboration.
In terms of safety stock management, some studies have used the PHLX Semiconductor Sector Index to predict the safety stock [
16], which is a method of analysis and prediction based on the financial index. There are also related academic studies that use various indicators to analyze the material inventory, which is taken as a management model, but this mode is difficult to apply to the production of products that have nothing to do with financial indicators. In addition, the preparation time and delivery time of the order, the delivery time of the goods, and the preparation time of the goods are known as the lead time of the order, and the lead time can also be used as an estimation model for safety stock [
17,
18]. Analyzing the safety stock from the supplier’s operation processes, using the relationship between industry indicators and demand [
19], and so on, are all related research topics within safety stock management. The tools used include MACD [
20], calculation of the demand index (DI) [
19], and exponential moving average (EMA) [
21].
This study proposes a mechanism based on CPFR to predict the safety stock in light of the orders or sales data at the downstream of the value chain, the utilization of the production line, and the usage of key materials. In this study, the basis for safety stock is sales prediction. With respect to a literature review on the studies on sales prediction, some scholars proposed the grey correlation analysis, in which the analysis is conducted by combining with the neural network [
22]; in addition, [
23,
24] other scholars also proposed a new prediction model using the evolutionary neural network, the effect of which is better than that of the traditional neural network. Compared with the ARIMA prediction method [
25], the fuzzy logic rules [
26,
27,
28], as well as the inference mechanism [
29,
30,
31] and the statistical model, the neural network does not need to specify a specific function type, and the data are not limited to a certain statistical distribution assumption, thus having more application space in the prediction. The data used for these analyses will be sales data at the downstream of the value chain, the data collected by IoT devices in factories, and the data from SCADA [
32,
33,
34] monitoring systems. There will be no shortage of key materials under the safety stock prediction model of this study.
3. Proposed Architecture and Method
In this section, the overall framework of safety stock, the pre-processing of data analysis, and the prediction model will be explained.
3.1. System Framework
The SCADA system is important and essential in improving the production yield, digital transformation, and data retrospect of the manufacturing industry, and enhancing its competitive strengths, etc. However, in a traditional SCADA system, due to factors such as the fact that the consoles on the production line cannot provide the Application Programming Interface (API) and it is not easy to implement function expansion and subsequent maintenance, it is difficult for small-sized manufacturing industries to accept the traditional SCADA framework. Therefore, the construction of a cloud-based SCADA system, suitable for traditional small- and medium-sized manufacturing industries, would help the manufacturing industry to conduct operations management. To take the framework of the Internet of Things as the foundation, i.e., to transmit the data sensed and collected by the Internet of Things to the application layer through the network (i.e., the cloud-based SCADA system), is to improve the traceability of production data. The method proposed in this study can estimate the production capacity based on production data and, combined with the data of downstream manufacturers, conduct sales predictions. Predicting the required inventory based on the AI analysis of the data, the production line can maintain a high utilization rate.
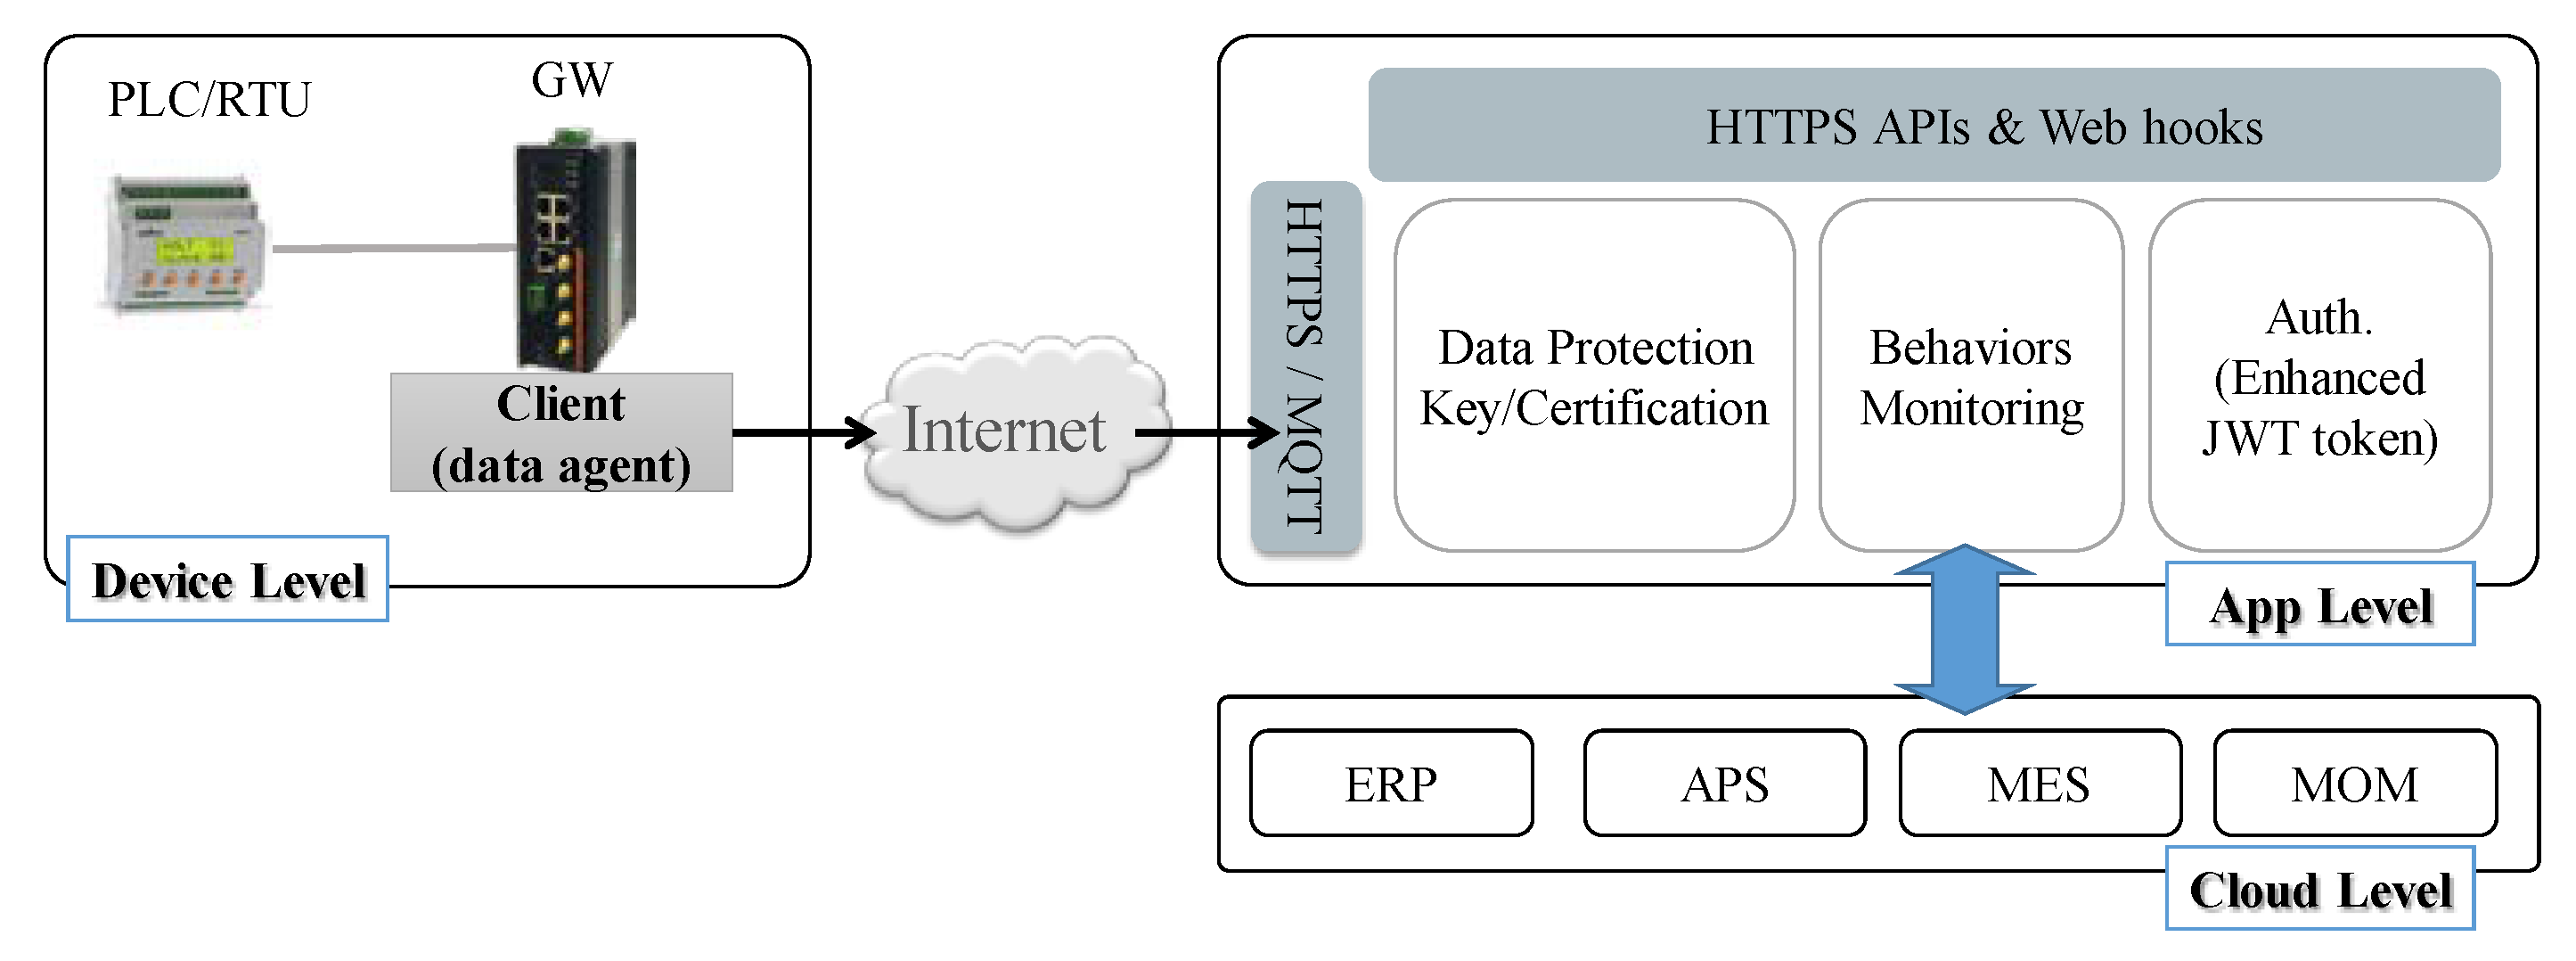
The overall framework proposed in this study consists of two parts, as shown in
Figure 1. The first part is the cloud-based solution for SCADA; the purpose of the SCADA solution in this study is to collect production process data in order to estimate production capacity, which includes the required IoT hardware and the corresponding real-time monitoring system. The second part is to intelligently analyze and estimate the required key materials by integrating the sales data of the suppliers, so as to provide the purchase reference for safety stock.
The first part is the cloud-based solution for SCADA. At the device level, the online IoT sensing device of production would transmit the data back to the SCADA system through the client data agent application, which would be set up on the gateway (GW). In order to identify which networked device senses and collects the data, the client data agent application has a simple pairing mechanism. In addition, in order to more easily manage the data collected by the client data agent application at the device level, the SCADA application includes authentication and behavior monitoring, etc. As shown in
Figure 2, the factory side uses a variety of IoT devices for monitoring. Various sensing devices have different signal sources and data formats, different network addresses, and even different temperature units (Fahrenheit/Celsius). Previously, to solve this problem, it was necessary to write customized reading methods and control instructions for each IoT device on the GW side and convert the data format correctly. In this study, it is designed to standardize various signals and data formats and interface the signals through agents. The work items related to the device agent application interface are as follows:
Analyze the device control signals and data signals (sequence signals). Develop the application for processing the underlying serial communication at the firmware layer, read different device communication interfaces according to different serial communication properties, and process control signals and data signal sequences, as well as maintain the status of intelligent devices, record the occurrence of events, and process error exceptions.
Normalize the read and write formats and customized instructions, and design the data sheet. Design the standard data/instruction data format. Textualize the data read content. Do not judge the data content, but provide them to the upper level for processing. For the received instructions, decompose them in accordance with the specifications, and transmit them to the corresponding signal control layer.
Determine the GW intermediary data format. Implement the upper layer data processing and control instruction logic, and convert the standard instruction into the corresponding address of each intelligent device. Then, provide the upper layer application, which can, through function calls, easily perform device setting, device testing, data reading, status notification, control instruction transmission, and instruction execution result return, without considering the actual corresponding address of the device.
In the upsurge of the COVID-19 pandemic, there are still hackers who continue to invade information systems, which causes security concerns. If the centralized authorization mechanism of the information system is used for MQTT devices, the OAuth-based framework can be used. OAuth 2.0 supports decoupling authorization servers from resource servers (such as MQTT servers). When one uses OAuth 2.0, the client would provide its credentials to the authorization server, which then performs authentication checks and returns the access token that allows access to the resources, and then the access token is used to connect with the MQTT server. The MQTT server typically validates the access token by communicating with the authorization server, and then grants access to the resources. Each IoT gateway itself is associated with an independent unique ID, which will be used to generate a registration pairing exclusively for this IoT gateway, so that the user can directly register this IoT gateway on the cloud platform when deployed in the actual application field. In the database of the cloud platform, the datagram of each IoT gateway, including device registration model application and data format conversion, will be processed in the database. Finally, the data will be synchronized to the Data Mart of VMI Intelligent Analysis through HTTPS APIs and web hooks for analysis.
3.2. Prediction Method
Manufacturers’ factories have their own management methods. Most of them rely on on-site personnel to adjust the management methods in light of their experience. There are no data for specific improvement. It is also easy to cause instability in production capacity due to communication gaps, and it is impossible to effectively promise the delivery status to downstream customers. In this study, the data sensed by the IoT device, such as the material barcode, operator identification card, production machine number, and manufacturing order number, are transmitted back to the cloud-based SCADA system through the agent.
Then, the learning-to-rank method is used to predict the change in production capacity to estimate the quantity of key materials demanded for production. The eigenvalues of analysis are transmitted from the data collected by SCADA to the Data Mart. (
Table 1)
Because the factory SCADA has data records (log) for the materials and parts, the production capacity data of SCADA in this study are collected for 52 weeks, i.e., data covering a whole year. After estimating the production capacity of the week, an alert can be issued for the safety stock of key materials. The production capacity estimation method proposed in this study is based on the concept of AdaBoost, and a series of rough rules are weighted and combined to obtain highly accurate rules. Its advantages include the following: (1) it is easy to implement; (2) the classification accuracy is high. Its disadvantages include the following: (1) it is easily disturbed by noise, which is also a disadvantage of most sorting or classification algorithms; (2) the execution effect depends on the selection of weak classifiers. AdaBoost is most suitable for processing large-dimensional characteristic data, because it can generate detection results with high efficiency and high detectivity.
This study employs AdaBoost, which can dynamically adjust the ranking of data weights, turn the ranking problem into binary, and improve the part of updated data weights. The essence of weight is that the more the data are not classified correctly, the higher the weight of the data is. In other words, not only the order of data in the correct ranking but also the distance of data in the correct ranking are considered. Then, the data point is ranked first if the concordant is positive (representing the high ranking of the data point) and the data point has the smallest weight coefficient (the farthest from the center of gravity). The data point is ranked second if the concordant is positive and the weight coefficient is next (the next farthest away from the data point), and so on.
When it is concordant:
When it is discordant:
At the same time, the pair difference of the ideal ranking function
h* is considered, and then the difference from the subtraction represents the similarity between the weak learner and the correct ranking. The two cases of concordant and discordant are discussed separately. The learning-to-rank method is used to find out which week’s production capacity in the 53 weeks is the closest to that of the estimated week, and the closest one is ranked first. This study uses the ranking similarity as a means to estimate the production capacity. However, there is still a lack of important data to estimate the safety stock of key materials, i.e., the order quantities of downstream manufacturers. However, usually, the order quantities cannot be estimated, so this study estimates how much production volume may be required in the future from the sales prediction of downstream manufacturers, and then calculates the key materials that may be required. Because the SCADA production capacity estimation collects 52-week historical data, the sales data are also analyzed using 52-week data. (
Table 2)
Data analysis requires data normalization to compress the data. In other words, dimensionality reduction is performed through PCA, and the eigenvalues with a high correlation with the prediction target are reserved as the dependent variable of sales prediction. Among the many eigenvalues, eliminating the variables with low correlation to sales is called data preprocessing. After data preprocessing, the sales data, discount data, traditional festivals covered, and winter and summer vacations in the previous week, previous 4 weeks, previous 8 weeks, and previous 12 weeks are important variables, so they are selected as the eigenvalue variables of the prediction model.
In this study, the prediction model employs the Back-Propagation Neural Network (BPN) of artificial intelligence. BPN is used by many scholars for prediction analysis. BPN includes an input layer, a hidden layer, and an output layer. The model uses the hidden layer to convert the data of the input layer into the nonlinear function, and then the hidden layer is converted again in the output layer. BPN has been used in research in other fields. The steps used in this study are briefly described as follows:
Training stage hidden layer:
and
,
.
The output is , .
is the output vector, ΔW is Wij, which mimics the strength of the connection between the i-th and j-th neurons, and δ is the amount of difference between the processing unit connected to W and the upper-level processing unit.
In the validation stage, the error function of the network is minimized, and the learning quality of the model is generally adjusted by using the formula error function. In this study, the execution result of the proposed prediction model is compared with the usage of key materials in the production line capacity prediction. After deducting the usage of key materials of the order in the prediction model of the deep learning model from the usage of key materials, if it is lower than the threshold value, it indicates that the key materials will soon be short, i.e., the stock is unsafe, and the key materials shall be ordered from the suppliers of the key materials; on the contrary, the key materials are still within the scope of safety stock.
4. Experience Result
After the rise of the Internet of Things, many emerging electronics are moving towards customized production. Factory production is characterized by a small quantity/variety and high added value, which requires high flexibility to adjust the production line capacity. After the order is established, the electronics will be manufactured according to the manufacturing order, and the factory will receive the order, customize the electronics, issue the manufacturing order, and deliver the electronics. In the future, consumer electronics will require a highly customized production strategy; the management of key materials and parts required for production is very important, especially the safety stock management of key materials.
This study takes consumer electronics as the experimental subject, uses the IoT to transmit production data to the SCADA cloud-based application system under the aforementioned framework, and then extracts and analyzes the data from the SCADA cloud-based application system. The weekly production capacity data and product remake ratio from 1 week to 52 weeks are obtained from the Work In Process (WIP) tracking system of its single production line, the production lead time is obtained from the automatic Material Control System (MCS), and the machine utilization and operator’s productivity are obtained from the Engineering Data Collection (EDC) system. After the expected production capacity is finally estimated, the quantities of key materials in the Material Requirements Planning (MRP) system are compared. Each group of data in this experiment is on a weekly basis, with a total of 106 groups of data (which means the data in 106 weeks). There are a total of 53 groups of data (the data in 53 weeks) in one year, so there are 2 years of data. Among them, the data of a complete year are used as the training data, while the other 53 groups of data are used as the validating data. In order to estimate the production capacity through the ranking, we need to have a group of estimated data, and then compare this group of data with the 53 groups of data for the ranking. This group of estimated data will be set by the experts in light of their experience. In the future, the estimated value can be given by the factory director or manager under actual circumstances. The histogram in
Figure 3 is the training data, the triangle legend of the line chart is the estimated production capacity using the ranking method of Learning-To-Rank, and the circle legend of the line chart is the validating data. The method proposed in this study can be observed from
Figure 3: (1) The estimated production capacity is roughly in line with the trend of the validating data; (2) The production capacity peaks in the first and fourth quarters, and troughs in the third quarter. In the section of data validation, the Mean Absolute Percentage Error (MAPE) and Mean Absolute Error (MSE) are used for comparing the prediction error value. In other words, the model trained with the data of the previous year is used to compare the prediction error value with the data of the second year. Judging from the errors in the table below (
Table 3), for estimating production capacity, the prediction model of Learning-To-Rank is feasible.
After extracting the data from the SCADA cloud-based application system and estimating the production capacity, the sales of downstream manufacturers are predicted. Most of the downstream manufacturers are the brand players or retailers. The brand players provide products to the retail terminals, while the retailers will sell directly. In the sales prediction, the overall sales will be predicted. In other words, the brand players and retailers are integrated:
Retailers = (R1, R2, R3,…, Rn).
R1 All eigenvalue data FR1 = (FR1,1, FR1,2, FR1,3,…, FR1,n).
R2 All eigenvalue data FR2 = (FR2,1, FR2,2, FR2,3,…, FR2,n). and so on.
All downstream manufacturers training data set
Df = (
F1,
F2,
F3,…,
Fn)
After collecting the characteristic data of sales, this study uses the aforementioned neural network for training, and compares the predicted value and the order value with the sales quantity, to observe the effect of the prediction model. The order value here refers to the total quantity ordered from the manufacturers.
It can be found from
Figure 4 that, with respect to the sales prediction for one year (a total of 53 weeks) that is conducted according to this model, the neural network predication of this method is completely consistent with the sales trend. It is validated that the proposed prediction model can provide effective sales prediction.
The histogram is the percentage of the difference between the prediction and sales in the proposed model, while the zone chart is the percentage of the difference between the order and sales. The closer the percentage of the difference is to 0, the more it can reduce the stock of the brand player or retailer, and the more accurate the manufacturing demand that can be provided to the factory will be. As can be seen from the data in the diagram, for the proposed model, the difference between the predicted value and the sales value is smaller.
The research method has been able to effectively estimate the production capacity and predict the sales of the downstream brands and the retail industry. It is reasonable to assume that after the sales performance improves, there will be more orders to the factory. After the number of orders to the factory increases, the production capacity must be increased to meet the quantities of products in the corresponding orders. Then, the added production capacity will lead to a shortage of materials, especially key materials. We only discuss one key material here.
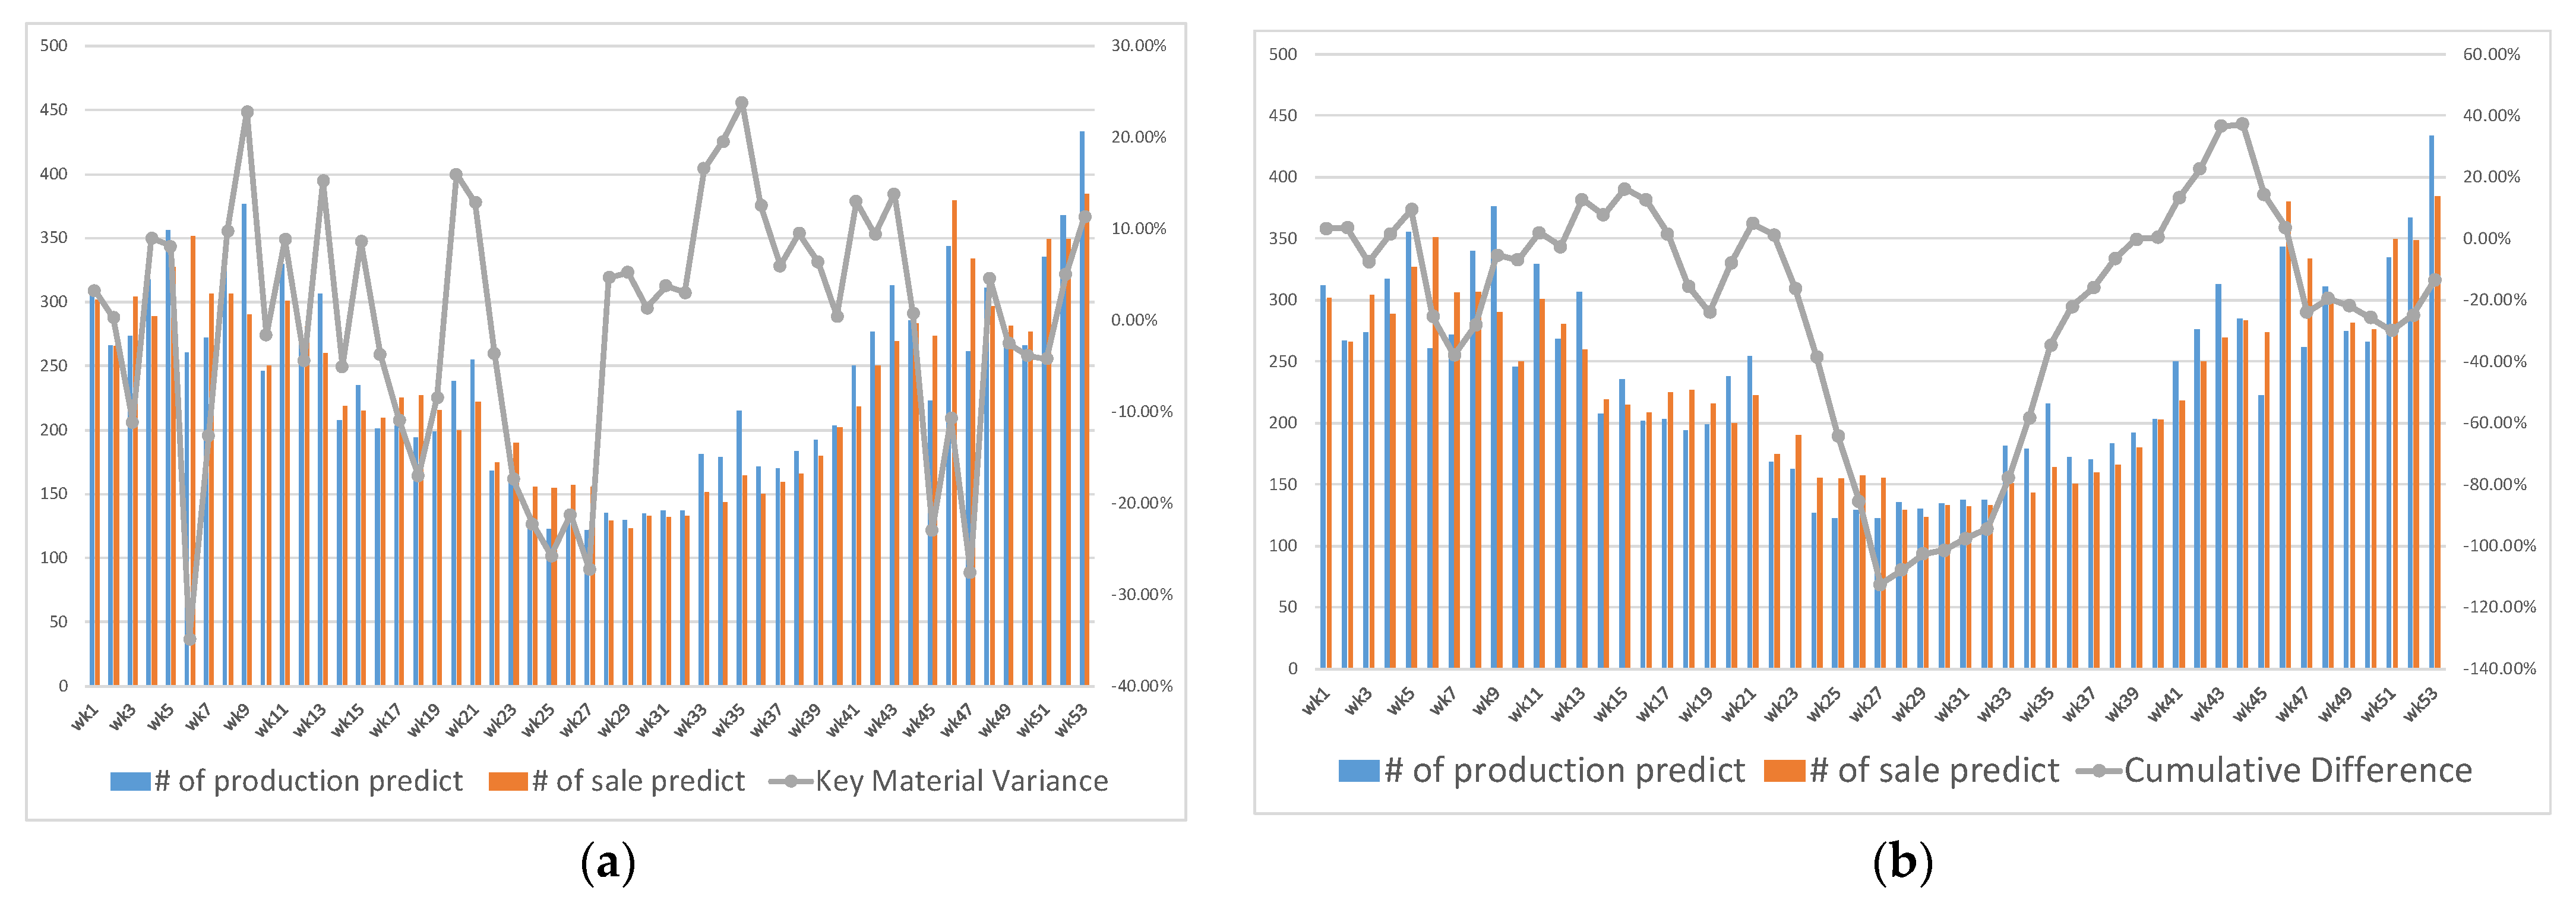
Taking the mobile phone as an example, the panel is the most important key material. Therefore, after deducting the quantity that can be produced by the production capacity from the quantity of products in the sales prediction, the result will be the output to be added. In other words, the key material may be in short supply. Then, the factory should use the API of the SCADA system to directly and automatically order the key material from the upstream material supplier, and request the upstream supplier to provide the key material, to ensure that the production capacity is uninterrupted and the high utilization rate of the production line is maintained. The histogram in
Figure 5a is the estimated output based on the production capacity and the predicted sales, and the line chart is the result of the estimated production capacity minus the predicted sales, so it is the estimated remaining stock of key materials. It can be seen from
Figure 5a that although the estimated remaining quantity of key materials per week remains within plus or minus 20%, it can be found from the accumulative histogram of remaining key materials in
Figure 5b that there is a serious shortage of key materials in the second quarter. At this time, the shortage of key materials is the safety stock that the factory should replenish. Lewis (1982) stated that the model predictive ability of MAPE is good between 10% and 20%. Thus, the results of this study are good. The SCADA framework and analysis model in this study can identify the shortage in advance, so that the factory can replenish the safety stock as soon as possible, thus effectively improving the utilization of the production line.
The ARIMA model has been one of the most well-accepted methods in the study of time series forecasting. In recent years, BPN has also proven to be valuable for time series prediction applications, especially for non-linear models with very significant processing capabilities. This is because BPN processes the time series problem by predicting the p + 1 values from the data of the p value. The BPN only uses information on autoregressive and ignores information on moving average. Therefore, the model combination of LSTM may be a better approach for the prediction study related to time series problems.
5. Conclusions
The Internet of Things (IoT) has now evolved into the Internet of Everything (IoE), which makes all applications more diverse and efficient. The typical application of the IoT is the intelligent factory: the sensing object of the factory will store the sensed data through the network to the application layer (i.e., the cloud-based SCADA system) for monitoring. However, in addition to monitoring, the application of the IoT in the factory can also result in many value-added applications, such as the intelligent analysis of safety stock. In this study, the data, including the product remake ratio, production lead time, and operator’s productivity, are stored in the cloud-based SCADA system through the IoT. The production capacity is estimated through the machine learning of a weak classifier. After collecting the sales data of downstream brand players and retailers, the neural network is used for training and sales prediction, and then the sales prediction and production capacity are compared. If the predicted sales volume is much larger than the current production capacity of the factory, it indicates that downstream manufacturers will increase the number of orders, and the factory is bound to improve the production capacity and add key materials, so as to manage the safety stock in this model. This study proposes a safety stock management model using the IoT and AI, which integrates downstream demand and its own production capacity for analysis through the Internet service, and provides a reference for the safety stock of key materials. Meanwhile, this is a C2B model of “customers participating in enterprise operation and management”, and it is also a model for enterprises to use the Internet of Things to develop innovative services and achieve the goal of the digital transformation of manufacturing with AI and IoT. Thus, the issue of VMI should be temporal. The future directions of related research would be to compare time series forecasting method models, recurrent neural networks, or time series regarding their performance with the proposed methods.


