Article

Performance Evaluation of VANET Routing Protocols in Madinah City

by
Mohammad A. R. Abdeen
1,*,
Abdurrahman Beg
2,3,
Saud Mohammad Mostafa
2,
AbdulAziz AbdulGhaffar
2,
Tarek R. Sheltami
2,3 and
Ansar Yasar
4
1
Department of Computers and Information Systems, The Islamic University of Madinah, Al-Madinah 42351, Saudi Arabia
2
Department of Computer Engineering, King Fahd University of Petroleum and Minerals, Dhahran 31261, Saudi Arabia
3
Interdisciplinary Research Center of Smart Mobility and Logistics, King Fahd University of Petroleum and Minerals, Dhahran 31261, Saudi Arabia
4
Transportation Research Institute (IMOB), Hasselt University, 3500 Hasselt, Belgium
*
Author to whom correspondence should be addressed.
Electronics 2022, 11(5), 777; https://doi.org/10.3390/electronics11050777
Submission received: 27 January 2022 / Revised: 25 February 2022 / Accepted: 1 March 2022 / Published: 2 March 2022
(This article belongs to the Special Issue Autonomous Vehicles Technological Trends)

Abstract

:
Traffic management challenges in peak seasons for popular destinations such as Madinah city have accelerated the need for and introduction of autonomous vehicles and Vehicular ad hoc networks (VANETs) to assist in communication and alleviation of traffic congestions. The primary goal of this study is to evaluate the performance of communication routing protocols in VANETs between autonomous and human-driven vehicles in Madinah city in varying traffic conditions. A simulation of assorted traffic distributions and densities were modeled in an extracted map of Madinah city and then tested in two application scenarios with three ad hoc routing protocols using a combination of traffic and network simulation tools working in tandem. The results measured for the average trip time show that opting for a fully autonomous vehicle scenario reduces the trip time of vehicles by approximately 7.1% in high traffic densities and that the reactive ad hoc routing protocols induce the least delay for network packets to reach neighboring VANET vehicles. From these observations, it can be asserted that autonomous vehicles provide a significant reduction in travel time and that either of the two reactive ad hoc routing protocols could be implemented for the VANET implementation in Madinah city. Furthermore, we perform an ANOVA test to examine the effects of the factors that are considered in our study on the variation of the results.

1. Introduction

Vehicle-to-Vehicle (V2V) and Vehicle-to-Infrastructure (V2I) communications play a vital role in building an Intelligent transportation system in Vehicular ad hoc networks (VANETs) [1,2]. The vehicles and infrastructure communicate and exchange important information about the traffic situations, road conditions, and many more [3,4]. This information helps autonomous vehicles to make decisions dynamically and avoid potentially dangerous conditions. Furthermore, utilizing V2V and V2I concepts in smart cities will enhance the safety of the vehicle on the roads as well as optimize the flow of traffic [5,6,7].
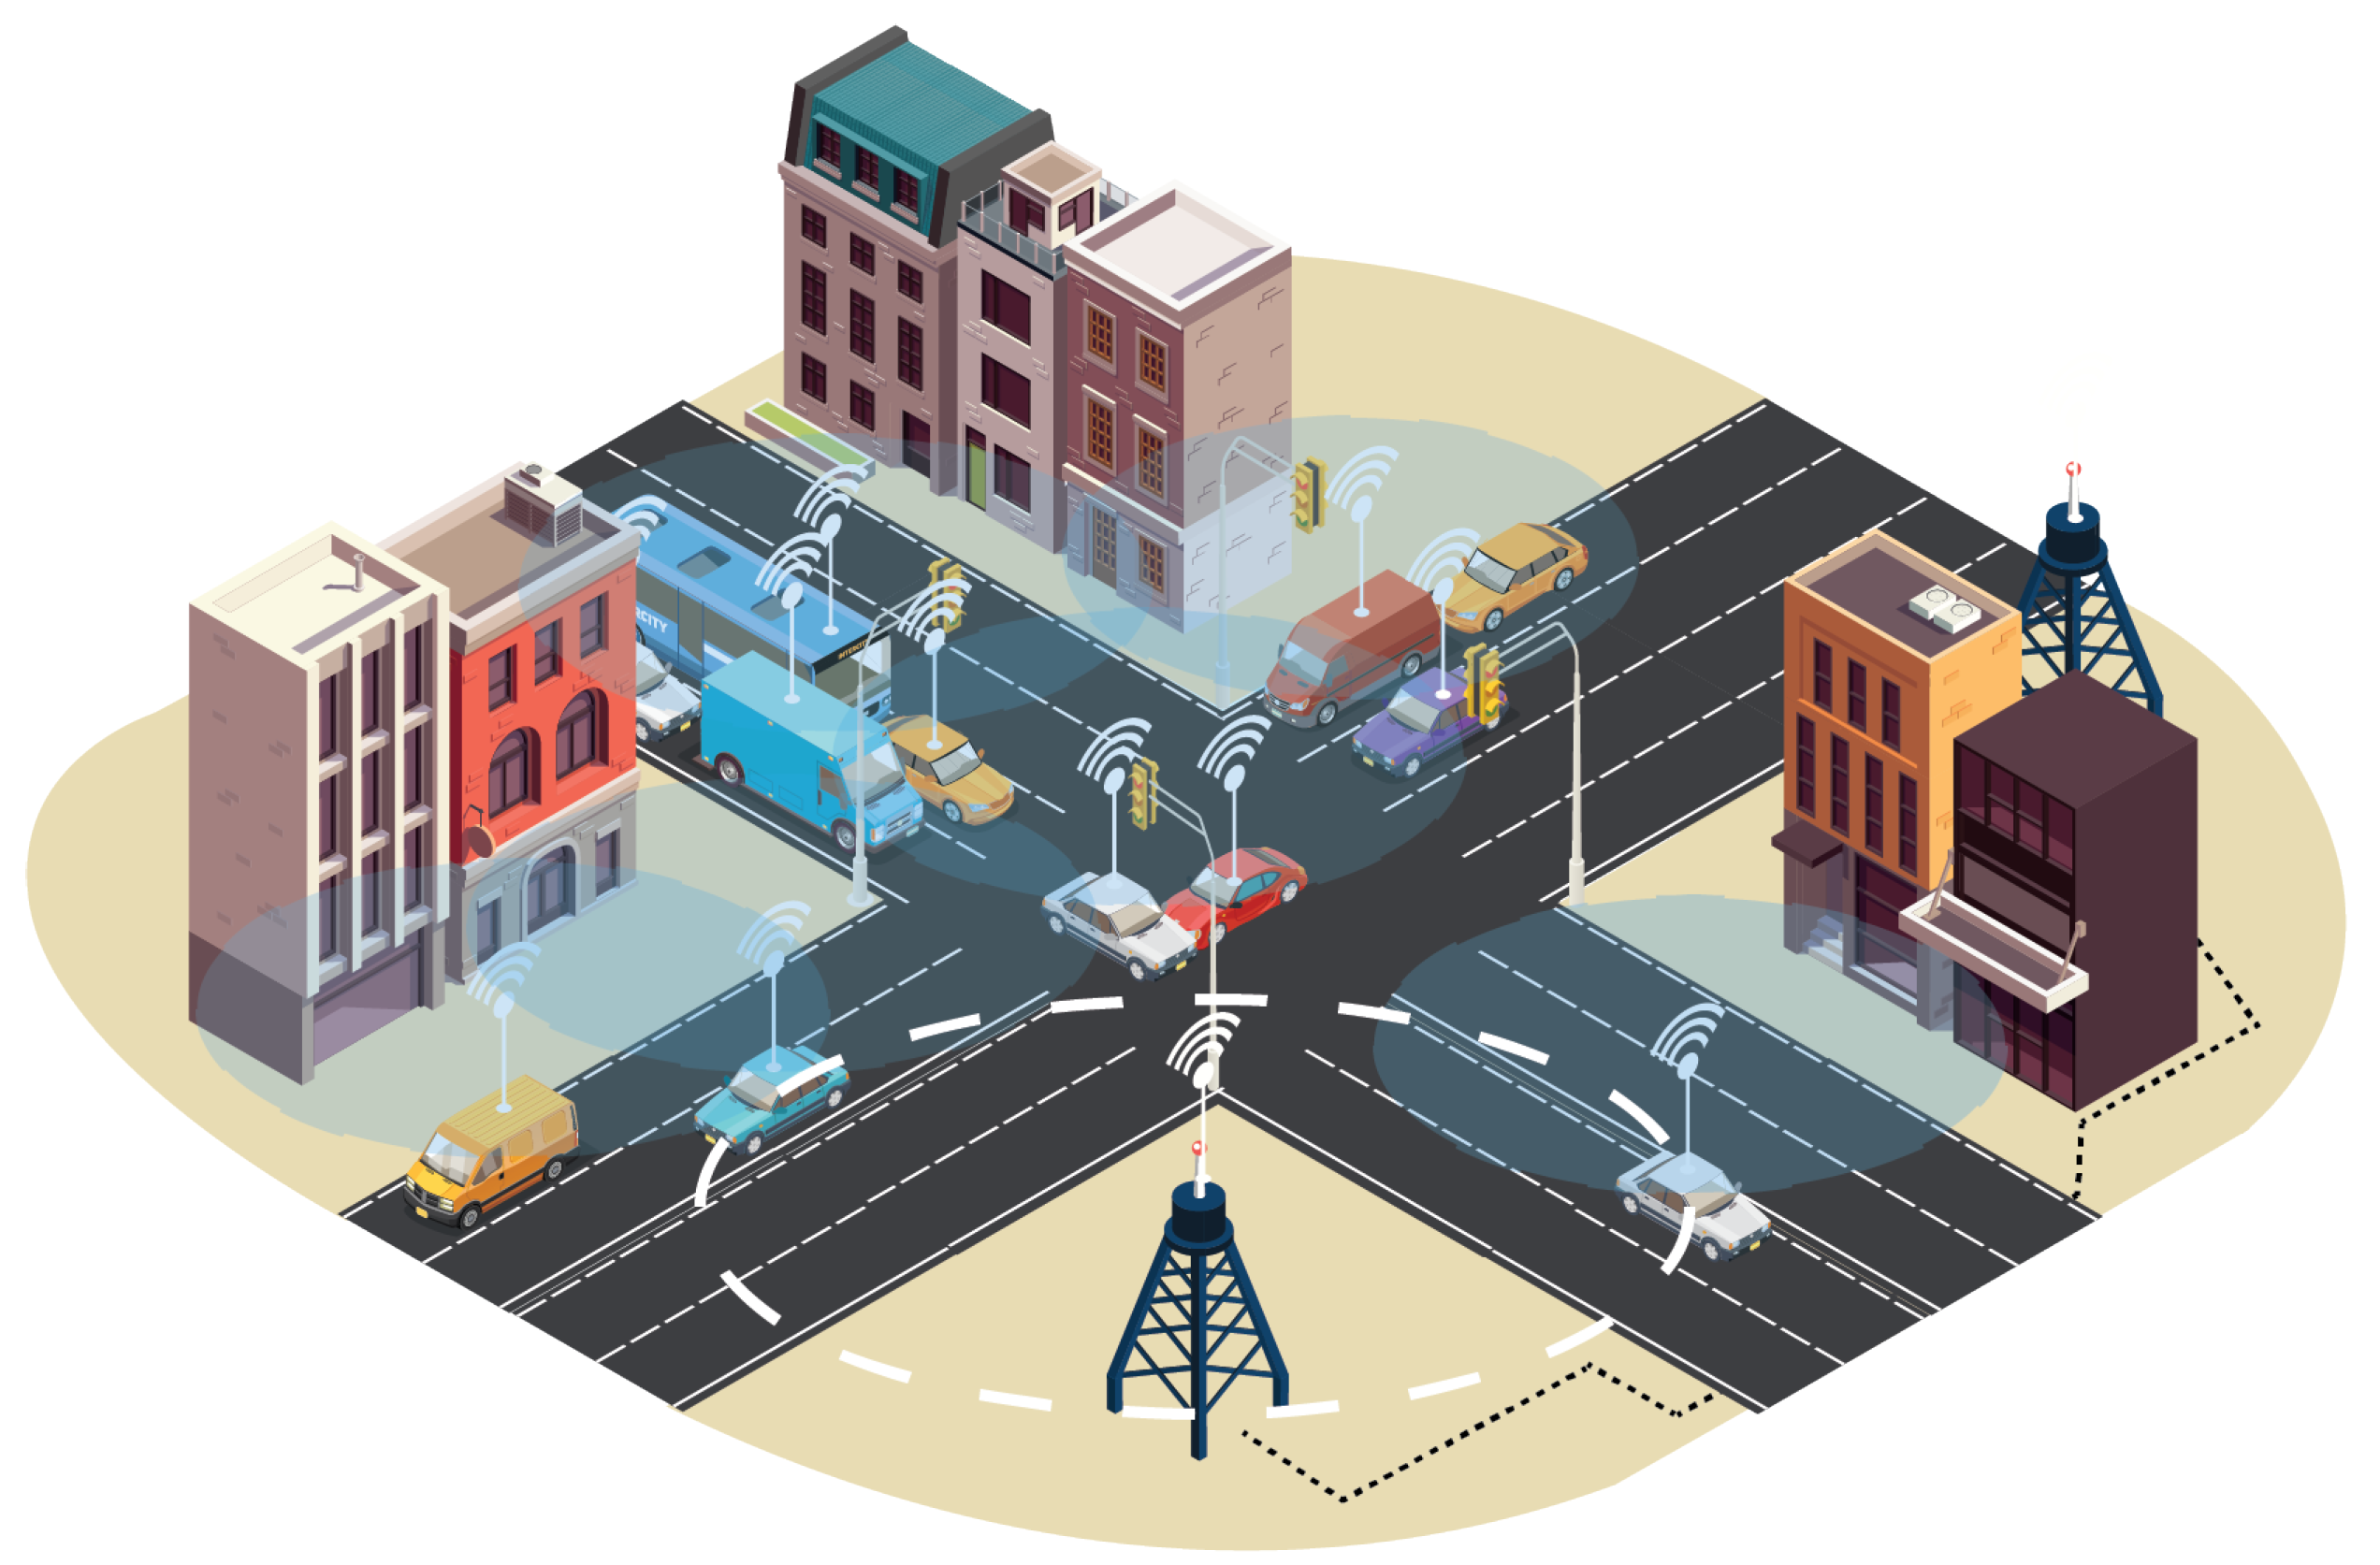
Figure 1 describes a VANET of a smart city environment with V2I and V2V wireless ad hoc communication. Vehicles transmit and relay packets across the network informing of incidents, such as accident scenarios, at specific locations. The ad hoc protocols employed by the literature and this work proactively or reactively send out packets to the nearest neighbors based on the communication range and antenna. The figure further elaborates on the V2I concept in the VANET environment, where a base station node with a larger communication range receives the relayed packet and forwards it to vehicles further away or via cable to other entities in the network.
The concurrent presence of human-driven and fully automated vehicles on a road network poses new research challenges. Especially in the case that this type of mixed fleet needs to cooperate under a real-life urban or extra-urban environment [8,9]. The key challenge in these environments is traffic congestion, a regular phenomenon, which causes dynamic changes in the environment and in the decisions the automated vehicles will make (lane blockage, delays, illegal parking, short-time cars’ stops) to be self-navigated within the urban area [10,11]. To make things worse, the coexistence of heavy pedestrian traffic and adverse weather conditions, such as heavy rain, extreme heat, strong winds, and hail, can make the co-presence of conventional (human-driven) and automated vehicles even more challenging [12]. We need to find a way that will not lead to an increase in the traffic jam due to this necessary cooperation of the two different types of vehicle fleets. Traffic congestion induces serious infrastructure degradation in metropolitan areas. Considering that malfunction cooperation among conventional and automated vehicles can increase traffic jams and consequently the cost, it is clear that civil infrastructures should be equipped with novel sensors and software tools to enable cooperative functionality among the conventional and automated vehicles [13].
For the seamless coexistence of automated and conventional vehicles, it is clear that new signaling and traffic management methods are required. These methods should be dynamic and adapted according to the real-time traffic flow conditions, which will allow for increased efficiency. In this paper, we develop wireless communication between Vehicles and Infrastructure. Both human-driven and autonomous vehicles will need to wirelessly communicate with each other: Vehicle-to-Vehicle and with the surrounding road infrastructure (V2I). The transportation network utilizes traffic modeling and available data to simulate the future state. First, we use OpenStreetMap (OSM) [14,15] to extract the roads network map of Madinah city. Next, we use the Simulation of Urban MObility (SUMO) [16,17] traffic modeling tool to generate various traffic scenarios for our simulation. We select OMNeT++ [18,19] as the network simulation platform in our study and import the Madinah city map as well as SUMO-generated traffic scenarios to perform simulations and obtain the results. For this study, we select three routing protocols, including Ad hoc On-Demand Distance Vector (AODV) [20,21], Destination Sequenced Distance Vector (DSDV) [22,23], and Dynamic Manet on Demand (DYMO) [24,25,26,27], which are discussed later. This study takes into account the conditions of the city of Madinah, especially at peak times of Hajj and Umrah. To the best of our knowledge, very few works are conducted on autonomous vehicles in the Kingdom of Saudi Arabia.
The contribution of our work is as follows:
  • We study the effect of different routing protocols in VANET communication systems. Two types of routing protocols (proactive and reactive) are considered, and a performance evaluation is conducted of the VANET system under varying traffic scenarios.
  • Furthermore, we demonstrated the effect of various populations of autonomous to human-driven vehicles in the smart city by analyzing the impact of the introduction of autonomous vehicles on the trip times of the vehicles in the VANET scenario.
  • Finally, we evaluated the main factors that influence the performance of the VANET system through the analysis of variance (ANOVA) test, and our study illustrated the contrasting influence of the factors captured on multiple metrics in a smart city simulation.
The organization of this paper is as follows: Section 2 provides a brief summary of recent studies, while Section 3 provides a detailed methodology of our work. Section 4 explains the simulation details and various test scenarios we considered in our study. Section 5 elaborates and analyzes the results and findings of our simulation. Lastly, the conclusion is presented in Section 6.

2. Related Works

There are various research areas in the VANET domain [28]. We focus on the communication aspects of VANETs. Tremendous work regarding the communication routing protocols for VANETs is studied. The authors in [29] discuss the details of the protocol stack, application, and challenges of VANET. In [30], the authors classify the routing protocols based on the type of architecture and mode of operation. They discuss the features of the current known routing protocols and how bio-inspired protocols can improve the performance of the routing process. Several factors might affect the performance of the routing protocols. Hence, the authors conclude that depending on the VANET application, the routing protocol needs to be designed or tailored.
The authors in [31] evaluate the performance of AODV and Dynamic Source Routing (DSR) [32,33] routing protocols in VANET with dense and sparse car traffic density. The simulation was carried out in the OPNET Network Simulator [34] using IEEE 802.11b standard [35] to study the impact on VANET. The Packet Delivery Ratio (PDR), throughput, and end-to-end delay were the performance metrics used for the study, and the authors concluded that AODV was better in dense traffic density. However, the authors only considered reactive routing protocols in their analysis.
Another study [36] analyzed the performance of DSR, AODV, and DSDV routing protocols in terms of PDR, average throughput, delay, and total energy under high traffic density. The authors compared the performance of the routing protocols in a highly congested area of Khartoum to find out the most suitable routing protocol. Regardless, the authors did not consider different traffic scenarios or routes that might affect the performance. In [37], the authors studied the performance of AODV, DSR, and DSDV routing protocols in terms of PDR, throughput, and Normalized Routing Load (NRL) as performance metrics. The intended map of the city of Casablanca was generated using OSM, and the mobility model was created using SUMO. Simulations were run using the Network Simulator 2 (NS-2) [38] tool with a high traffic density. The authors concluded that the AODV protocol outperforms DSR and DSDV protocols under a heavy traffic load. However, the authors did not consider different traffic scenarios and the autonomy of vehicles in VANET systems.
Ghori et al. [39] studied several routing protocols to identify the most suitable protocol for video streaming in VANET. They classified and examined the routing protocols and discussed the pros and cons of each routing protocol. The authors evaluated the performance of AODV and DSR routing protocols in terms of throughput and delay using OPNET as the network simulation tool. Road-side Units (RSUs) [40] were used to simulate a complex traffic scenario, and the authors concluded that AODV is the best routing protocol for VANET. However, the authors did not consider any proactive routing protocols in their study. The researchers in [41] analyzed AODV, Optimized Link State Routing Protocol (OLSR) [42], and DSDV routing protocols in terms of PDR, goodput, routing overhead, and end-to-end delay as performance metrics under different node densities and velocities. The mobility model was generated using the BonnMotion tool [43], and the simulation was carried out in NS-3 [44]. The authors concluded that the OLSR routing protocol performs best in their scenario. Nonetheless, the authors did not consider a more realistic scenario with traffic lights, etc. Additionally, they did not consider high node density in their study.
The authors in [45] present a detailed classification of the routing protocols in VANET with their benefits and drawbacks. They simulate a VANET environment of Oujda city using OSM, SUMO, and NS-3 tools to compare the topology-based and position-based routing protocols. The performance of DSDV, AODV, Greedy Perimeter Stateless Routing (GPSR) [46], OLSR, and Greedy Perimeter Coordinator Routing (GPCR) [47] routing protocols are evaluated in terms of PDR, end-to-end delay, throughput, and routing overhead by varying the node density. The authors observe that the OLSR protocol outperforms other protocols in terms of PDR and throughput. GPSR and GPCR protocols perform better concerning the routing overhead and end-to-end delay. Additionally, the authors propose a new greedy forwarding technique based on the angle direction, speed variation, density, and distance to the next-hop node to improve the GPSR and GPCR protocols. However, no simulation was conducted based on the proposed technique. Furthermore, the authors did not consider autonomous traffic distribution in their traffic scenarios.
Shi et al. [48] evaluate the performance of two communication technologies, including 802.11p and LTE-V, in the V2X scenario. The authors consider a scenario where the vehicles communicate an accident at an intersection. To perform the experiments, the authors deploy two vehicles in a real-world test field, which communicate with each other using 802.11p and LTE-V technologies. The Packet Delivery Ratio (PDR) and latency are selected as two performance metrics. From the results, the authors conclude that 802.11p provides much lower latency compared to LTE-V; however, the PDR of LTE-V is much better. Nevertheless, the study only provides a small-scale deployment and does not provide an extensive comparison between the two technologies. Furthermore, the implementation scenario is oversimplified in this study.
The authors of [49] conduct a performance evaluation of routing protocols for VANETs using a simulation system called Cellular Automaton-based VEhicular NETwork (CAVENET). CAVENET generates mobility behavior in one-dimensional cellular automata, and the network is simulated on NS-2. They implemented two reactive routing protocols, AODV and DYMO, and one proactive routing protocol, OSLR. Packet delivery ratio is used as the primary evaluation metric between the protocols. They claim that DYMO is the best routing protocol because of its route maintenance ability. Their simulation is limited as it only considers 30 nodes from a 10 to 90 s simulation time. Further, only two nodes can deliver the majority of the packets, while some cannot deliver any packet at all because of disappearing routes over multi-hop communication, and the PDR is dependent on the number of hops in this simulation, not the routing protocol.
García-Campos et al. [50] perform a comparison study of ad hoc reactive routing protocols for VANETs in urban settings. The routing protocols studied were AODV, DSR, DYMO, and Location-Aided Routing (LAR) [51], and the MAC protocol used was IEEE 802.11p. The performance evaluation was conducted on the ns-2 simulator for the network simulation and BonnMotion for the mobility generator. The number of nodes in the VANET ranged up to a maximum of 175 with increments of 25 vehicles. Performance metrics captured were throughput, end-to-end delay, max. route activity time, number of hops, jitter, and more. Their results show that Dymo and AODV perform best for the jitter metric, Dymo for route activity time, and LAR for the remaining metrics. Their study is limited in that only one distribution of vehicles are used, and they only scale the traffic to 175 nodes.

3. Methodology

3.1. OpenStreetMap

The map of Madinah city was exported with the OpenStreetMap tool—an open-source geographic database of the world. 
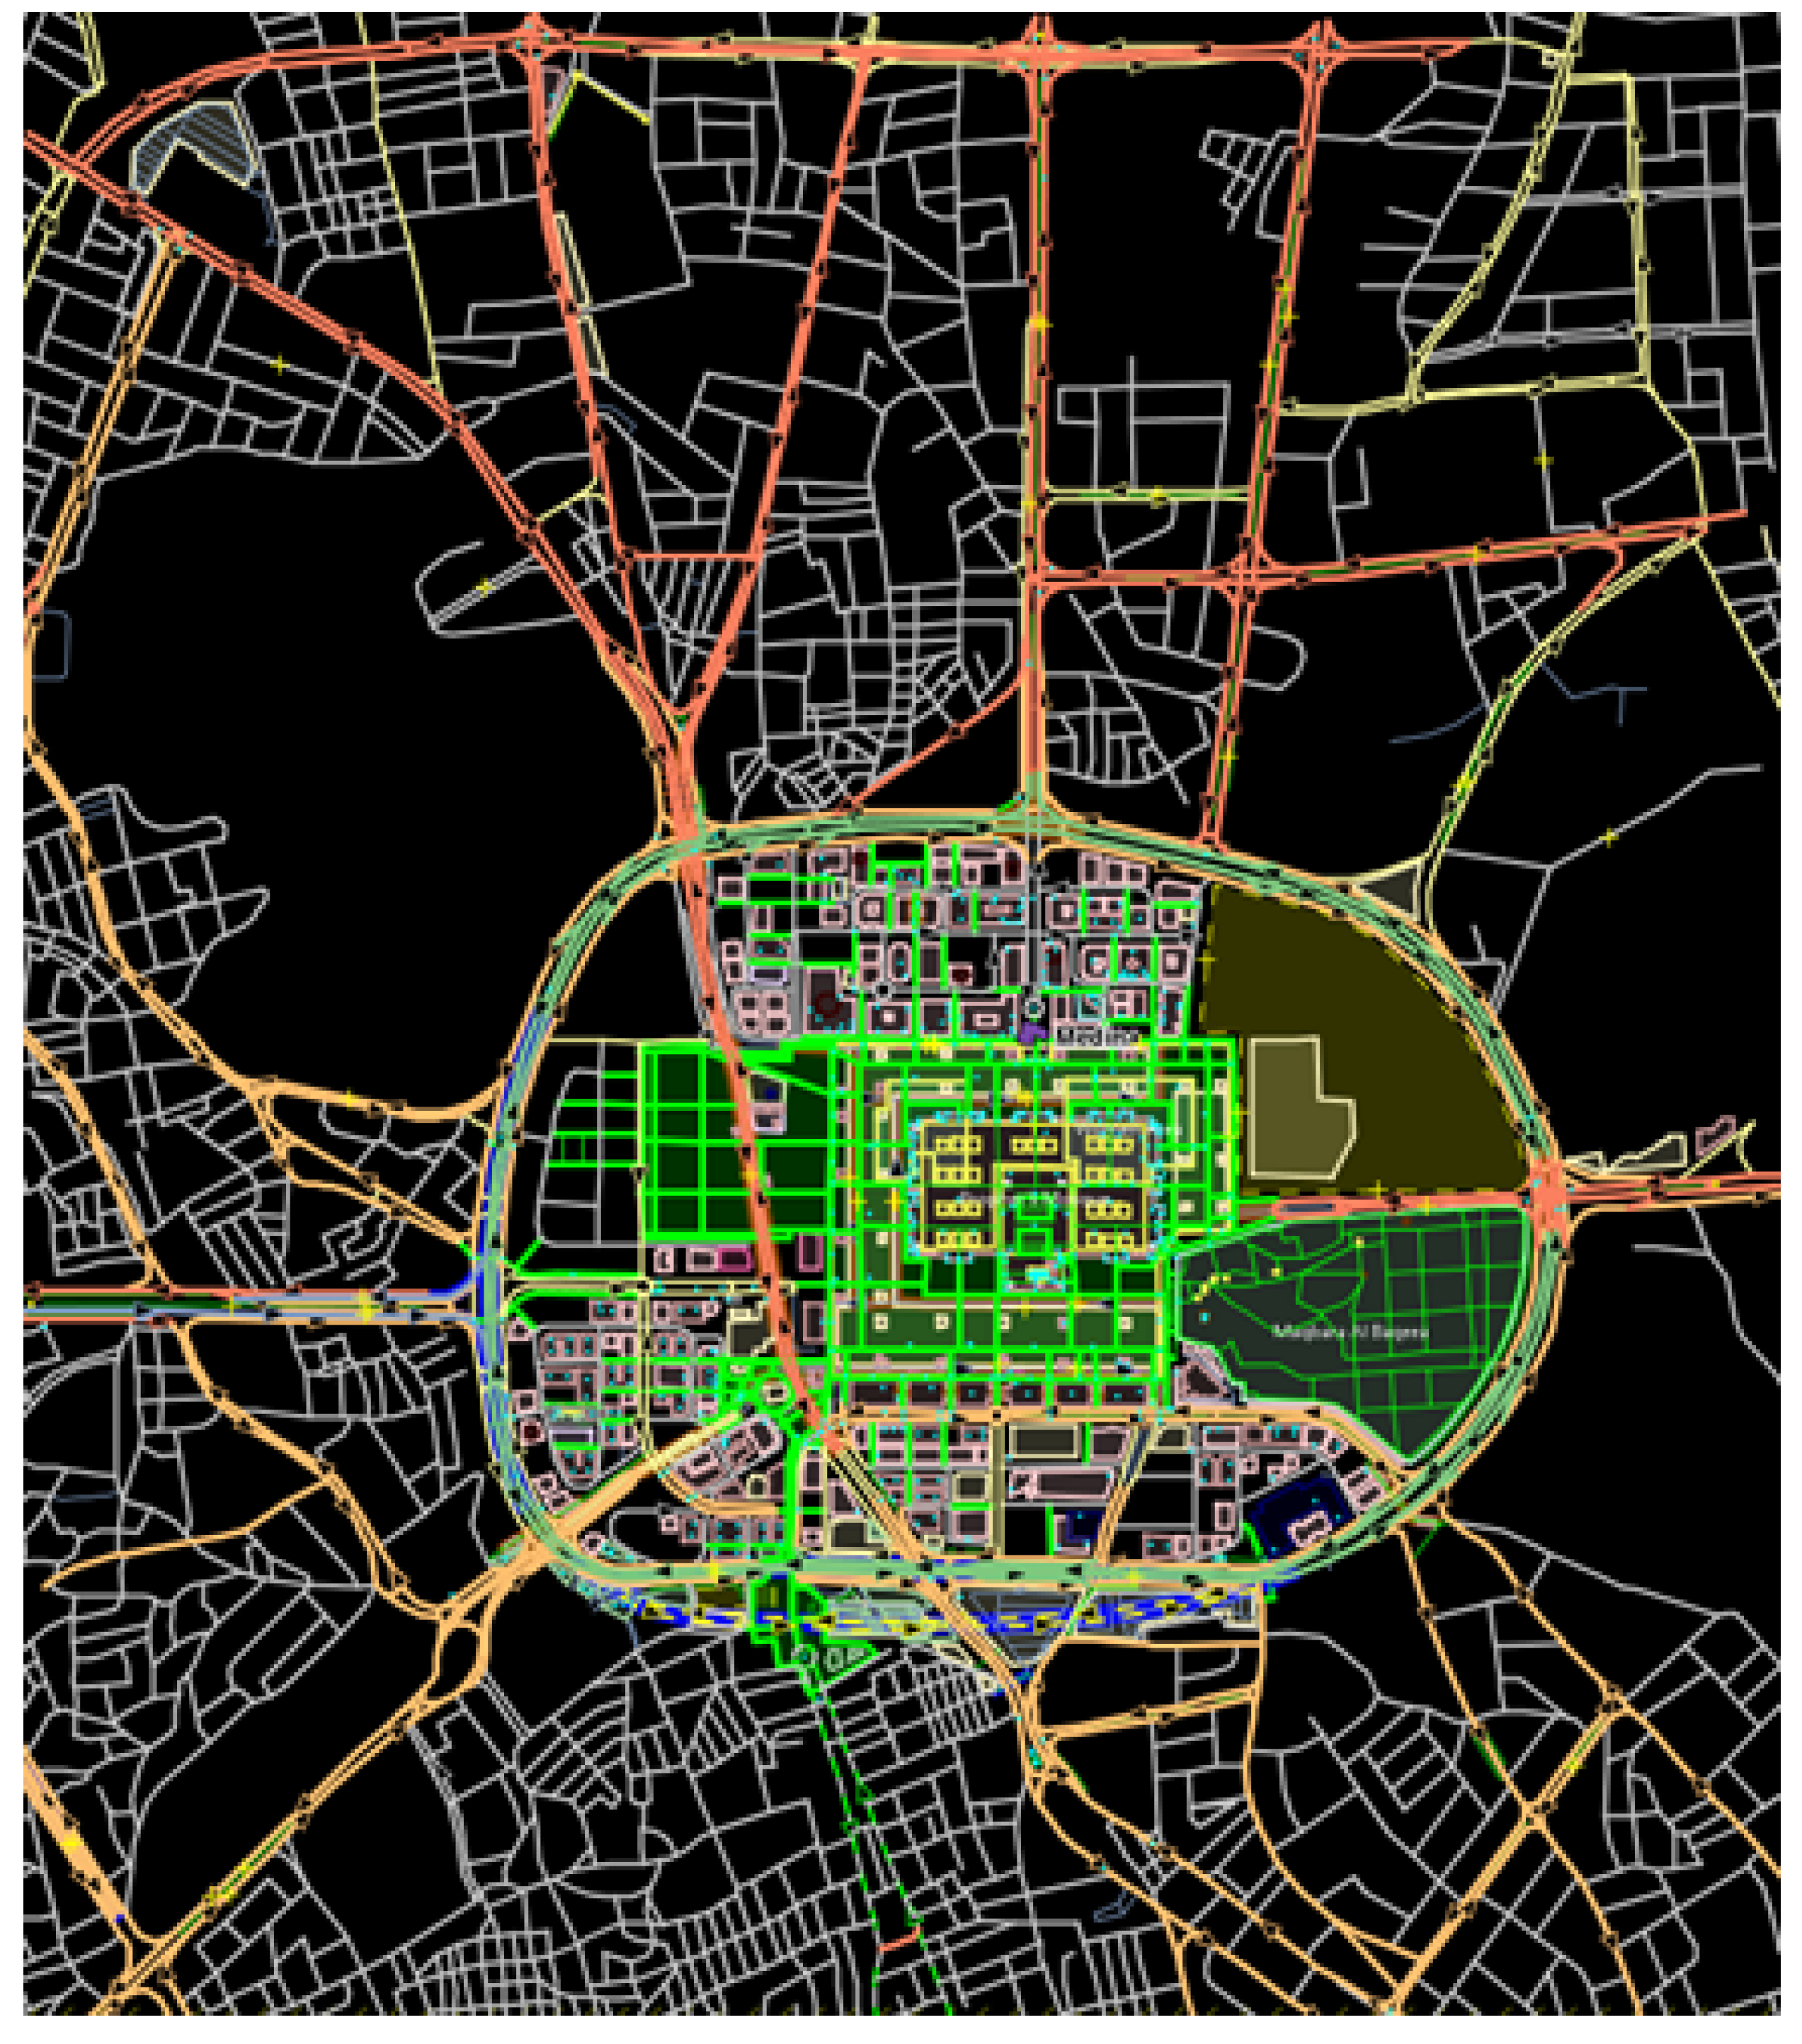
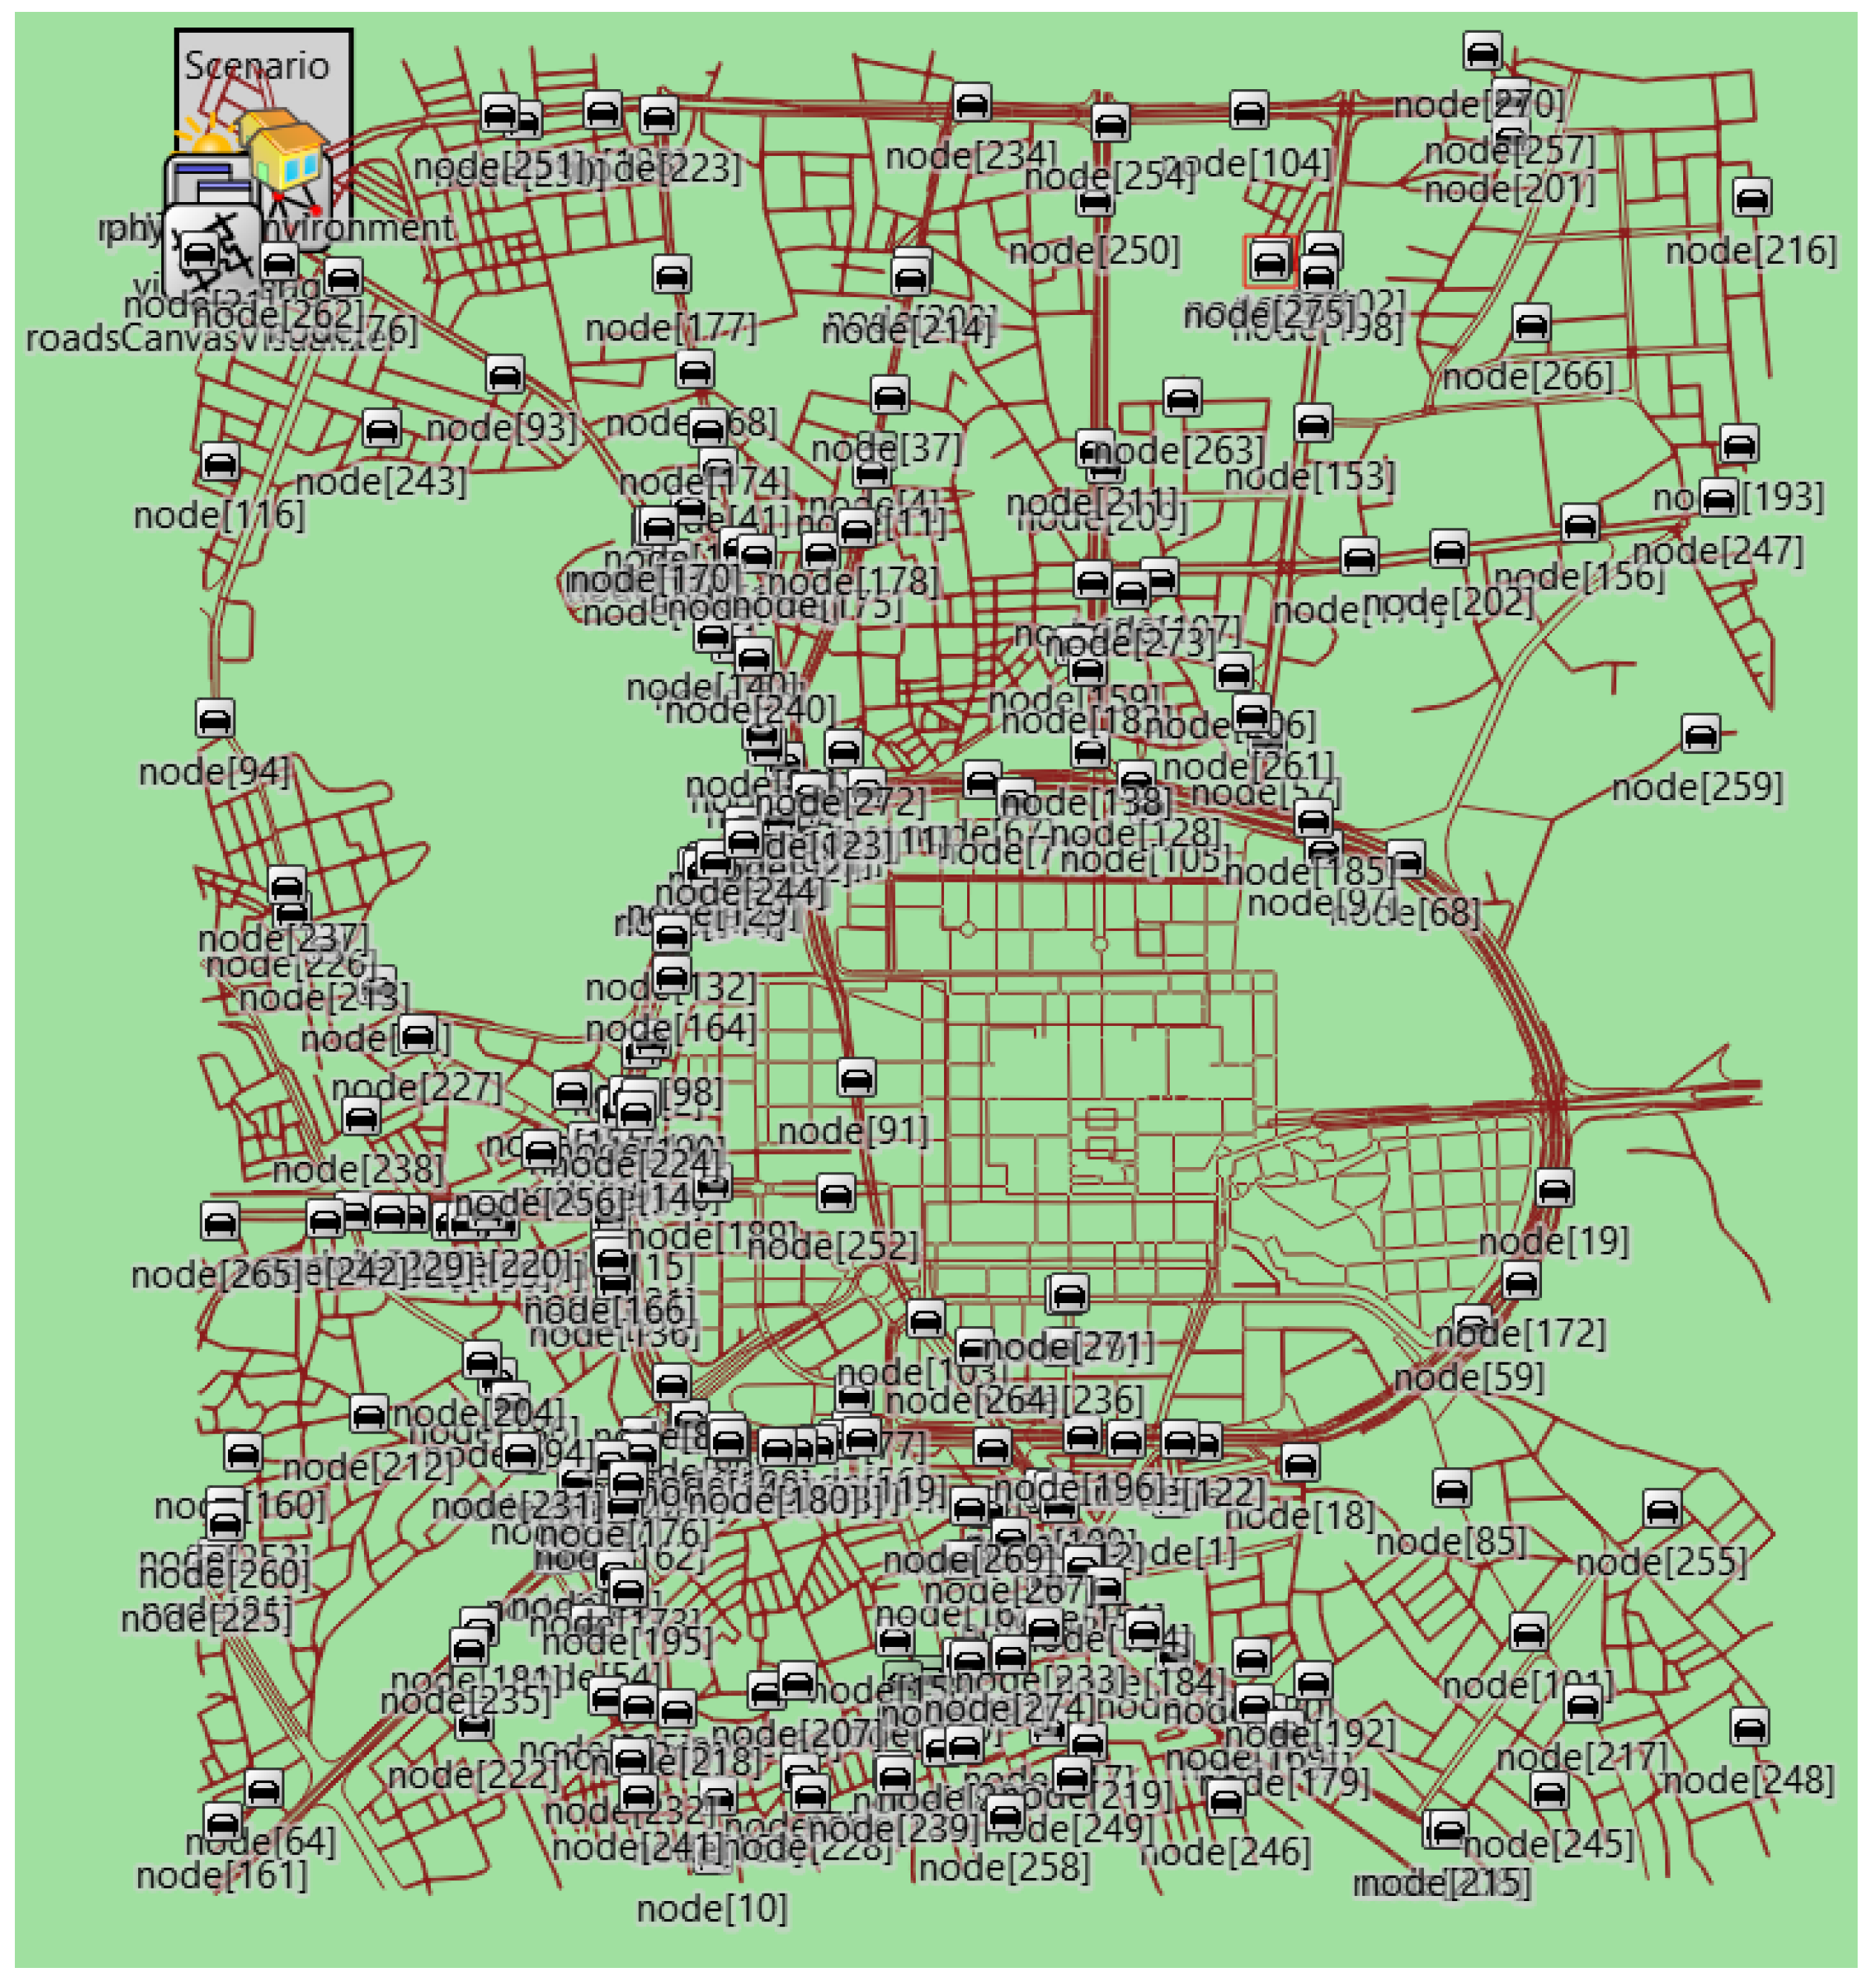
Figure 2 shows the extracted map on the Java OpenStreetMap Editor (JOSM), a java tool to inspect and edit OSM maps. From this tool, ID extraction is possible of the edges (roads) and their connections to create custom trip routes of vehicles traveling from points of interest to the Prophet’s Mosque in the center of the exported map.
The selection criteria comprised of factors such as the inclusion of main highway routes towards the center, the Prophet’s Mosque. These highways connect to a primary Ring Road that encircles the point of interest in the center of the city. In addition to all the highway routes, the roads within the encircling Ring Road need to be included as passenger vehicle trips end near the hotels at this location or the drop-off points near the mosque.
Some of these highways connecting to the Ring Road are primary sources of external traffic towards the city. For example, the west and south-west highways are the primary routes for traffic entering the city for pilgrims coming from Makkah city via road and from the main hub airport for the Hijaz region and pilgrims traveling to the country, King Abdulaziz International Airport (KAIA). In addition, the eastern highway welcomes visitors from the Madinah train station, the final stop for the high-speed haramain railway project connecting Makkah, Jeddah (KAIA airport), and King Abdullah Economic City (KAEC).

3.2. Simulators and Frameworks

A combination of a traffic simulation tool and a network simulation tool was used to model the traffic behavior and communication of autonomous and human-driven vehicles in Madinah city. The network simulator imported the traffic data generated on the traffic simulator to perform VANET communication in each scenario tested. The traffic simulator created a variety of traffic situations to match the traffic patterns of the population densities in Madinah city.

3.2.1. Simulation of Urban MObility (SUMO)

SUMO is an open-source traffic modeling simulation tool developed by the German Aerospace Center, now maintained by the Eclipse Foundation. SUMO enables researchers to model road traffic and traffic management systems and to perform in-depth analysis prior to launching the solution in real-world scenarios. In addition to road traffic comprising autonomous and human-driven vehicles, SUMO is capable of simulating public transportation and pedestrians.
SUMO provides a variety of tools with the ability to generate, execute, and evaluate traffic simulations that involve the importing or creation of road networks, route calculations with given parameters and constraints, visualization of the traffic, and emissions cost of each trip for the vehicles.
SUMO has been used in prior research projects to conduct a variety of application studies with a diverse set of research questions and objectives. Examples include an evaluation of proposed algorithms for traffic light control systems to improve vehicle throughput and reduce waiting times, artificial intelligence (AI) training of traffic light schedules, traffic effects of autonomous vehicles, simulation of traffic parking scenarios, and so on.

3.2.2. OMNeT++

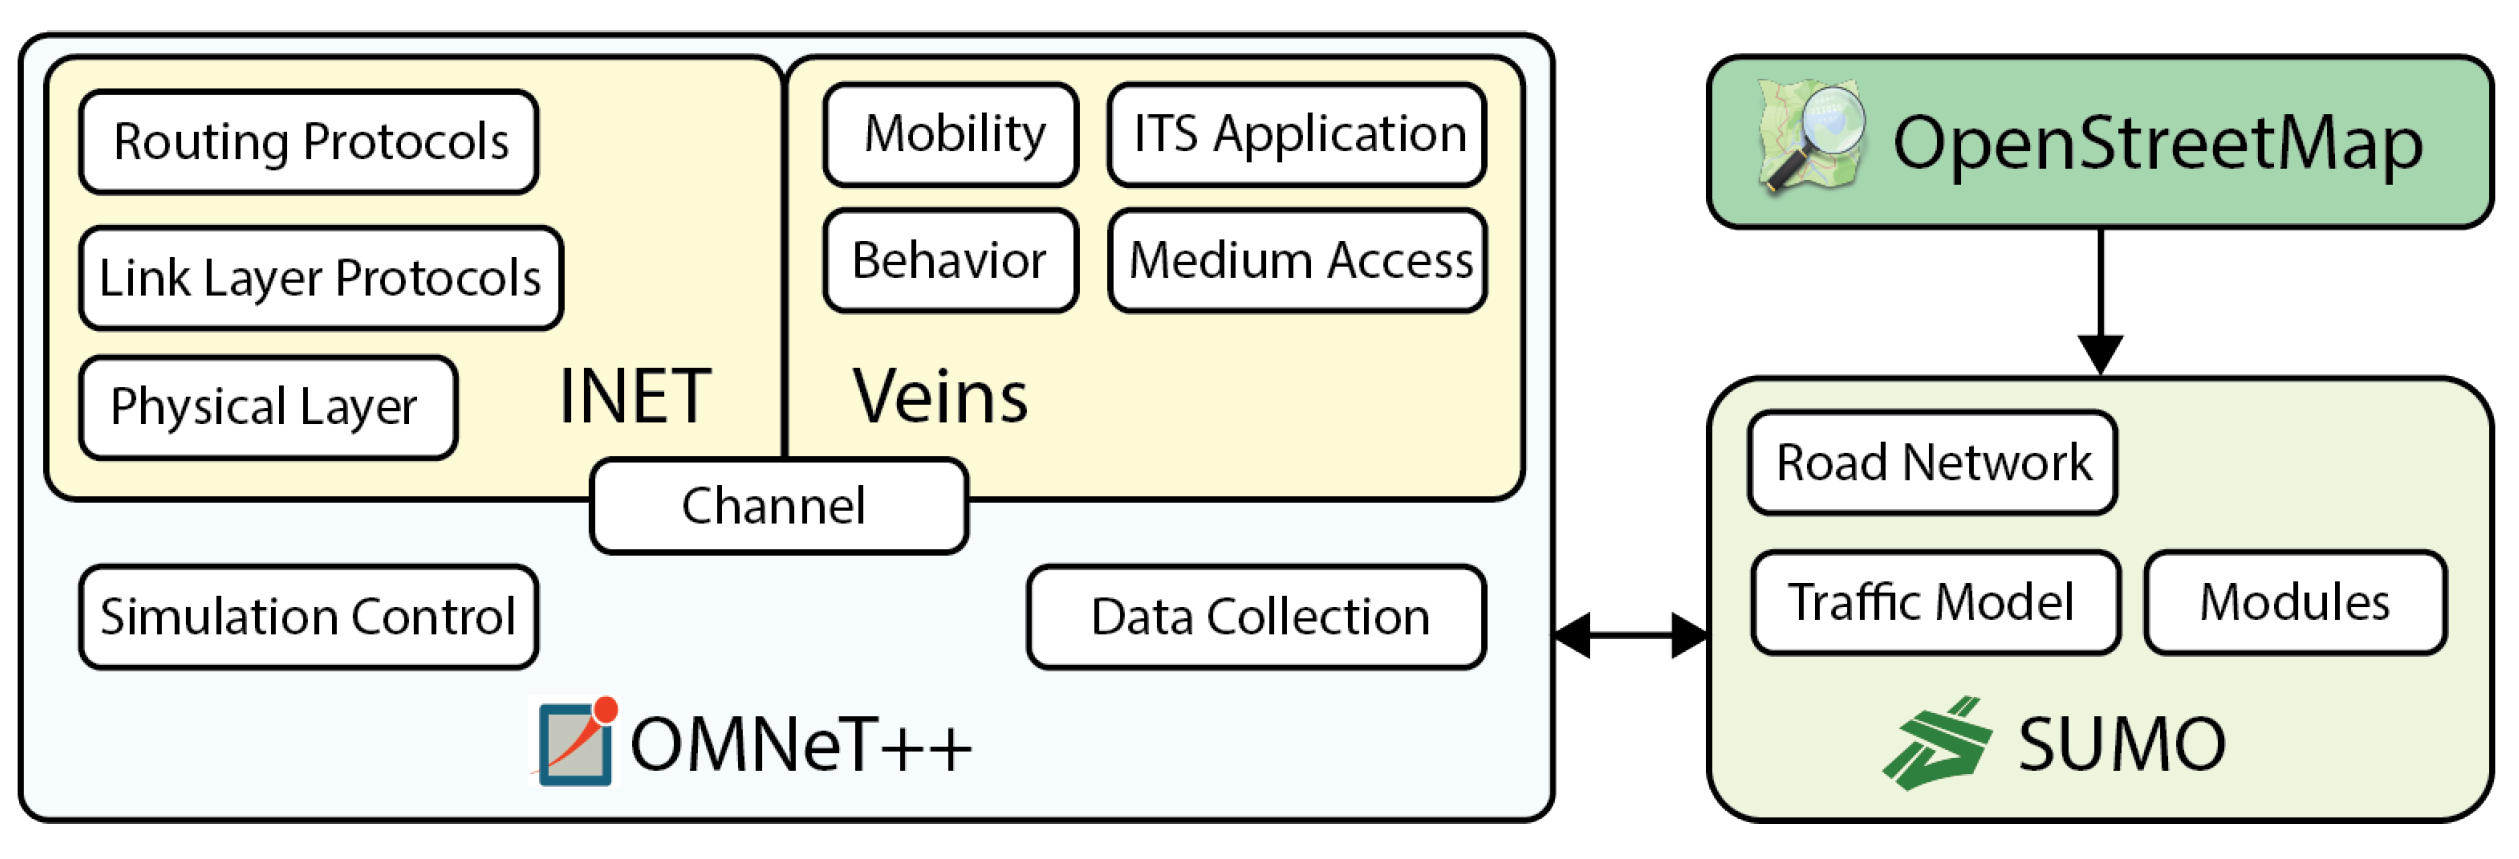
OMNeT++ is a discrete-event simulation library and platform developed to perform network simulations. These network simulations can include anything from wired to wireless communication to domain-specific networks, such as wireless sensor networks, ad hoc networks, and so on. These networks are modeled using external framework projects and imported into the OMNeT++ simulator. INET [52] is a popular framework that contains models for a diverse range of network protocols, such as IPv6, Border Gateway Protocol (BGP), and many Ad hoc routing protocols.
OMNeT++ employs a modular architecture for models, referred to as components. These components are written in C++ language and then integrated using higher-level language NEtwork Description (NED) into larger components or models. This modular architecture enables researchers to easily import and embed external models into the applications for simulation.
In this research, OMNeT++ is the core simulation platform, INET provides the communication libraries such as routing protocols and wireless technologies, while Vehicles in network simulation (Veins) [53,54] provides cars and road network libraries to create VANETs. All of this is performed within the specific traffic models generated by SUMO on the imported OSM map, as described by the system design in Figure 3.

3.2.3. INET Framework

INET is an open-source framework model library for OMNeT++ network simulations designed for communication experiments. It consists of a variety of network protocols (e.g., Open Shortest Path First (OSPF), BGP), wired and wireless protocols for the data link layer (e.g., IEEE 802.11), mobility models, and numerous other models and components.
INET, such as OMNeT++, follows a modular design with the concept of modules communicating by passing messages using agents. These agents and protocols are the components that form the higher-level function of network devices, such as routers, switches, hosts, and other devices.
INET is used in this research to import and implement the link-layer protocol, IEEE 802.11p designed for VANETS, and the ad hoc routing protocols described later.

3.2.4. Veins

Veins is an open-source simulation framework for vehicular networking. The models provided by the framework libraries are imported into the OMNeT++ event-based simulation to interact with INET and SUMO to perform VANET communication simulation for a given road network and traffic characteristics.
The Veins framework provides a user-modifiable application-specific simulation code that enables researchers to tweak or adapt certain applications to their use-cases. In this research, Veins is used to simulate the VANET applications for the two test case scenarios performed in the simulation experiments described in detail later.

3.2.5. Simulation Process

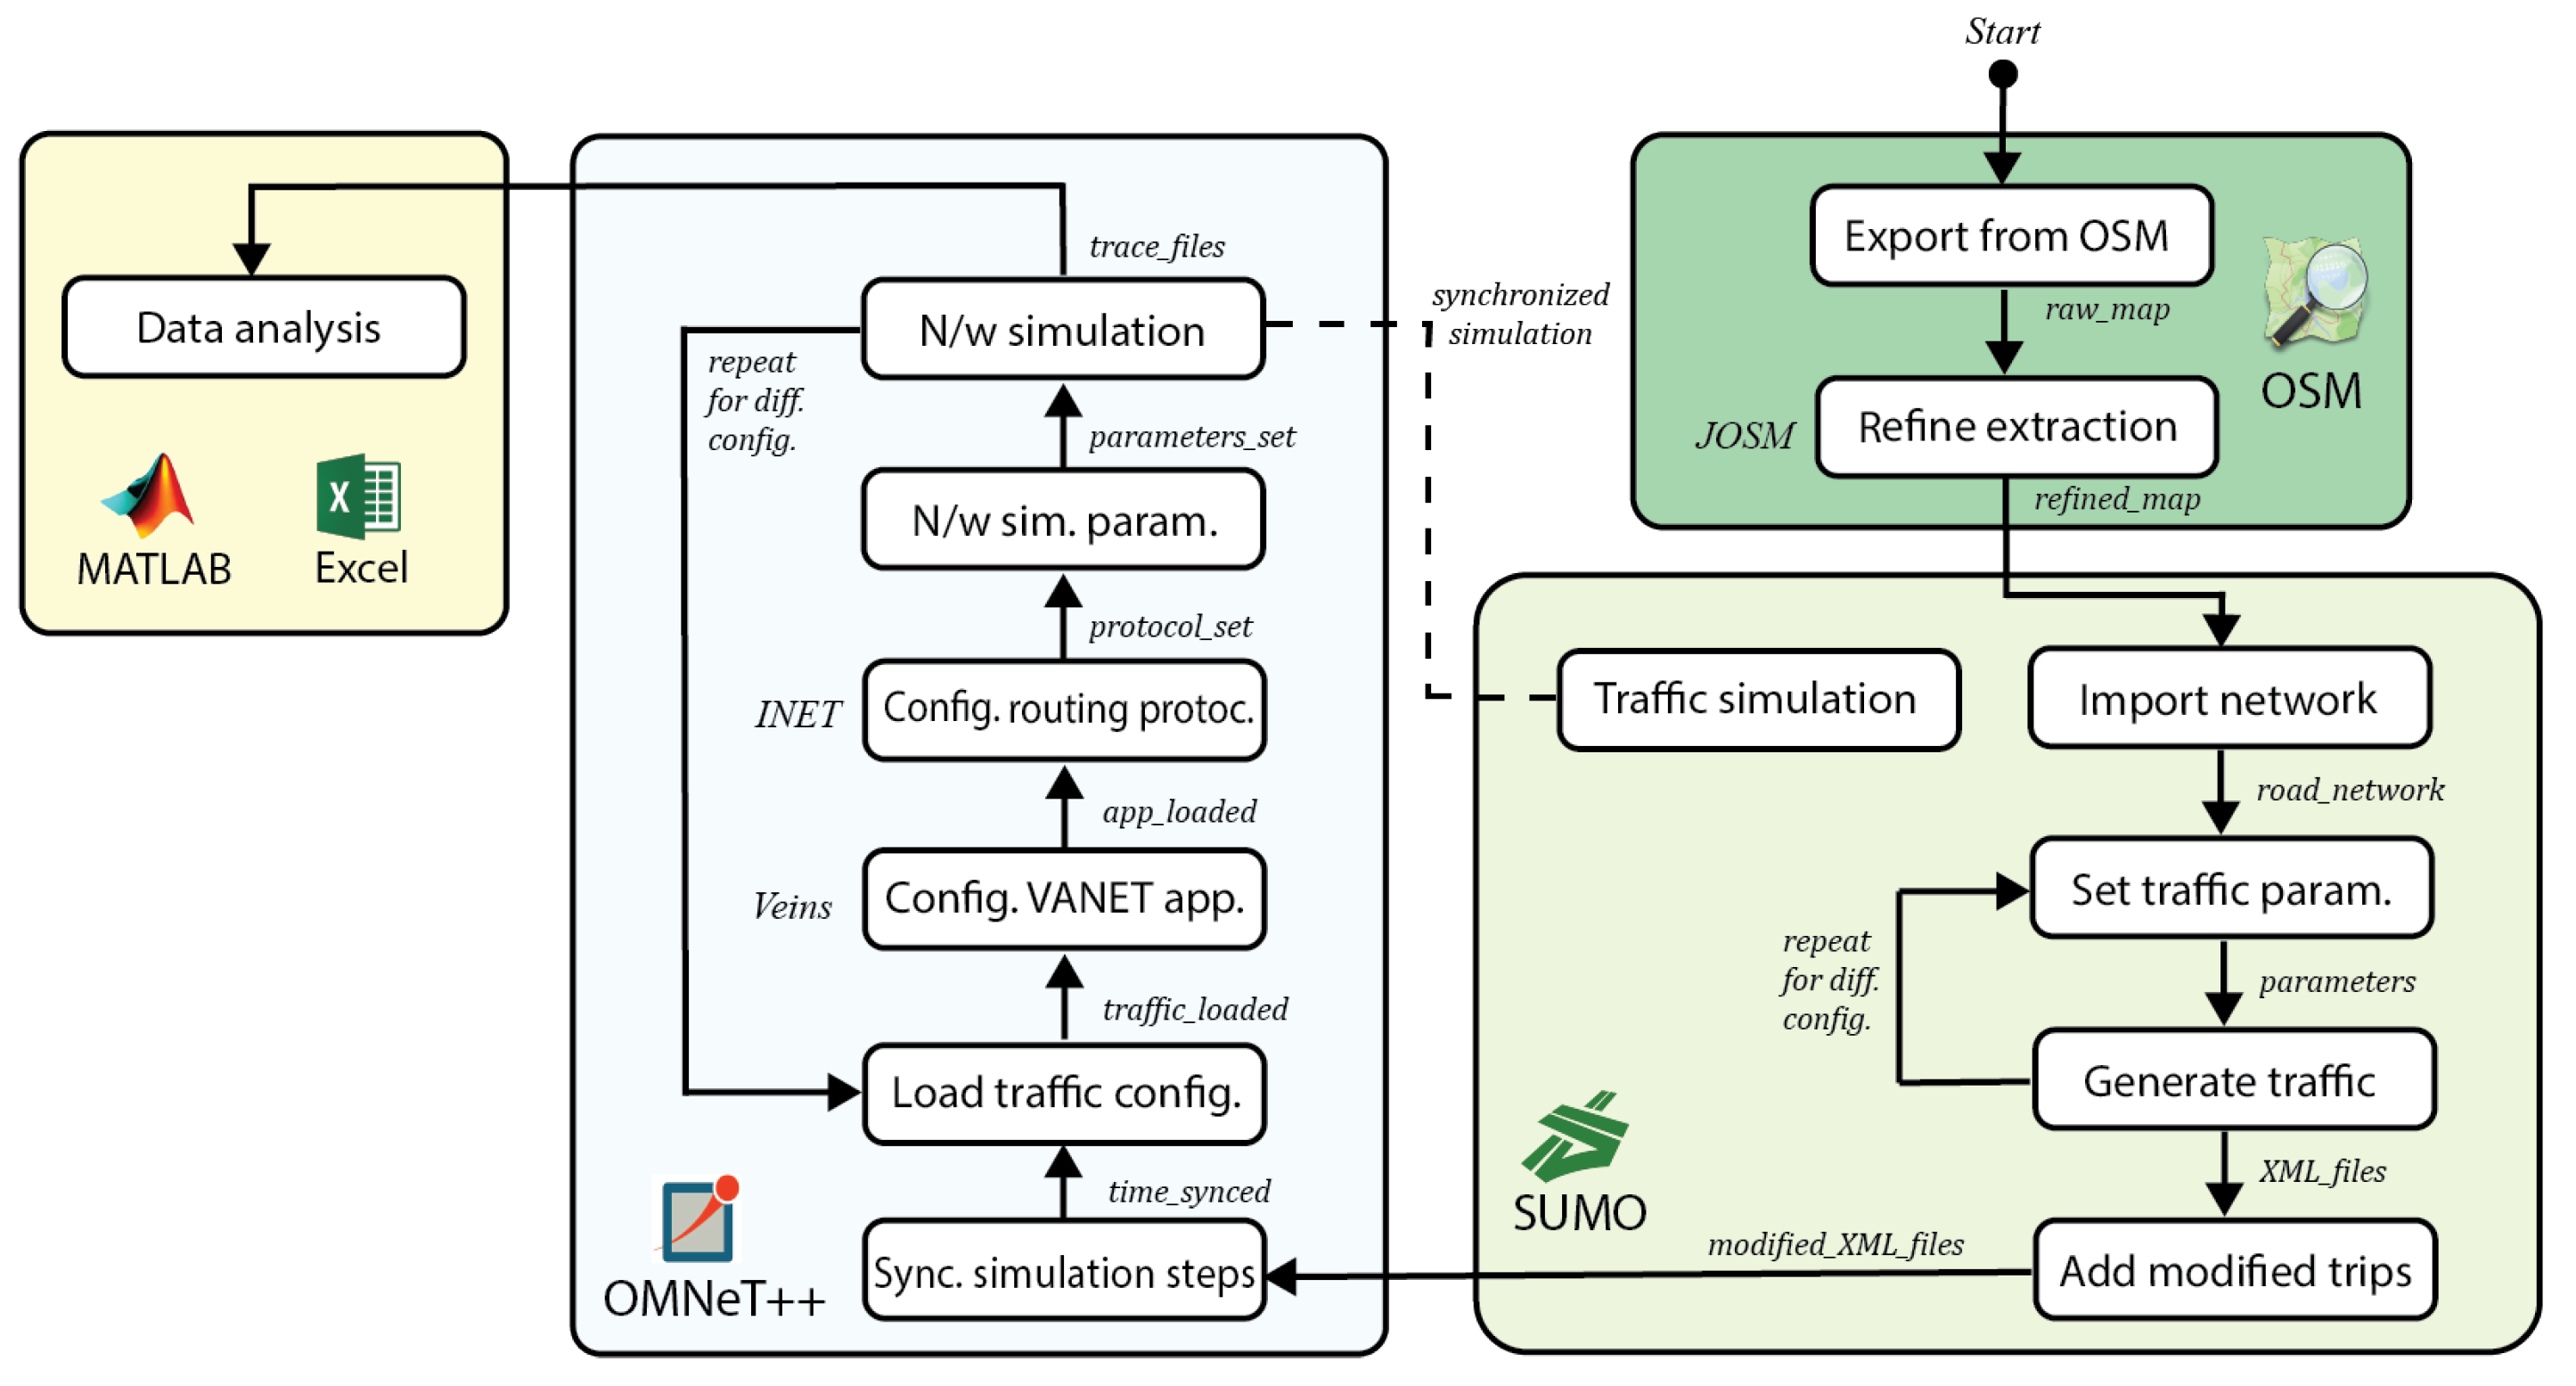
Figure 4 illustrates in further detail the steps that were taken to perform the simulation experiments between the various simulation platforms. The map extracted from the OSM platform is refined by correcting disjoint roads, missing paths, and other miscellaneous modifications. The refined map or road network is then imported into the SUMO traffic modeling tool. Traffic is generated based on the predefined parameters for various experiment configurations. The resulting set of XML files for the specific scenario is configured with a set of modified routes to measure the trip time performance measure—explained in further detail later. The set of XML files and a configuration file are imported into an OMNeT++ network simulator project where the simulation start and end times are defined in the OMNeT++ configuration file for synchronizing the simultaneous simulations. The configuration file requires the path to the XML files to load the traffic into the road network.
Two tweaks are made on the Veins imported libraries to enable the Veins VANET car to perform routing operations on network packets. The Veins accident scenario application is also modified, enabling Veins cars to propagate the accident packet to their neighbors within the communication range specified. The receiving cars further relay the packet until all vehicles in the network are aware of the accident packet. These modified Veins applications in tandem with the routing protocols provided by INET are loaded in runtime for each vehicle simulated by the SUMO simulator. The simulations are repeated for the various configurations designed for this evaluation. At the end of the simulation time, the trace files are extracted and saved for later data analysis.

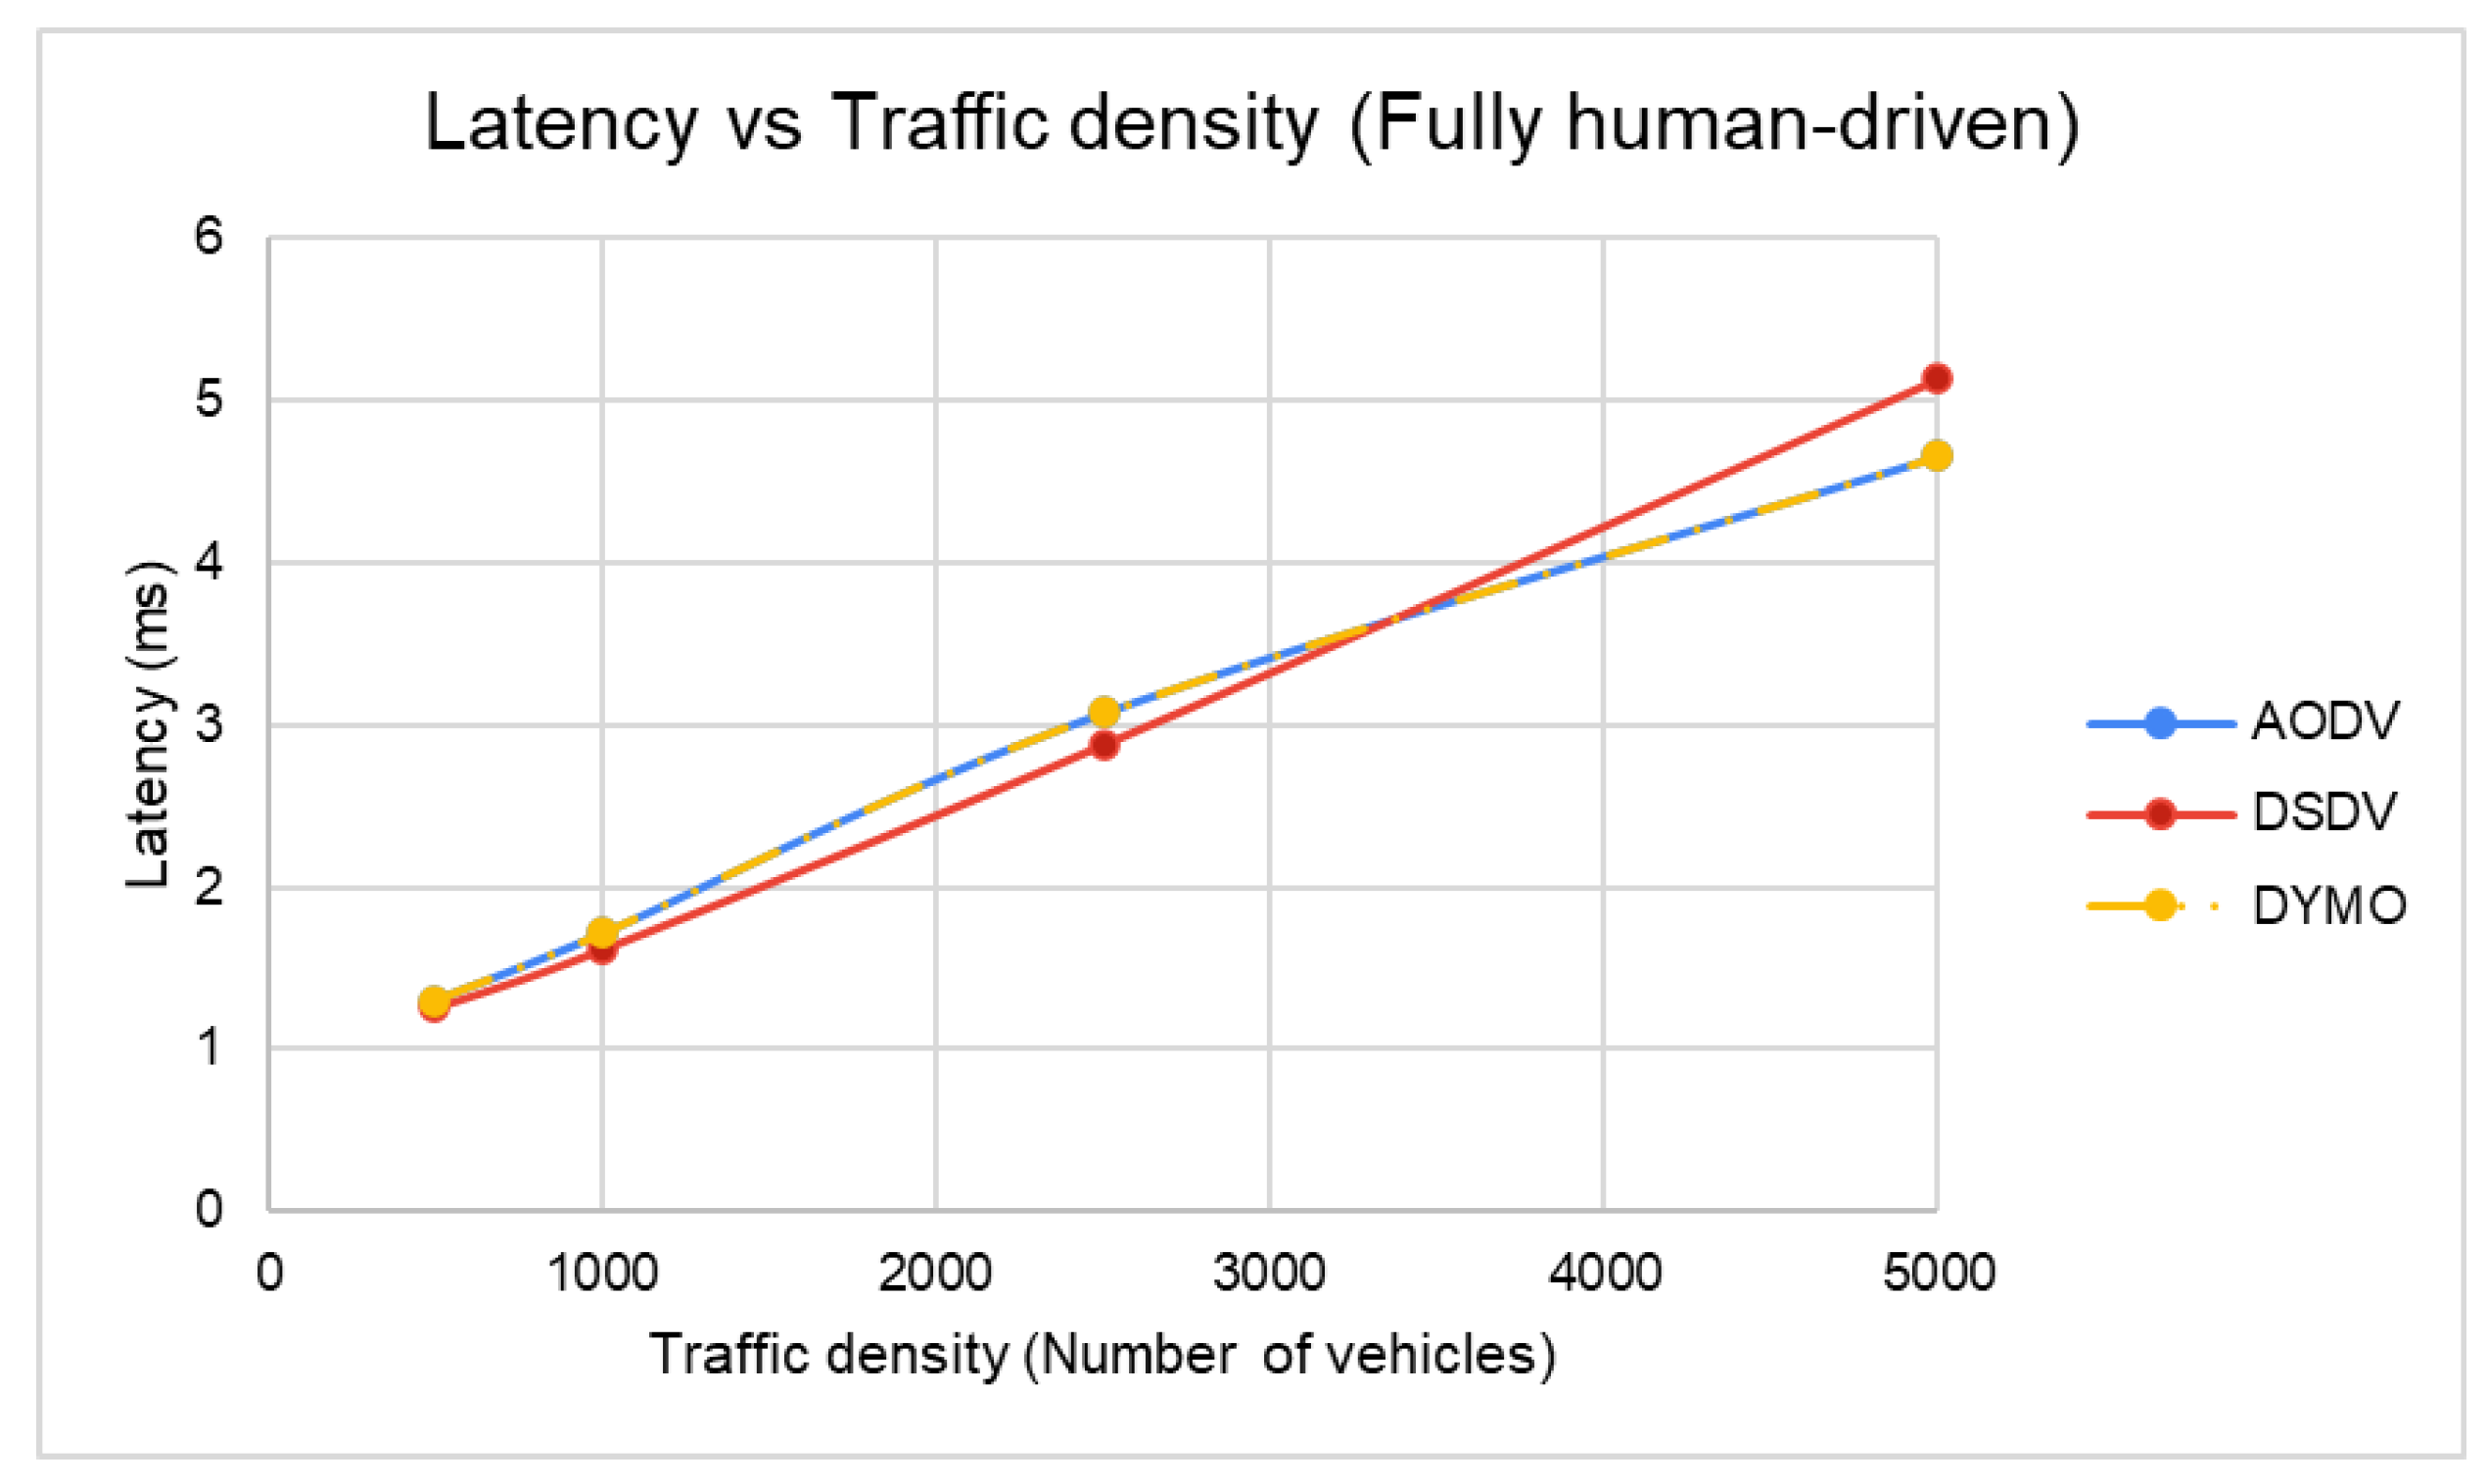
3.3. Ad Hoc Routing Protocols

Several routing protocols are implemented in the INET framework. The target of this research is to compare topology-based routing protocols [55] in certain traffic contexts. We chose the DSDV protocol as a proactive routing protocol. For the reactive routing protocol, we selected AODV and DYMO protocols for comparison.
Based on the Bellman–Ford algorithm [56,57], DSDV is a loop-free proactive routing protocol that maintains the routing table containing sequence numbers for each route in the network. A node will update its routing table when it receives a route update with a higher sequence number. If the route update has the same sequence number, a route with a better metric is selected. A periodic update of the routing tables is necessary for the DSDV protocol. Full dump or incremental update methods are used to perform the routing updates. In the full dump method, nodes transmit the whole routing table, whereas, in the incremental update, the node only transmits entries that have changed. Routing updates are broadcasted by either transmitting infrequent full dumps or frequent incremental updates. In a high dynamic topology, routing information needs to be updated more frequently, consuming more power.
Reactive protocols do not maintain routing information about all the nodes but rather only keep the information of the nodes that are present in the route. AODV is a loop-free reactive protocol where routes are generated based on demand from the source node. When a source node finds no route to the destination node, it initiates the route discovery process by flooding [58] the network with route request (RREQ) messages. After discovering the destination node, a unicast message is sent back to the source node in the form of a route reply (RREP) message. A route is established and kept in the routing table of the source node until the link is expired. If any node is unreachable due to broken links, a route error (RERR) message is broadcasted. Like AODV, DYMO is a reactive protocol in which routes are calculated on demand. However, DYMO does not support unnecessary HELLO messages and relies on the sequence numbers assigned to all the messages. Table 1 shows the characteristic comparison between Ad hoc routing protocols.

3.4. Traffic Characteristics

The dataset used to perform experiments were generated using the SUMO traffic modeling simulator due to the lack of real-world datasets available for Madinah city. The synthetic dataset contained modeling of autonomous vehicles and human-driven vehicles with different traffic densities and distributions to measure the performance difference in each test case.

3.4.1. Distributions

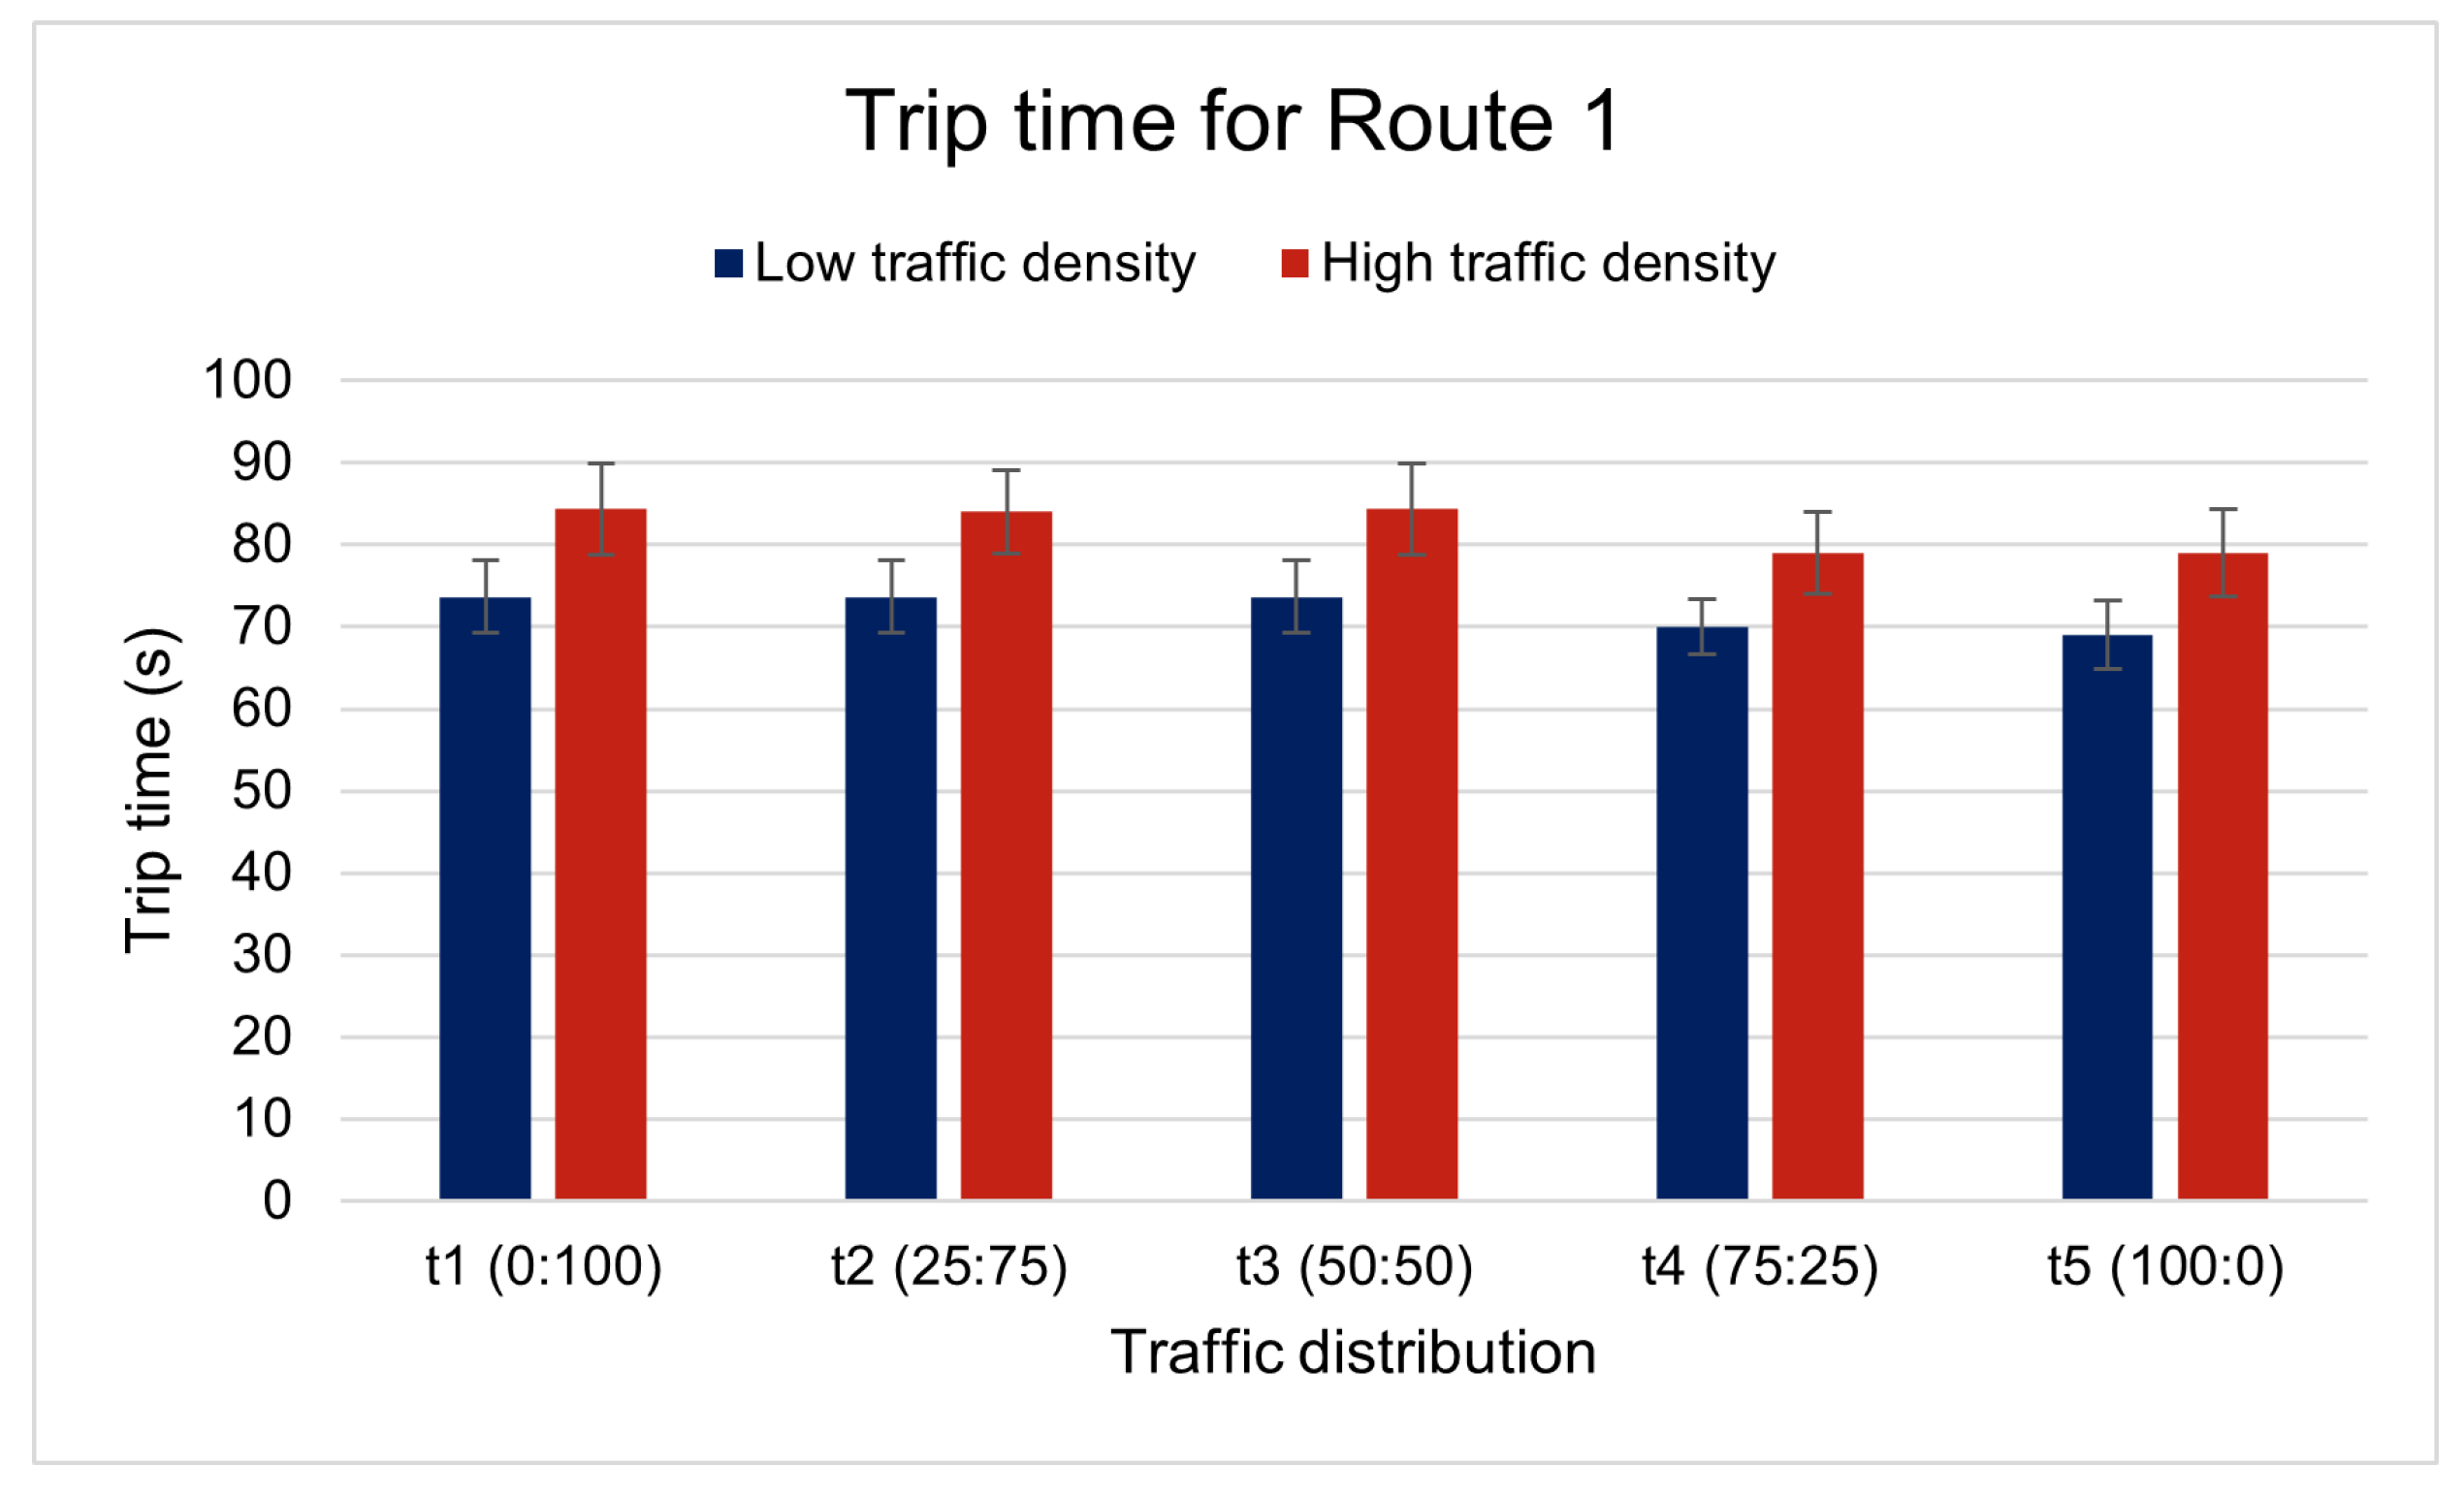
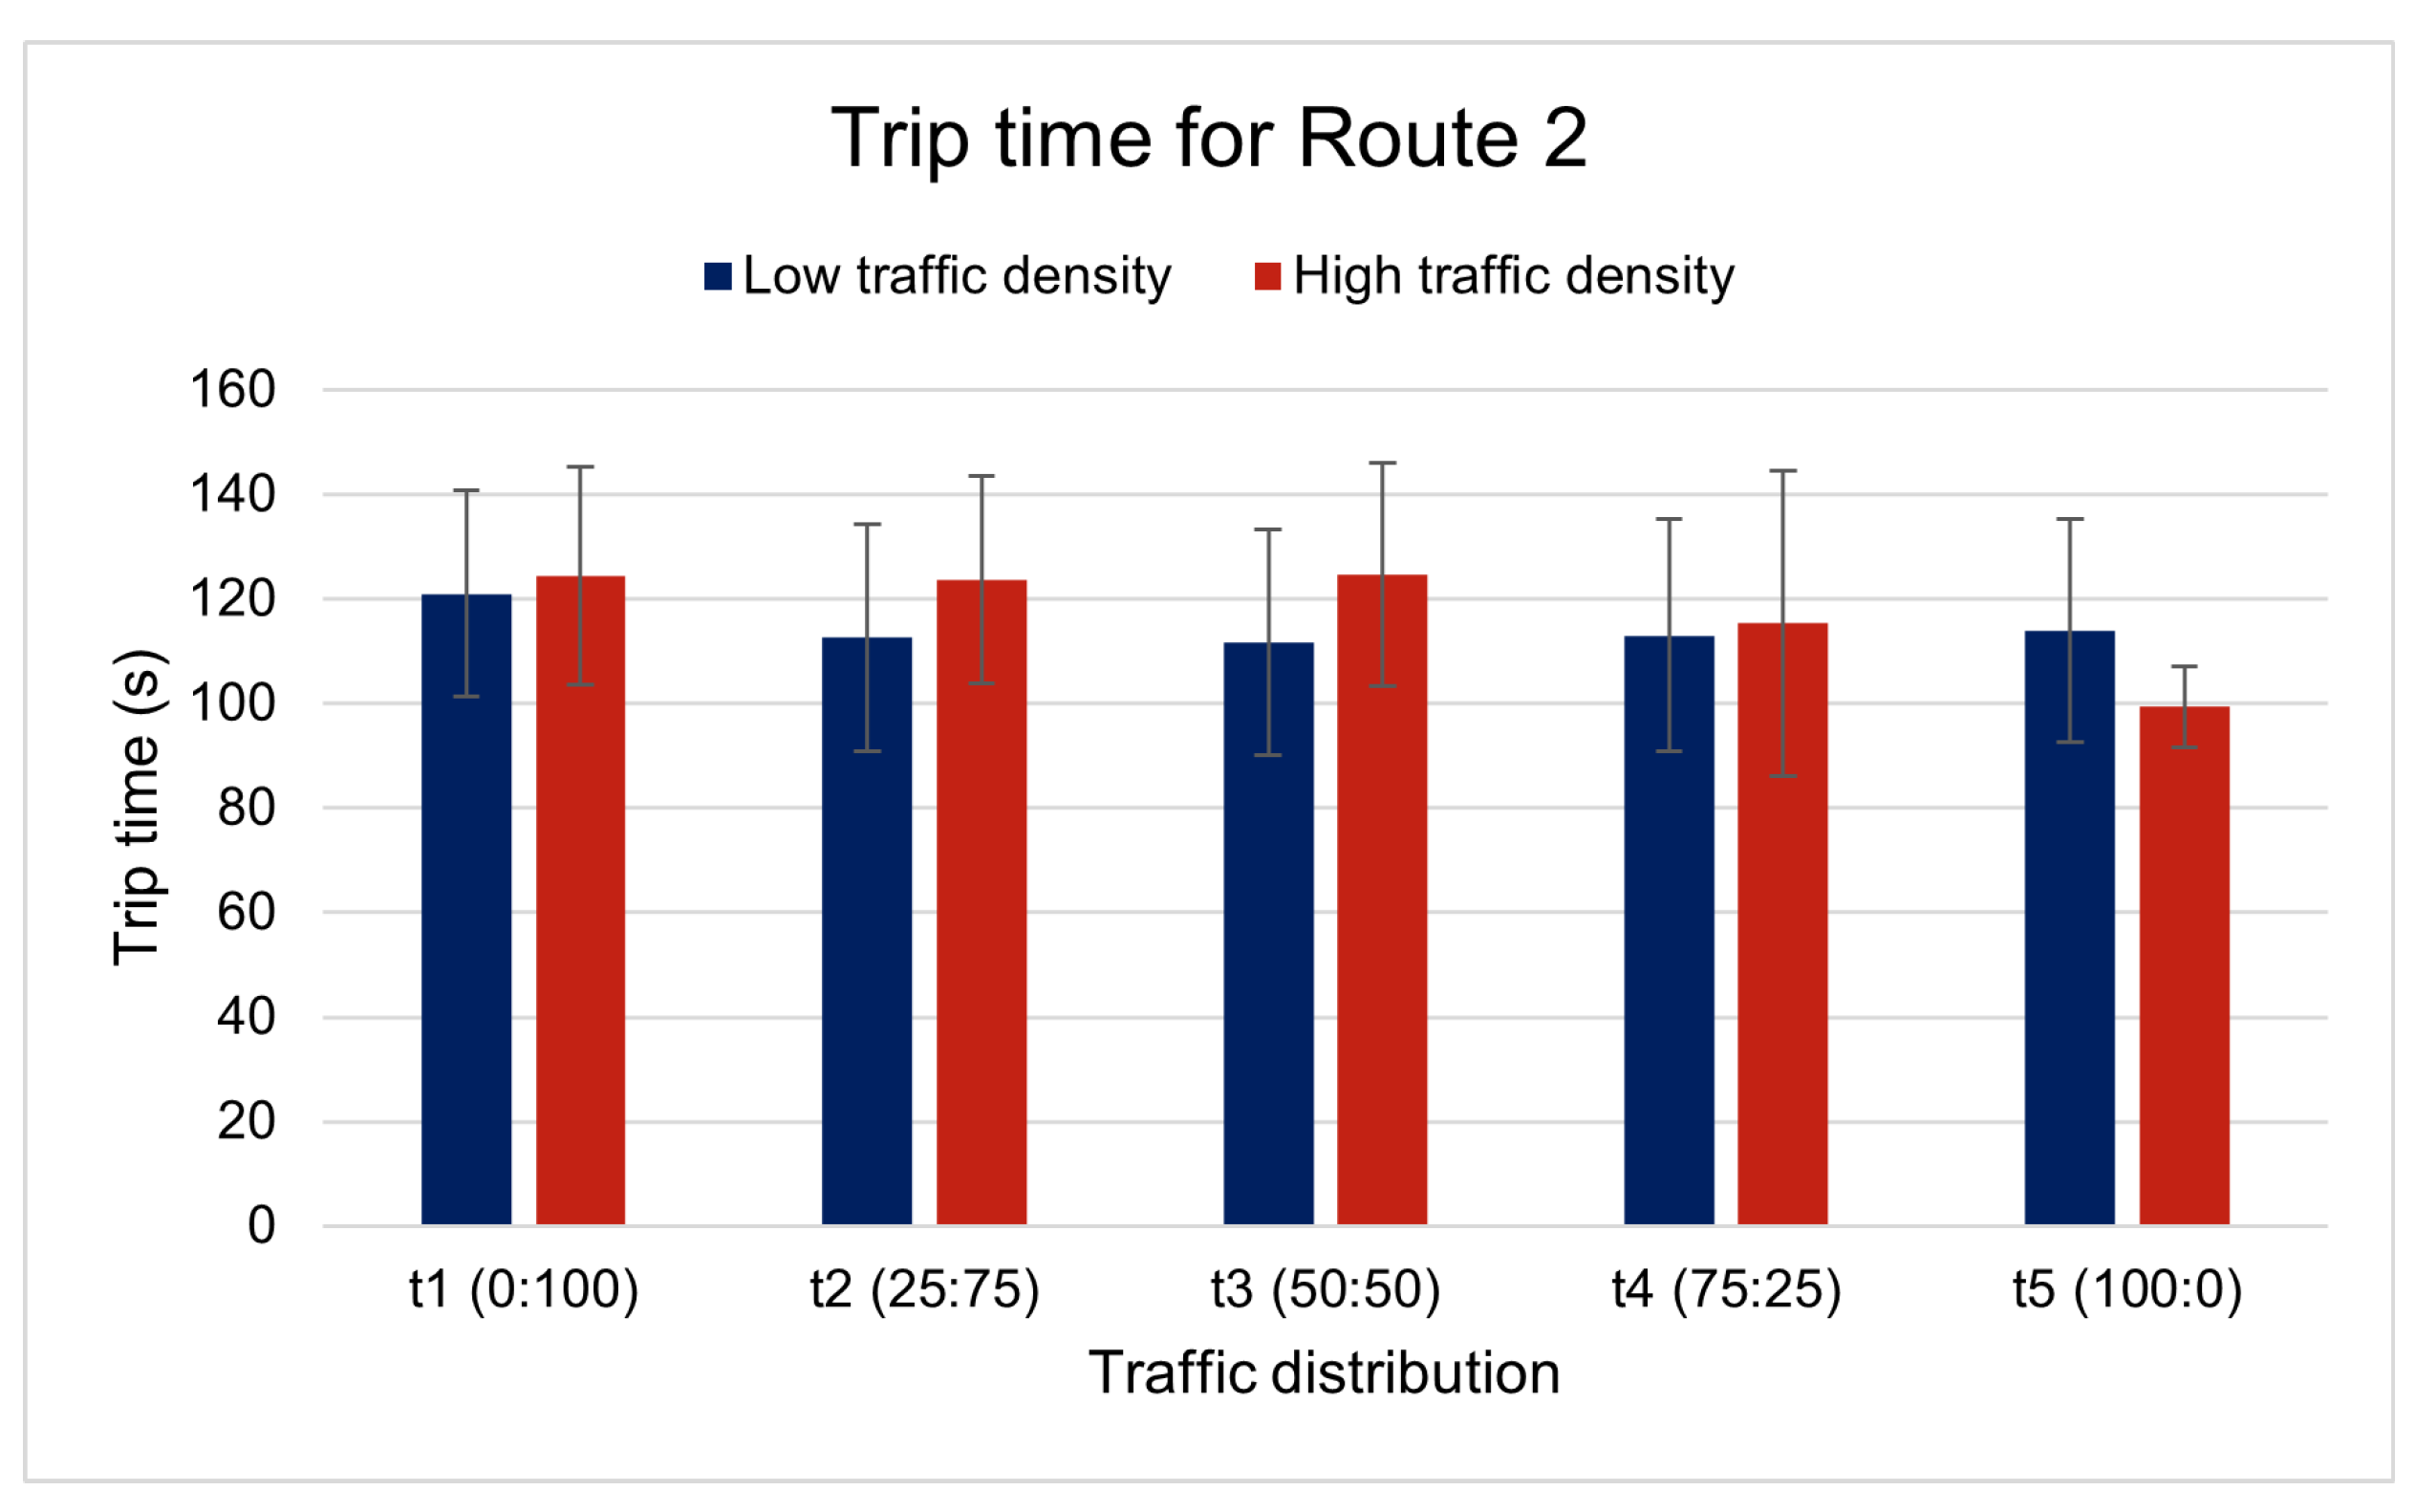
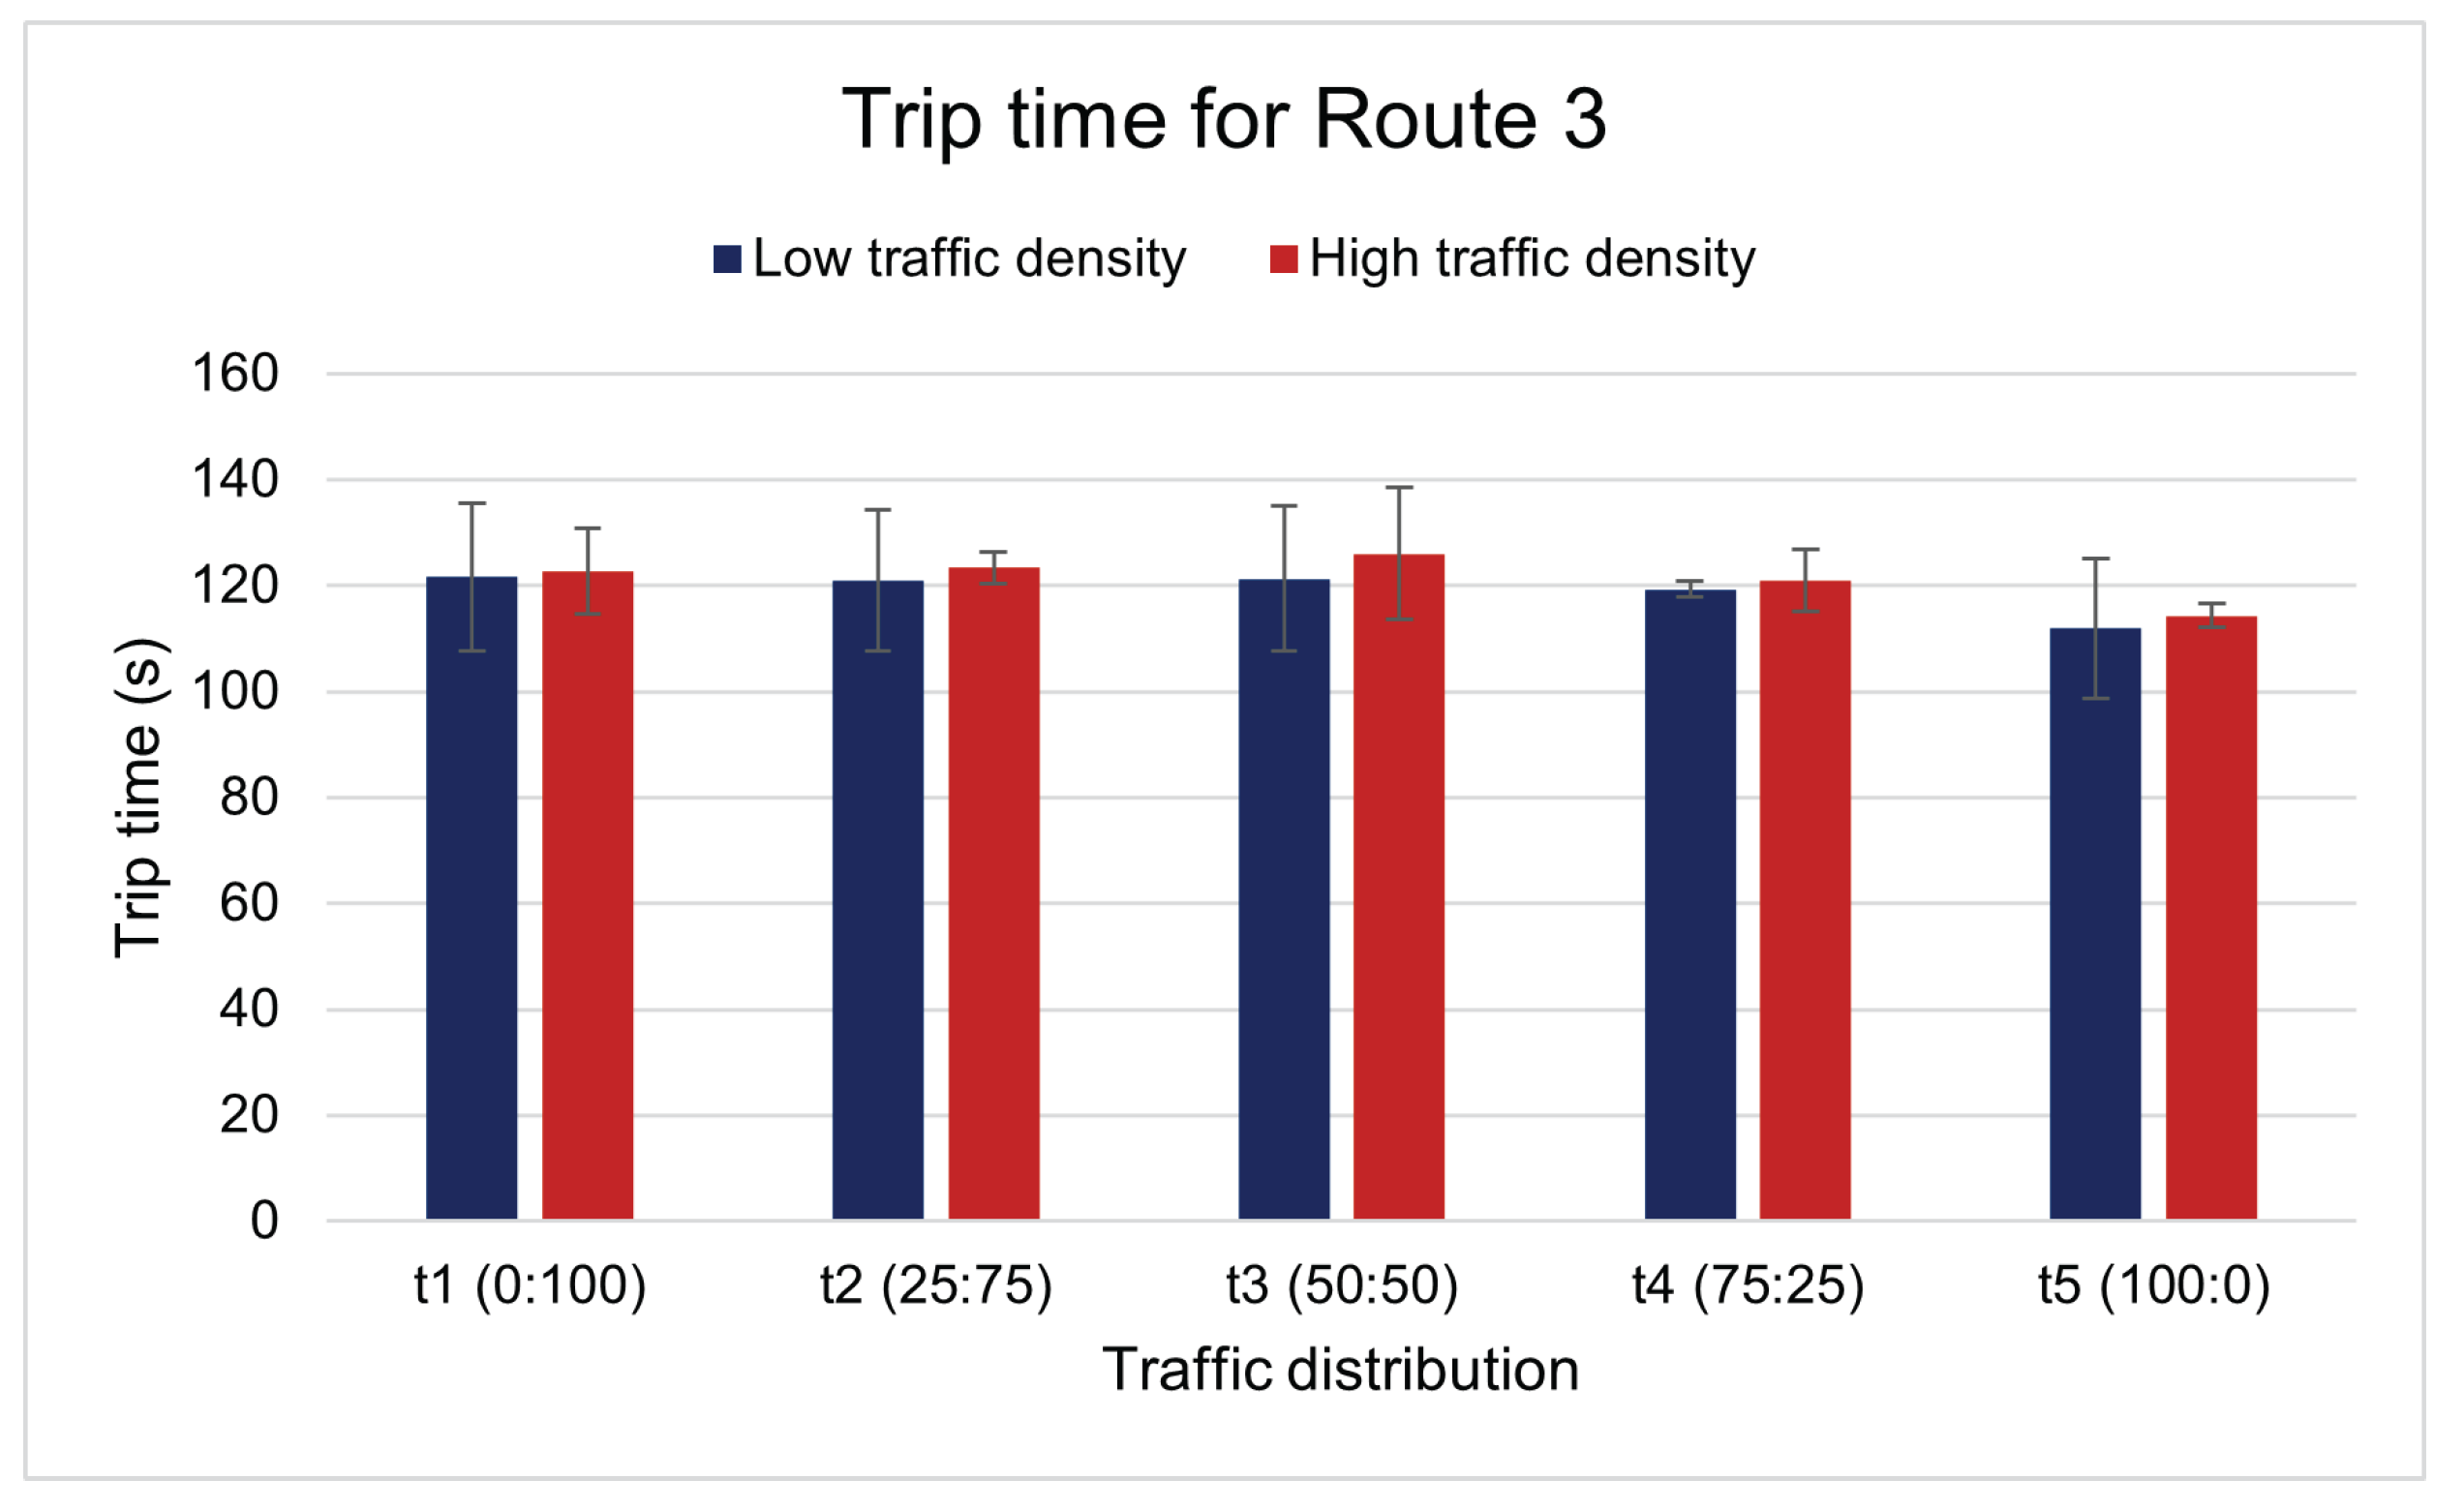
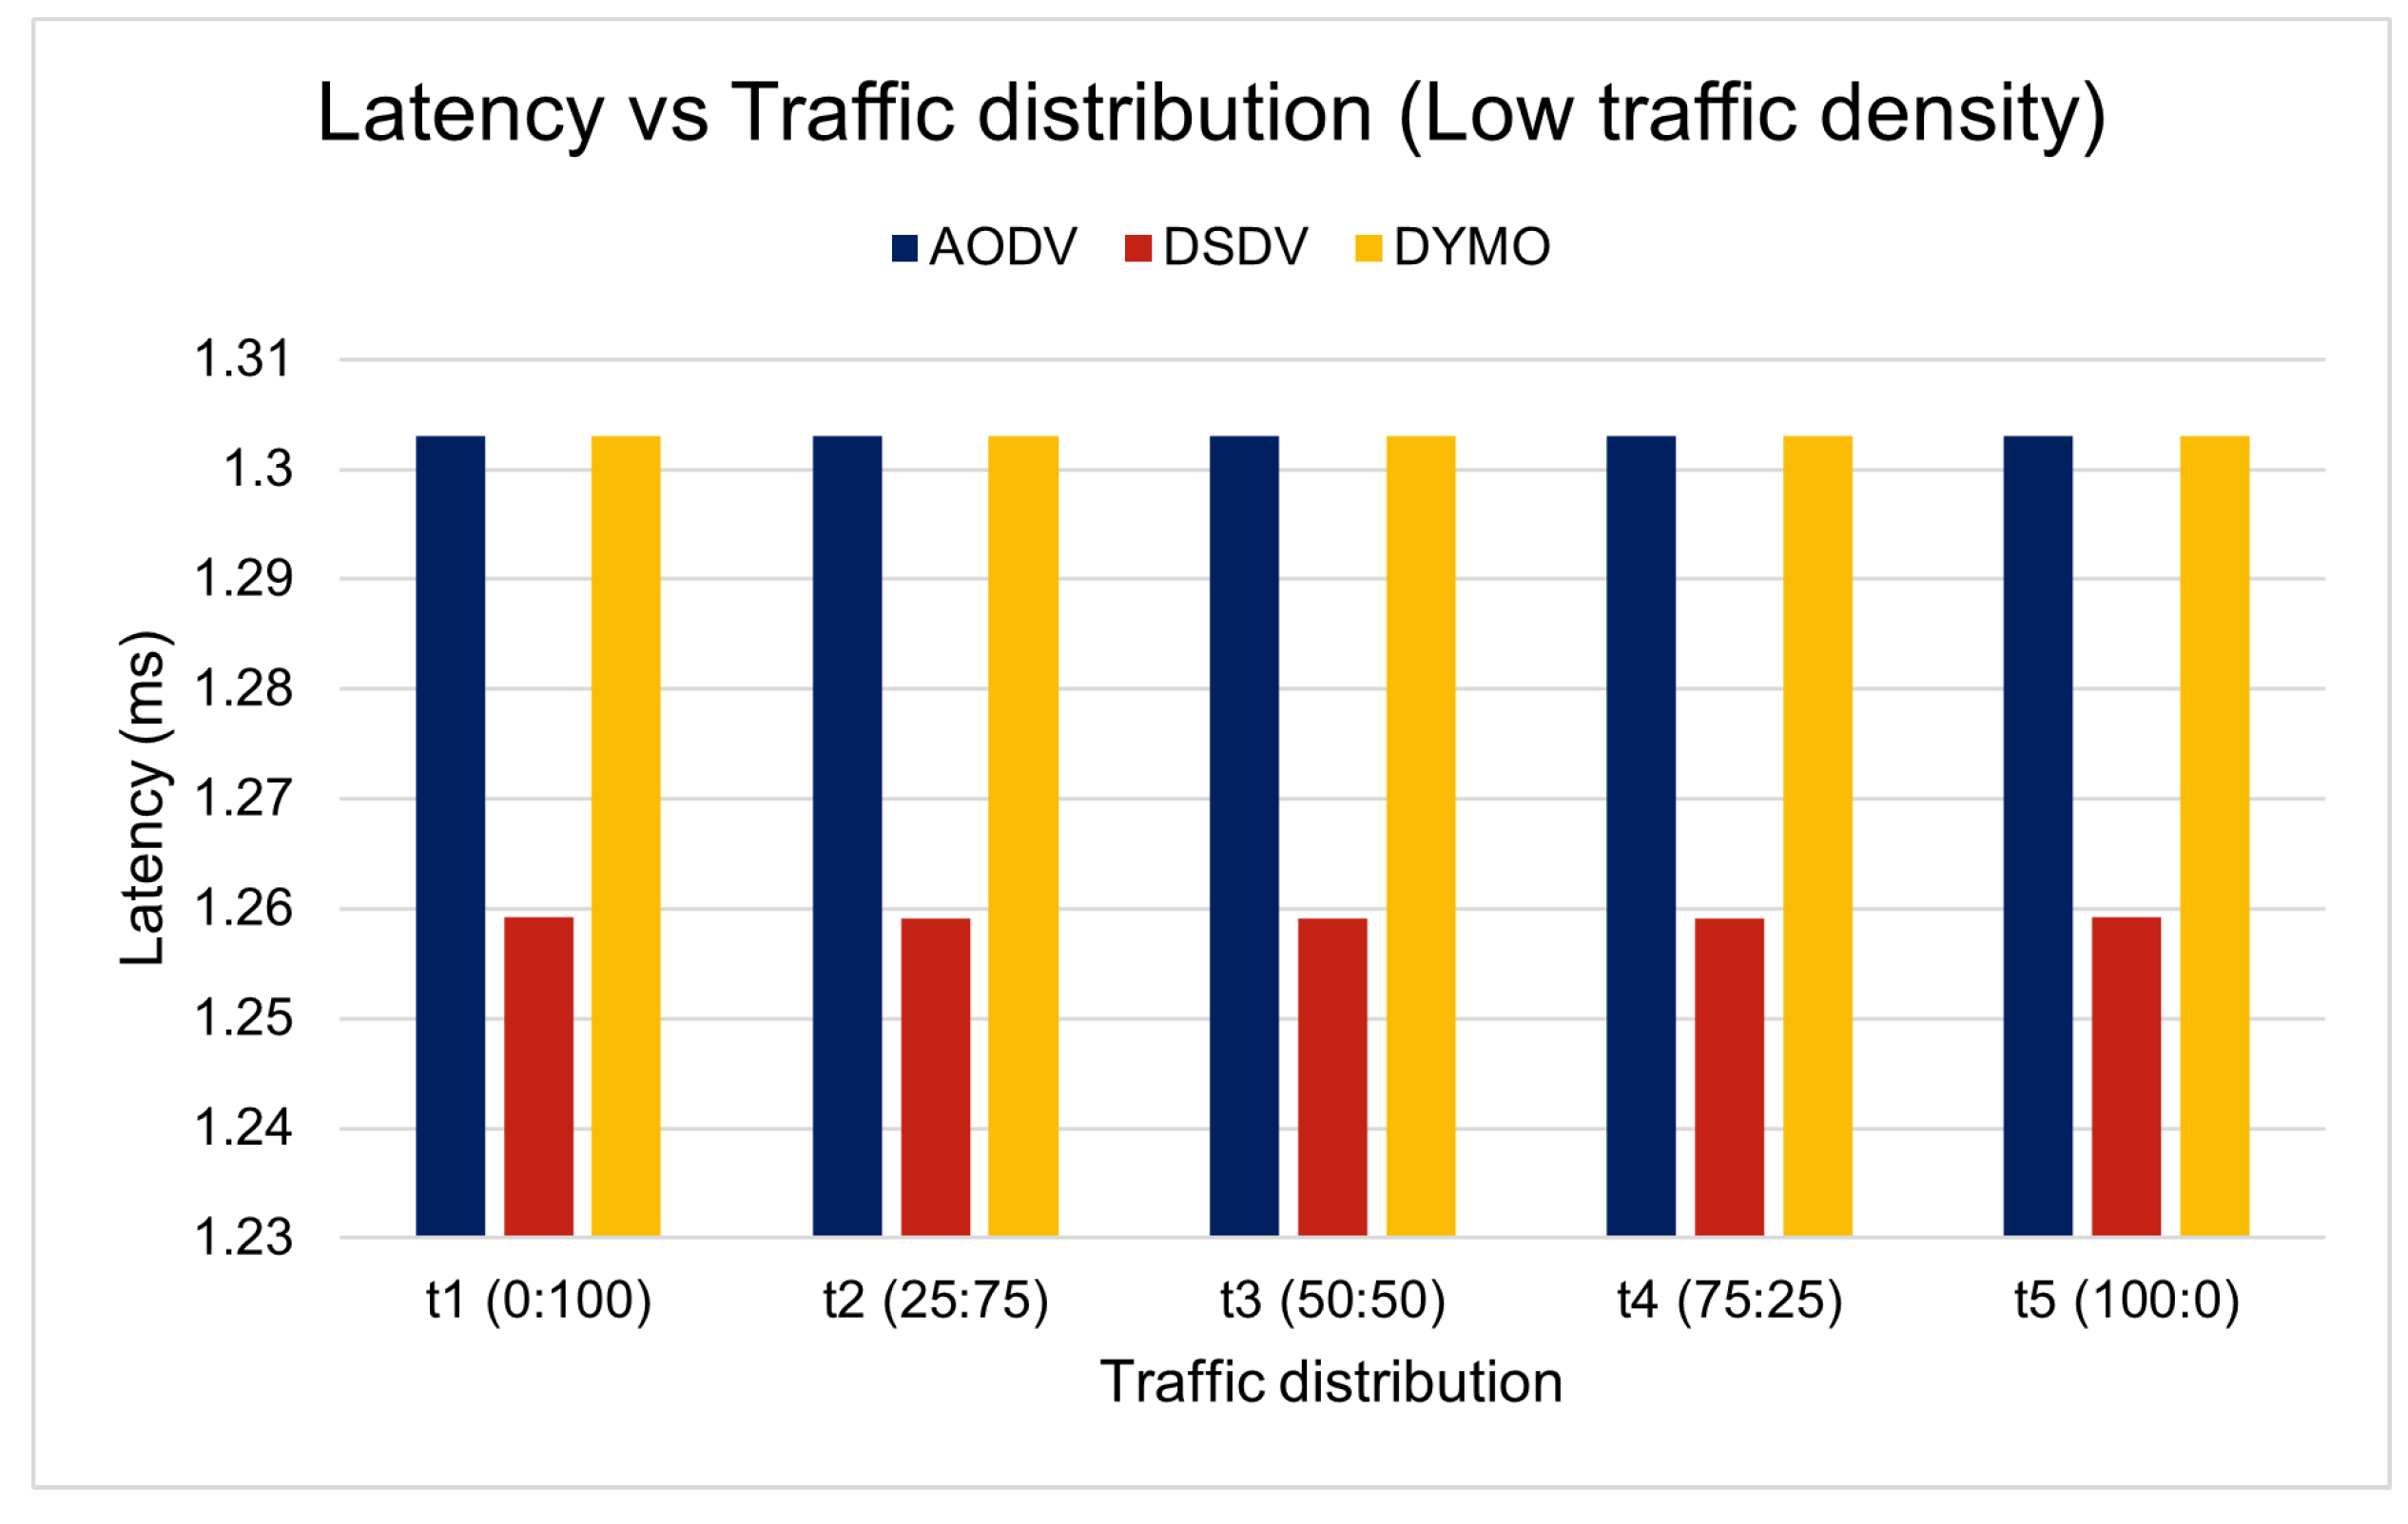
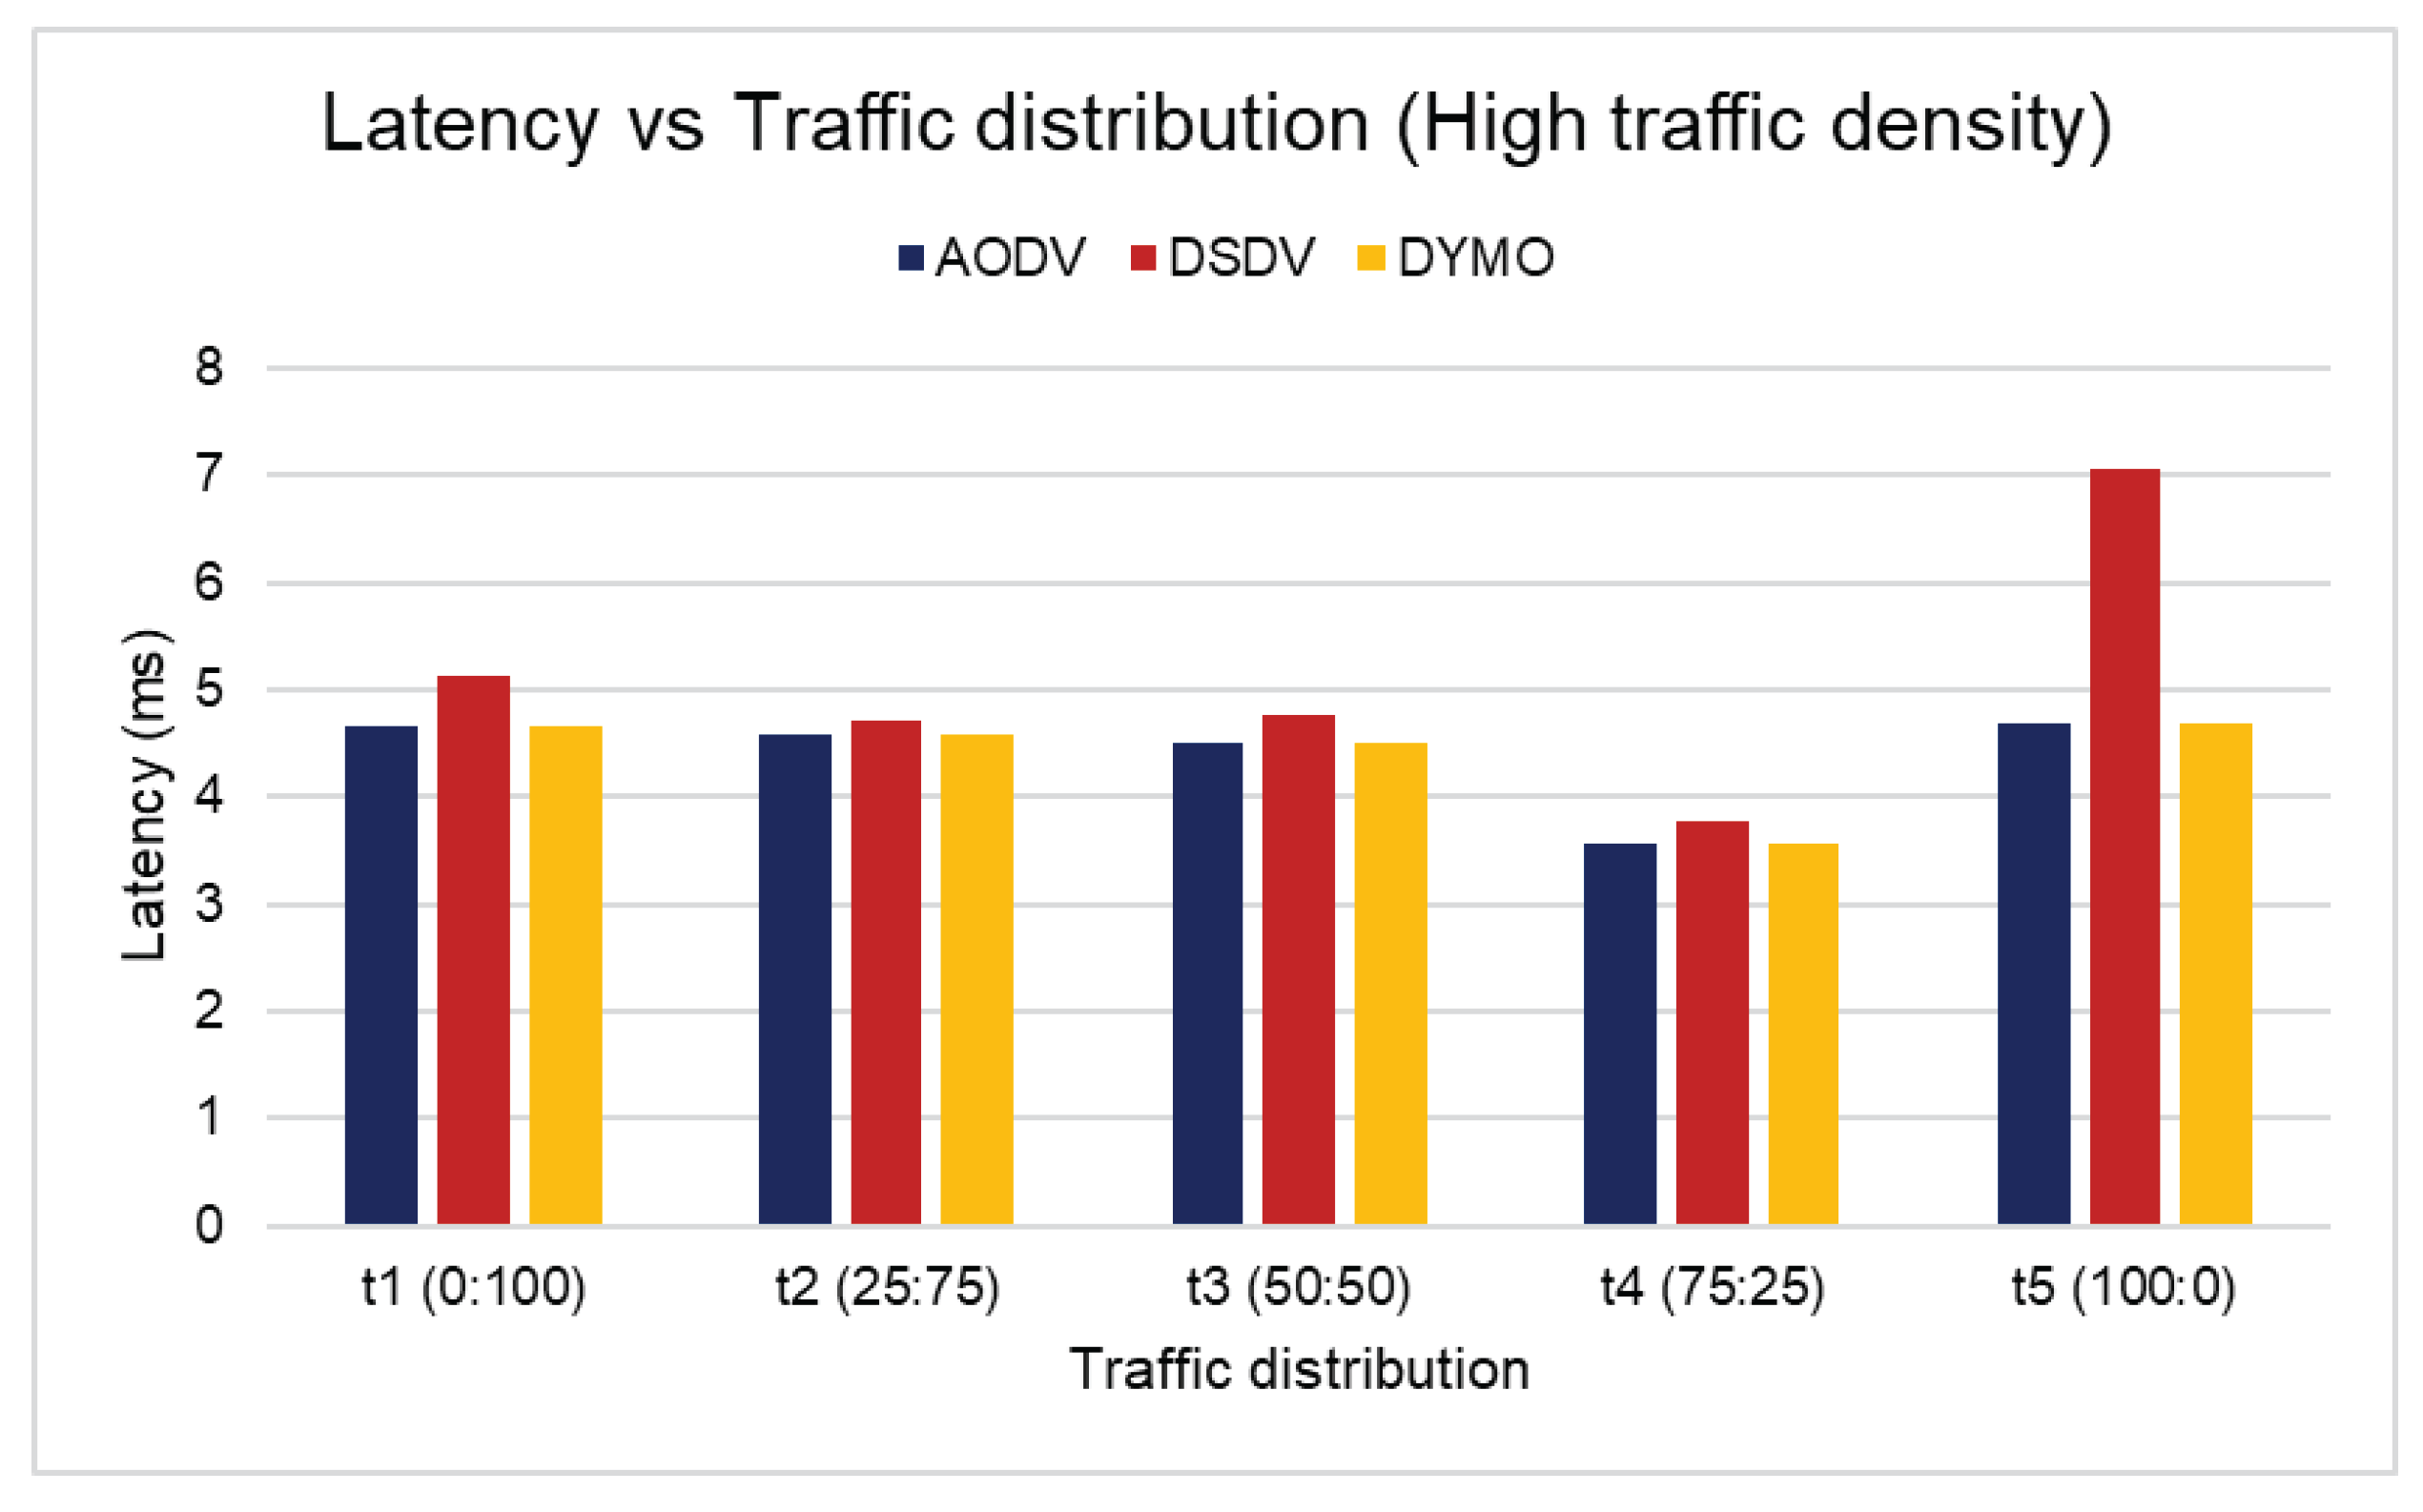
Varying traffic distributions were considered when modeling the traffic to study the effect of a higher volume of autonomous vehicles to human-driven vehicles on the performance metrics captured. Five distribution types were modeled:
  • t1—Autonomous 0: 100 Human-Driven;
  • t2—Autonomous 25: 75 Human-Driven;
  • t3—Autonomous 50: 50 Human-Driven;
  • t4—Autonomous 75: 25 Human-Driven;
  • t5—Autonomous 100: 0 Human-Driven.

3.4.2. Densities

Varying traffic densities were considered when modeling the traffic to study the effect of a higher volume of vehicles on the performance metrics captured from the two test case scenarios detailed later. Four densities of traffic were modeled:
  • 500 vehicles (low);
  • 1000; vehicles;
  • 2500 vehicles;
  • 5000 vehicles (high).
Both low- and high-density numbers of vehicles are labeled to differentiate between the performance metrics captured and discussed in the results and analysis section of this paper.

3.5. Performance Metrics

The performance metrics measured in the experiments reflected the objective of the two application scenarios:
A v e r a g e t r i p t i m e = 1 n i = 1 n d e p a r t T i m e i a r r i v a l T i m e i
A v e r a g e l a t e n c y = 1 n i = 1 n p a c k e t R x i p a c k e t T x i
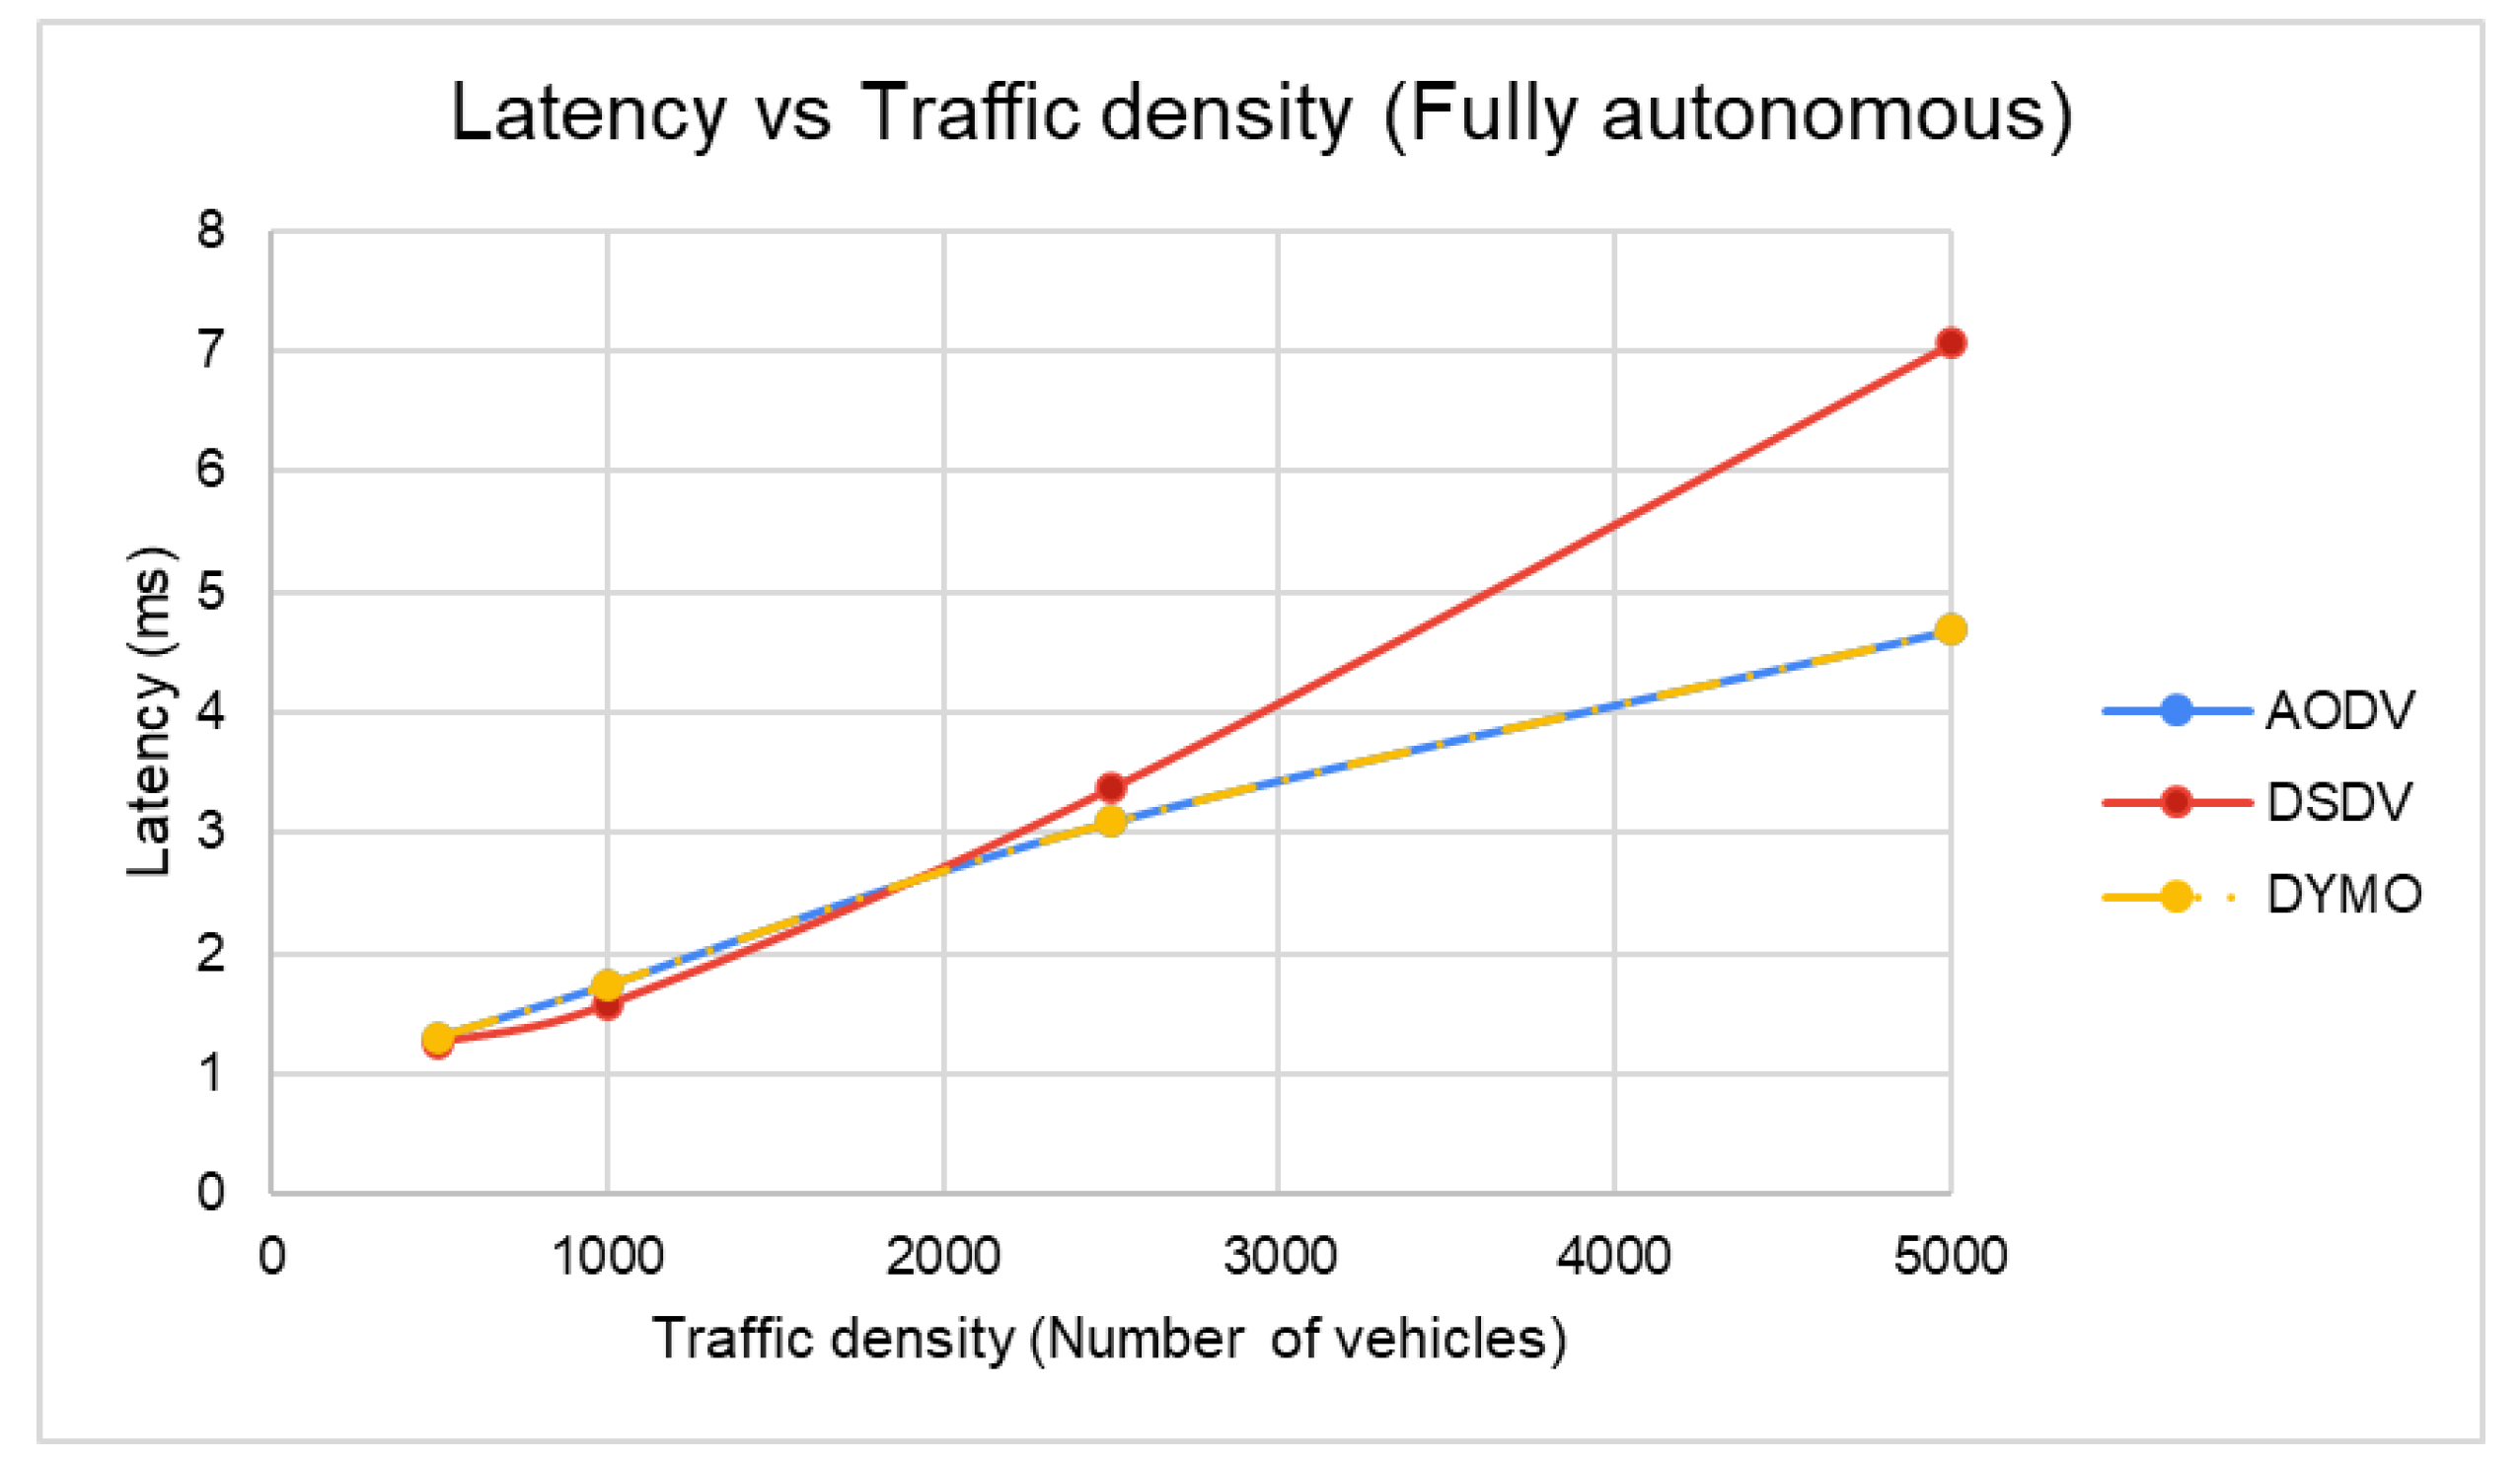
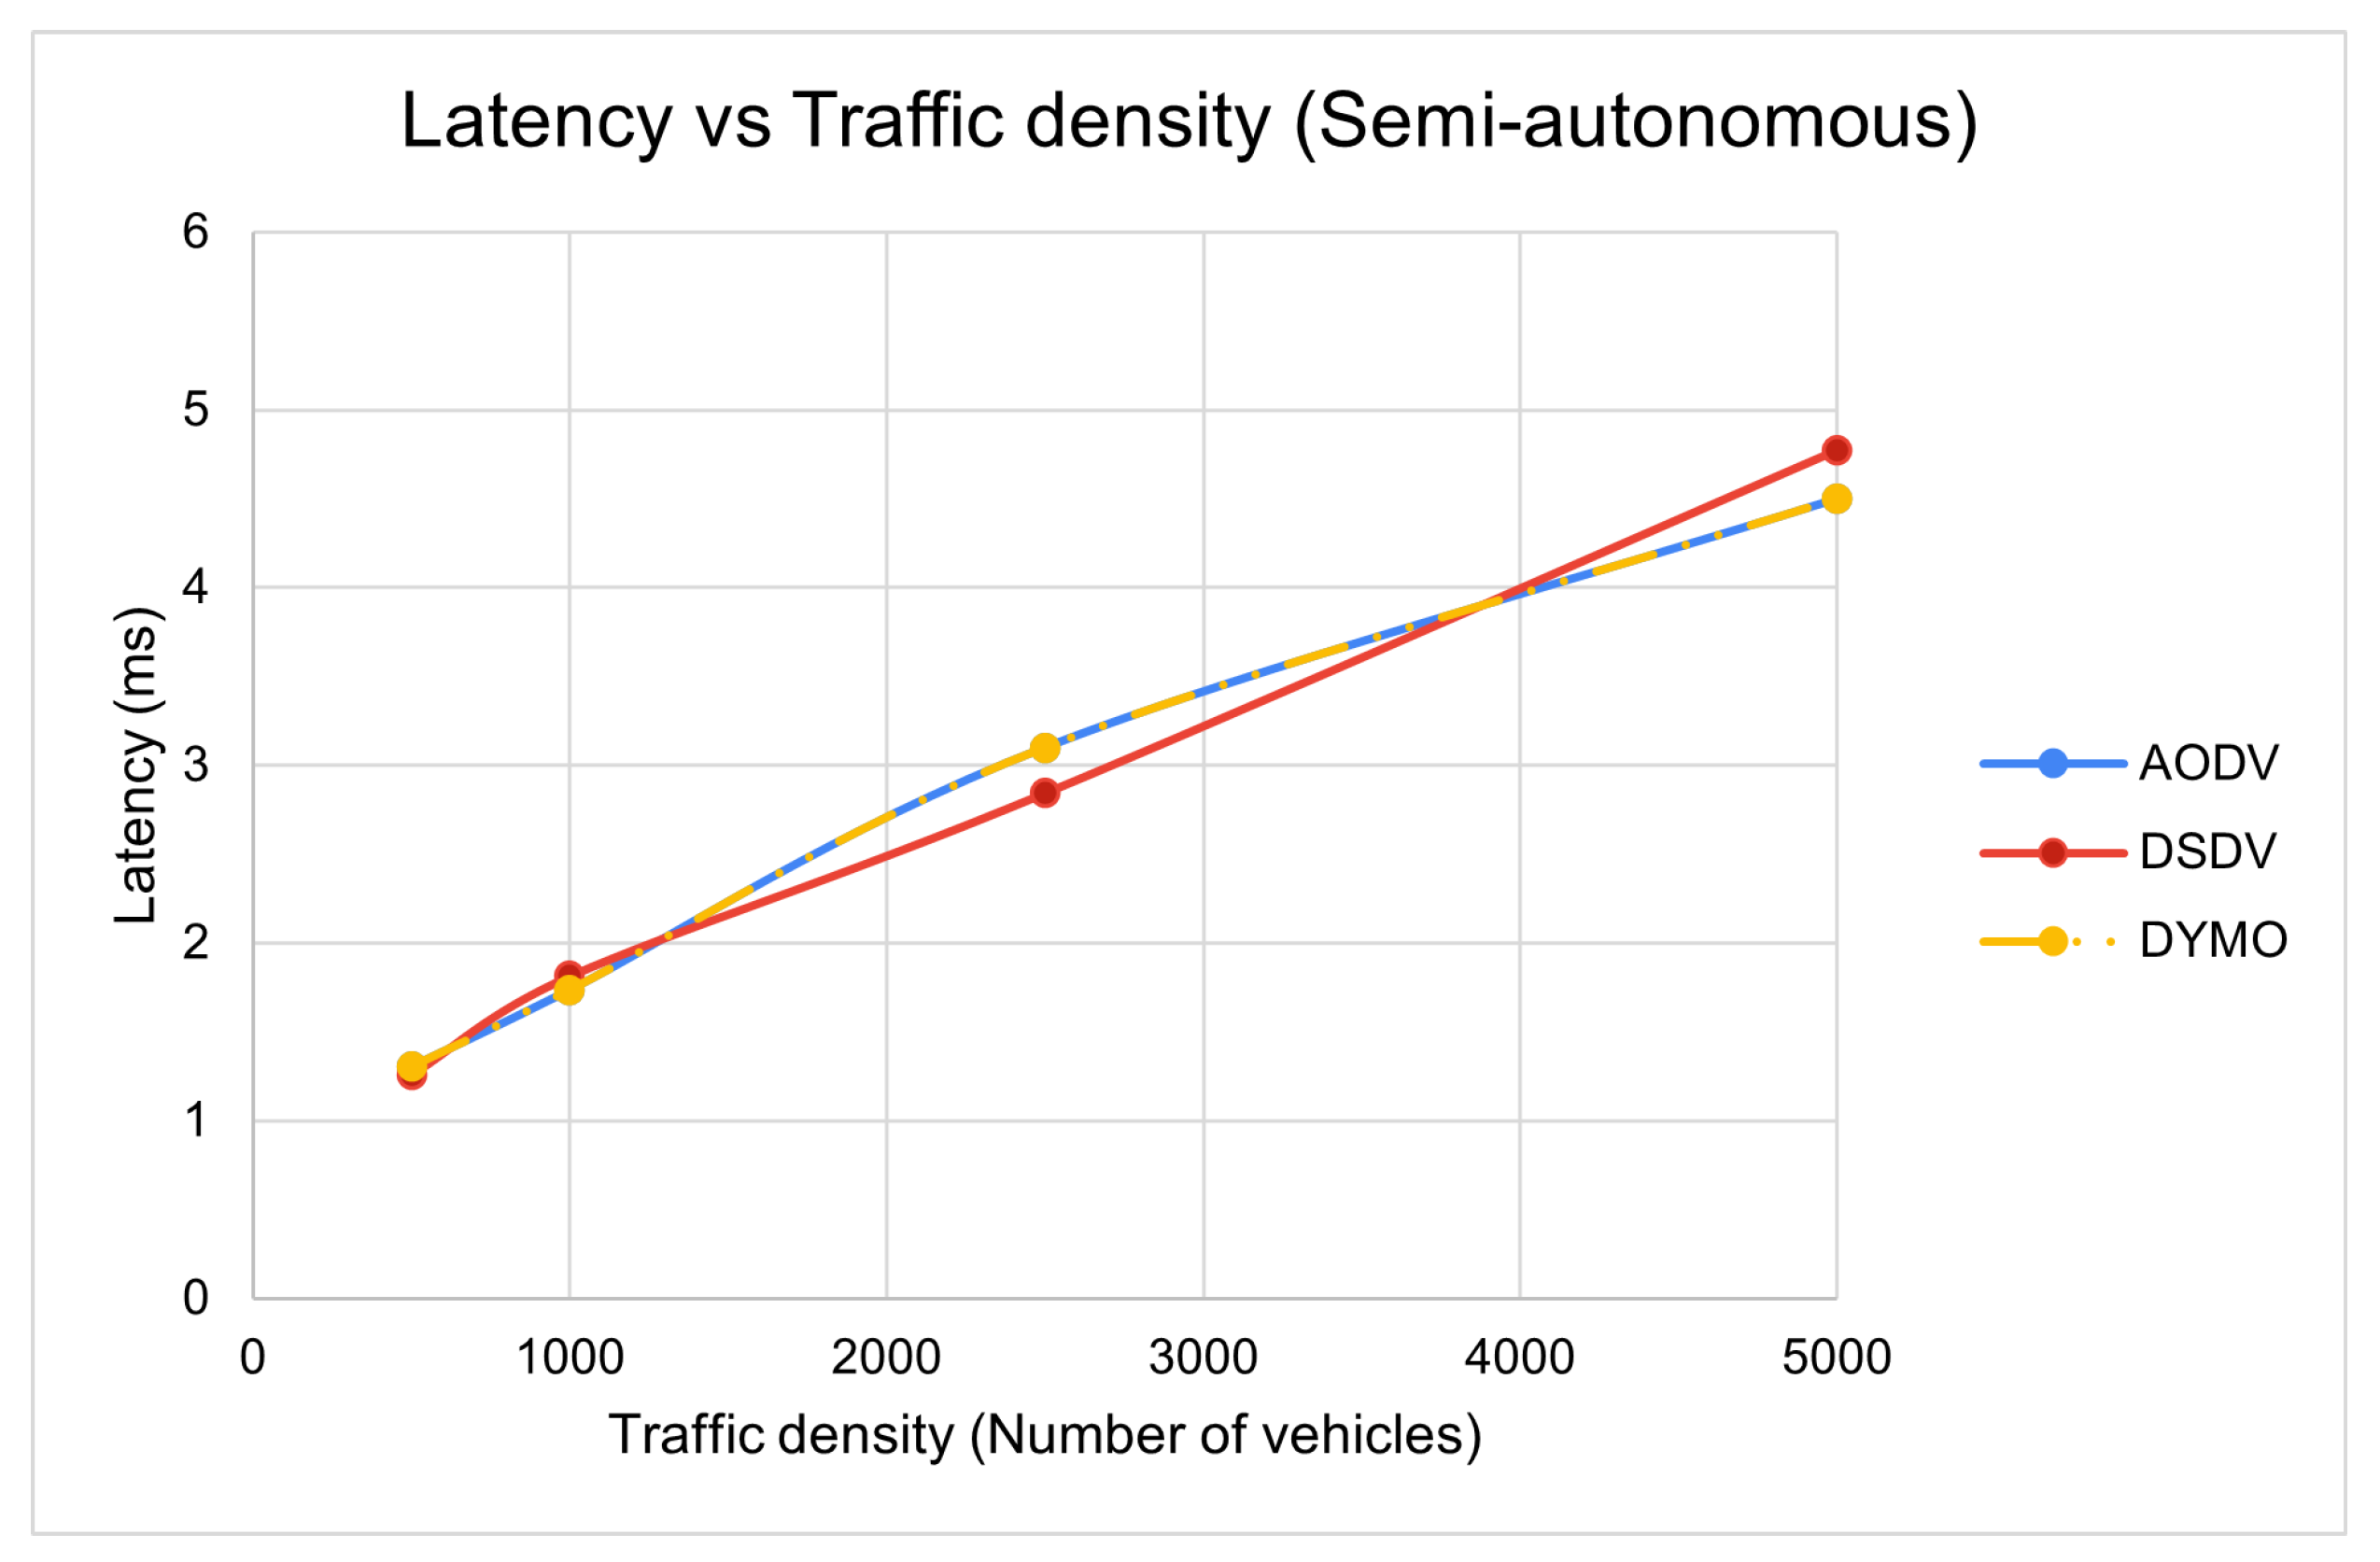
The average trip time is measured through the SUMO simulator that tracks the vehicle trajectory over the road network and measures the departure time and arrival time, even the waiting time for each vehicle that completed its route. In the case of latency, the trace file of the experiment provides time stamps of the packet transmission time and packet receiving time for specified nodes within the communication range. We compute the latency from the time the first ’accident’ packet is sent until the last node in the communication range receives the packet and acknowledges it.

4. Simulations

4.1. Simulation Parameters

Table 2 shows the simulation parameters used in our OMNet++ simulation. For radio medium, we select IEEE 802.11 Dimensional Radio with a radio band of 5.9 GHz. The number of channels for each node (vehicle) is three, which represents the number of channels within the band. The transmission power for the vehicles is set to 20 mW, while the bandwidth is 10 MHz. As mentioned earlier, we selected AODV, DYMO, and DSDV as the three routing protocols in our simulations. The simulation can be visualized on OMNeT++, as seen in Figure 5.
Table 3 details the list of parameters and their respective values for the traffic model simulations. Four traffic densities were considered with their respective arrival rates departing from a simulation time equal to 5 s. The fringe factor refers to the probability of the routes generated starting or ending at the edges of the network given to the SUMO route generator. All vehicles were of passenger class with human-driven vehicles implementing the IDM car-following model. Each traffic model was generated three times per distribution with fixed seeds, respectively, and repeated for each of the five distributions.

Car-Following Model

Drivers in SUMO may react to environmental changes at specific intervals measured in simulation time, for example, by changing the velocity of the vehicle or changing lanes. The reaction time of the driver depends on the car-following model prescribed to the vehicles in the traffic distribution configuration. The frequency of the drivers’ decision-making can be decoupled from the simulation time using the actionStepLength parameter, as presented in Table 4.
By assigning 1 s, the drivers evaluate their surroundings and make a decision every simulation time of 1 s. The parameter minGap defines the distance maintained by the driver at a full stop or ‘standing’ situations, such as congestions and traffic light stops. The table further describes the way the IDM car-following model works through the use of parameters such as the acceleration, deceleration, and emergency deceleration rates, predefined for passenger vehicles in this instance. Tau and delta are tuning parameters. The former is the minimum gap measured in the time unit that the driver will try to maintain while behind another vehicle, and the latter is the recommended value of the acceleration exponent. The acceleration exponent delta is part of the IDM differential equations to calculate the approaching rate for a given vehicle. Finally, the stepping parameter defines the internal step length in seconds for the calculation of the following speed.

4.2. Simulation Environment Specifications

Table 5 and Table 6 describe the physical host and software specifications, respectively, utilized for the simulation experiments and analysis of the captured metrics.

4.3. Test Scenarios

4.3.1. Custom Trips

In this scenario, three custom trips were created for each of the various traffic distributions and densities to measure the trip time for a vehicle from a point of interest moving towards the Prophet’s Mosque. This is an example case of a taxi vehicle providing a service to the pilgrims arriving in the city. The three routes use a primary highway and move towards the major Ring Road encircling the Prophet’s Mosque and nearby accommodations, then move towards the local roads to drop off the pilgrim at the nearest location to the mosque.
This test case scenario, executed and averaged over repetitions, provides the researchers with an estimate of the impact of traffic distributions and densities on the single trip journey of pilgrims from various points of interest. Three custom vehicle trips were considered moving towards the Prophet’s Mosque:
  • West Highway to Prophet’s Mosque (Figure 6);
  • South Highway to Prophet’s Mosque (Figure 7);
  • North Highway to Prophet’s Mosque (Figure 8).

4.3.2. Communication Latency

This test scenario aims at collecting information on the packet transmission delays when a VANET node sends a packet to all neighboring nodes within a specified communication range, determined by the communication power of the radio antenna. In this case, an accident is simulated on a vehicle in the network, blocking the road. Then, a packet alert is broadcasted to the nearest VANET vehicles, warning them of an accident. These vehicles relay the packet to their neighbors until all the vehicles in the environment have received the accident packet. Once the alert is received, the alternative route to the destination is taken by vehicles to avoid the congestion caused by the accident.

5. Results and Analysis

The results for our experiments are based on the traffic characteristics discussed earlier. We consider studying the average trip time and average latency with different traffic distributions under varying traffic densities. Furthermore, we performed an Analysis Of Variance (ANOVA) test to study the impact of various factors on the system performance in terms of average trip time and latency.

5.1. Average Trip Time

The average trip time is calculated using Equation (1) for different routes with varying traffic densities and distributions. The graphs are plotted with confidence intervals with a confidence level of 90% to measure the uncertainty and establish if the results are statistically significant.
The average trip time for Route 1 with varying traffic distributions can be seen in Figure 9. The difference in the average trip time for low and high traffic densities is about 10 s. The average trip time is reduced by up to 7.1% for a fully autonomous traffic distribution under high traffic density. Traffic distributions t1, t2, and t3 have similar average trip times for low or high traffic densities. However, traffic distributions t4 and t5 achieved shorter average trip times for both types of traffic density. We consider a 90% confidence level attributing to the confidence internals in the graphs. The confidence intervals are barely non-overlapping for each group, denoting they are statistically significant and not random.
In Figure 10, the average trip time for Route 2 against different traffic distributions is shown. At a low traffic density, the average trip time decreases with an increase in autonomous level. The average trip times for t1, t2, and t3 traffic distributions are similar at a high traffic density. The average trip time further decreases for t4 and t5 traffic distributions. A fully autonomous traffic distribution incurs the least average trip time at a high density. The confidence intervals overlap, signifying that the results are not significant. Hence, we tend to perform ANOVA tests to investigate the results and study the effects of the factors on the results.
Figure 11 shows the average trip time for Route 3 against varying traffic distributions under low and high traffic densities. The average trip time would be higher for any traffic distribution with a high traffic density. The difference in average trip time at low and high traffic densities is highest for semi-autonomous traffic distribution. A fully autonomous traffic distribution incurs the shortest average trip time at any traffic density. Although the confidence intervals overlap, the mean does not fall in the confidence intervals for traffic distributions t2, t4, and t5. Hence, an ANOVA test would predict the effect of the factors on the variation of the results.

5.2. Average Latency

The latency graph for fully human-driven traffic distribution with varying traffic densities is shown in Figure 12. It can be seen that latency increases with a higher traffic density. Looking at this graph, it can be observed that the difference between reactive and proactive protocols is not very significant. At a lower traffic density, i.e., less than 3300 vehicles, DSDV outperforms both reactive protocols (AODV and DYMO). Once the vehicle density increases beyond 3300, the reactive protocols provide less latency. The reason behind the increased latency in a higher density is because more nodes will send the acknowledgments to the sender, compared to the lower traffic density, which will take more time to wait and send in order to avoid collisions.
For a fully autonomous traffic distribution, as seen in Figure 13, the latency is slightly higher for AODV and DYMO protocols when the traffic density is less than 1900 vehicles. With increasing traffic density, the DSDV protocol is outperformed by the AODV and DYMO protocols. The difference in latency is about 2.38 milliseconds, with DSDV having significantly higher latency. Therefore, as the traffic density increases, reactive protocols tend to perform better for a fully autonomous traffic scenario. The reason behind the increased latency in the DSDV protocol is the control packet overhead caused by the periodic exchange of packets. As mentioned earlier, the DSDV protocol exchanges control packets regularly to update the routing tables. Since we observe the latency from the time the first ’accident’ packet is sent until the last node in the communication range receives the packet and acknowledges it. With high traffic density, there is an increased chance that a DSDV control packet transmission will start while the nodes are reporting the accident. This exact scenario happens in this case. When there is a transmission of control (HELLO) packets, the nodes will wait until the channel is free to transmit the accident or acknowledgment packets, which results in higher latency.
In Figure 14, we plot the latency graph for semi-autonomous traffic distribution where 50% of vehicles are human-driven, and the rest are autonomous vehicles. For increasing traffic density, latency for reactive and proactive protocols increases linearly. It is clear that there is no significant difference between the reactive and proactive protocols in this scenario as the density of traffic increases. The analysis of variance presented later further confirms this observation.
Figure 15 shows the latency graph with varying traffic distributions under low traffic density. For any traffic distribution, DSDV performs slightly better than reactive protocols at a low traffic density. The difference in latency is about 0.04 milliseconds between reactive and proactive protocols.
A latency graph with varying traffic distributions under a high traffic density can be seen in Figure 16. For a fully human-driven traffic distribution, t1, DSDV provides higher latency compared to reactive protocols. For semi-autonomous (t3) or 25% autonomous vehicle (t2) traffic distribution, reactive protocols perform slightly better than DSDV. In 75% autonomous traffic distribution (t4), the DSDV protocol is outperformed by the AODV and DYMO protocols. For a fully autonomous traffic distribution, AODV and DYMO outperform DSDV in high traffic density. The higher latency in the DSDV protocol is due to the control packet overhead. When the control packets (HELLO packets) are sent by any node, the neighboring nodes will not send any data packets as they sense the channel is busy. The latency is observed from the time the first ’accident’ packet is sent until the last node in the communication range receives the packet and acknowledges it. Thus, in the case of DSDV, if there is a transmission of control (HELLO) packets, the nodes will wait until the channel is free to transmit the accident or acknowledgment packets, which results in higher delays.

5.3. Analysis of Variance (ANOVA)

For the analysis of variation study, we used a Full Factorial Design with K = 3 factors and five (5) levels [59,60] for trip time and latency metrics. The formulation of the ANOVA is listed below for each performance metric captured. Factors A, B, and C are different for the trip time and latency factorial designs:
  • y i j k l = observation in the Ith replication of experiment with factors A, B, and C at levels i, j, and k, respectively;
  • μ = mean observation;
  • α i = effect of factor A at level i;
  • β j = effect of factor B at level j;
  • ξ k = effect of factor C at level k;
  • γ A B i j = interaction between A and B at levels i and j;
  • γ A B C i j k = interaction between A, B, C at levels i, j, k.

5.3.1. ANOVA of Trip Time

Table 7 shows the factors and the levels considered for the trip time variance analysis. The factors selected for the trip time were the routes, traffic distribution, and traffic density. The route factor had three levels, traffic distribution had five (5) levels, and traffic density had two (2) levels, as denoted in the table.
We quantify the impact of the main factors on the trip time by performing ANOVA tests. The ANOVA for the trip time is given in Table 8. We can observe that the main factors contribute about 97% to the variation of the trip time results, and the first and second-order interactions between the factors contribute around 2% and 1%, respectively. The route (R) has the most significant effect on the results with a 91.8% variation. Traffic distribution (T) shows a variation of 3.2% on the trip time results. However, traffic density (D) has the least significant effect on the results adding up to 1.6%. Our assumption that the residuals are normally distributed is proven by the Quantile-Quantile (Q-Q) for all three factors, as shown in Figure 17. The visual tests show that the residuals fall evenly around the least-squares line forming a heavy-tailed linear line.

5.3.2. ANOVA of Latency

The factors and levels considered for the latency variance analysis are shown in Table 9. Routing protocols had three (3) levels, traffic distribution had five (5) levels, and traffic density had four (4) levels, as listed in the table.
For the latency results, the ANOVA is shown in Table 10. From the table, we can observe that the main effects contribute 92.7% of the variation in the latency results. The traffic density (D) has the highest impact, with 91.1% of the variation. While the routing protocol (RP) has the least contribution with 0.2%. Traffic distribution (T) contributes 1.4% of latency variation. Additionally, the highest interaction is between the traffic density and distribution that has the most significant effect with 3.94% variation on the latency results compared to any other interaction combination. This indicates that the above factors interact to influence the latency result. The interaction between all three factors accounts for only 1.9% of the variation. The Q-Q plot of latency residuals is shown in Figure 18. We can observe that the residuals fall evenly around the least-squares line forming a trend with a heavy tail due to outliers. Hence, our simulations are concrete, and the variations in the results are not due to randomness.

6. Conclusions

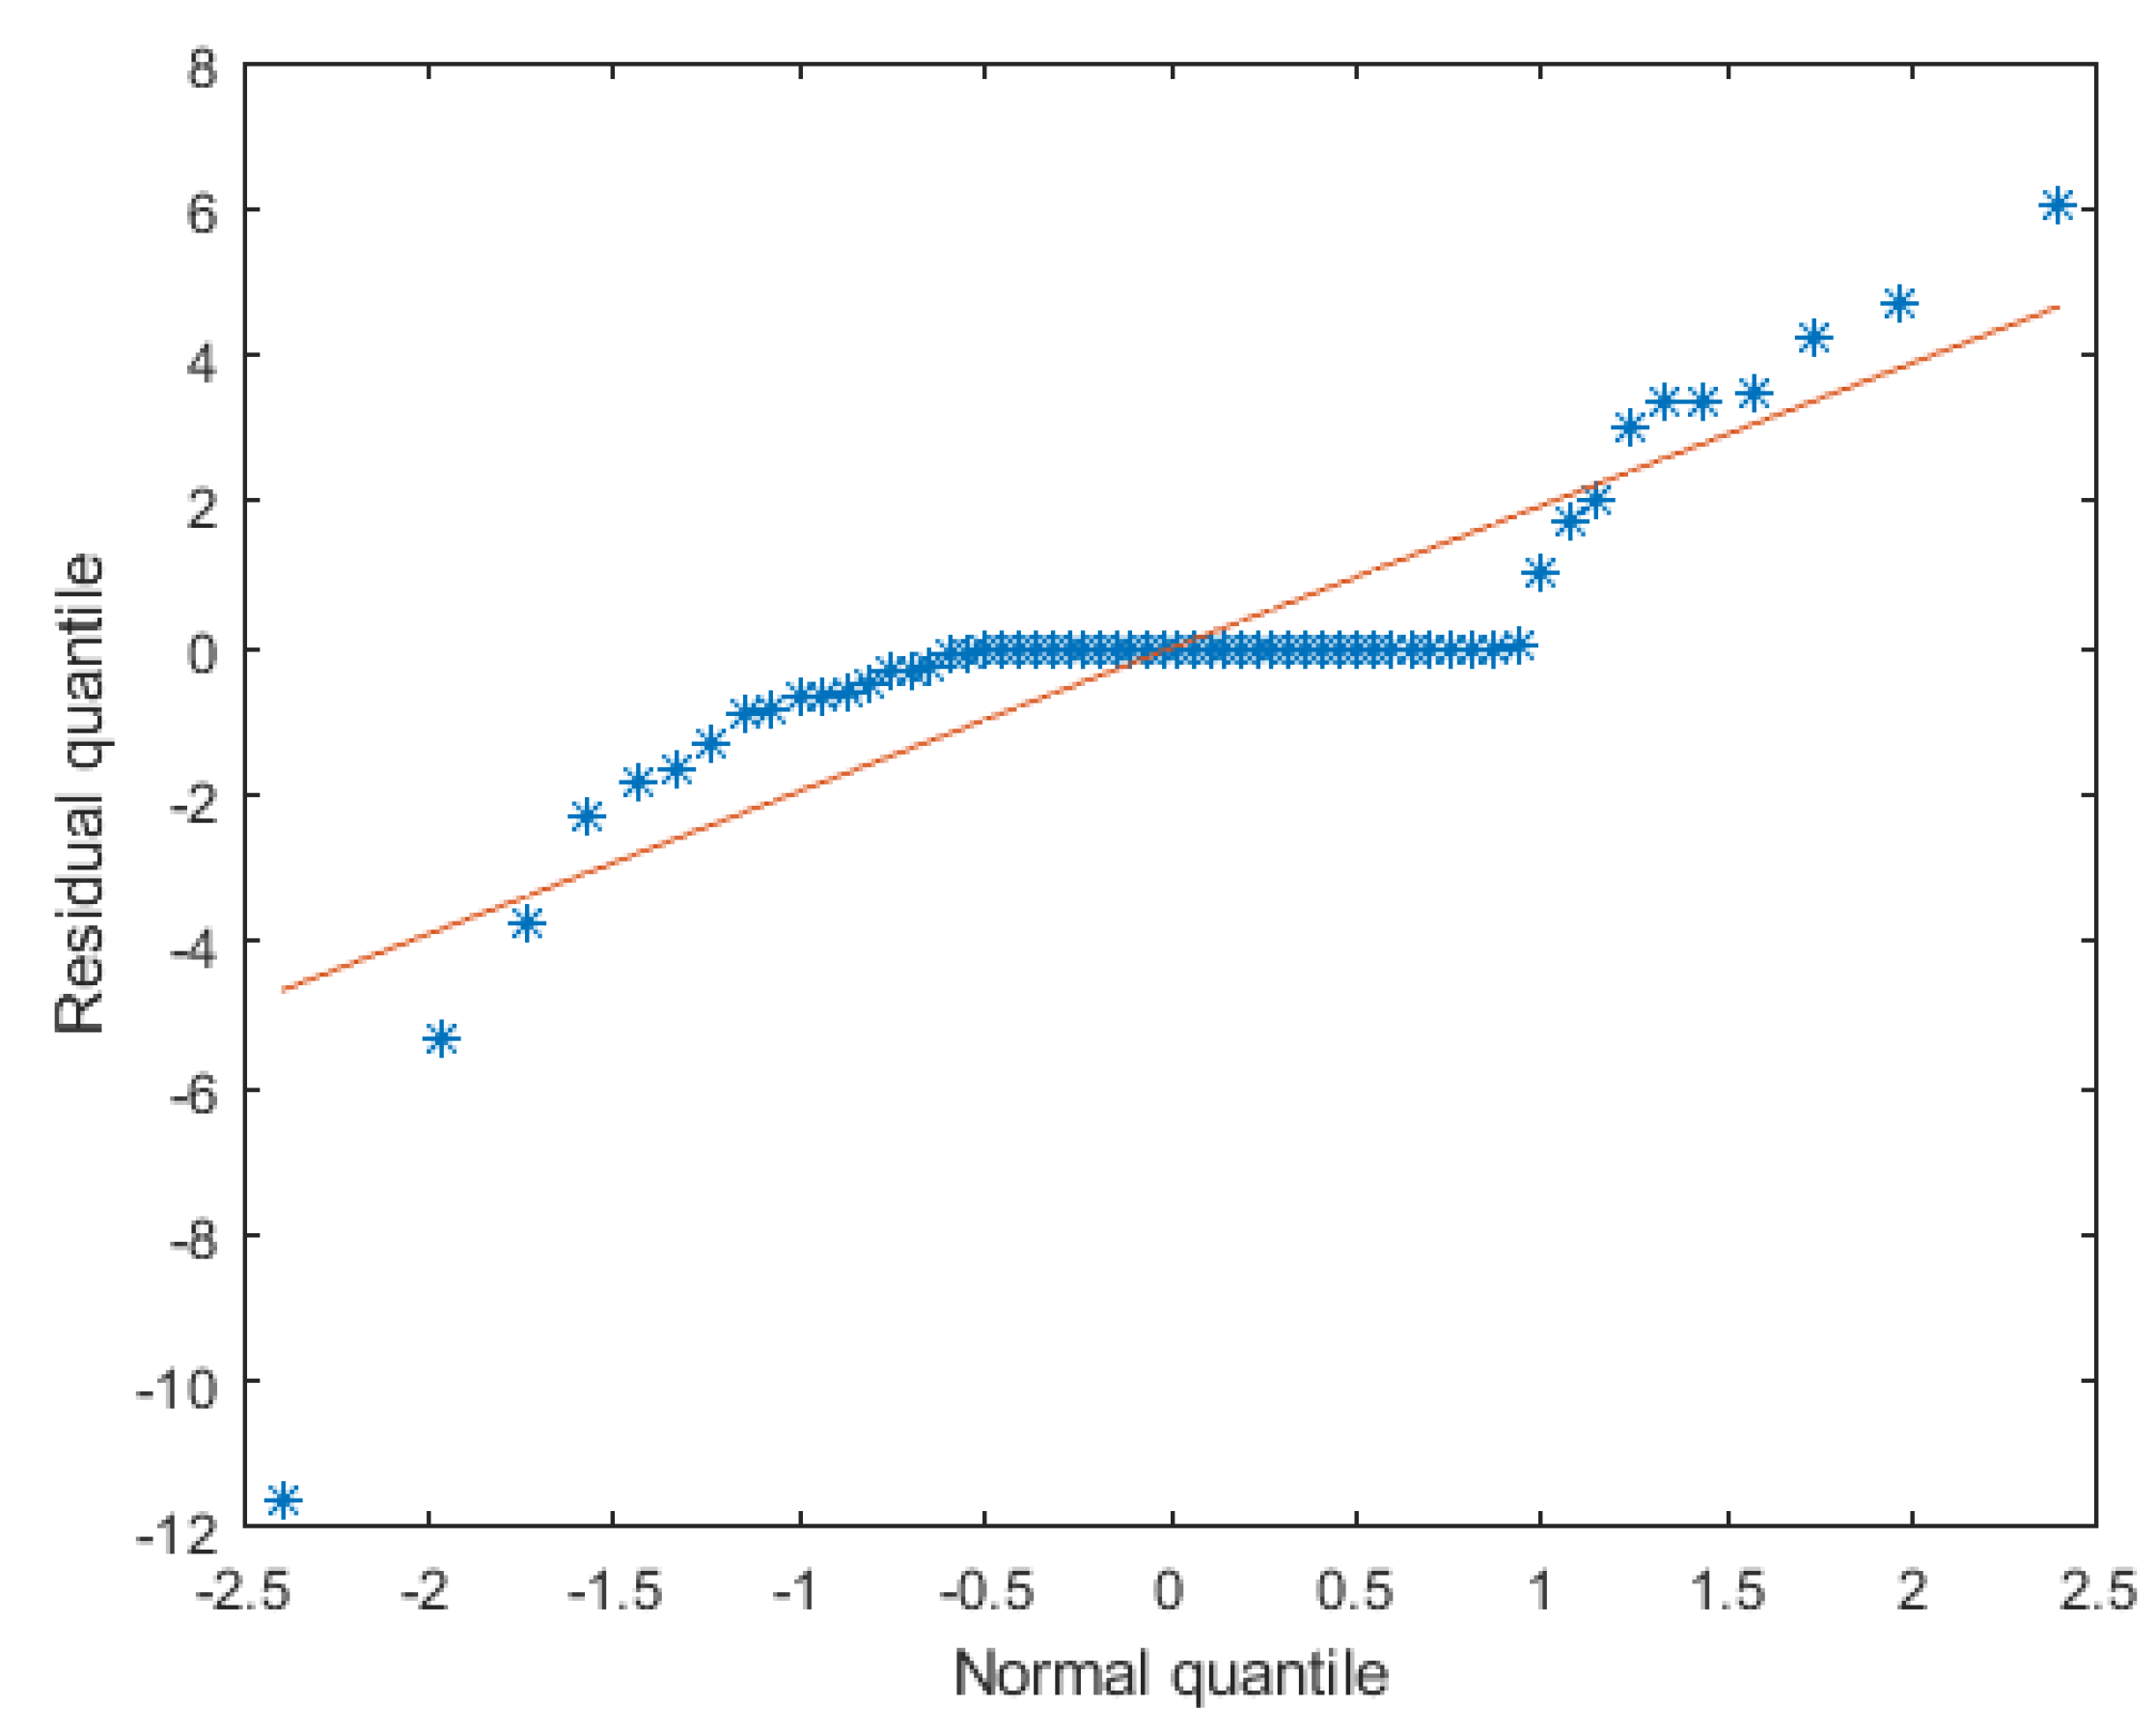
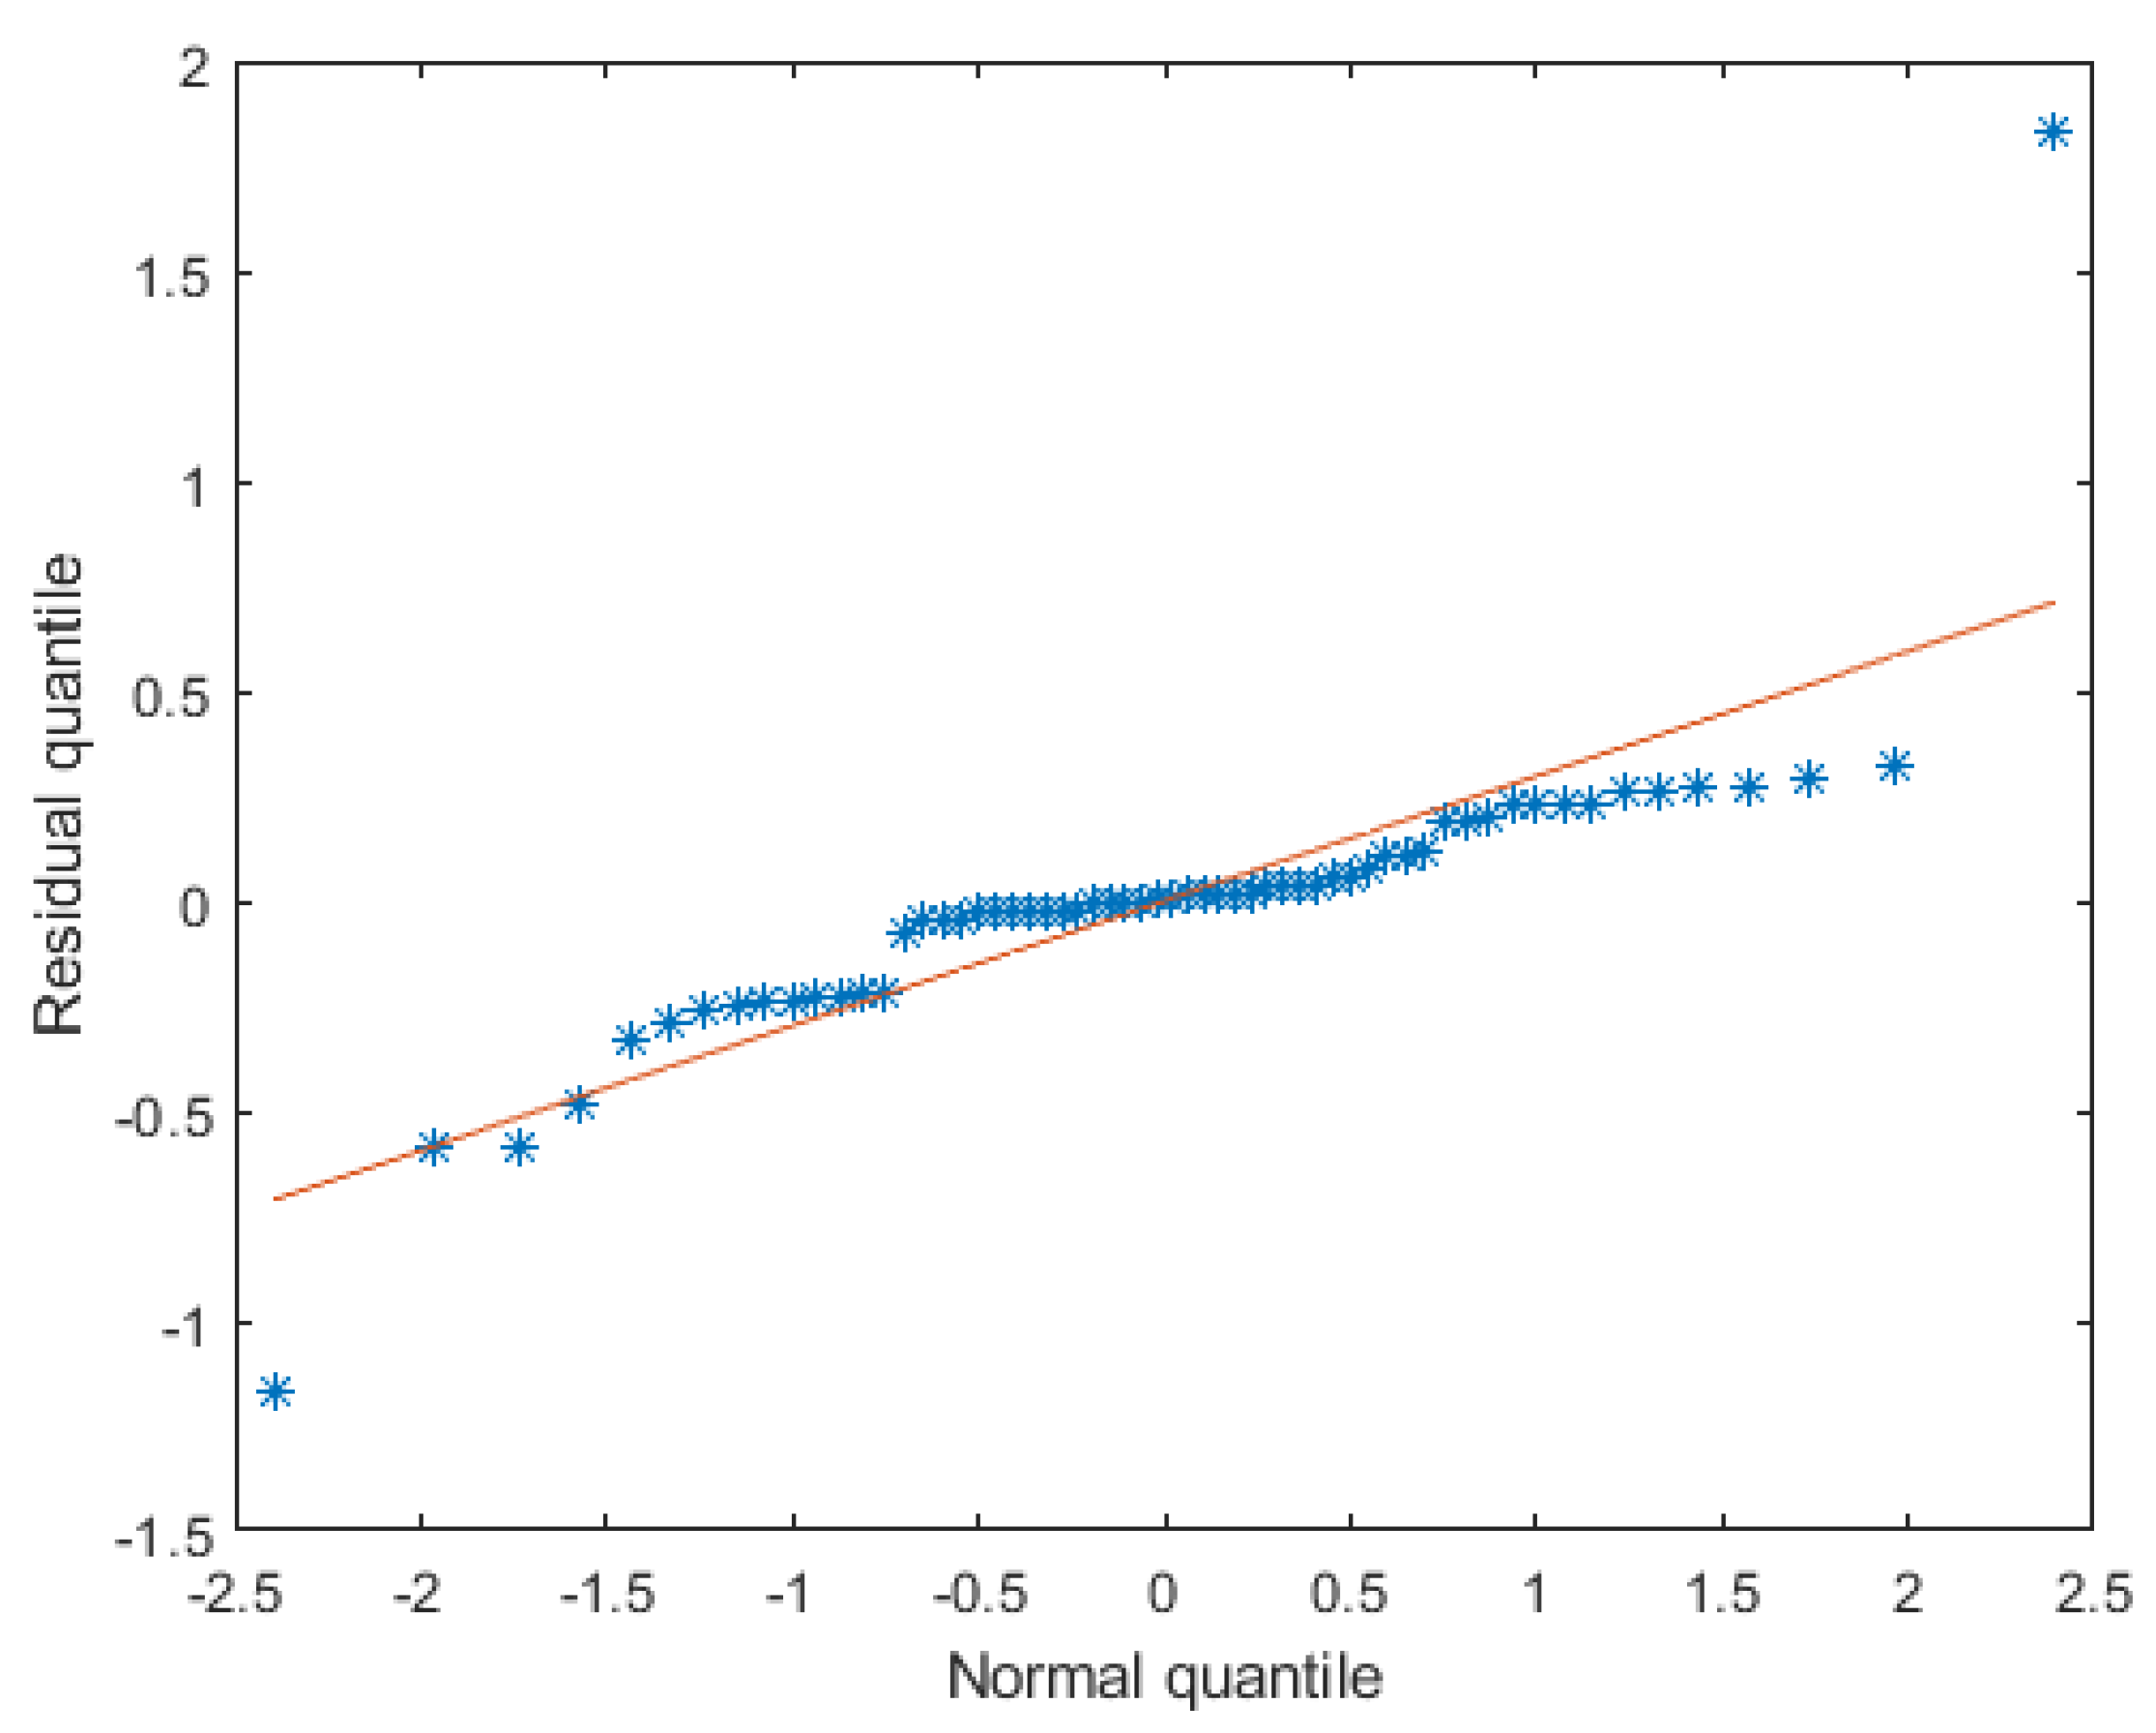
In this work, we evaluated the performance of various VANET routing protocols in Madinah city under different traffic scenarios. Two reactive routing protocols, AODV and DYMO, are selected, while one proactive protocol, DSDV, is considered. We considered both fully autonomous and human-driven vehicles in our study to replicate the state of future traffic. We further model multiple traffic distributions with the varying volume of autonomous and human-driven vehicles, along with several traffic densities to represent different traffic conditions. We performed simulations to analyze the average trip time and average communication latency between vehicles. For an average trip time, we found that fully autonomous traffic distribution achieved the shortest trip time, with a reduction of around 7.1% compared to other distributions with human-driven vehicles. For average latency, we observed that the DSDV protocol performs better in fully human-driven scenarios. However, in the case of fully autonomous traffic, both reactive protocols outperform the DSDV protocol, reducing the latency by 2.38 milliseconds (33.7% improvement). From our experiments, we recommend the use of reactive routing protocols compared to the proactive DSDV protocol, as the control message overhead of DSDV is much higher. Furthermore, we performed an ANOVA test to examine the effect of factors on the trip time and latency results. For the average trip time, we observed that the routes compared to traffic density and distribution had the most significant effect (91.8%) on the variation of the results. On the other hand, traffic density had the highest impact on the latency result (91.1%) compared to other factors. The ANOVA table also highlighted the effects of the interactions between the factors on the results. The visual tests observed from the Q-Q plots exhibit that the residuals fall evenly around the least-squares line, forming a heavy-tailed linear line. This confirms our assumption that the residuals are normally distributed. Hence, the variation in the results is not random but due to factors considered in our study.

6.1. Limitations

Our focus was studying and evaluating the routing protocols under different traffic scenarios. We considered 500 vehicles as a low traffic density and 5000 vehicles as a high traffic density for our study. It might not be the case in a real-world scenario for a highly congested area. Furthermore, we did not assess dynamic vehicle velocity changes based on conditions in our simulation. Although we considered a reasonable size of map area for the city of Madinah, we might need to take into account a larger area to study the overall performance. Other environmental factors that might affect the performance are out of scope for this particular study.

6.2. Future Works

This research can be extended by conducting further studies on the various issues considered in this article in the future. For the traffic model designed and adopted in this work, multiple factors can be expanded to outline the effect of those factors. For example, the car-following model for the human-driven vehicle can be another factor to consider by comparing against models, such as Krauss, EIDM, Wiedemann, and so on. Further, the parameters for each respective car-following model can be studied, such as minimum gaps kept from the vehicle in front, acceleration, and deceleration rates and other parameters. Another future study could outline the effect of even higher traffic densities in Madinah city with further distributions of not just passenger vehicles but also buses, motorcycles, etc. Routing protocols in this study could be expanded to include other ad hoc protocols, such as OLSR and DSR. Performance metrics can be furthered by considering the impact of the packet delivery ratio and the network throughput of the accident notification and relaying packets on traffic congestion. Other metrics could also be studied such as the effect of the network behavior on the carbon dioxide emissions and waiting time of passenger vehicles in the traffic model.

Author Contributions

Conceptualization, M.A.R.A., A.B., S.M.M., A.A., T.R.S. and A.Y.; methodology, M.A.R.A., A.B., S.M.M., A.A., T.R.S. and A.Y.; software, A.B., S.M.M. and A.A.; writing—original draft, A.B., S.M.M. and A.A.; writing—review and editing, M.A.R.A., A.B., S.M.M., A.A., T.R.S. and A.Y. All authors have read and agreed to the published version of the manuscript.

Funding

This research was funded by the Islamic University of Madinah project number 580, Tamayoz-2 program.

Institutional Review Board Statement

Not applicable.

Informed Consent Statement

Not applicable.

Acknowledgments

The authors would like to acknowledge the research deanship of the Islamic University of Madinah and the King Fahd University of Petroleum and Minerals for the support of this research.

Conflicts of Interest

The authors declare no conflict of interest.

References

  1. Miller, J. Vehicle-to-vehicle-to-infrastructure (V2V2I) intelligent transportation system architecture. In Proceedings of the 2008 IEEE Intelligent Vehicles Symposium, Eindhoven, The Netherlands, 4–6 June 2008; IEEE: Piscataway, NJ, USA, 2008; pp. 715–720. [Google Scholar]
  2. Arena, F.; Pau, G.; Severino, A. A review on IEEE 802.11 p for intelligent transportation systems. J. Sens. Actuator Networks 2020, 9, 22. [Google Scholar] [CrossRef]
  3. Chen, S.; Hu, J.; Shi, Y.; Peng, Y.; Fang, J.; Zhao, R.; Zhao, L. Vehicle-to-everything (V2X) services supported by LTE-based systems and 5G. IEEE Commun. Stand. Mag. 2017, 1, 70–76. [Google Scholar] [CrossRef]
  4. Yuan, Y.; Zheng, G.; Wong, K.K.; Letaief, K.B. Meta-reinforcement learning based resource allocation for dynamic V2X communications. IEEE Trans. Veh. Technol. 2021, 70, 8964–8977. [Google Scholar] [CrossRef]
  5. Abboud, K.; Omar, H.A.; Zhuang, W. Interworking of DSRC and cellular network technologies for V2X communications: A survey. IEEE Trans. Veh. Technol. 2016, 65, 9457–9470. [Google Scholar] [CrossRef]
  6. Biswas, S.; Tatchikou, R.; Dion, F. Vehicle-to-vehicle wireless communication protocols for enhancing highway traffic safety. IEEE Commun. Mag. 2006, 44, 74–82. [Google Scholar] [CrossRef]
  7. Arena, F.; Pau, G.; Severino, A. V2X communications applied to safety of pedestrians and vehicles. J. Sens. Actuator Networks 2020, 9, 3. [Google Scholar] [CrossRef] [Green Version]
  8. Wang, J.; Shao, Y.; Ge, Y.; Yu, R. A survey of vehicle to everything (V2X) testing. Sensors 2019, 19, 334. [Google Scholar] [CrossRef] [Green Version]
  9. Ihsan, A.; Chen, W.; Zhang, S.; Xu, S. Energy-efficient NOMA multicasting system for beyond 5G cellular V2X communications with imperfect CSI. IEEE Trans. Intell. Transp. Syst. 2021, 1–15. [Google Scholar] [CrossRef]
  10. Elhoseny, M.; Shankar, K. Energy efficient optimal routing for communication in VANETs via clustering model. In Emerging Technologies for Connected Internet of Vehicles and Intelligent Transportation System Networks; Springer: Berlin, Germany, 2020; pp. 1–14. [Google Scholar]
  11. Ali, I.; Li, F. An efficient conditional privacy-preserving authentication scheme for Vehicle-To-Infrastructure communication in VANETs. Veh. Commun. 2020, 22, 100228. [Google Scholar] [CrossRef]
  12. MacHardy, Z.; Khan, A.; Obana, K.; Iwashina, S. V2X access technologies: Regulation, research, and remaining challenges. IEEE Commun. Surv. Tutorials 2018, 20, 1858–1877. [Google Scholar] [CrossRef]
  13. Zeadally, S.; Hunt, R.; Chen, Y.S.; Irwin, A.; Hassan, A. Vehicular ad hoc networks (VANETS): Status, results, and challenges. Telecommun. Syst. 2012, 50, 217–241. [Google Scholar] [CrossRef]
  14. OpenStreetMap. Available online: https://www.openstreetmap.org/ (accessed on 27 January 2022).
  15. Haklay, M.; Weber, P. Openstreetmap: User-generated street maps. IEEE Pervasive Comput. 2008, 7, 12–18. [Google Scholar] [CrossRef] [Green Version]
  16. Eclipse SUMO—Simulation of Urban Mobility. Available online: https://www.eclipse.org/sumo/ (accessed on 27 January 2022).
  17. Behrisch, M.; Bieker, L.; Erdmann, J.; Krajzewicz, D. SUMO–simulation of urban mobility: An overview. In Proceedings of the SIMUL 2011, The Third International Conference on Advances in System Simulation, Barcelona, Spain, 23–28 October 2011; ThinkMind: Barcelona, Spain, 2011. [Google Scholar]
  18. OMNeT++ Discrete Event Simulator. Available online: https://omnetpp.org/ (accessed on 27 January 2022).
  19. Varga, A.; Hornig, R. An overview of the OMNeT++ simulation environment. In Proceedings of the 1st International Conference on Simulation Tools and Techniques for Communications, Networks and Systems & Workshops, Marseille, France, 3–7 March 2008; ICST: Brussels, Belgium, 2008; pp. 1–10. [Google Scholar]
  20. Perkins, C.; Belding-Royer, E.; Das, S. RFC3561: Ad Hoc On-Demand Distance Vector (AODV) Routing; IETF: Santa Barbara, CA, USA, 2003. [Google Scholar]
  21. Chakeres, I.D.; Belding-Royer, E.M. AODV routing protocol implementation design. In Proceedings of the 24th International Conference on Distributed Computing Systems Workshops, Tokyo, Japan, 23–24 March 2004; IEEE: Piscataway, NJ, USA, 2004; pp. 698–703. [Google Scholar]
  22. Perkins, C.E.; Bhagwat, P. Highly dynamic destination-sequenced distance-vector routing (DSDV) for mobile computers. ACM SIGCOMM Comput. Commun. Rev. 1994, 24, 234–244. [Google Scholar] [CrossRef]
  23. He, G. Destination-sequenced distance vector (DSDV) protocol. Netw. Lab. Hels. Univ. Technol. 2002, 135. [Google Scholar]
  24. Chakeres, I. Dynamic MANET On-Demand (DYMO) Routing. 2008. Available online: http://tools.ietf.org/html/draft-ietf-manet-dymo-14 (accessed on 21 January 2022).
  25. Sommer, C.; Dressler, F. The DYMO routing protocol in VANET scenarios. In Proceedings of the 2007 IEEE 66th Vehicular Technology Conference, Baltimore, MD, USA, 30 September–3 October 2007; IEEE: Piscataway, NJ, USA, 2007; pp. 16–20. [Google Scholar]
  26. Billington, J.; Yuan, C. On modelling and analysing the dynamic MANET on-demand (DYMO) routing protocol. In Transactions on Petri Nets and Other Models of Concurrency III; Springer: Berlin, Germany, 2009; pp. 98–126. [Google Scholar]
  27. Gupta, A.K.; Sadawarti, H.; Verma, A.K. Implementation of DYMO routing protocol. arXiv 2013, arXiv:1306.1338. [Google Scholar] [CrossRef]
  28. Kanellopoulos, D.; Cuomo, F. Recent Developments on Mobile Ad-Hoc Networks and Vehicular Ad-Hoc Networks. Electronics 2021, 10, 364. [Google Scholar] [CrossRef]
  29. Cunha, F.; Villas, L.; Boukerche, A.; Maia, G.; Viana, A.; Mini, R.A.; Loureiro, A.A. Data communication in VANETs: Protocols, applications and challenges. Ad Hoc Netw. 2016, 44, 90–103. [Google Scholar] [CrossRef]
  30. Alves Junior, J.; Wille, E.C. Routing in vehicular ad hoc networks: Main characteristics and tendencies. J. Comput. Netw. Commun. 2018, 2018, 1302123. [Google Scholar] [CrossRef]
  31. Shaheen, A.; Gaamel, A.; Bahaj, A. Comparison and Analysis Study between AODV DSR Routing Protocols in Vanet with IEEE 802.11. J. Ubiquitous Syst. Pervasive Netw. 2016, 7, 7–12. [Google Scholar]
  32. Johnson, D.B.; Maltz, D.A.; Broch, J. DSR: The dynamic source routing protocol for multi-hop wireless ad hoc networks. Ad Hoc Netw. 2001, 5, 139–172. [Google Scholar]
  33. Johnson, D.; Hu, Y.C.; Maltz, D. RFC 4728: The Dynamic Source Routing Protocol (DSR) for Mobile Ad Hoc Networks for IPv4; Technical Report; IETF: Fremont, CA, USA, 2007. [Google Scholar]
  34. Chang, X. Network simulations with OPNET. In WSC’99. 1999 Winter Simulation Conference Proceedings. ’Simulation-A Bridge to the Future’ (Cat. No. 99CH37038); IEEE: Piscataway, NJ, USA, 1999; Volume 1, pp. 307–314. [Google Scholar]
  35. Hiertz, G.R.; Denteneer, D.; Stibor, L.; Zang, Y.; Costa, X.P.; Walke, B. The IEEE 802.11 universe. IEEE Commun. Mag. 2010, 48, 62–70. [Google Scholar] [CrossRef]
  36. Abdelgadir, M.; Saeed, R.A.; Babiker, A. Mobility routing model for vehicular ad-hoc networks (VANETs), smart city scenarios. Veh. Commun. 2017, 9, 154–161. [Google Scholar] [CrossRef]
  37. Kandali, K.; Bennis, H. Performance Assessment of AODV, DSR and DSDV in an Urban VANET Scenario. In International Conference on Advanced Intelligent Systems for Sustainable Development; Springer: Berlin, Germany, 2018; pp. 98–109. [Google Scholar]
  38. Issariyakul, T.; Hossain, E. Introduction to network simulator 2 (NS2). In Introduction to Network Simulator NS2; Springer: Berlin, Germany, 2009; pp. 1–18. [Google Scholar]
  39. Ghori, M.R.; Sadiq, A.S.; Ghani, A. VANET routing protocols: Review, implementation and analysis. J. Physics Conf. Ser. 2018, 1049, 012064. [Google Scholar] [CrossRef] [Green Version]
  40. Ali, F.; Shaikh, F.K.; Ansari, A.Q.; Mahoto, N.A.; Felemban, E. Comparative analysis of VANET routing protocols: On road side unit placement strategies. Wirel. Pers. Commun. 2015, 85, 393–406. [Google Scholar] [CrossRef]
  41. Sallum, E.E.A.; dos Santos, G.; Alves, M.; Santos, M.M. Performance analysis and comparison of the DSDV, AODV and OLSR routing protocols under VANETs. In Proceedings of the 2018 16th International Conference on Intelligent Transportation Systems Telecommunications (ITST), Lisboa, Portugal, 15–17 October 2018; IEEE: Piscataway, NJ, USA, 2018; pp. 1–7. [Google Scholar]
  42. Clausen, T.; Jacquet, P.; Adjih, C.; Laouiti, A.; Minet, P.; Muhlethaler, P.; Qayyum, A.; Viennot, L. Optimized Link State Routing Protocol (OLSR). 2003. Available online: https://www.ietf.org/rfc/rfc3626.txt (accessed on 21 January 2022).
  43. Aschenbruck, N.; Ernst, R.; Gerhards-Padilla, E.; Schwamborn, M. Bonnmotion: A mobility scenario generation and analysis tool. In Proceedings of the 3rd International ICST Conference on Simulation Tools and Techniques, Malaga, Spain, 15–19 March 2010; ICST: Brussels, Belgium, 2010; pp. 1–10. [Google Scholar]
  44. Riley, G.F.; Henderson, T.R. The ns-3 network simulator. In Modeling and Tools for Network Simulation; Springer: Berlin, Germany, 2010; pp. 15–34. [Google Scholar]
  45. Bengag, A.; Bengag, A.; Elboukhari, M. Routing Protocols for VANETs: A Taxonomy, Evaluation and Analysis. Adv. Sci. Technol. Eng. Syst. J. 2020, 5, 77–85. [Google Scholar] [CrossRef] [Green Version]
  46. Karp, B.; Kung, H.T. GPSR: Greedy perimeter stateless routing for wireless networks. In Proceedings of the 6th Annual International Conference on Mobile Computing and Networking, Boston, MA, USA, 6–11 August 2000; Association for Computing Machinery: New York, NY, USA, 2020; pp. 243–254. [Google Scholar]
  47. Lochert, C.; Mauve, M.; Füßler, H.; Hartenstein, H. Geographic routing in city scenarios. ACM Sigmobile Mob. Comput. Commun. Rev. 2005, 9, 69–72. [Google Scholar] [CrossRef]
  48. Shi, M.; Lu, C.; Zhang, Y.; Yao, D. DSRC and LTE-V communication performance evaluation and improvement based on typical V2X application at intersection. In Proceedings of the 2017 Chinese Automation Congress (CAC), Jinan, China, 20–22 October 2017; IEEE: Piscataway, NJ, USA, 2017; pp. 556–561. [Google Scholar]
  49. Spaho, E.; Barolli, L.; Mino, G.; Xhafa, F. Simulation Evaluation of AODV, OLSR and DYMO Protocols for Vehicular Networks using CAVENET. In Proceedings of the 2011 International Conference on Complex, Intelligent, and Software Intensive Systems, Seoul, Korea, 30 June–2 July 2011; IEEE: Piscataway, NJ, USA, 2011; pp. 152–159. [Google Scholar]
  50. García-Campos, J.; Reina, D.; Toral, S.; Bessis, N.; Barrero, F.; Asimakopoulou, E.; Hill, R. Performance evaluation of reactive routing protocols for VANETs in urban scenarios following good simulation practices. In Proceedings of the 2015 9th International Conference on Innovative Mobile and Internet Services in Ubiquitous Computing, Santa Cantarina, Brazil, 8–10 July 2015; IEEE: Piscataway, NJ, USA, 2015; pp. 1–8. [Google Scholar]
  51. Ko, Y.B.; Vaidya, N.H. Location-Aided Routing (LAR) in mobile ad hoc networks. Wirel. Netw. 2000, 6, 307–321. [Google Scholar] [CrossRef]
  52. INET Framework. Available online: https://inet.omnetpp.org/ (accessed on 27 January 2022).
  53. Veins. Available online: https://veins.car2x.org/ (accessed on 27 January 2022).
  54. Sommer, C.; Eckhoff, D.; Brummer, A.; Buse, D.S.; Hagenauer, F.; Joerer, S.; Segata, M. Veins: The open source vehicular network simulation framework. In Recent Advances in Network Simulation; Springer: Berlin, Germany, 2019; pp. 215–252. [Google Scholar]
  55. Qureshi, K.N.; Abdullah, H. Topology based routing protocols for VANET and their comparison with MANET. J. Theor. Appl. Inf. Technol. 2013, 58, 707–715. [Google Scholar]
  56. Cheng, C.; Riley, R.; Kumar, S.P.; Garcia-Luna-Aceves, J.J. A loop-free extended Bellman-Ford routing protocol without bouncing effect. ACM Sigcomm Comput. Commun. Rev. 1989, 19, 224–236. [Google Scholar] [CrossRef]
  57. Goldberg, A.; Radzik, T. A Heuristic Improvement of the Bellman-Ford Algorithm; Technical Report; Stanford University, Computer Science Department: Stanford, CA, USA, 1993. [Google Scholar]
  58. Lim, H.; Kim, C. Flooding in wireless ad hoc networks. Comput. Commun. 2001, 24, 353–363. [Google Scholar] [CrossRef]
  59. Jain, R. The Art of Computer Systems Performance Analysis: Techniques for Experimental Design, Measurement, Simulation, and Modeling; John Wiley & Sons: Hoboken, NJ, USA, 1990. [Google Scholar]
  60. Girden, E.R. ANOVA: Repeated Measures; Sage Publications, Inc.: Thousand Oaks, CA, USA, 1992. [Google Scholar]
Figure 1. Vehicles in a VANET communicating when an accident occurs at the traffic light intersection.
Electronics 11 00777 g001
Figure 2. The imported map from OpenStreetMap of Madinah city.
Electronics 11 00777 g002
Figure 3. Simulationdesign of the experiments and a subset of the modules utilized from each component.
Electronics 11 00777 g003
Figure 4. Flow diagram of the simulation processes.
Electronics 11 00777 g004
Figure 5. OMNeT++ simulation of the traffic model generated by SUMO.
Electronics 11 00777 g005
Figure 6. Route 1—West Highway to Prophet’s Mosque.
Electronics 11 00777 g006
Figure 7. Route 2—South Highway to Prophet’s Mosque.
Electronics 11 00777 g007
Figure 8. Route 3—North Highway to Prophet’s Mosque.
Electronics 11 00777 g008
Figure 9. Average trip time for Route 1 in low and high traffic densities.
Electronics 11 00777 g009
Figure 10. Average trip time for Route 2 in low and high traffic densities.
Electronics 11 00777 g010
Figure 11. Average trip time for Route 3 in low and high traffic densities.
Electronics 11 00777 g011
Figure 12. Latency graph for fully human-driven vehicles with varying traffic densities.
Electronics 11 00777 g012
Figure 13. Latency graph for fully autonomous vehicles with varying traffic densities.
Electronics 11 00777 g013
Figure 14. Latency graph for semi-autonomous vehicles with varying traffic densities.
Electronics 11 00777 g014
Figure 15. Latency graph for low traffic density with varying traffic distribution.
Electronics 11 00777 g015
Figure 16. Latency graph for high traffic density with varying traffic distribution.
Electronics 11 00777 g016
Figure 17. Quantile—Quantile Plot of Trip Time Residual.
Electronics 11 00777 g017
Figure 18. Quantile—Quantile Plot of Latency Residual.
Electronics 11 00777 g018
Table 1. Comparison of Ad-hoc routing protocols.
CharacteristicsRouting Protocols
AODVDYMODSDV
Protocol typeReactiveReactiveProactive
Routing schemeOn-demandOn-demandTable-driven
Routing loopLoop-freeLoop-freeLoop-free
Control message overheadLowLowHigh
Table 2. Simulation Parameters—OMNeT++.
ParametersValue
Radio TypeIEEE 802.11 Dimensional Radio
Radio Band5.9 GHz
Number of Channels3
Transmitter Power20 mW
Bandwidth10 MHz
Routing ProtocolsAODV, DYMO, DSDV
Table 3. Simulation Parameters—SUMO.
ParametersValue
Traffic Densities500, 1000, 2500, 5000
Traffic Distributions0:100, 25:75, 50:50, 75:25, 100:0
Fringe Factor100
Vehicle ClassPassenger
Car-Following ModelIDM
Custom TripsR1, R2, R3
Custom Trip Lengths1.8 km, 1.8 km, 1.9 km
Departure Time5 s
Simulation Time500 s
Repetitions & SeedsR = 3, S = 1, 2, 3
Table 4. Car-following model parameters (human-driven model).
ParametersValue
modelIDM (Intelligent Driver Model)
minGap2.5 m
accel, decel, emergencyDecel2.6 m/s 2 , 4.5 m/s 2 , 9.0 m/s 2
tau1 s
delta4
stepping0.25 s
actionStepLength1 s
Table 5. Physical host specification.
ItemSpecification
CPUIntel Core i5-8250U CPU @ 1.60GHz
Operating SystemWindows 10 Build 18363 (64-bit)
Main Memory20 GB
Table 6. Software specification.
ItemSpecification
Network SimulationOMNeT++ v5.6.2
Traffic SimulationSUMO v1.11.0
Data Analysis Tool 1MATLAB R2021b
Data Analysis Tool 2Microsoft Excel
Table 7. Factors and their respective levels for trip time.
SymbolFactorLevels
12345
RRoutesR1R2R3
TTraffic Distribution0:10025:7550:5075:25100:0
DTraffic Density5005000
Table 8. ANOVA of trip time.
ComponentSum of SquaresPerc. VariationDFMean Square
y339,533.0005 30
y ¯ 327,189.6338 1
y y ¯ 12,343.3667100.00%29
Main Effects11,928.218696.6%71704.0
D201.07031.6%1
T400.68163.2%4
R11,326. 466791.8%2
First-order Interactions264.68892.1%1418.9
D-T92.6519 4
D-R92.5407 2
T-R79.4963 8
Second-order Interactions150.45931.2%818.8
D-T-R150.4593 8
Table 9. Factors and their respective levels for latency.
SymbolFactorLevels
12345
RPRouting ProtocolsAODVDSDVDYMO
TTraffic Distribution0:10025:7550:5075:25100:0
DTraffic Density500100025005000
Table 10. ANOVA of latency.
ComponentSum of SquaresPerc. VariationDFMean Square
y538.0728 60
y ¯ 427.9197 1
y y ¯ 110.1531100.00%59
Main Effects102.057392.7%911.3
D100.307791.l%3
T1.50981.4%4
RP0.23980.2%2
First-order Interactions6.02425.5%260.2
D-T4.3165 12
D-RP0.9441 6
T-RP0.7635 8
Second-order Interactions2.07161.9%240.1
D-T-RP2.0716 24
Publisher’s Note: MDPI stays neutral with regard to jurisdictional claims in published maps and institutional affiliations.

