Article

Microphone Array for Speaker Localization and Identification in Shared Autonomous Vehicles

1
Centro ALGORITMI, Escola de Engenharia, Universidade do Minho, 4800-058 Guimarães, Portugal
2
Bosch Car Multimedia, 4705-820 Braga, Portugal
*
Author to whom correspondence should be addressed.
Electronics 2022, 11(5), 766; https://doi.org/10.3390/electronics11050766
Submission received: 24 January 2022 / Revised: 25 February 2022 / Accepted: 26 February 2022 / Published: 2 March 2022
(This article belongs to the Special Issue Autonomous Vehicles Technological Trends)

Abstract

:
With the current technological transformation in the automotive industry, autonomous vehicles are getting closer to the Society of Automative Engineers (SAE) automation level 5. This level corresponds to the full vehicle automation, where the driving system autonomously monitors and navigates the environment. With SAE-level 5, the concept of a Shared Autonomous Vehicle (SAV) will soon become a reality and mainstream. The main purpose of an SAV is to allow unrelated passengers to share an autonomous vehicle without a driver/moderator inside the shared space. However, to ensure their safety and well-being until they reach their final destination, active monitoring of all passengers is required. In this context, this article presents a microphone-based sensor system that is able to localize sound events inside an SAV. The solution is composed of a Micro-Electro-Mechanical System (MEMS) microphone array with a circular geometry connected to an embedded processing platform that resorts to Field-Programmable Gate Array (FPGA) technology to successfully process in the hardware the sound localization algorithms.

1. Introduction

In the near future, autonomous vehicles will be sufficiently reliable, affordable, and widespread on our public roads, replacing many current human driving tasks [1]. The emergence of different autonomous applications will not only require accurate perception systems [2], but also vehicles with high-performance processing capabilities with the ability to communicate with cloud services and other vehicles, requiring low communications response time and high network bandwidth [3]. One of the applications of autonomous vehicles will be for shared mobility. This concept, which includes car-sharing or rent-by-the-hour vehicles where passengers can partially or totally share the same trip, tend to become a common practice in modern societies [1]. At the same time, the technological advances in the automotive industry have highly contributed to the future of autonomous vehicles in a sustainable urban mobility scenario [4,5]. The merging between autonomous driving and shared mobility trends resulted in the emergence of the concept of Shared Autonomous Vehicle (SAV) [1,6], which enables unrelated passengers to share the same vehicle during their trips. The adoption of SAV will completely change the current paradigm of shared rides and it will surely contribute to more sustainable and affordable passenger mobility in urban areas [7].
In current ride-share or taxi services, despite the driver moderating the activities inside the common space, some companies, such as Uber, Lyft, and Didi, have reported several safety problems between passengers and drivers [8]. There have been records of harassment, assault and robbing passengers, and unfortunately no strict measures could be taken since the company cannot have full control over the passengers, drivers, vehicles or rides. In the context of an SAV, and since the vehicle will not require the driver’s control, these problems can become worse since the absence of a moderator can leave the vehicle vulnerable to misuse and inappropriate behavior between passengers, causing several consequences both for the occupants and the car.
The safety of all occupants being a major concern, it is crucial to develop solutions to ensure a normal ride during shared trips. Current trends aim at equipping an SAV with sensor-based monitoring solutions to analyze and identify several situations inside the vehicle’s shared space, for example, driver’s and passenger’s behavior, violence between occupants, vandalism, assaults, and so forth, to trigger safety measures. Only by ensuring the effectiveness of these triggers will passengers trust SAV solutions, which is essential to bring forward their mass acceptance and adoption [7,9,10]. Current solutions that monitor the activity inside the vehicle are mostly video-based systems [11,12,13]. In other fields, these video-based solutions tend to be very useful as they can look through facial or object movements to find possible sound sources in the environment [14,15,16,17]. However, video-only solutions are not able to capture all the surroundings as they have a limited field of view, making the classification and detection of all human actions inside the vehicle difficult. Thus, it is almost mandatory to collect audio events inside the shared space [18].
Outside the automotive context, current audio-only sensor systems use microphone arrays to localize different sound sources in a wide range of applications, for example, robot and human–robot interactions [19,20], drones direction calculation [21], audio recording for multi-channel reproduction [22], and multi-speaker voice and speech recognition [23]. In such solutions, the accuracy and detection performance is affected by the array geometry, where linear arrays are only able to localize sound sources in a 2D range [24], and circular [19,22,25], spherical [20,26], or other geometries [27,28] allow the system to localize in a 3D space. Besides the geometry, the number of microphones also affects the localization accuracy [27]. Other hybrid approaches combine microphone arrays with video cameras combined with facial recognition techniques to localize and detect audio sources, which can be used to monitor the SAV [29,30]. However, they sometimes require complex sensor fusion systems with high processing capabilities.
In a microphone array solution, the estimation of the Direction of Arrival (DoA) is a well-known research topic. This mechanism can be applied to either a simple scenario where only one sound source is present or to a complex setup with several sound sources to be processed simultaneously. Several solutions allow the estimation of DoA for narrow-band signals including high-resolution subspace algorithms like MVDR [31], MUSIC [32], and ESPRIT [33]. Meanwhile, new research has suggested new directions in this field of study [34,35,36]. Recently, different solutions that allow obtaining these results both in digital signal processing-based systems [37,38,39] and in machine learning-based approaches [40,41] have been proposed. Although these proposals are highly accurate, their application is not always feasible in a real-time scenario. This is mainly due to the computational complexity of these approaches being very high, essentially in implementing sound separation mechanisms [42,43].
With the challenge of creating an audio-only sensor system to localize and identify speakers without requiring a video-based solution, this work presents an embedded, cost-effective, low-power, and real-time microphone array solution for speaker localization and identification that can be used inside an SAV. To accelerate the processing tasks, the sensor system resorts to Field-Programmable Gate Array (FPGA) technology to deploy dedicated processing modules in hardware to interface, acquire, and compute data from different microphones [44,45,46,47,48,49]. Moreover, the processing system provides a Robot Operating System (ROS) interface to make data available to other high-level applications (for the identification and classification of audio events) or to other sensor fusion systems. Finally, and since the system deals with sensitive data, we have deployed the processing systems over a static partitioning hypervisor to guarantee data security and prevent unwanted access of private information. This work was developed in partnership with Bosch Car Multimedia Portugal, S.A., and contributes to the state-of-the-art with:
(1)
a microphone array system to monitor sound events inside an SAV, which can be easily integrated with other sensor fusion strategies for automotive;
(2)
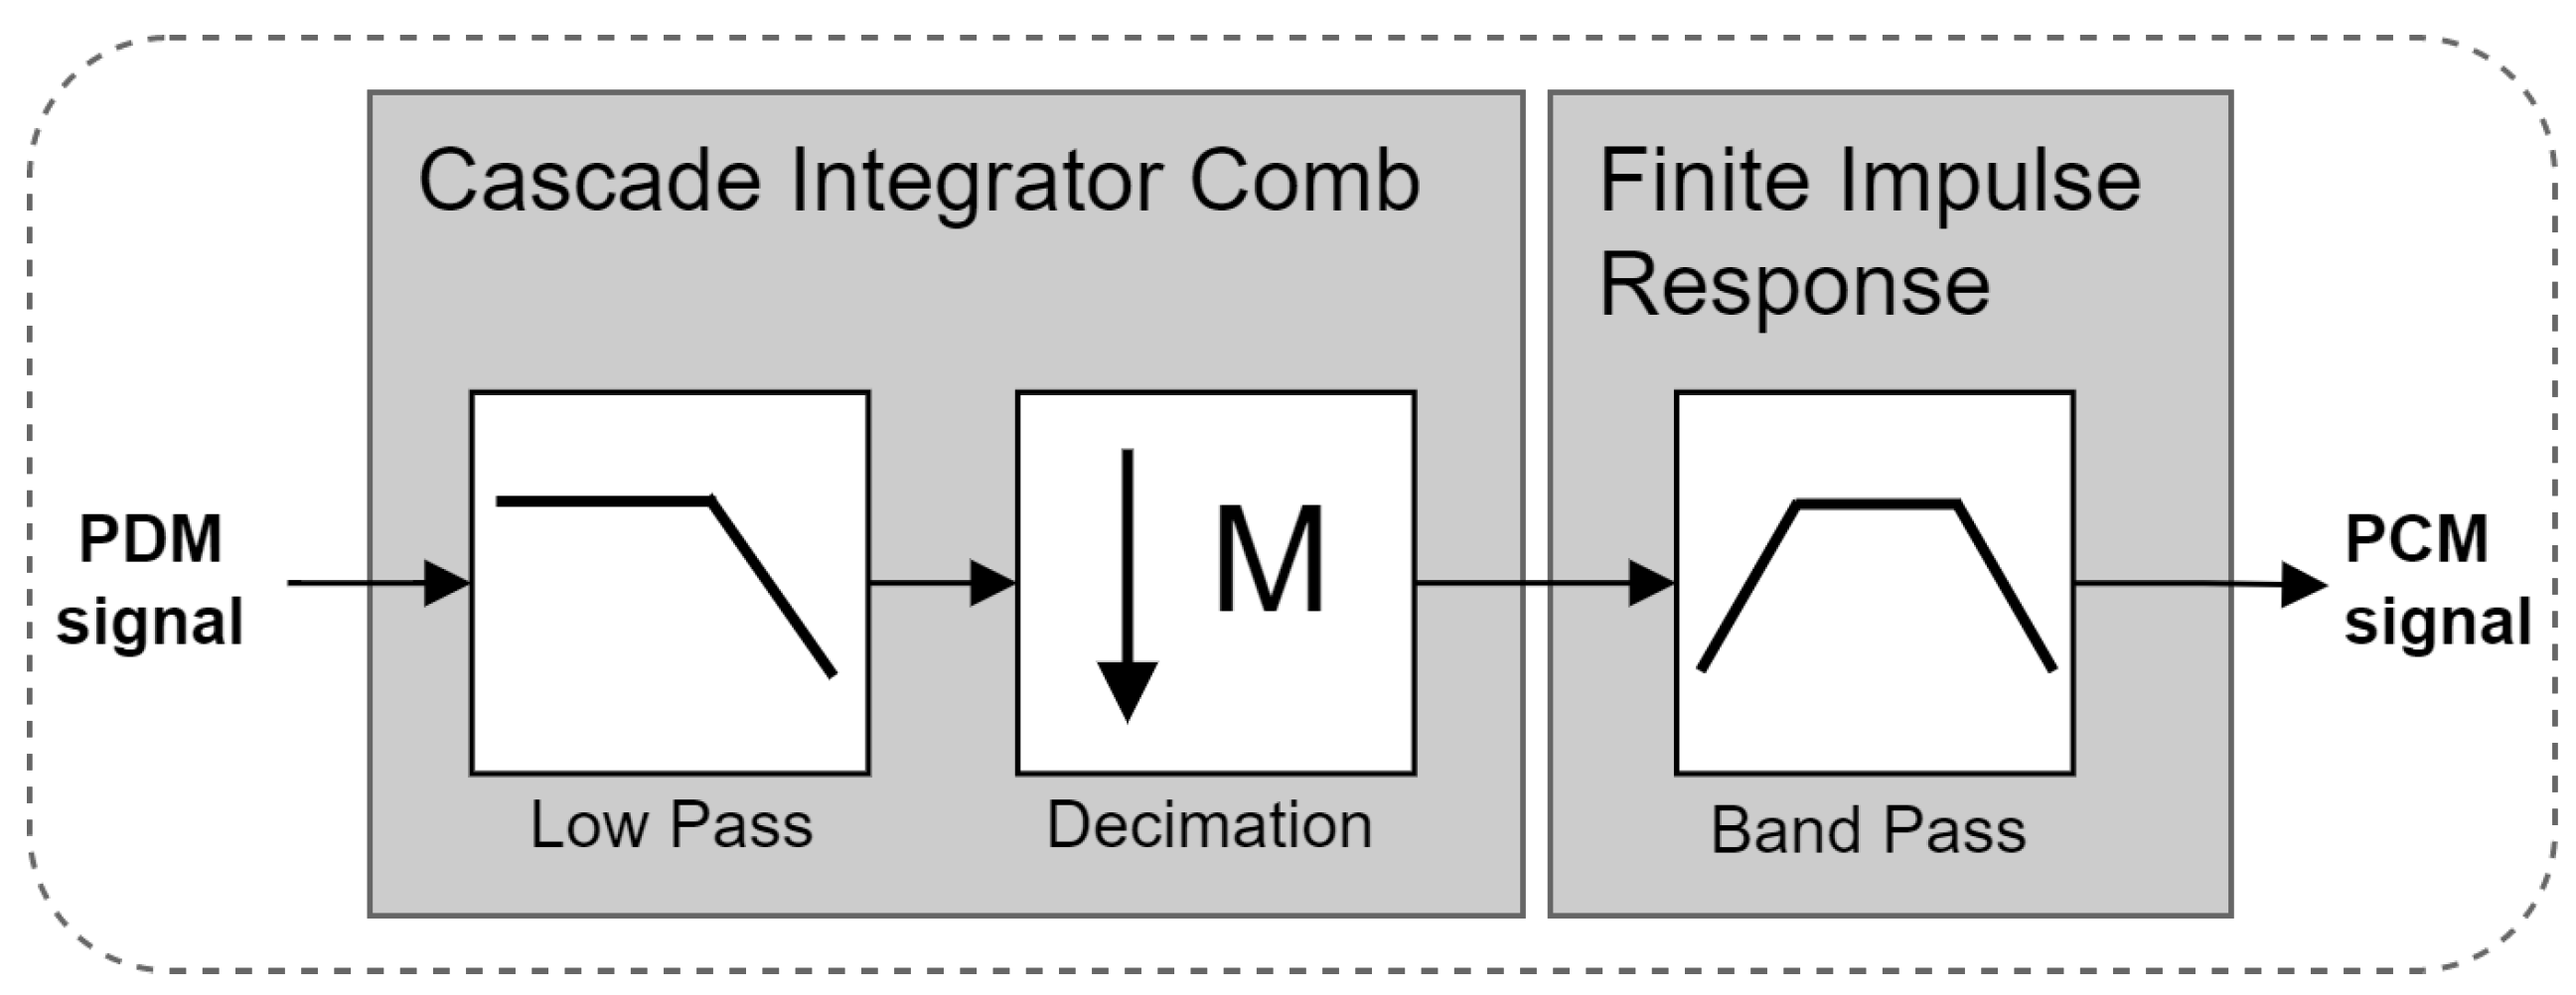
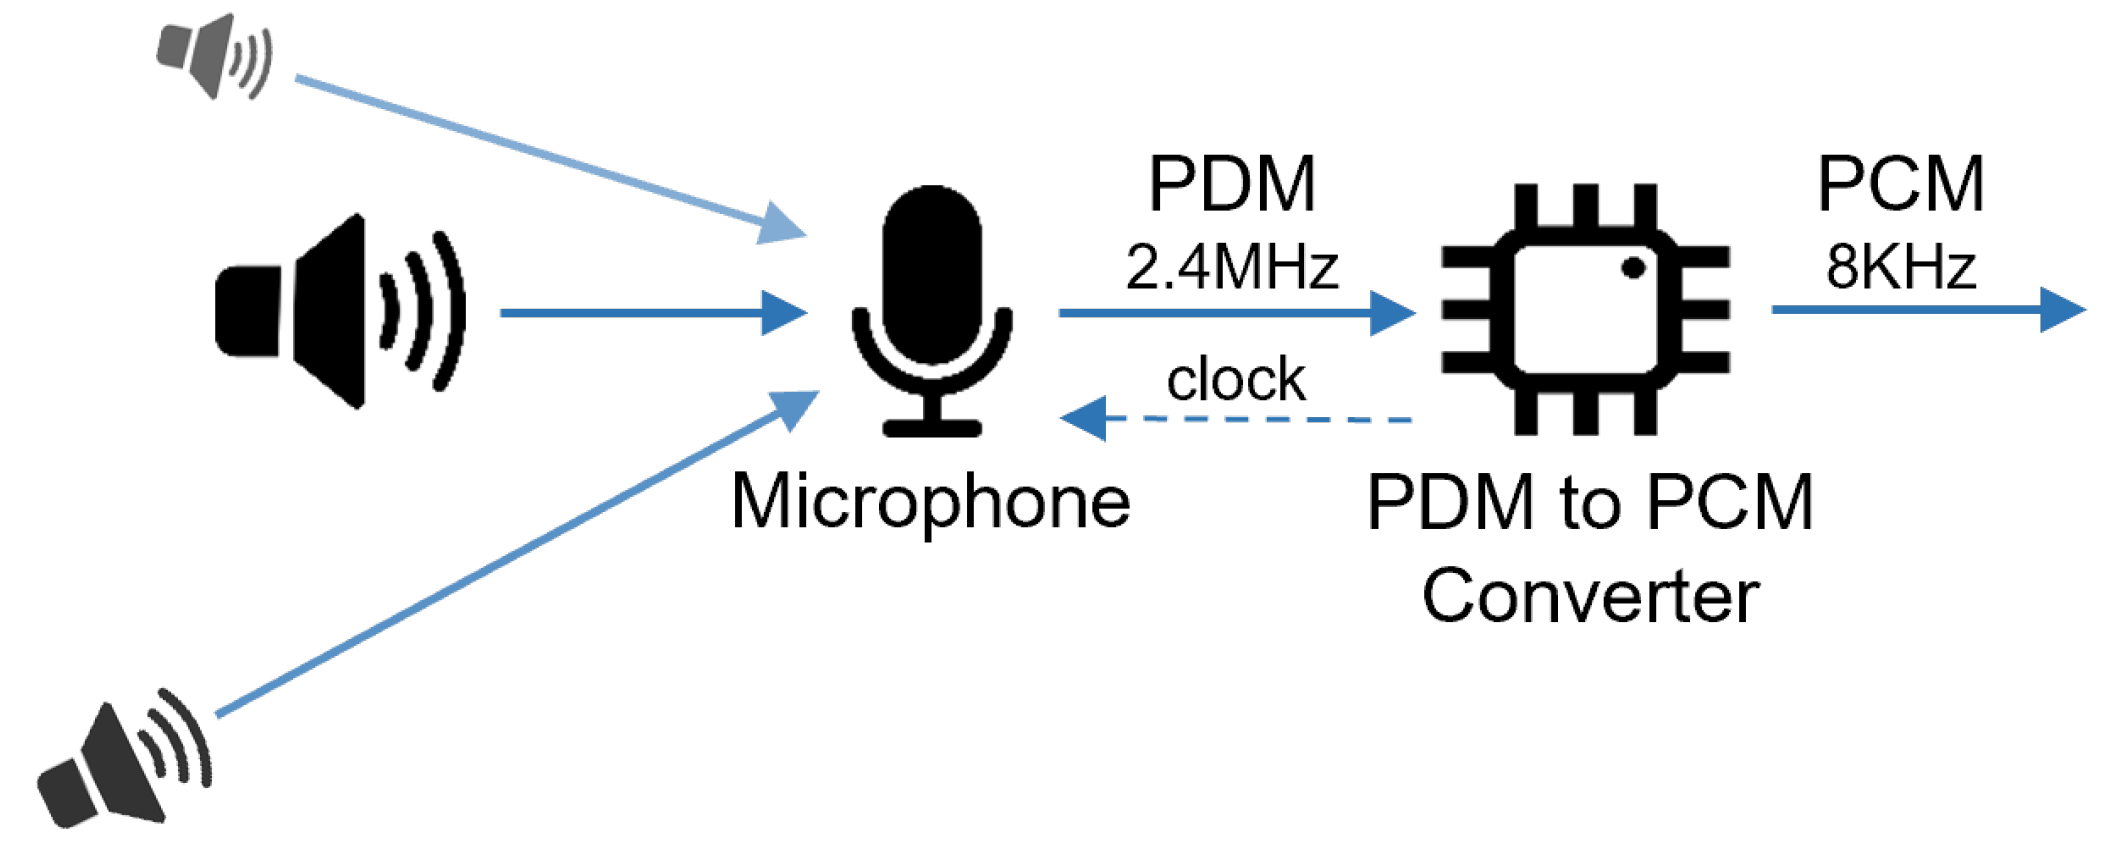
a hardware-based system with data acquisition and format conversion, i.e., Pulse Density Modulated (PDM) to Pulse Code Modulated (PCM) to interface the microphone array;
(3)
hardware-accelerated algorithms to localize different sound sources that can achieve good accuracy and performance metrics with real-time response.
The remainder of this paper is organized as follows: Section 2 describes the sensor system architecture; Section 3 and Section 4 detail, respectively, the design and implementation steps to develop the sensor system (these sections are further divided in the microphone array and the processing platform); Section 5 presents the system evaluation, while Section 6 concludes this paper with a summary of our findings; Finally, Section 7 discusses some open issues regarding this research topic, pointing out some future work directions.

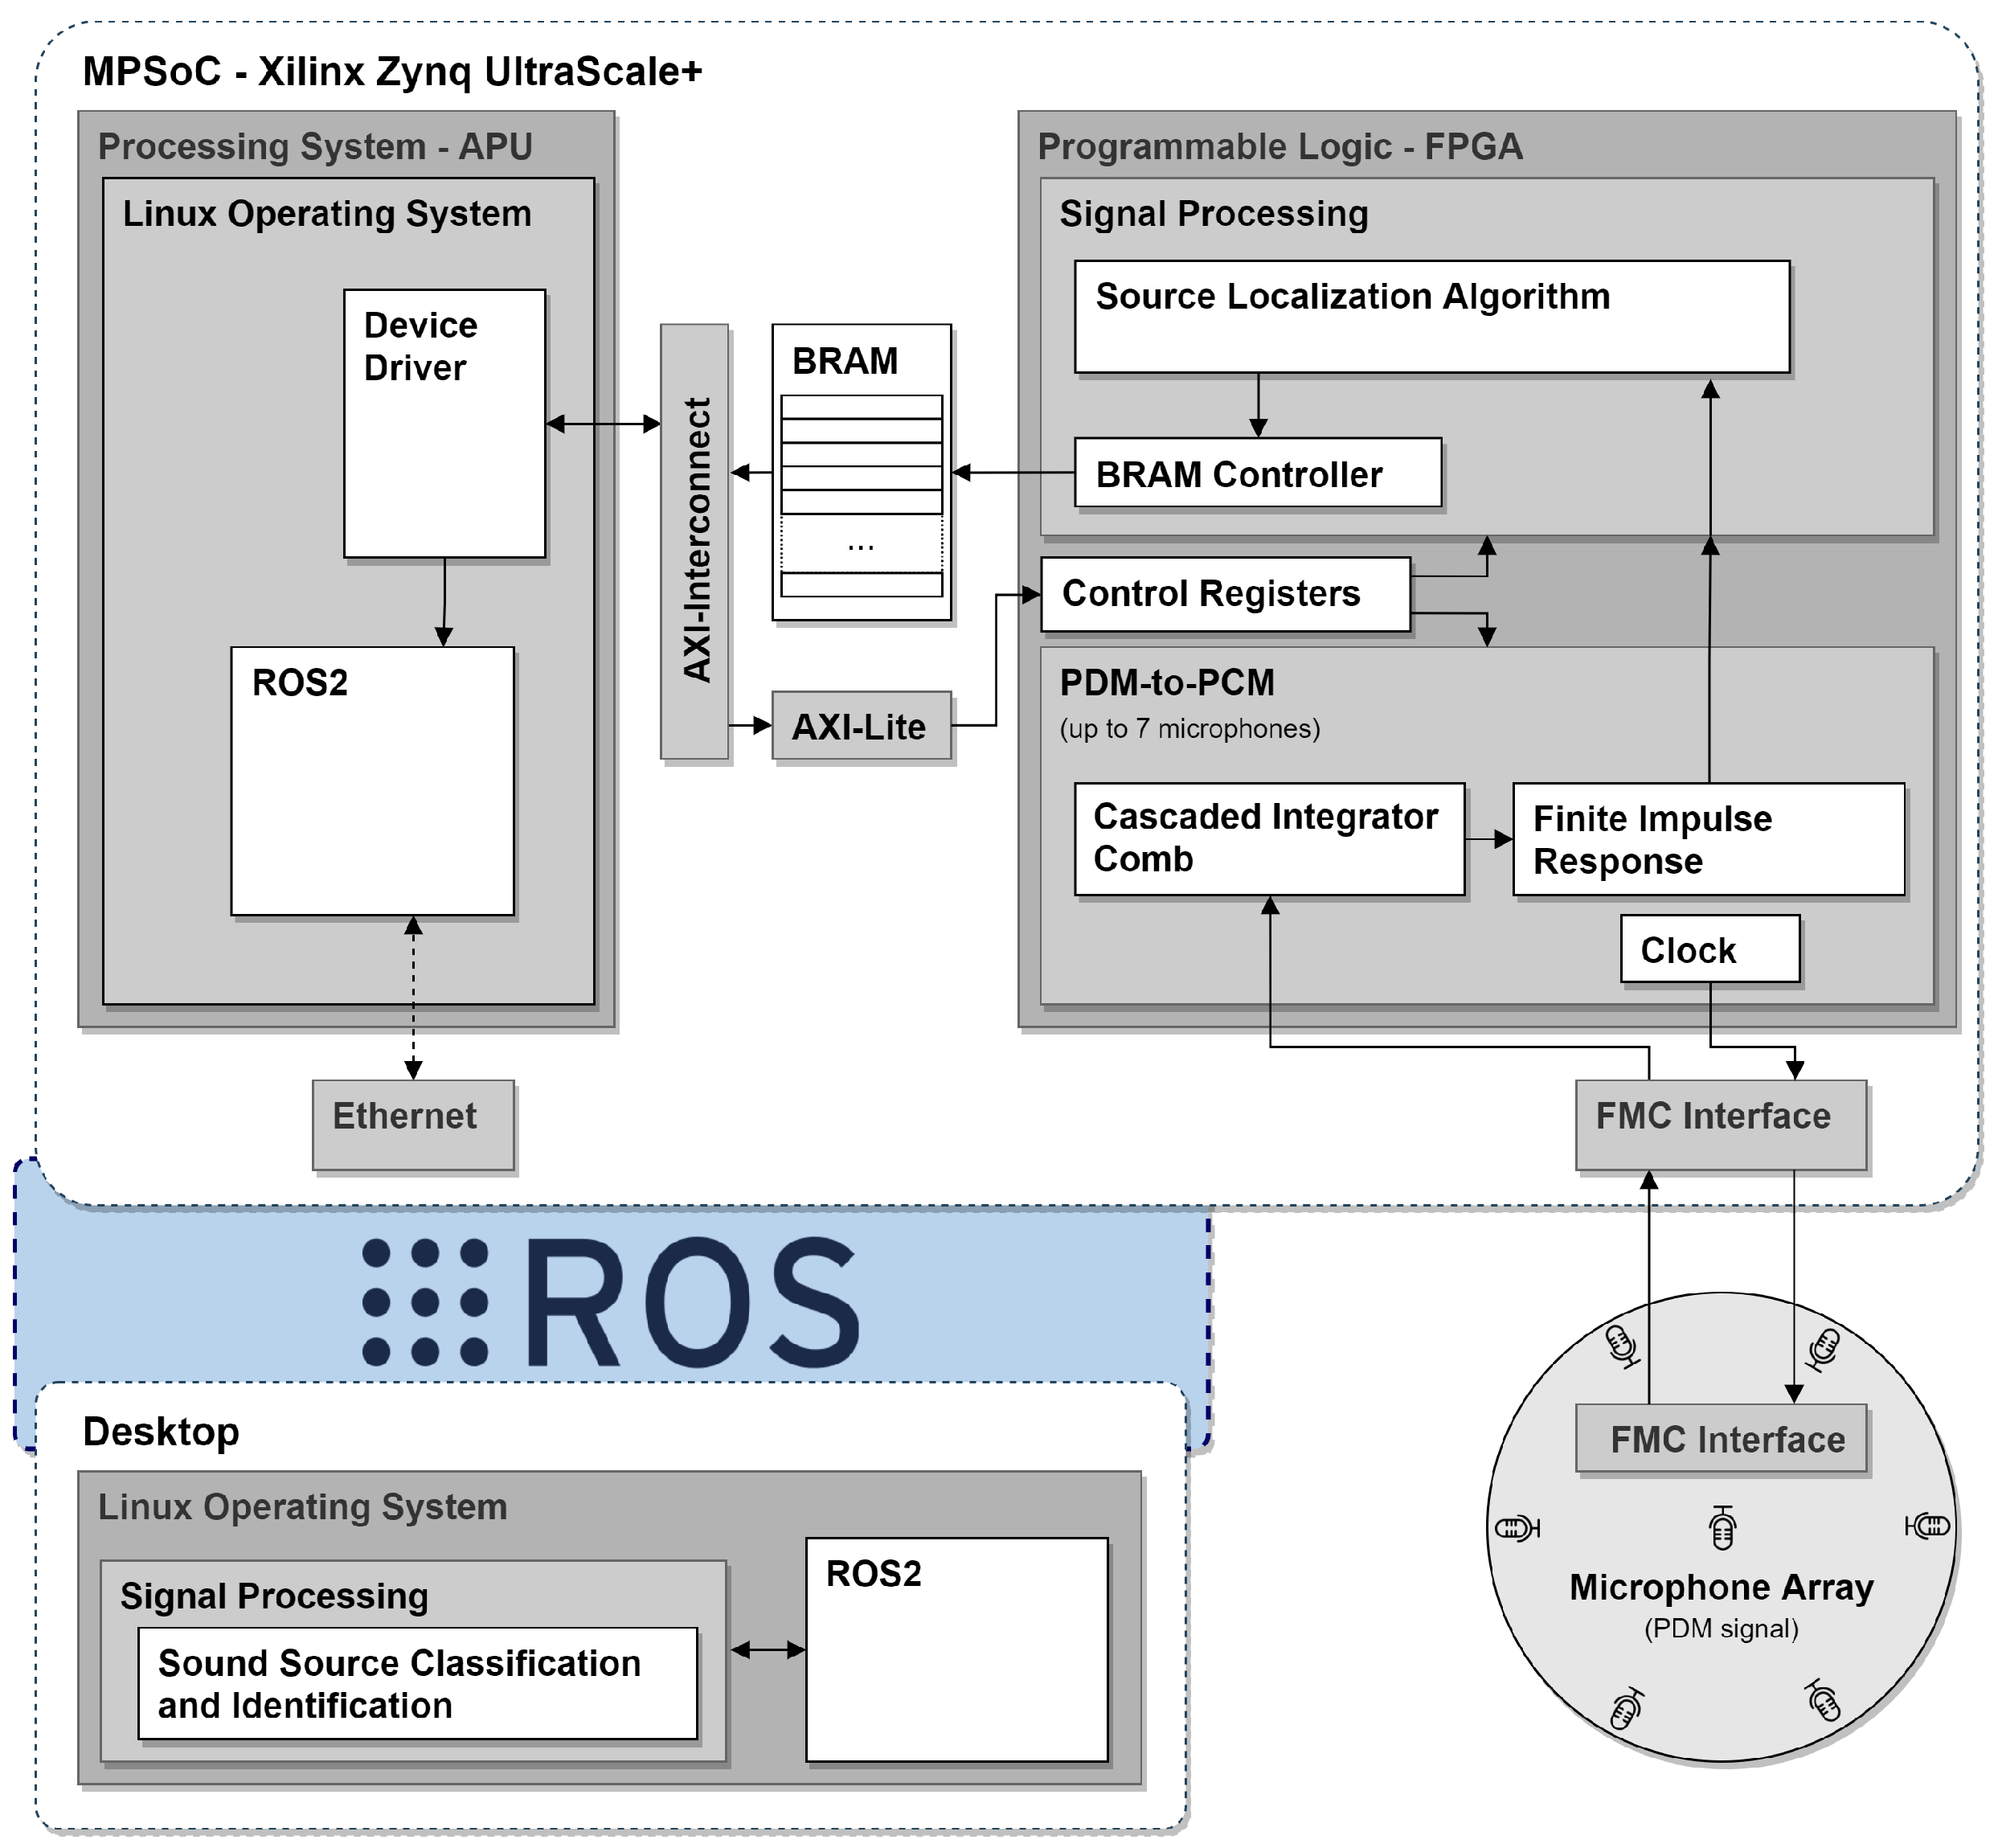
2. Sensor System Architecture

The sensor system’s architecture with all modules and their respective interactions is depicted in Figure 1. It is mainly divided into three main blocks:
(1)
the microphone array;
(2)
the processing platform; and
(3)
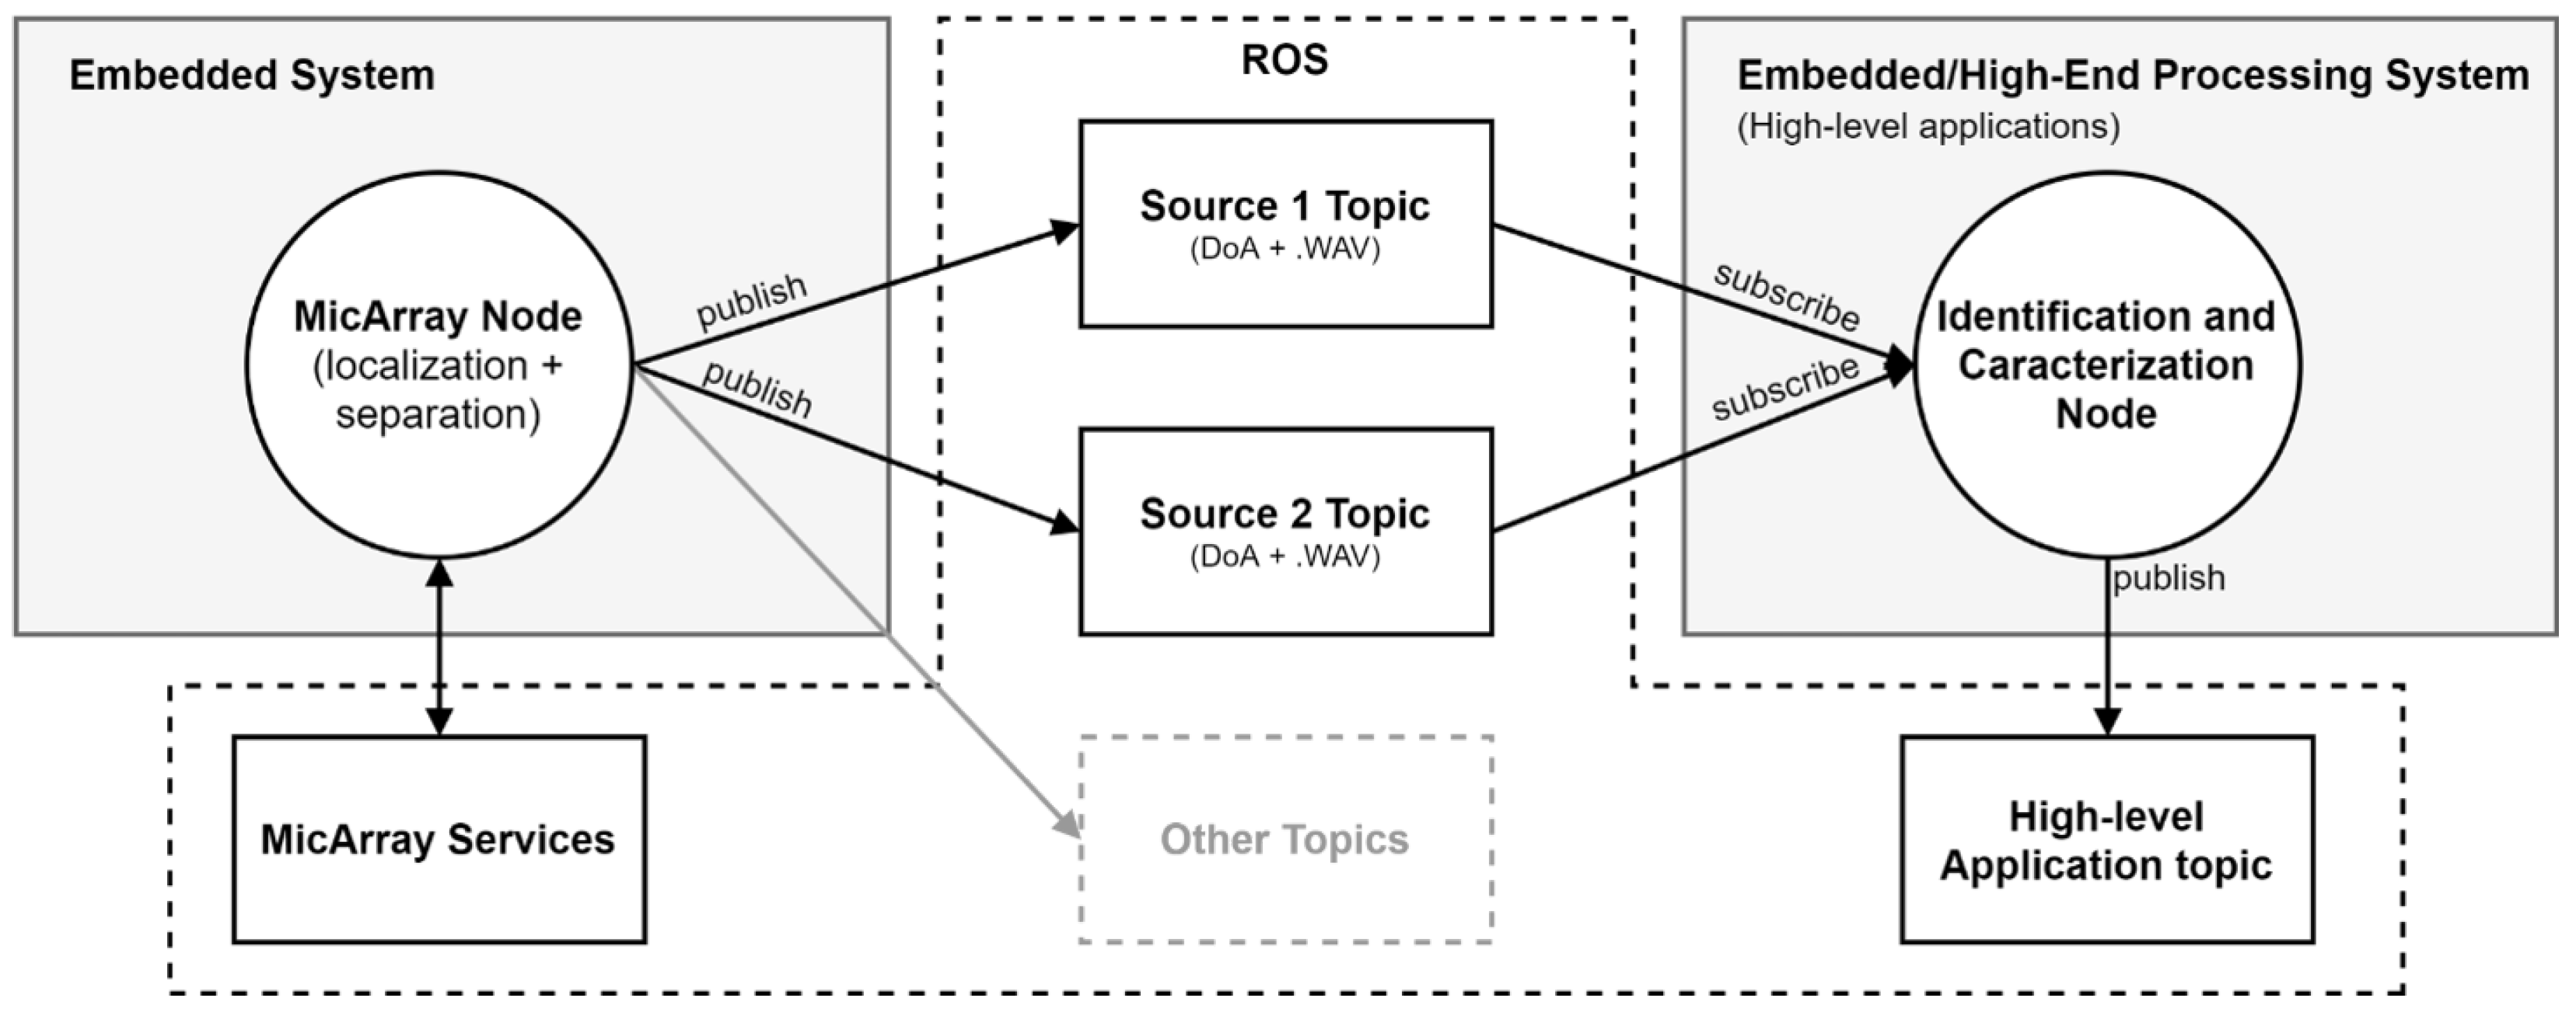
the ROS environment.
Microphone Array
The microphone array includes seven microphones in a Uniform Circular Array (UCA) geometry. The output of each microphone is a PDM signal containing the necessary information to localize and separate the sound sources. The microphone’s board is connected to the processing platform through an FPGA Mezzanine Card (FMC) interface, which is used to power the board, obtain data from the microphones, and provide the clock signal to generate the data output.
Processing platform
The processing platform is responsible for acquiring and processing, in real-time, the data retrieved from the microphone array module. It consists of the Xilinx Zynq UltraScale+, which includes a MultiProcessor System on a Chip (MPSoC) with Programmable Logic (PL) FPGA technology. This allows the acceleration in hardware of the microphone array interface and the source localization algorithms. On the PL side, the PDM-to-PCM module is responsible for converting the audio signal from the PDM to PCM format and for applying filtering steps to prevent signal aliasing and spatial-aliasing [50]. The conversion from PDM to PCM is required by the sound processing algorithm in the next hardware block. This step is performed in the Signal Processing module, where a set of calculations and bit operations in the FPGA are executed to estimate the DoA of the sound sources. The processed data, which contain the estimated DoA and the acquired signal, are sent to the Processing System (PS) through the Advanced eXtensible Interface (AXI) protocol in the Advanced Microcontroller Bus Architecture (AMBA) bus. On the PS side, the data are collected through a standard device driver supported by a virtualized embedded Linux Operating System (OS).
ROS Environment/Interfaces
On top of the embedded Linux, we run the ROS environment to provide the processing data (audio source data and localization) to higher-level applications that perform the identification and classification of the audio events inside the vehicle.
Figure 2 depicts the ROS architecture of the microphone array for sound identification and localization. Upon the arrival of new audio data, the MicArray Node reads and processes the output from the localization algorithm in the PL, that is, the DoA and the source audio sample in the WAV format, and publishes it to multiple topics according to the audio source (one topic for each source). Finally, each audio source topic is subscribed to by the Identification and Characterization Node, which applies the classification and identification algorithms and forwards data to higher-level applications for further processing. Moreover, the system provides a collection of services, which act as an interface to execute several actions, for example, performing hardware initialization, change parameters, configure the microphone array, and so forth.

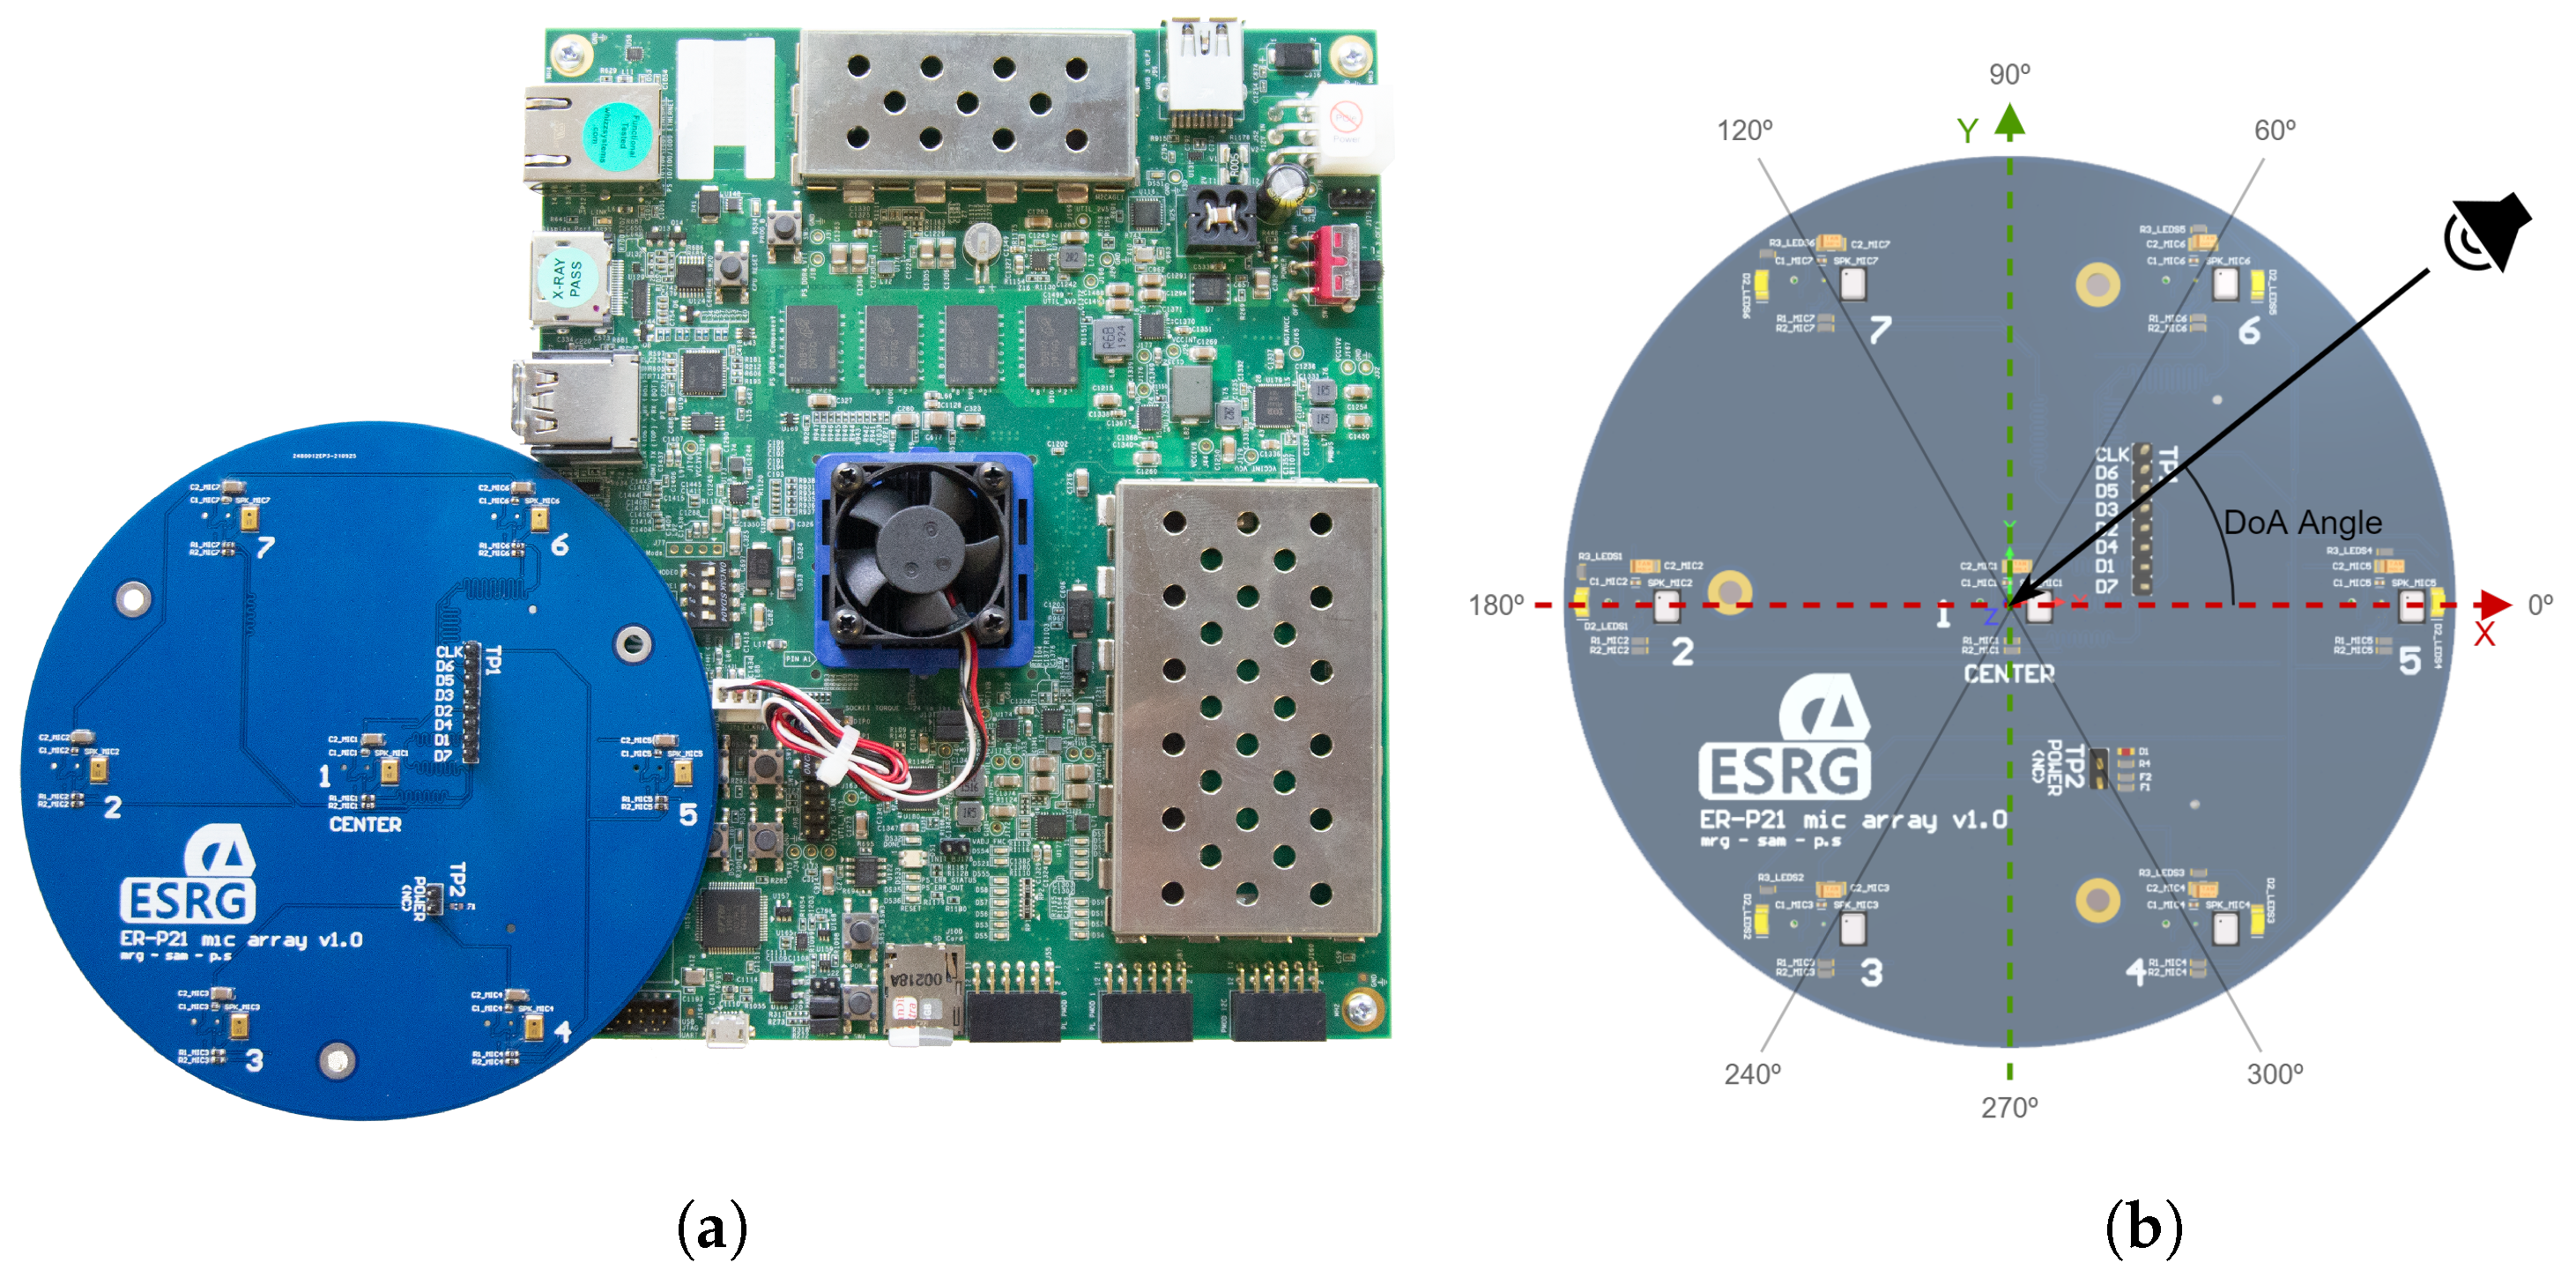
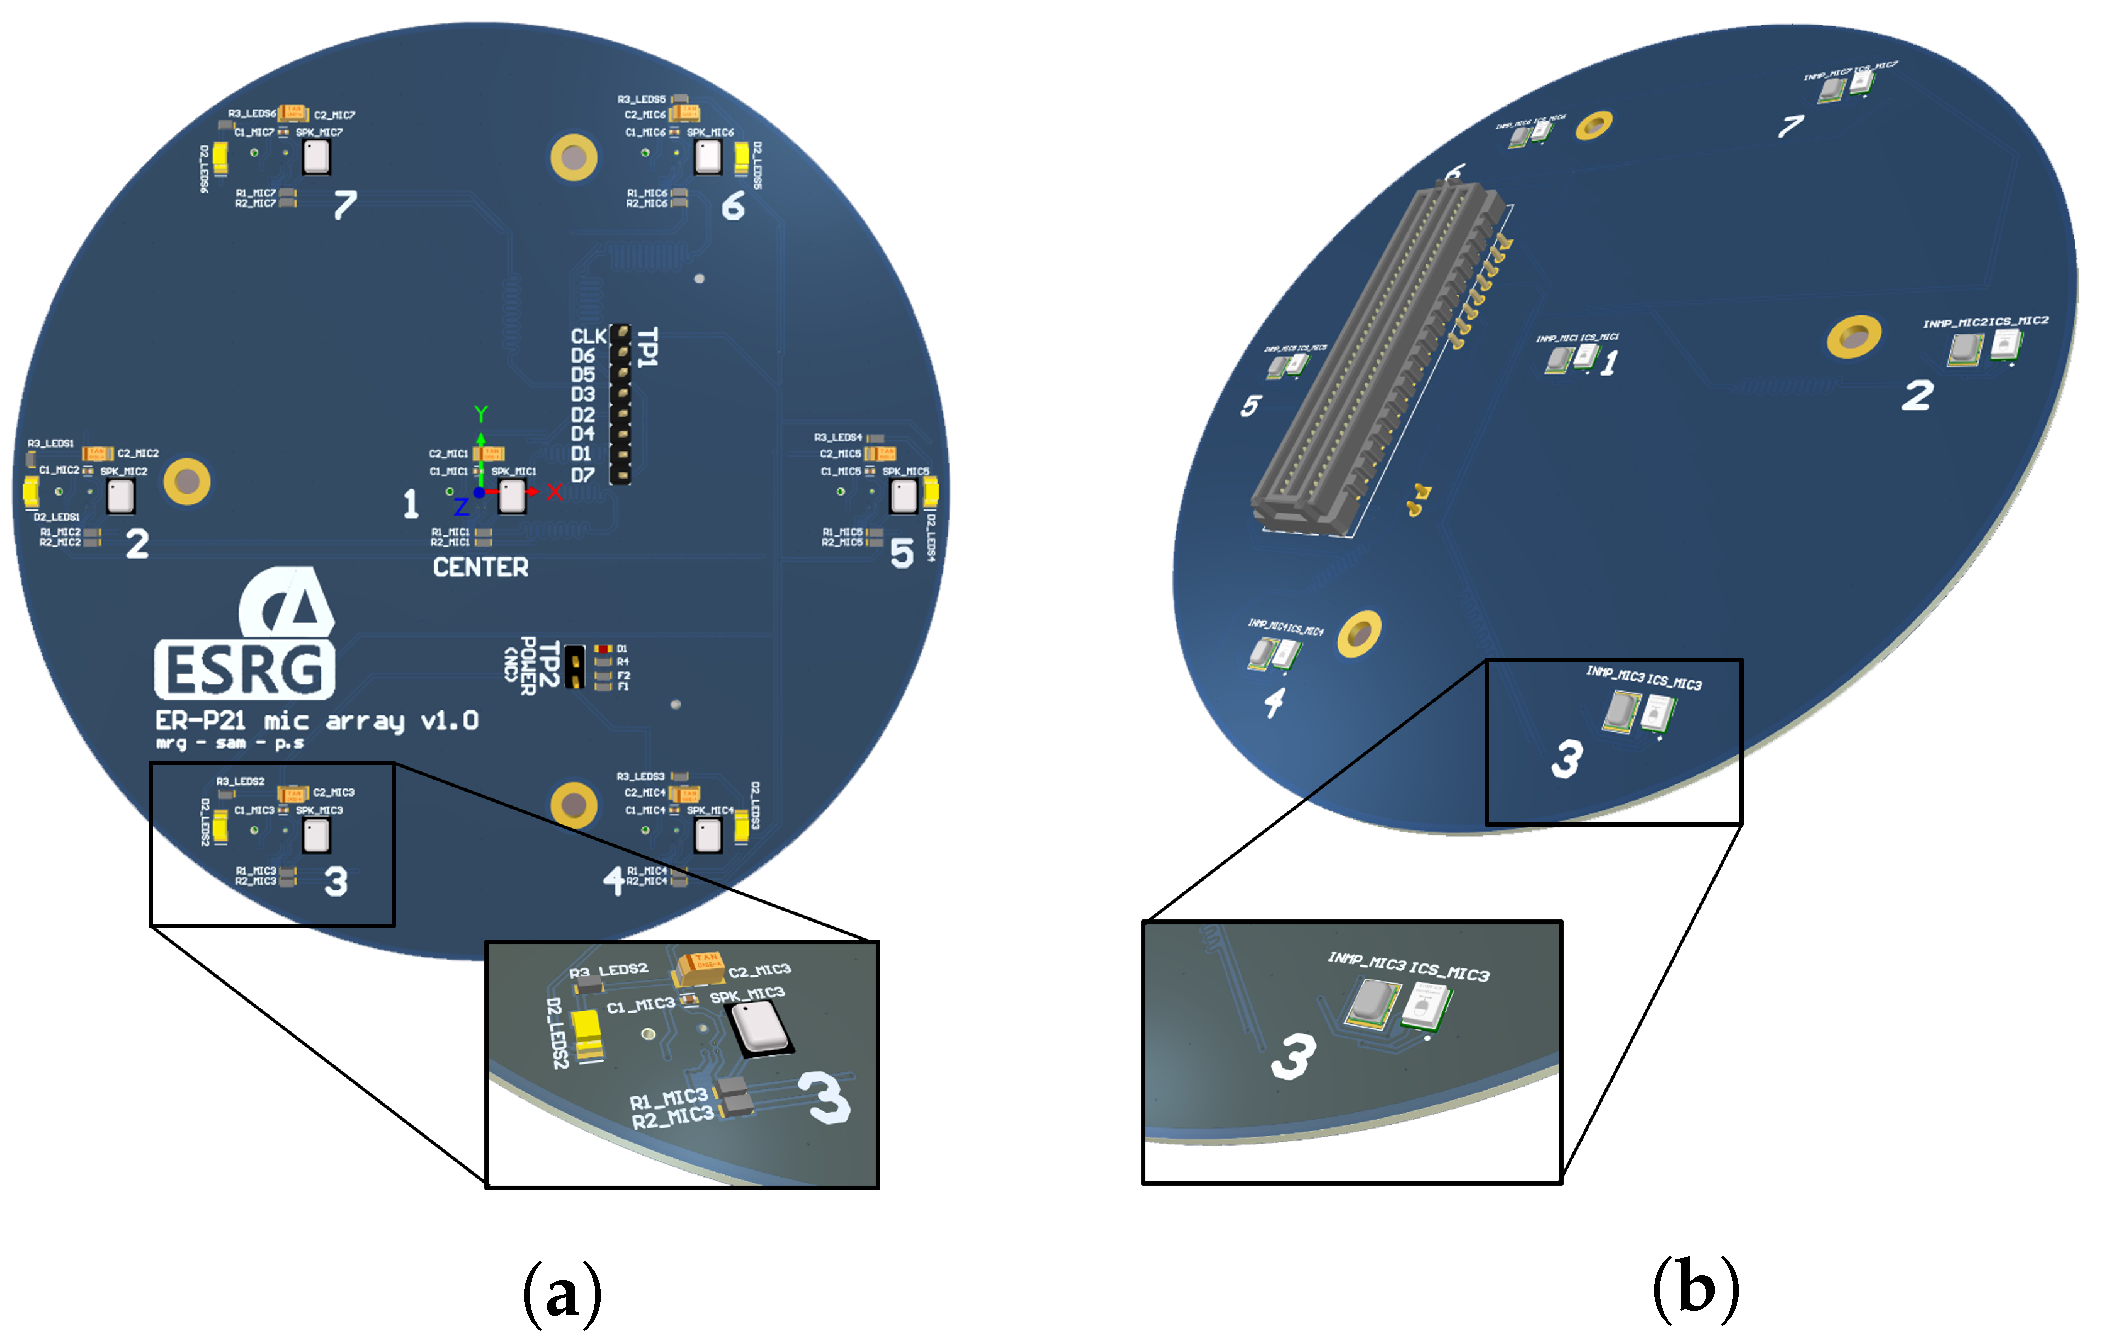
3. Microphone Array System

To develop the sensor system, and to comply with the project’s requirements, the microphone array must provide specific features such as: (1) have an UCA geometry with a maximum diameter of 10 cm; (2) use up to seven low-power MEMS microphones; and (3) include an FMC interface. In contrast to linear arrays, a UCA geometry allows the use of sound source localization in a 3D space, and the FMC interface allows the Printed Circuit Board (PCB) to be plugged into other platforms that support this connector. All microphones are spaced five centimeters apart, providing a UCA with six microphones placed around the circumference (60° between microphones). Additionally, one microphone is placed in the center to be used as reference during the computation of the algorithms. The PCB layout also has six LEDs, placed around the array and parallel to the microphones, to indicate the calculated localization of the detected sound source. The FMC connector, placed at the bottom side, allows us to make the direct connection between the processing platform and the microphones and LEDs.
Figure 3 shows the PCB layout developed for the microphone array. For testing different microphone devices, this board supports three kinds of omnidirectional and low-power MEMS microphones: INMP621 and ICS-51360 (from TDK InvenSense) [51,52], and SPK0641HT4H-1 (from Knowles) [53]. Among other features, they all provide low-power modes, data output in PDM format, and they all work with a clock signal around 2.4 MHz. These features allow the utilization of the same controller for any board configuration. However, and to simplify the sound source localization process, on each PCB prototype only one type of microphone in the array can be used. Due to this geometry, the maximum frequency that the system can handle is 3430 Hz, which is the spatial aliasing frequency, f S p a t i a l A l i a s i n g , as shown in Equation (1), defined by [50]:
f S p a t i a l A l i a s i n g = c 2 d ,
where c is the sound speed (in this case it was considered the sound speed in the air at 20 ° C, 343 m · s 1 ), and d is the smaller distance between microphones, 0.05 m.

4. Processing Platform

The processing platform includes a PL system with FPGA technology, and a PS with an Application Processing Unit (APU), which are both the main units used in this prototype. The communication between both systems is achieved via the AXI protocol through the AMBA bus and by resorting to the available Direct Memory Access (DMA) controller, and the communication with the microphone array PCB is done through the FMC interface. The processing platform deploys on the PL, the Signal Acquisition module (responsible of acquiring and converting the signal of each microphone) and the Signal Processing module (which includes the algorithm to localize the sound source). By its turn, the PS provides support to the hypervisor, Linux OS, device drivers, and the ROS interfaces.

4.1. Signal Acquisition Module

The data acquisition module is responsible for generating a clock signal of 2.4 MHz to interface the microphones and to collect and convert each microphone data output from the PDM to the PCM format. Figure 4 displays the data flow between each microphone and its corresponding acquisition block. Since the microphone output is a PDM signal with a switching frequency of 2.4 MHz, the PDM to PCM converter block deployed in the FPGA is responsible for: (1) generating a clock signal at 2.4 MHz; (2) acquiring the data from the microphone at the same clock frequency; and (3) converting the signal from PDM at 2.4 MHz to the PCM format at 8 kHz with a 24-bit resolution.
To convert the signal from PDM to PCM for each microphone [54], the processing steps depicted in Figure 5 were used. The process has three stages, starting with a low-pass filter that receives the PDM signal from the microphone and, after a quantization process, outputs a new signal to the next block. Since the microphones use a sampling frequency of 2.4 MHz, the next block performs a decimation by a factor of 300, which creates a new signal frequency of 8 kHz. These two stages are developed in the FPGA using a Cascade Integrator Comb (CIC) filter block. The last stage corresponds to a Finite Impulse Response (FIR) filter block, that performs a band-pass filter. This filter has the lower cut-off frequency at 70 Hz to remove the Direct Current (DC) component, and it has the upper cut-off frequency at 3 kHz, which reduces possible aliasing phenomena (audio and spatial aliasing). Although the bandwidth of the pass-band filter is between 70 Hz and 3 kHz, this range is enough for the human voice’s fundamental frequency, which is commonly between 85 and 155 Hz for an adult male, and 165 to 255 Hz to an adult female [55].

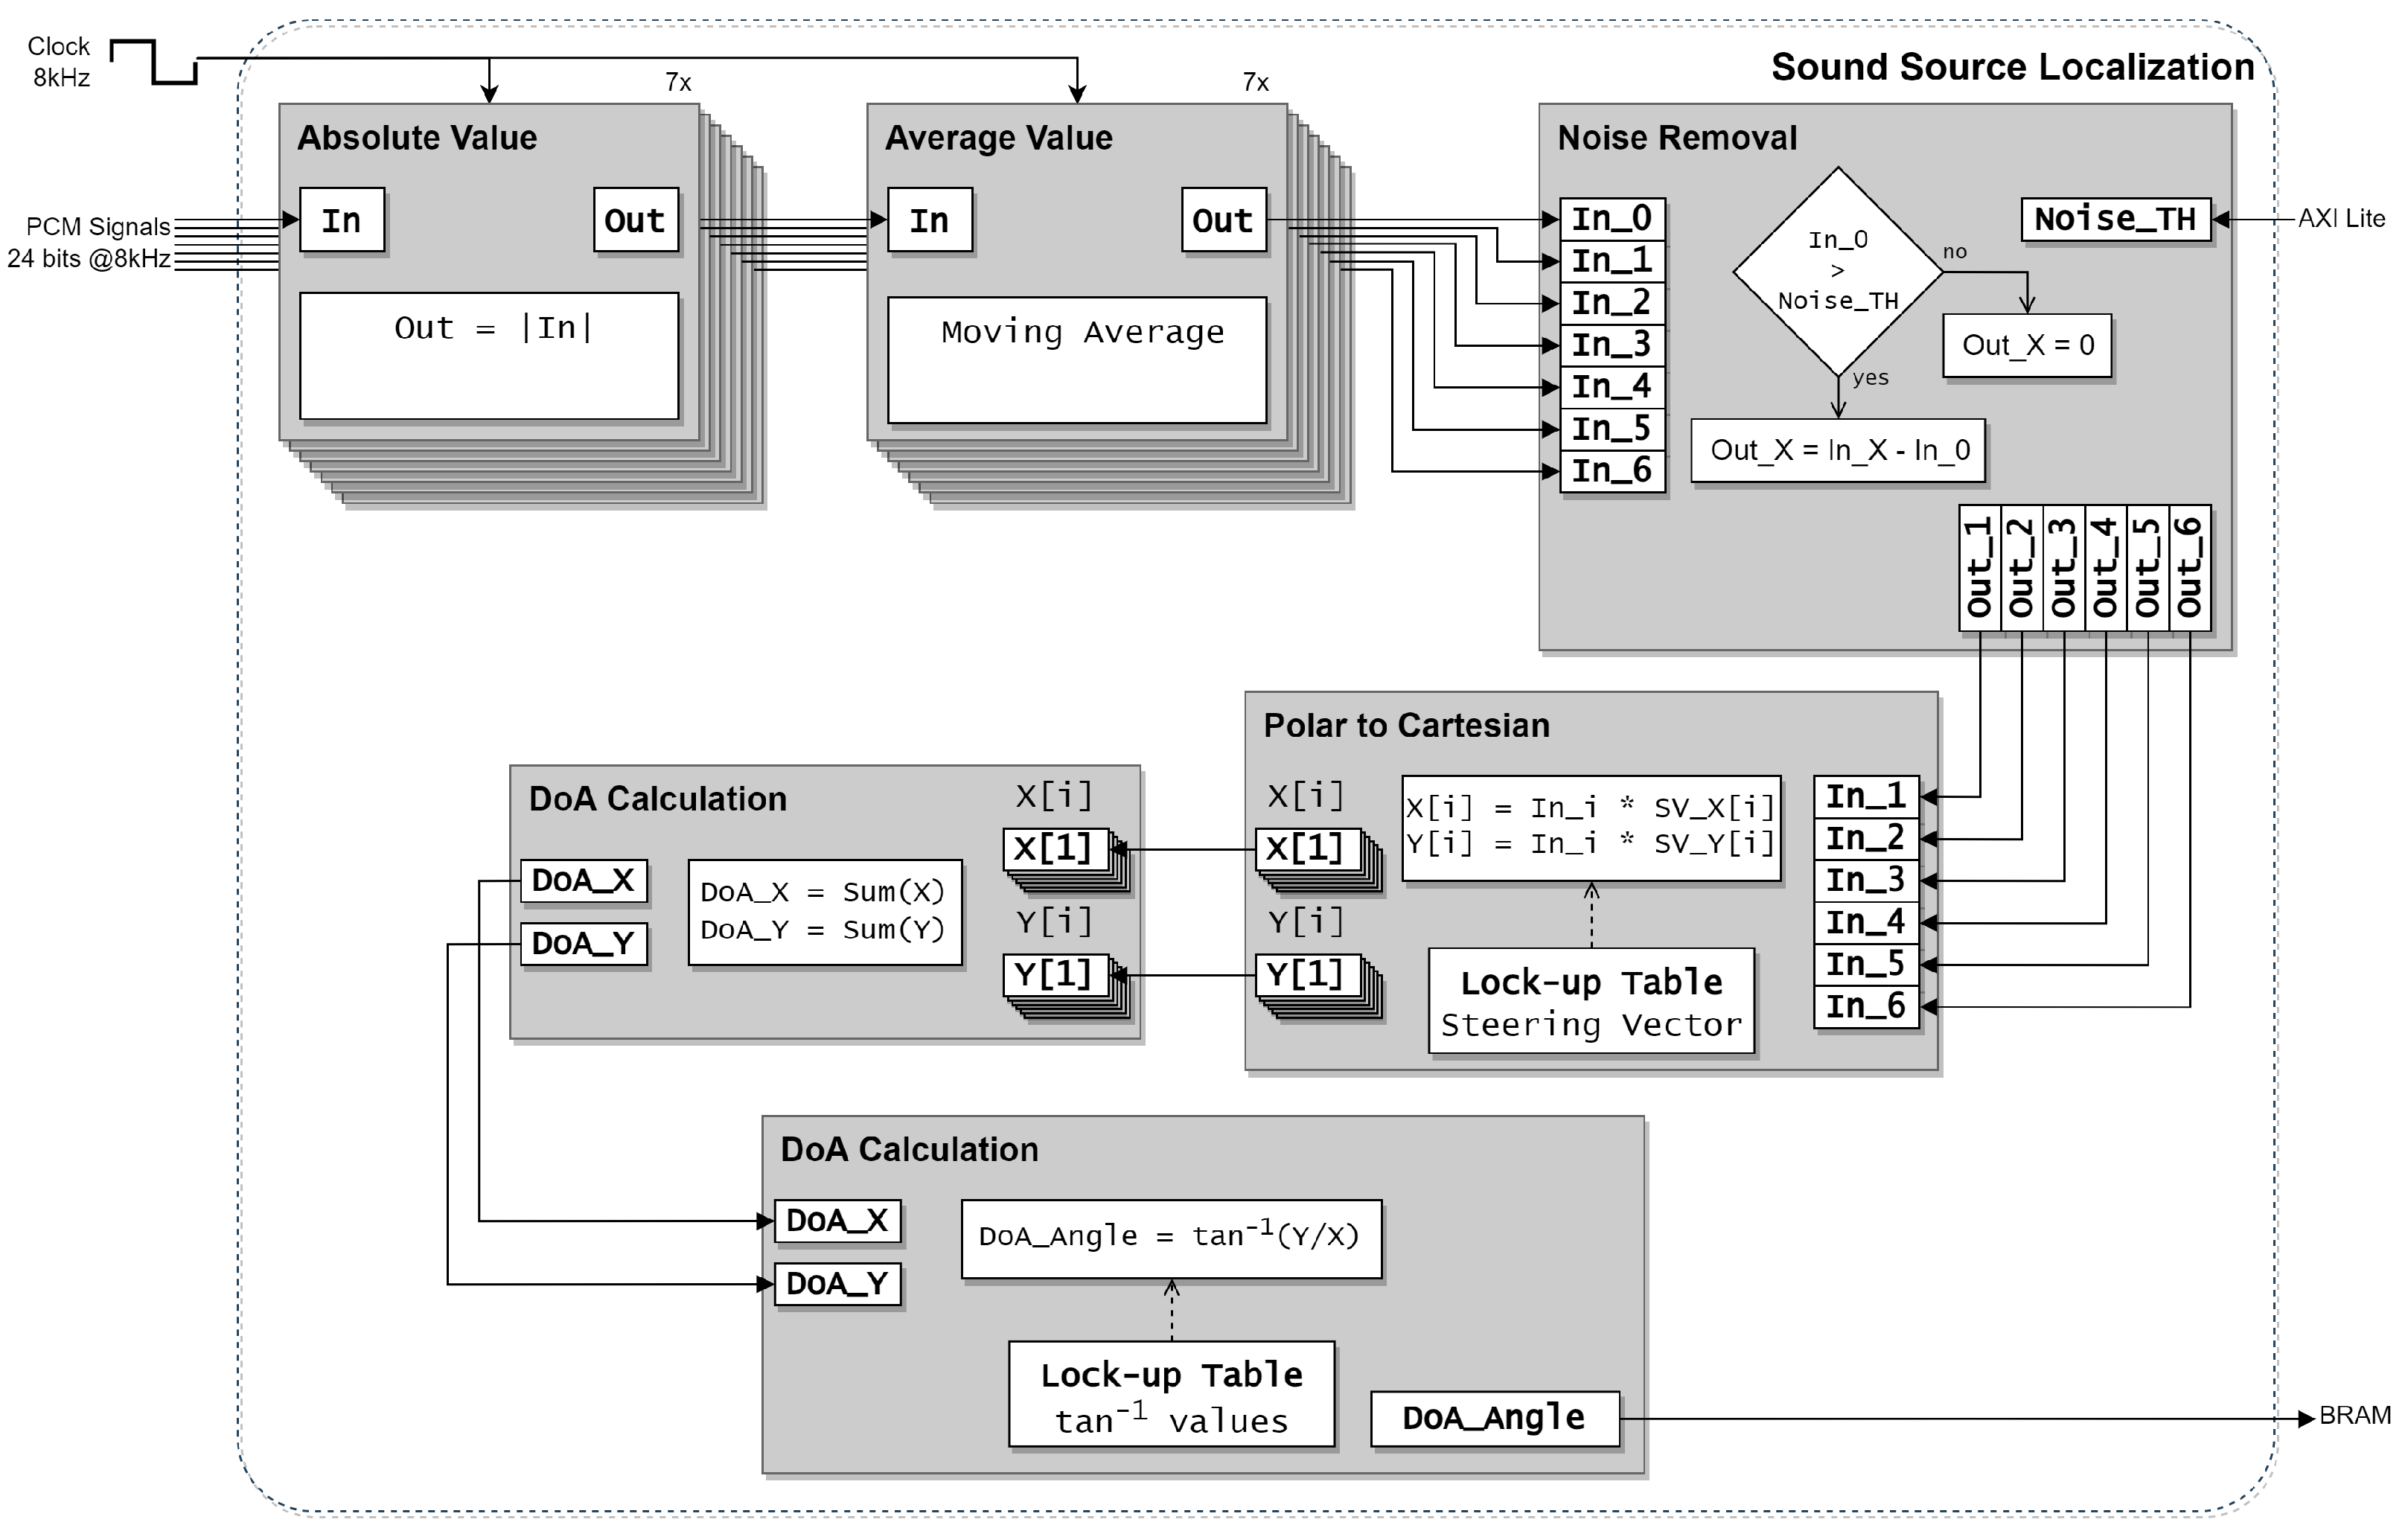
4.2. Sound Source Localization

The algorithm to localize the sound sources is presented in Figure 6. Since its working principle is based on the signals energy, it requires data from all microphones to calculate the DoA of the sound source. This task is performed in six sequential steps: (1) Absolute Value; (2) Average Value; (3) Noise Removal; (4) Polar to Cartesian; (5) DoA Calculation; and (6) Get Angle.
(1)
Absolute Value: In this step, for each microphone, the input data (in PCM format) are received at the same frequency of the sampling frequency (8 kHz) to calculate its absolute value.
(2)
Average Value: This step receives data from the previous block and calculates the moving average for each microphone signal.
(3)
Noise Removal: This block receives the data from the previous step and a user-defined noise threshold signal (Noise Threshold). If the average value of the central microphone is less than the Noise Threshold, then it is considered only background noise in the environment, and the new average value for each microphone is set to zero. Otherwise, the average value of the central microphone is subtracted from the remaining microphone’s data.
(4)
Polar to Cartesian: This stage calculates, for each of the six UCA microphones, its cartesian position multiplied by its corresponding average value. The output from this block is the weight vector for each microphone according to the signal energy.
(5)
DoA Calculation: In this step, the resultant of all vectors to output a cartesian vector with the DoA estimation is calculated.
(6)
Get Angle: This stage calculates the DoA angle from the cartesian vector.
To optimize the conversion steps, the Polar to Cartesian and the Get Angle, make use of look-up tables. Additionally, the output from the Polar to Cartesian stage provides information to control the LEDs in the microphone array. The output data corresponds to the weight of each microphone according to the location of the sound source. This data are processed to generate a Pulse-width Modulation (PWM) signal for each LED, which results in a brighter light on the LEDs closer to the sound source.

4.3. Interface between the PL and the PS

The communication between the PS and the PL is made through the AXI-Lite protocol over the AMBA bus. System data can be classified as: (1) data acquired by the microphones and processed in hardware that includes the DoA estimation and the respective PCM signal, transferred from the PL to the PS; and (2) control data transferred from the PS to the PL that is used to configure the acquisition and localization systems. In the first case, that is, data from the PL to the PS, the process is performed in two ways:
(1)
the PCM signal data are written to the Block Random Access Memory (BRAM) directly through a BRAM controller that defines the writing position. This data are accessed by the PS through an AXI interface connected to the BRAM;
(2)
the DoA data are directly set available to the PS via AXI-Lite interface.
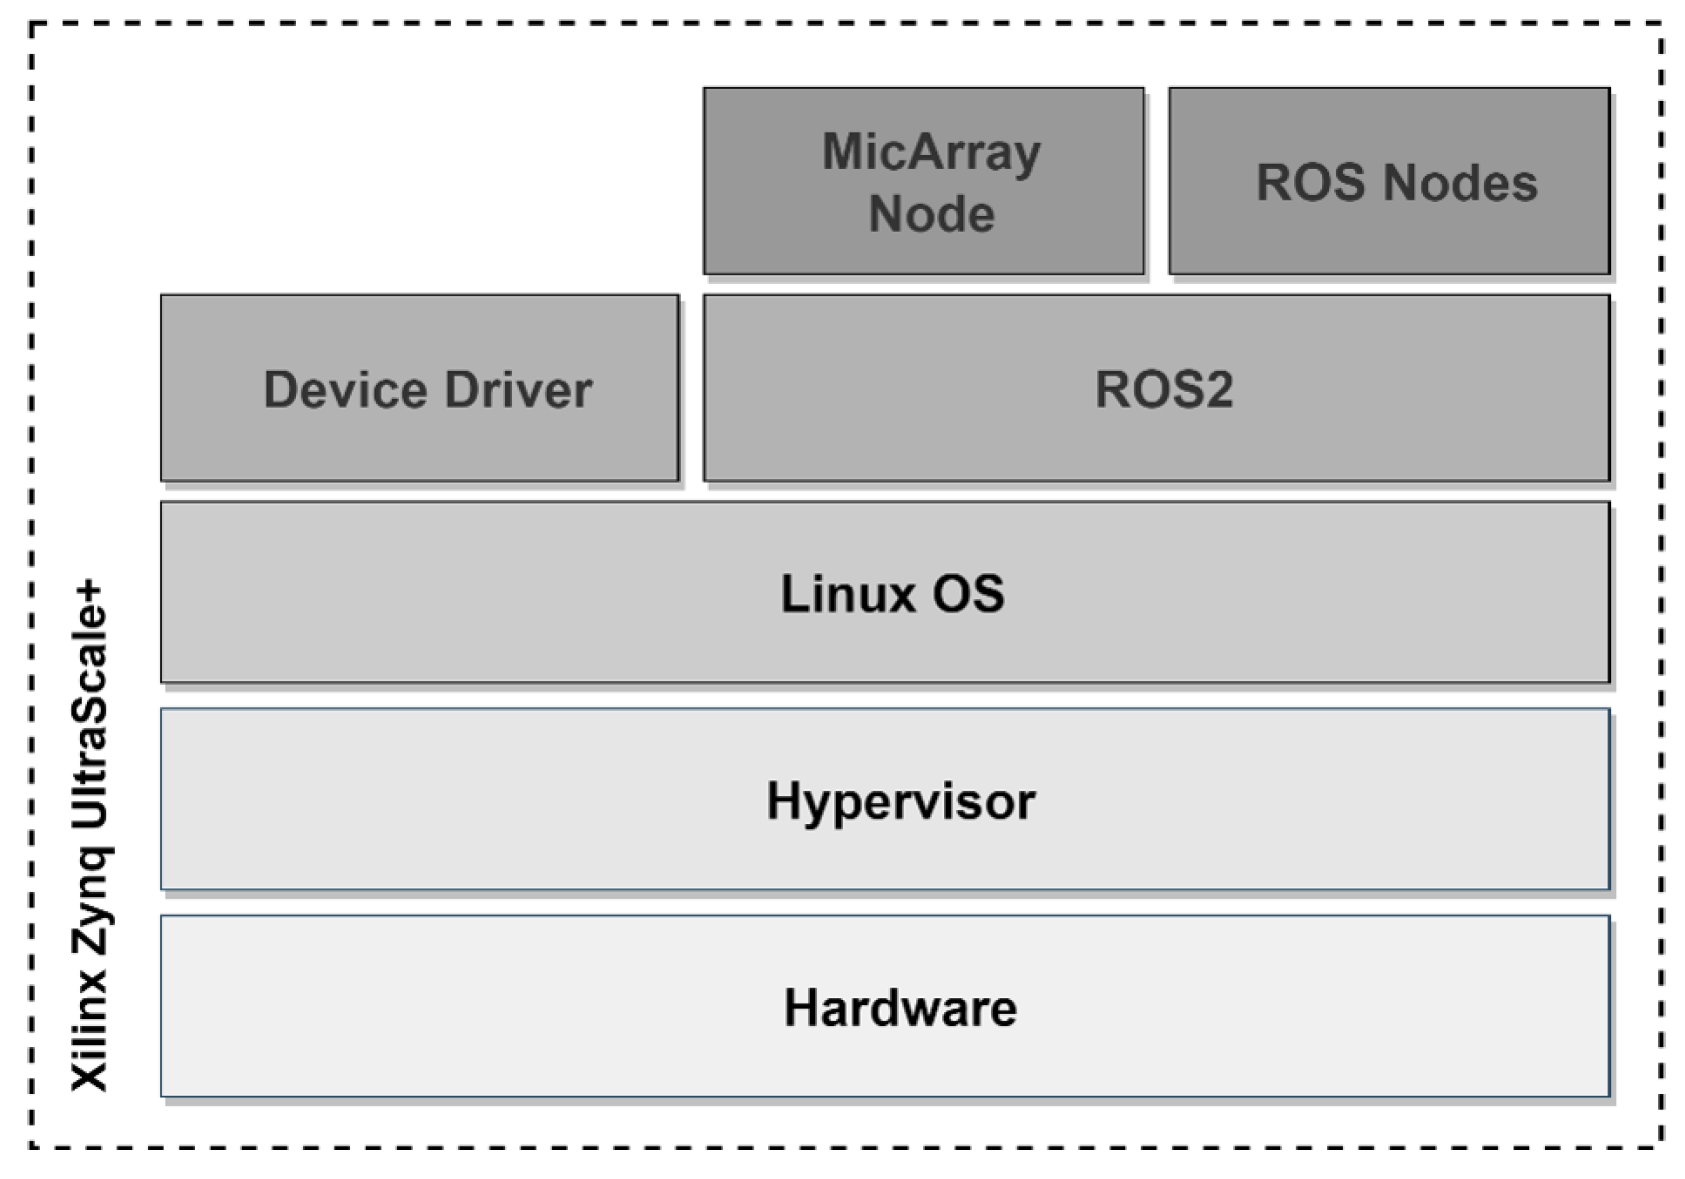
In the second case, where the PL receives the control signals from PS, the AXI-Lite protocol is used, where the PS can access control registers to enable the PDM-to-PCM Converter and Signal Processing modules, and to configure the noise threshold inside the sound source localization module.

4.4. Software Stack

Figure 7 depicts the software stack that is supported by the PS. The ROS2 system, supported by a virtualized Linux, is used to ease the integration of the microphone array with the ROS network standard. As previously shown in Figure 2 from Section 2, it provides specific interfaces of nodes and topics, allowing both for system flexibility, scalability, and interoperability features. Moreover, to configure and capture the audio data packages from the microphone array within the OS, a device driver was developed and included in the custom Linux image. Finally, to guarantee data security and prevent unwanted accesses from third parties to the audio data that flows through the system, an additional virtualization layer was added through our in-house made static partitioning hypervisor Bao [56].

5. Evaluation

In order to test and evaluate the speaker localization and identification prototype, we have used the following experimental setup: (1) the sensor system prototype (Figure 8a); (2) an audio sound source; and (3) a laptop computer with a ROS interface that subscribes to the ROS topics. The laptop is connected to the processing platform through an Ethernet interface (in a wired ad-hoc network using an SSH session) to control the prototype system and store the acquired and processed data (signal data and DoA from each sound source). Regarding the sensor system, three different steps were executed to demonstrate its behavior with just one sound source:
(1)
first step test evaluates and verifies the acquisition system, i.e., sampling, PDM to PCM format conversion, and data filtering;
(2)
second step evaluates the accuracy and precision of the localization system;
(3)
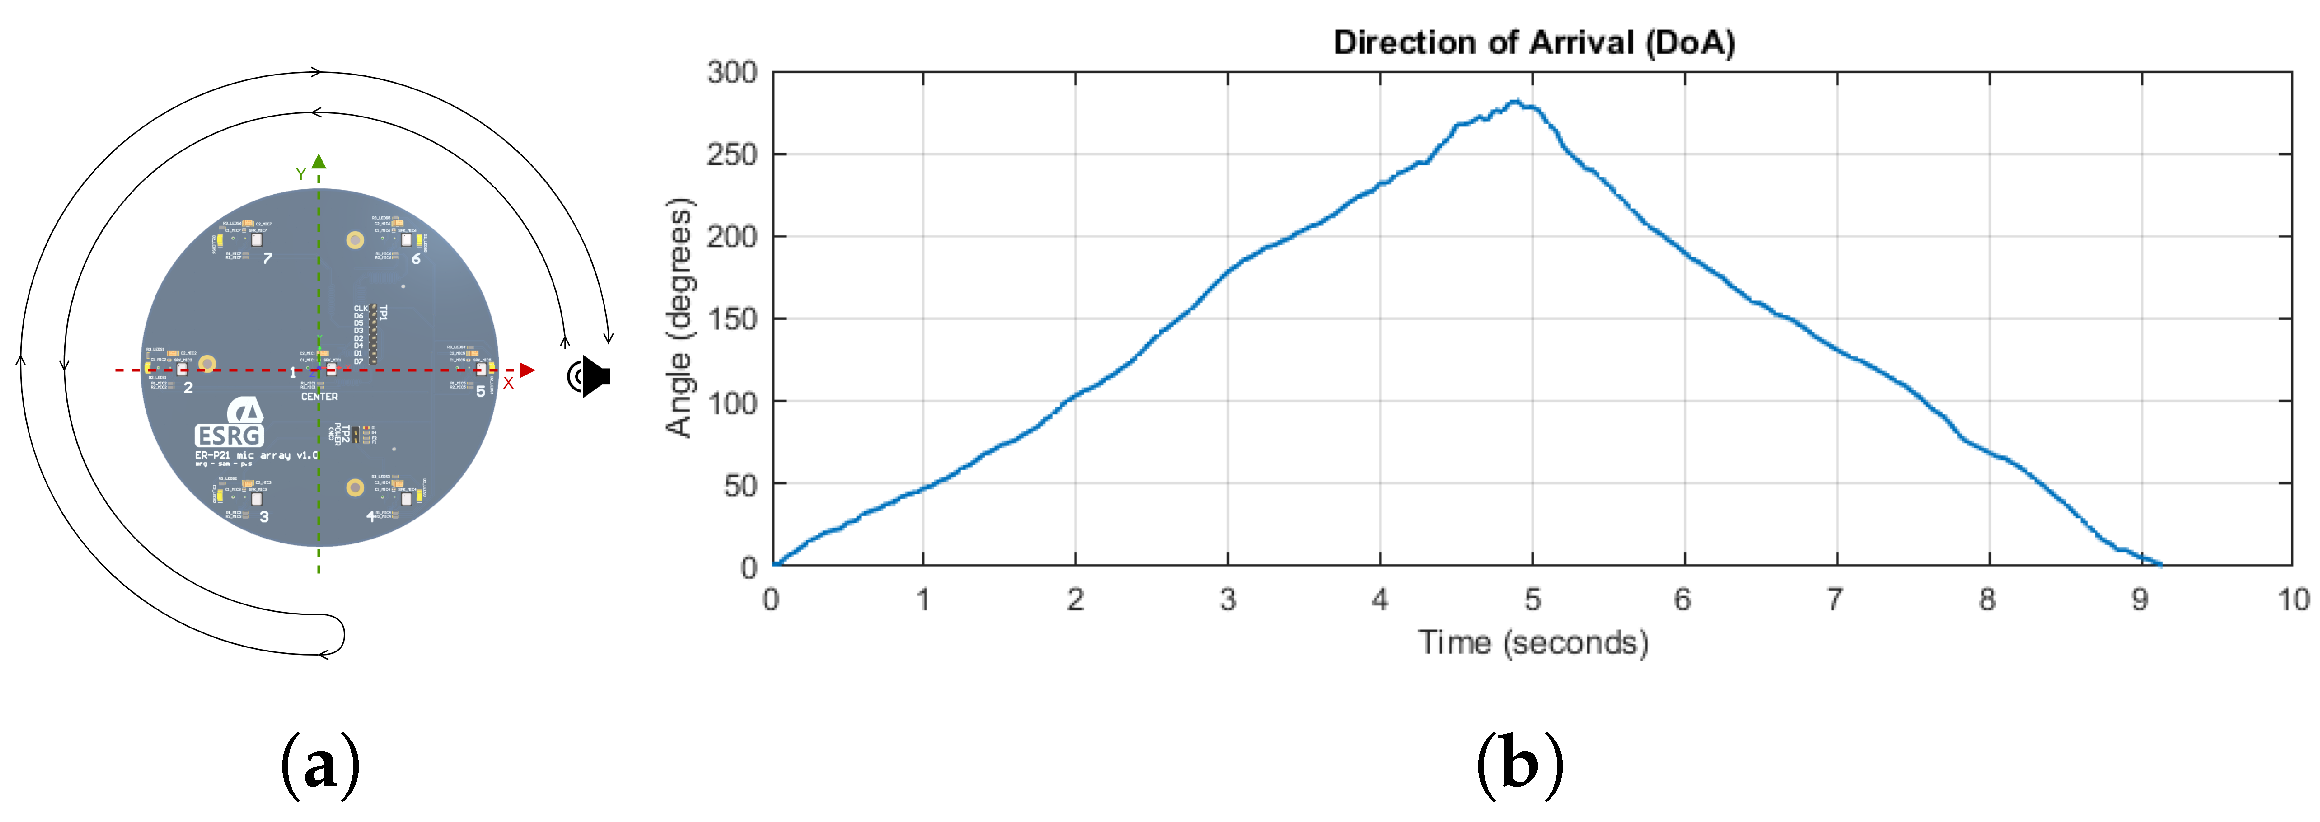
lastly, the third step evaluates the localization system in the presence of a moving sound source, checking the DoA and verifying the resulting angle with the actual position of the sound source.
The center microphone is used as the reference to calculate the DoA, and the angle measurements, with resolution of 1°, start at 0° on the positive x-axis of the unit circle graph (corresponding to the microphone number 5), and go counter-clockwise around the circle until they are back at 360° (Figure 8b). Since the sensor system is to be placed in the center of the vehicle’s roof and to bring the sound sources closer to the conventional passenger locations, during the tests, the sound source was placed between 50 to 150 cm away from the microphone array with an elevation of 45°.

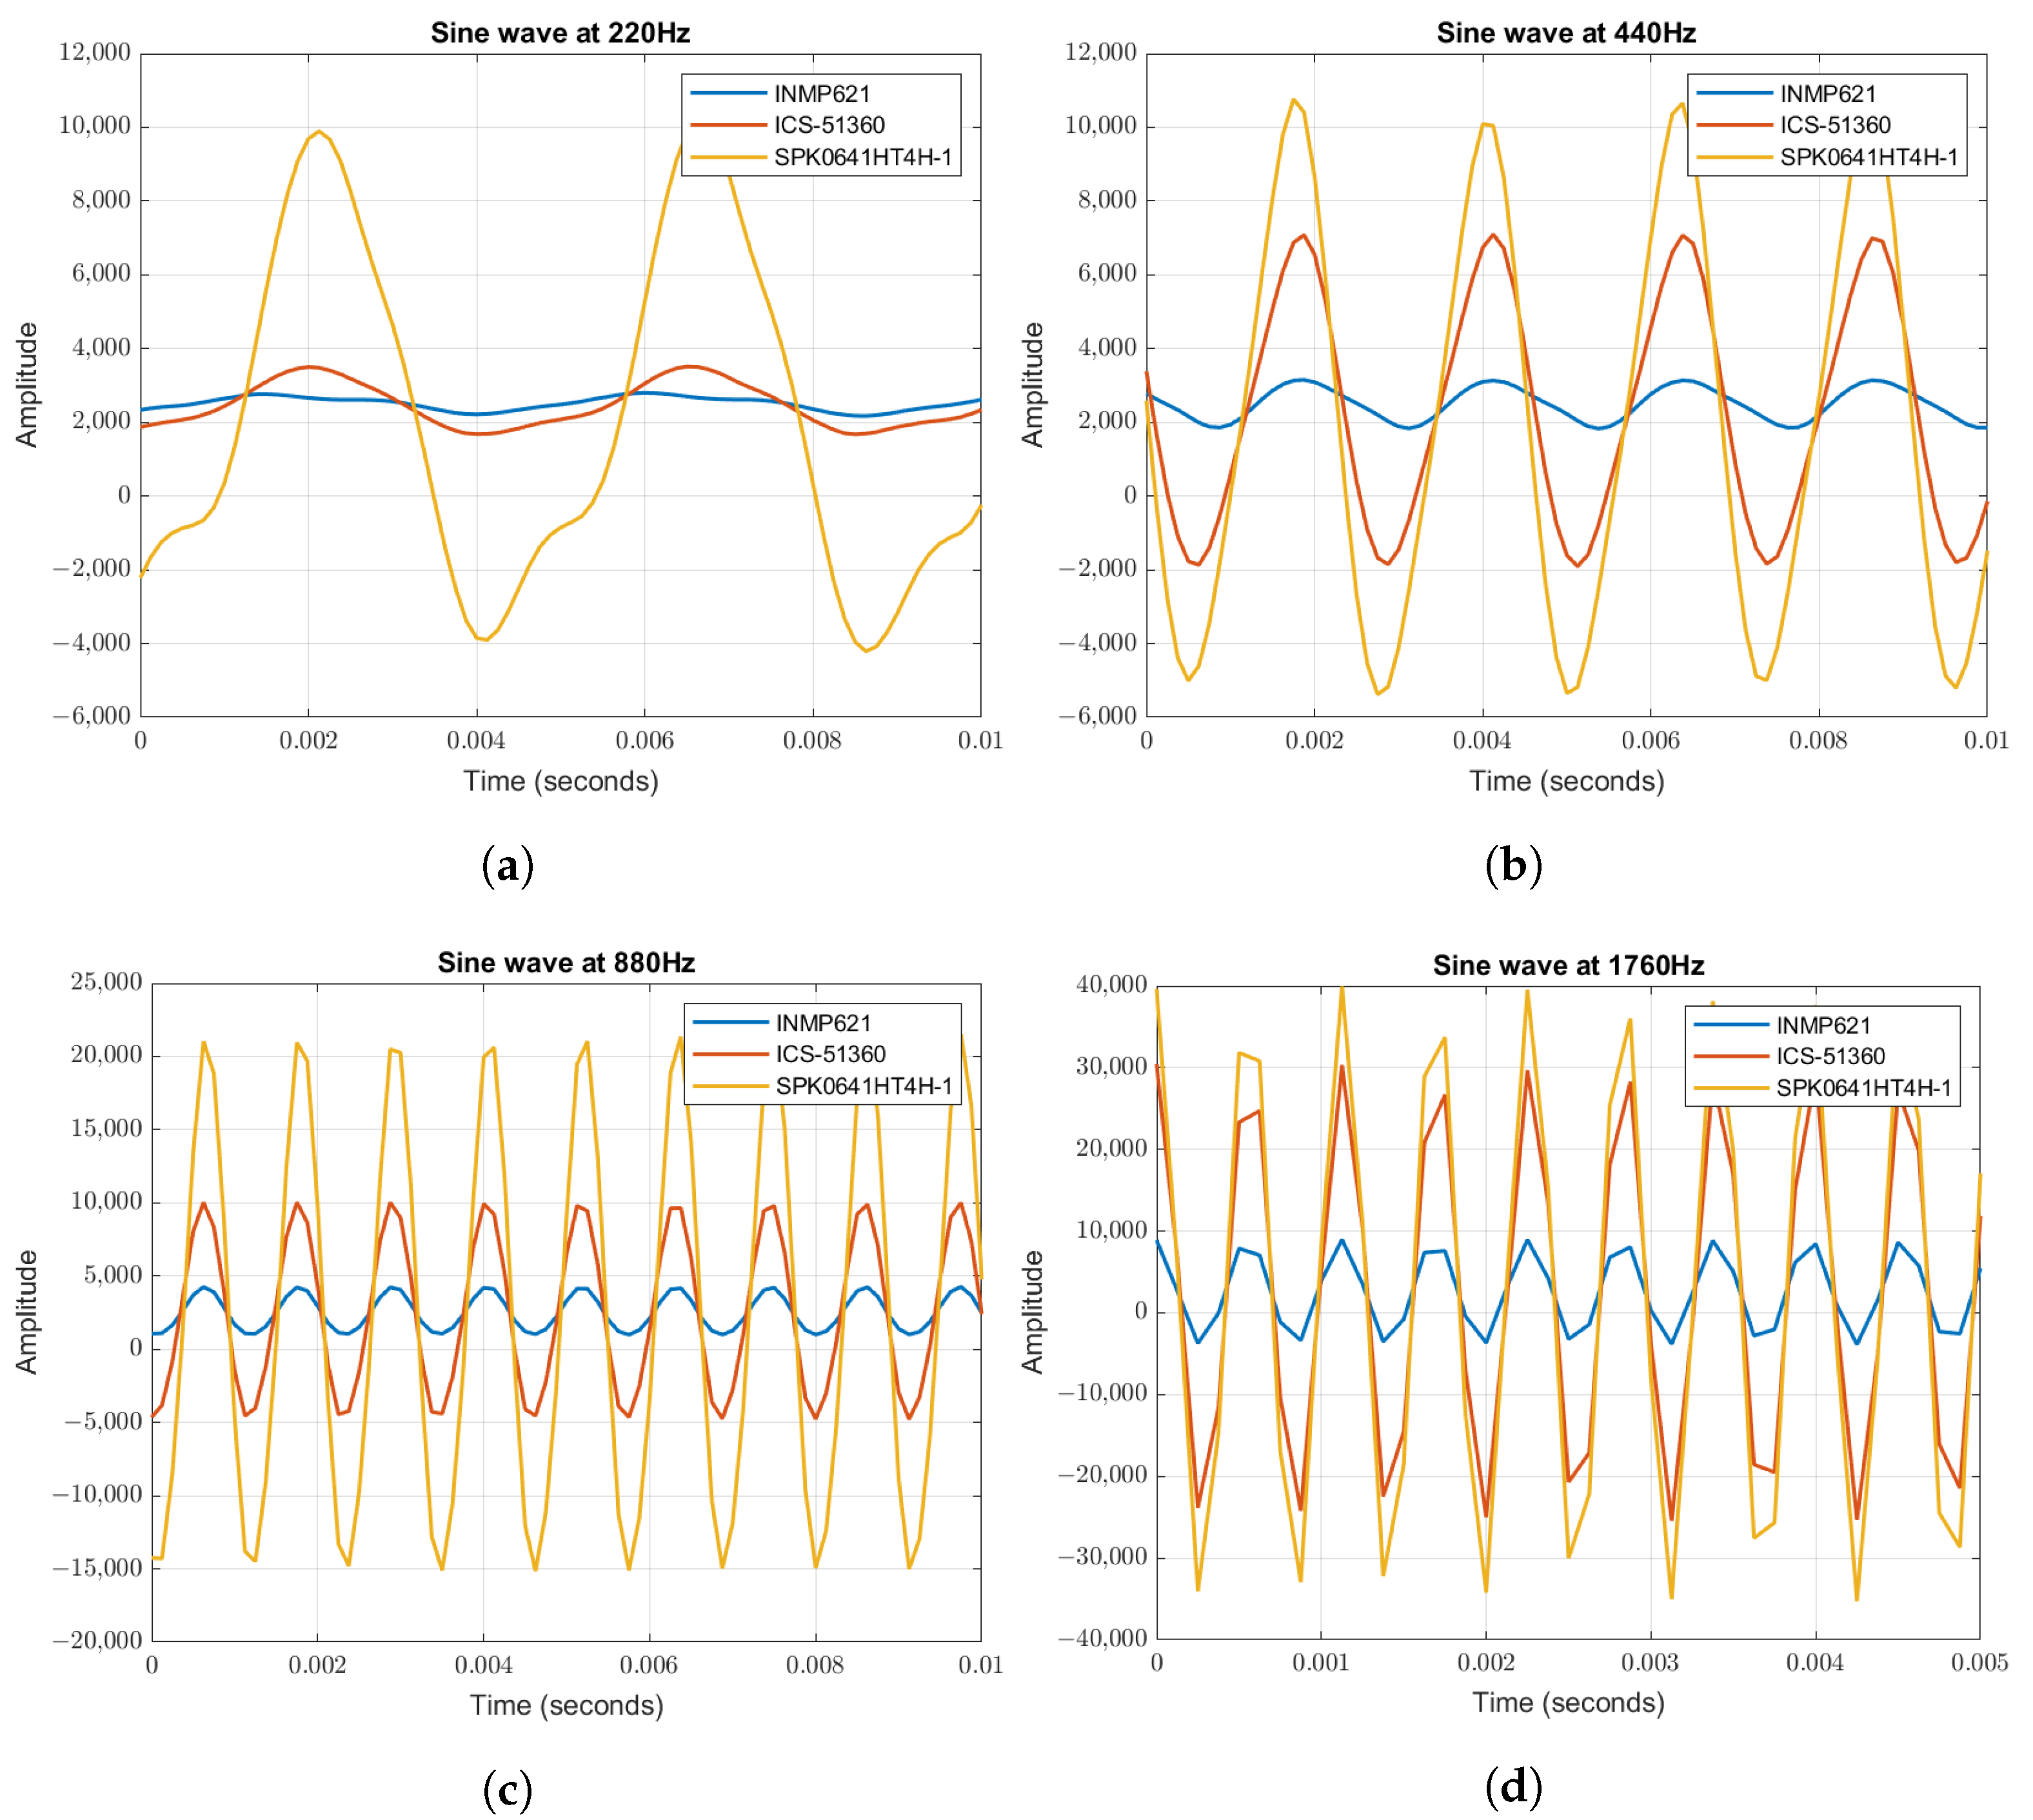
5.1. Data Acquisition

To test the acquisition modules, the system was adapted to bypass the sound source localization module and each microphone’s data were directly sent from the PDM-to-PCM module to the device driver using the BRAM controller. During the tests, the sensor system was exposed to different sound sources, which allowed the analysis of the behavior of the PDM-to-PCM module at different frequencies and distances. Figure 9 depicts the results for the three types of microphones available in the microphone array. The sound source used to test the data acquisition was a controlled signal (sine wave) at different frequencies: 220 Hz (Figure 9a); 440 Hz (Figure 9b), which is currently used as the reference frequency for tuning musical instruments; 880 Hz (Figure 9c); and 1760 Hz (Figure 9d). All the sound sources have their fundamental frequency within the bandwidth defined for the band-pass filter.
The results show that the microphones and the conversion module can achieve a good performance in collecting sound within the frequency ranges defined by the band-pass filter since the main characteristics of the original signals are present on the acquired samples. However there are some differences in the received signal’s amplitude, which are mainly associated with the receiving power of the collected signal, which can be affected by: (1) the location and position of the microphones in the array; (2) the aperture size of the microphone’s sound port; (3) and the aperture size of the PCB hole for the sound port. For instance, the INMP621 and the ICS-51360 are located in the bottom layer of the microphone array, which result in signals with lower amplitude values. Moreover, Figure 9a presents some signal’s distortion and lower amplitudes, which are mainly due to the speaker’s ability to generate lower frequencies.
For testing the band-pass filter we have generated sound waves at frequencies above the filter’s cutoff frequency which is 3 KHz. Figure 10 shows the results in each microphone type for two different frequencies, 3520 Hz and 7040 Hz. When the frequency is nearby the cutoff frequency (3 KHz), the sound is attenuated according to the low-pass component of the filter. However, at 3520 Hz, there are still some signal components since, by definition, at the cutoff frequency the output drops below 70.7% of its input. For the 7040 Hz frequency, there is only noise and the audio signal is nearly zero. These results show the correct operation of the band-pass filter which is used to avoid temporal and spatial aliasing.

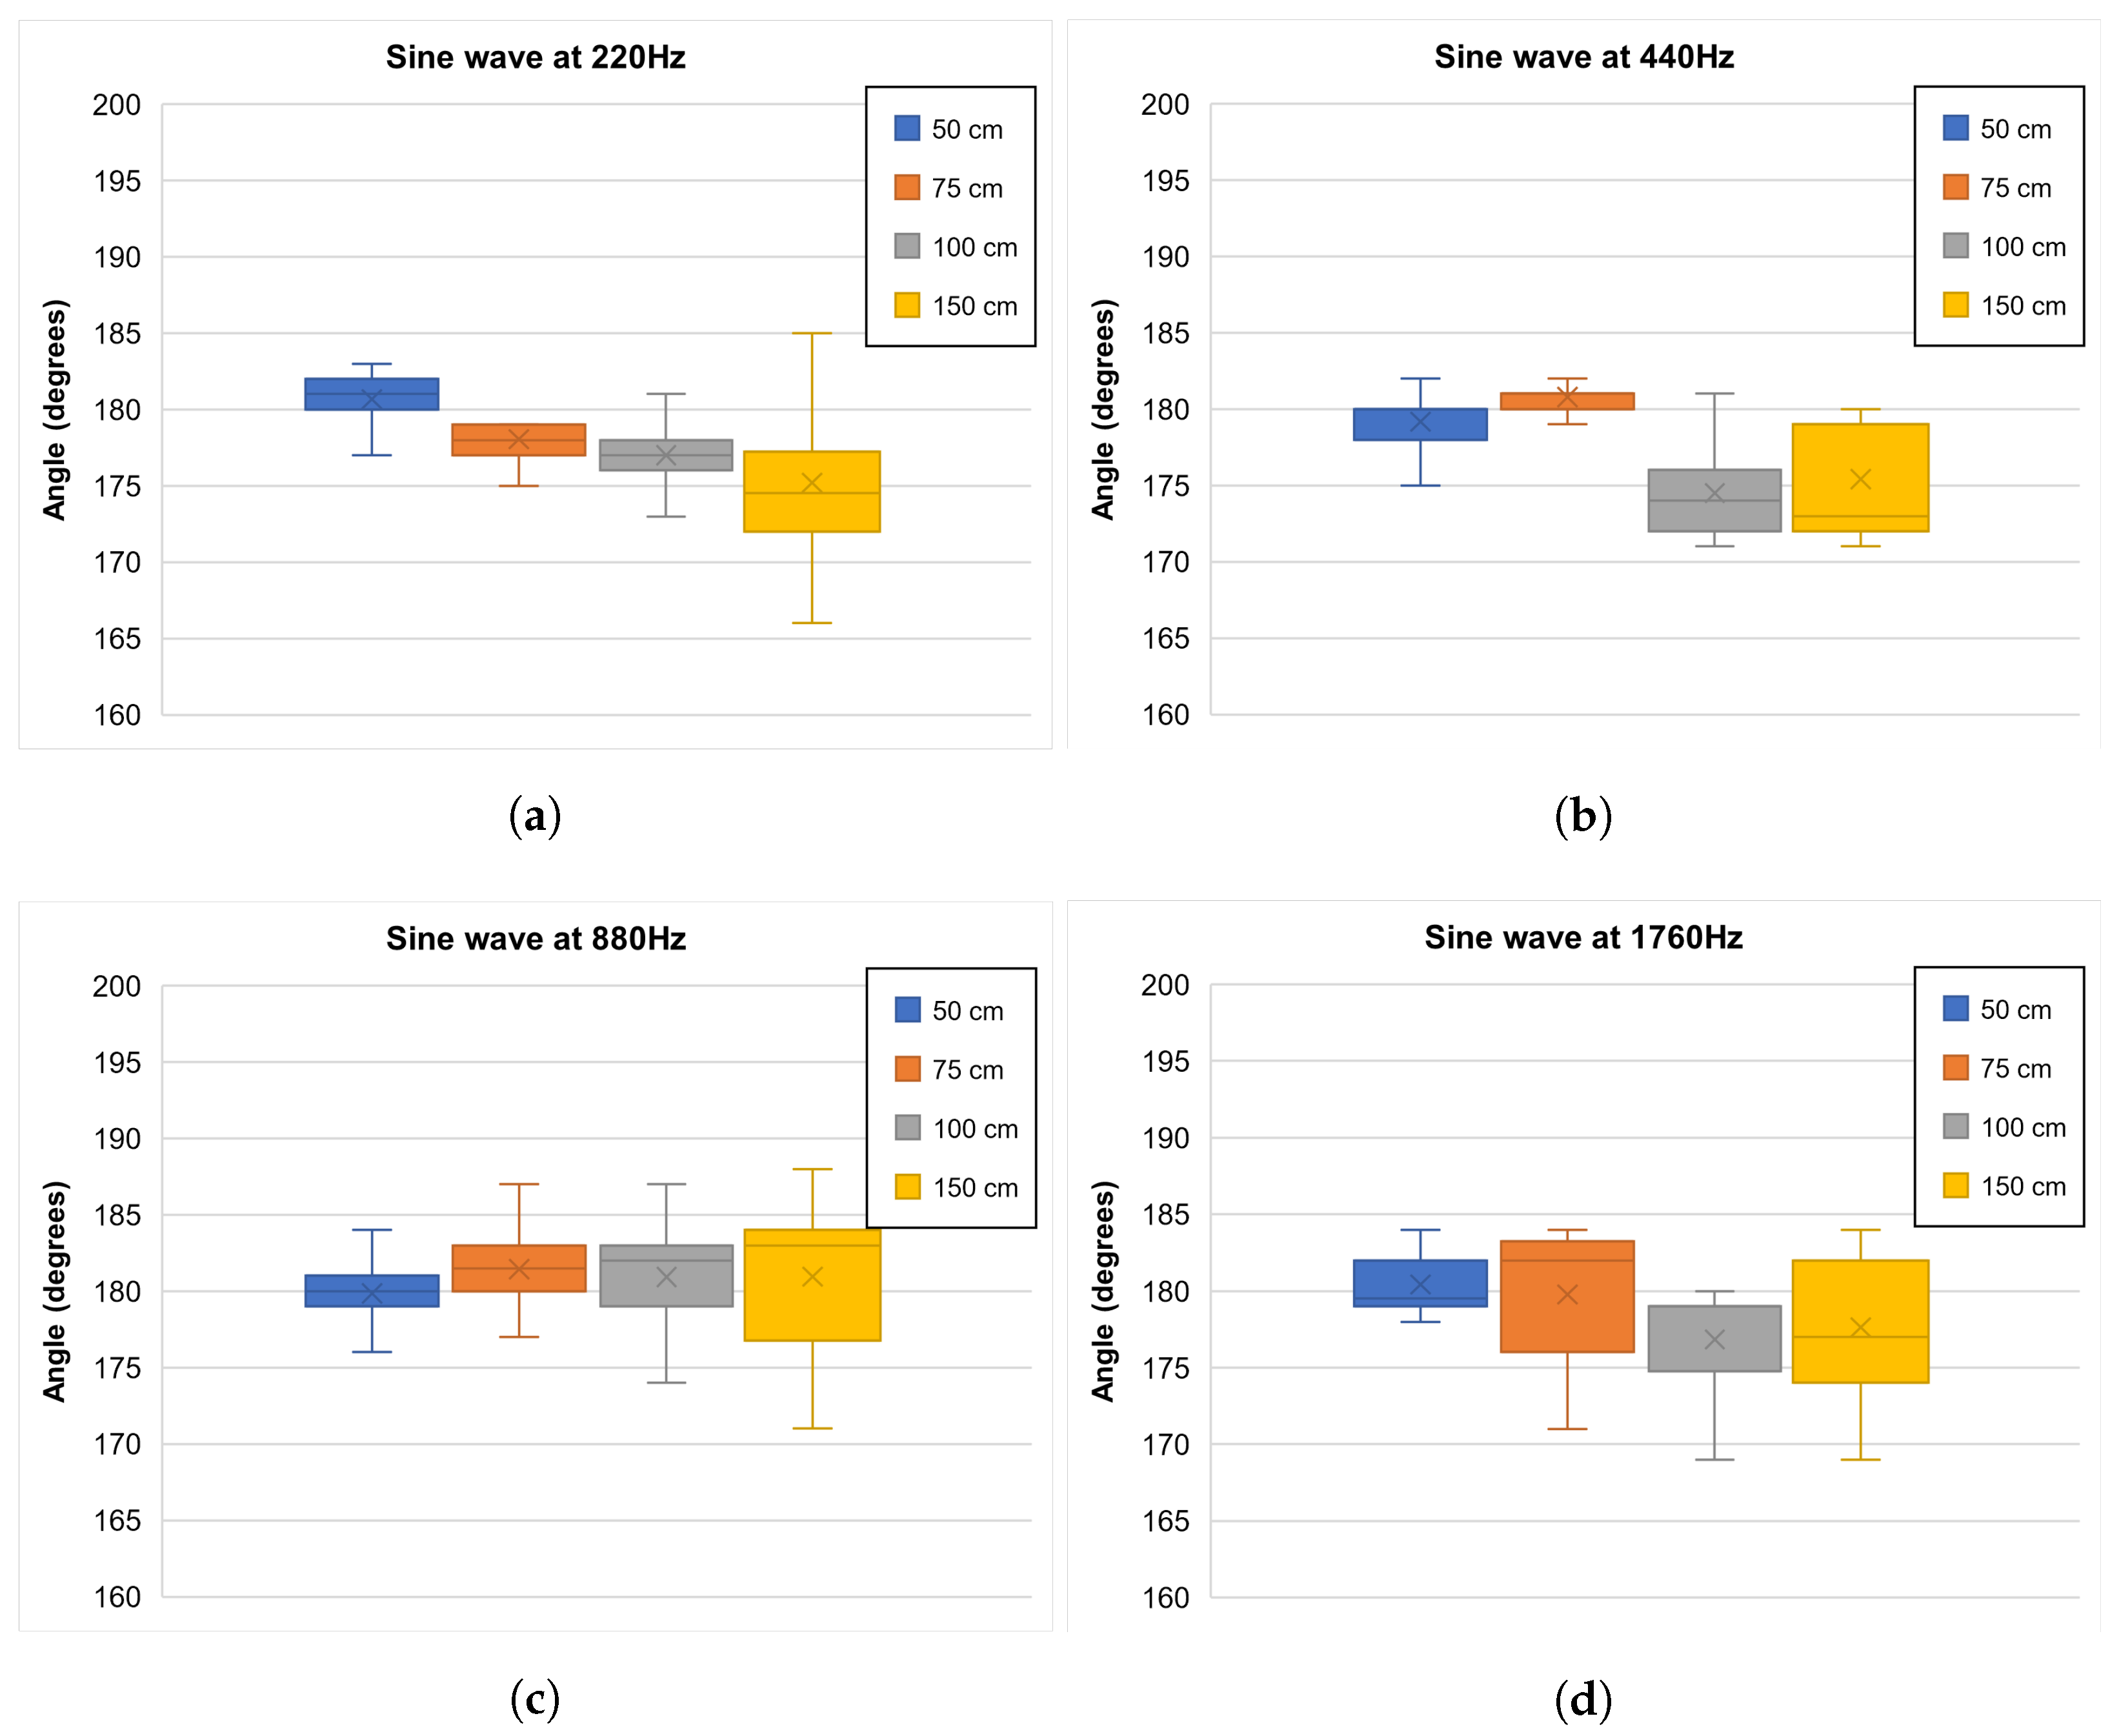
5.2. Sound Source Localization

To evaluate the localization process, which is the most important goal of this project, two different tests were executed: (1) a set of measurements to evaluate the sensor system accuracy in terms of DoA, and (2) a tracking test. The accuracy test was executed with a sound source at the 180º position using the controlled signal (sine wave) at different frequencies: 220 Hz, 440 Hz, 880 Hz, and 1760 Hz. For each frequency, a set of measurements was executed at different distances: 50 cm, 75 cm, 100 cm, and 150 cm. A total of 200 DoA measurements were acquired for each experiment. Figure 11 presents the box plots of the experiments. The results present a similar and high accuracy for all the frequencies tested. However, it is also possible to conclude that, with increasing distance, the precision is affected.
Table 1 presents the accuracy calculated in each experiment. Regarding the distance parameter, the accuracy is higher for smaller distances. When the test was performed at 50 cm, the accuracy reached at least 99.54%. At 880 Hz the system obtains the best overall results, as the accuracy reached values above 99.20% for all tested distances.
In the second evaluation, the system was tested with a moving sound source around the microphone array that followed the pattern shown in Figure 12a. The result presented in Figure 12b demonstrates with precision the location of the moving sound source. Because the algorithm needs 64 samples to localize the sound source and the sampling frequency is 8 kHz, after the first DoA calculation is performed, the following are always available with an 8 ms delay.

5.3. FPGA Hardware Resources

The FPGA implementation requires the resources described in Table 2. In terms of LookUp Table (LUT) and LUTRAM, the implementation uses 8.09% and 4.47% of the resources available in the platform, which corresponds to 18628 LUT and 4450 LUTRAM. From the available 21,725 Flip Flop (FF) units, the system uses a total of 21,725 FF, which corresponds to 4.71% of the available resources. The BRAM module is the most used resource, requiring a total of 191 BRAM units corresponding to 61.22% of the available BRAM in the platform. Due to the acquisition system that using the FIR and CIC blocks, the system requires 49 of the available 1728 Digital Signal Processor (DSP) units (2.84%). The hardware also requires 14 Input/Output (IO) pins, which corresponds to the seven microphone inputs, one output for the clock signal used to drive the microphones, and six outputs to control the LEDs PWM signal. Finally, to support the clock generator module, the system requires one of the eight available Mixed-Mode Clock Manager (MMCM) units, and five of the 544 existing Global Clock Buffer (BUFG) blocks.

6. Conclusions

This article presents a sensor system solution to monitor sound events in an SAV cabin. This solution is composed of a microphone array connected to a processing platform, which provides the localization of the sound sources to higher-level application through an ROS interface. Regarding the proposed solution and the tests performed, the implemented system is able to acquire data from all microphones, filter the collected signals, and calculate the DoA of one sound source with good accuracy results. Through individual ROS topics, the MicArray Node makes the acquired audio samples available to other high-level applications, in order to identify and classify the sound events. This way, it is possible to identify the type of event that occurs and act accordingly. Concerning the architecture, the system allows the deployment of independent hardware blocks for customization and acceleration purposes.
We believe that, with the growing interest in developing autonomous vehicles, passenger monitoring solutions like the one proposed in this article will surely contribute one step further towards the option of SAV. To the best of our knowledge, there are no audio-only solutions in the literature that are intended to monitor passengers inside an SAV. From a broader perspective, this solution, as a concept, can be integrated in other applications beyond SAV, where the localization of a sound source in a real-time approach is a major priority.

7. Future Work

Current work encompasses the exploration of more advanced and efficient algorithms to localize multiple sound sources, such as variable step-size least mean square. Since the individual data of each sound source are required, in a scenario where there are multiple and simultaneous sources, it becomes mandatory to use a sound source separation algorithm, such as independent component analyses with fast convergence. Moreover, an open issue related to the vehicle interior is noise, and no matter how acoustically isolated the vehicle is, the noise will always be present at different amplitudes. Thus, the next step is to use localization and separation algorithms with self-adapting resources that change the noise threshold, preserving the signal in the presence of noise. Furthermore, the sensor system also needs to be tested in a situation closed to the SAV reality, for example, inside a vehicle’s roof.

Author Contributions

Conceptualization, T.G. and S.P. (Sandro Pinto); formal analysis, C.L.; investigation, T.G., I.M., J.S., B.S., D.C., P.S., S.P. (Samuel Pereira) and A.S.; writing—original draft preparation, T.G., I.M.; writing—review and editing, I.M. and T.G.; supervision, T.G. and S.P. (Sandro Pinto); project administration, N.H., T.G. and S.P. (Sandro Pinto). All authors have read and agreed to the published version of the manuscript.

Funding

This work is supported by: European Structural and Investment Funds in the FEDER component, through the Operational Competitiveness and Internationalization Programme (COMPETE 2020) [Project nº 039334; Funding Reference: POCI-01-0247-FEDER-039334].

Conflicts of Interest

The authors declare no conflict of interest.

References

  1. Litman, T. Autonomous Vehicle Implementation Predictions; Victoria Transport Policy Institute: Victoria, BC, Canada, 2021. [Google Scholar]
  2. Roriz, R.; Cabral, J.; Gomes, T. Automotive LiDAR Technology: A Survey. IEEE Trans. Intell. Transp. Syst. 2021, 1–16. [Google Scholar] [CrossRef]
  3. Liu, L.; Chen, C.; Pei, Q.; Maharjan, S.; Zhang, Y. Vehicular edge computing and networking: A survey. Mob. Netw. Appl. 2021, 26, 1145–1168. [Google Scholar] [CrossRef]
  4. Daily, M.; Medasani, S.; Behringer, R.; Trivedi, M. Self-Driving Cars. Computer 2017, 50, 18–23. [Google Scholar] [CrossRef] [Green Version]
  5. Badue, C.; Guidolini, R.; Carneiro, R.V.; Azevedo, P.; Cardoso, V.B.; Forechi, A.; Jesus, L.; Berriel, R.; Paixão, T.M.; Mutz, F.; et al. Self-driving cars: A survey. Expert Syst. Appl. 2021, 165, 113816. [Google Scholar] [CrossRef]
  6. Rojas-Rueda, D.; Nieuwenhuijsen, M.J.; Khreis, H.; Frumkin, H. Autonomous vehicles and public health. Annu. Rev. Public Health 2020, 41, 329–345. [Google Scholar] [CrossRef] [Green Version]
  7. Jones, E.C.; Leibowicz, B.D. Contributions of shared autonomous vehicles to climate change mitigation. Transp. Res. Part D Transp. Environ. 2019, 72, 279–298. [Google Scholar] [CrossRef]
  8. Chaudhry, B.; El-Amine, S.; Shakshuki, E. Passenger safety in ride-sharing services. Procedia Comput. Sci. 2018, 130, 1044–1050. [Google Scholar] [CrossRef]
  9. Cartenì, A. The acceptability value of autonomous vehicles: A quantitative analysis of the willingness to pay for shared autonomous vehicles (SAVs) mobility services. Transp. Res. Interdiscip. Perspect. 2020, 8, 100224. [Google Scholar] [CrossRef]
  10. Paddeu, D.; Parkhurst, G.; Shergold, I. Passenger comfort and trust on first-time use of a shared autonomous shuttle vehicle. Transp. Res. Part C Emerg. Technol. 2020, 115, 102604. [Google Scholar] [CrossRef]
  11. Fouad, R.M.; Onsy, A.; Omer, O.A. Improvement of Driverless Cars’ Passengers on Board Health and Safety, using Low-Cost Real-Time Heart Rate Monitoring System. In Proceedings of the 2018 24th International Conference on Automation and Computing (ICAC), Newcastle upon Tyne, UK, 6–7 September 2018; pp. 1–6. [Google Scholar]
  12. Koojo, I.; Machuve, D.; Mirau, S.; Miyingo, S.P. Design of a Passenger Security and Safety System for the Kayoola EVs Bus. In Proceedings of the 2021 IEEE AFRICON, Arusha, Tanzania, 13–15 September 2021; pp. 1–6. [Google Scholar]
  13. Costa, M.; Oliveira, D.; Pinto, S.; Tavares, A. Detecting Driver’s Fatigue, Distraction and Activity Using a Non-Intrusive Ai-Based Monitoring System. J. Artif. Intell. Soft Comput. Res. 2019, 9, 247–266. [Google Scholar] [CrossRef] [Green Version]
  14. Chakravarty, P.; Mirzaei, S.; Tuytelaars, T.; Van hamme, H. Who’s Speaking? Audio-Supervised Classification of Active Speakers in Video. In Proceedings of the 2015 ACM on International Conference on Multimodal Interaction, ICMI ’15, Seattle, WA, USA, 9–13 November 2005; pp. 87–90. [Google Scholar] [CrossRef]
  15. Qian, R.; Hu, D.; Dinkel, H.; Wu, M.; Xu, N.; Lin, W. Multiple sound sources localization from coarse to fine. In Proceedings of the European Conference on Computer Vision, Glasgow, UK, 23–28 August 2020; pp. 292–308. [Google Scholar]
  16. Senocak, A.; Oh, T.H.; Kim, J.; Yang, M.H.; Kweon, I.S. Learning to localize sound source in visual scenes. In Proceedings of the IEEE Conference on Computer Vision and Pattern Recognition, Salt Lake City, UT, USA, 18–2 June 2018; pp. 4358–4366. [Google Scholar]
  17. Stachurski, J.; Netsch, L.; Cole, R. Sound source localization for video surveillance camera. In Proceedings of the 2013 10th IEEE International Conference on Advanced Video and Signal Based Surveillance, Krakow, Poland, 27–30 August 2013; pp. 93–98. [Google Scholar]
  18. Pieropan, A.; Salvi, G.; Pauwels, K.; Kjellström, H. Audio-visual classification and detection of human manipulation actions. In Proceedings of the 2014 IEEE/RSJ International Conference on Intelligent Robots and Systems, Chicago, IL, USA, 14–18 September 2014; pp. 3045–3052. [Google Scholar]
  19. Tamai, Y.; Kagami, S.; Amemiya, Y.; Sasaki, Y.; Mizoguchi, H.; Takano, T. Circular microphone array for robot’s audition. In Proceedings of the SENSORS, 2004 IEEE, Vienna, Austria, 24–27 October 2004; pp. 565–570. [Google Scholar]
  20. Grondin, F.; Michaud, F. Lightweight and optimized sound source localization and tracking methods for open and closed microphone array configurations. Robot. Auton. Syst. 2019, 113, 63–80. [Google Scholar] [CrossRef] [Green Version]
  21. Wakabayashi, M.; Okuno, H.G.; Kumon, M. Multiple sound source position estimation by drone audition based on data association between sound source localization and identification. IEEE Robot. Autom. Lett. 2020, 5, 782–789. [Google Scholar] [CrossRef]
  22. Hulsebos, E.; Schuurmans, T.; de Vries, D.; Boone, R. Circular Microphone Array for Discrete Multichannel Audio Recording. Audio Engineering Society Convention 114. Audio Engineering Society. March 2003. Available online: http://www.aes.org/e-lib/browse.cfm?elib=12596 (accessed on 4 January 2022).
  23. Subramanian, A.S.; Weng, C.; Watanabe, S.; Yu, M.; Yu, D. Deep learning based multi-source localization with source splitting and its effectiveness in multi-talker speech recognition. Comput. Speech Lang. 2022, 10, 101360. [Google Scholar] [CrossRef]
  24. Danès, P.; Bonnal, J. Information-theoretic detection of broadband sources in a coherent beamspace MUSIC scheme. In Proceedings of the 2010 IEEE/RSJ International Conference on Intelligent Robots and Systems, Taipei, Taiwan, 18–22 October 2010; pp. 1976–1981. [Google Scholar] [CrossRef]
  25. Pavlidi, D.; Puigt, M.; Griffin, A.; Mouchtaris, A. Real-time multiple sound source localization using a circular microphone array based on single-source confidence measures. In Proceedings of the 2012 IEEE International Conference on Acoustics, Speech and Signal Processing (ICASSP), Kyoto, Japan, 25–30 March 2012; pp. 2625–2628. [Google Scholar]
  26. Rafaely, B.; Peled, Y.; Agmon, M.; Khaykin, D.; Fisher, E. Spherical Microphone Array Beamforming; Springer: Berlin, Germany, 2010; pp. 281–305. [Google Scholar]
  27. Kurc, D.; Mach, V.; Orlovsky, K.; Khaddour, H. Sound source localization with DAS beamforming method using small number of microphones. In Proceedings of the 2013 36th International Conference on Telecommunications and Signal Processing (TSP), Rome, Italy, 2–4 July 2013; pp. 526–532. [Google Scholar] [CrossRef]
  28. Dehghan Firoozabadi, A.; Irarrazaval, P.; Adasme, P.; Zabala-Blanco, D.; Játiva, P.P.; Azurdia-Meza, C. 3D Multiple Sound Source Localization by Proposed T-Shaped Circular Distributed Microphone Arrays in Combination with GEVD and Adaptive GCC-PHAT/ML Algorithms. Sensors 2022, 22, 1011. [Google Scholar] [CrossRef]
  29. Busso, C.; Hernanz, S.; Chu, C.W.; Kwon, S.i.; Lee, S.; Georgiou, P.G.; Cohen, I.; Narayanan, S. Smart room: Participant and speaker localization and identification. In Proceedings of the (ICASSP’05), IEEE International Conference on Acoustics, Speech, and Signal Processing, Philadelphia, PA, USA, 23 March 2005; Volume 2, pp. ii/1117–ii/1120. [Google Scholar]
  30. Chen, X.; Shi, Y.; Jiang, W. Speaker tracking and identifying based on indoor localization system and microphone array. In Proceedings of the 21st International Conference on Advanced Information Networking and Applications Workshops (AINAW’07), Niagara Falls, ON, Canada, 21–23 May 2007; Volume 2, pp. 347–352. [Google Scholar]
  31. Murthi, M.; Rao, B. Minimum variance distortionless response (MVDR) modeling of voiced speech. In Proceedings of the 1997 IEEE International Conference on Acoustics, Speech, and Signal Processing, Munich, Germany, 21–24 April 1997; Volume 3, pp. 1687–1690. [Google Scholar] [CrossRef]
  32. Gupta, P.; Kar, S. MUSIC and improved MUSIC algorithm to estimate direction of arrival. In Proceedings of the 2015 International Conference on Communications and Signal Processing (ICCSP), Melmaruvathur, India, 2–4 April 2015; pp. 757–761. [Google Scholar] [CrossRef]
  33. Roy, R.; Kailath, T. ESPRIT-estimation of signal parameters via rotational invariance techniques. IEEE Trans. Acoust. Speech Signal Process. 1989, 37, 984–995. [Google Scholar] [CrossRef] [Green Version]
  34. Das, A. Real-Valued Sparse Bayesian Learning for Off-Grid Direction-of-Arrival (DOA) Estimation in Ocean Acoustics. IEEE J. Ocean. Eng. 2021, 46, 172–182. [Google Scholar] [CrossRef]
  35. He, D.; Chen, X.; Pei, L.; Zhu, F.; Jiang, L.; Yu, W. Multi-BS Spatial Spectrum Fusion for 2-D DOA Estimation and Localization Using UCA in Massive MIMO System. IEEE Trans. Instrum. Meas. 2021, 70, 1–13. [Google Scholar] [CrossRef]
  36. Yun, W.; Xiukun, L.; Zhimin, C. DOA Estimation of Wideband LFM Sources based on Narrowband Methods Integration Using Random Forest Regression. In Proceedings of the 2021 OES China Ocean Acoustics (COA), Harbin, China, 14–17 July 2021; pp. 816–820. [Google Scholar] [CrossRef]
  37. Jalal, B.; Yang, X.; Igambi, D.; Ul Hassan, T.; Ahmad, Z. Low complex direction of arrival estimation method based on adaptive filtering algorithm. J. Eng. 2019, 2019, 6214–6217. [Google Scholar] [CrossRef]
  38. Tiete, J.; Domínguez, F.; Silva, B.D.; Segers, L.; Steenhaut, K.; Touhafi, A. SoundCompass: A Distributed MEMS Microphone Array-Based Sensor for Sound Source Localization. Sensors 2014, 14, 1918–1949. [Google Scholar] [CrossRef] [Green Version]
  39. Hoshiba, K.; Washizaki, K.; Wakabayashi, M.; Ishiki, T.; Kumon, M.; Bando, Y.; Gabriel, D.; Nakadai, K.; Okuno, H.G. Design of UAV-Embedded Microphone Array System for Sound Source Localization in Outdoor Environments. Sensors 2017, 17, 2535. [Google Scholar] [CrossRef] [Green Version]
  40. He, W.; Motlicek, P.; Odobez, J.M. Deep Neural Networks for Multiple Speaker Detection and Localization. In Proceedings of the 2018 IEEE International Conference on Robotics and Automation (ICRA), Brisbane, Australia, 21–25 May 2018; pp. 74–79. [Google Scholar] [CrossRef] [Green Version]
  41. Purwins, H.; Li, B.; Virtanen, T.; Schlüter, J.; Chang, S.Y.; Sainath, T. Deep Learning for Audio Signal Processing. IEEE J. Sel. Top. Signal Process. 2019, 13, 206–219. [Google Scholar] [CrossRef] [Green Version]
  42. Xu, W.; Jia, M.; Gao, S.; Li, L. Multiple Sound Source Separation by Using DOA Estimation and ICA. In Proceedings of the 2021 4th International Conference on Information Communication and Signal Processing (ICICSP), Shanghai, China, 24–26 September 2021; pp. 249–253. [Google Scholar] [CrossRef]
  43. Li, H.; Chen, K.; Wang, L.; Liu, J.; Wan, B.; Zhou, B. Sound Source Separation Mechanisms of Different Deep Networks Explained from the Perspective of Auditory Perception. Appl. Sci. 2022, 12, 832. [Google Scholar] [CrossRef]
  44. Butt, U.M.; Khan, S.A.; Ullah, A.; Khaliq, A.; Reviriego, P.; Zahir, A. Towards Low Latency and Resource-Efficient FPGA Implementations of the MUSIC Algorithm for Direction of Arrival Estimation. IEEE Trans. Circuits Syst. I Regul. Pap. 2021, 68, 3351–3362. [Google Scholar] [CrossRef]
  45. Da Silva, B.; Braeken, A.; Touhafi, A. FPGA-based architectures for acoustic beamforming with microphone arrays: Trends, challenges and research opportunities. Computers 2018, 7, 41. [Google Scholar] [CrossRef] [Green Version]
  46. Jung, Y.; Jeon, H.; Lee, S.; Jung, Y. Scalable ESPRIT Processor for Direction-of-Arrival Estimation of Frequency Modulated Continuous Wave Radar. Electronics 2021, 10, 695. [Google Scholar] [CrossRef]
  47. Nsalo Kong, D.F.; Shen, C.; Tian, C.; Zhang, K. A New Low-Cost Acoustic Beamforming Architecture for Real-Time Marine Sensing: Evaluation and Design. J. Mar. Sci. Eng. 2021, 9, 868. [Google Scholar] [CrossRef]
  48. Ribeiro, Â.; Rodrigues, C.; Marques, I.; Monteiro, J.; Cabral, J.; Gomes, T. Deploying a Real-Time Operating System on a Reconfigurable Internet of Things End-device. In Proceedings of the IECON 2019-45th Annual Conference of the IEEE Industrial Electronics Society, Lisbon, Portugal, 14–17 October 2019; Volume 1, pp. 2946–2951. [Google Scholar]
  49. Marques, I.; Rodrigues, C.; Tavares, A.; Pinto, S.; Gomes, T. Lock-V: A heterogeneous fault tolerance architecture based on Arm and RISC-V. Microelectron. Reliab. 2021, 120, 114120. [Google Scholar] [CrossRef]
  50. Brandstein, M.; Ward, D.; Lacroix, A.; Venetsanopoulos, A. (Eds.) Microphone Arrays: Signal Processing Techniques and Applications, 1st ed.; Digital Signal Processing; Springer: Berlin/Heidelberg, Germany, 2001. [Google Scholar]
  51. InvenSense. Wide Dynamic Range Microphone with PDM Digital Output Data Sheet ADMP62. In DS-INMP621-00 Datasheet Rev 1.3; InvenSense Inc.: San Jose, CA, USA, 2016. [Google Scholar]
  52. InvenSense. Bottom Port PDM Digital Output Multi-Mode Microphone. In ICS-51360 Datasheet Rev 1.0; InvenSense Inc.: San Jose, CA, USA, 2016. [Google Scholar]
  53. Knowles. Digital SiSonic Microphone With Multiple Performance Modes. In Datasheet SPK0641HT4H-1 Rev A; Knowles Electronics, LLC: Itasca, IL, USA, 2016. [Google Scholar]
  54. Hegde, N. Seamlessly interfacing MEMs microphones with blackfin processors. In EE-350 Engineer-to-Engineer Note; Analog Devices, Inc.: Norwood, MA, USA, 2010. [Google Scholar]
  55. Re, D.E.; O’Connor, J.J.; Bennett, P.J.; Feinberg, D.R. Preferences for very low and very high voice pitch in humans. PLoS ONE 2012, 7, e32719. [Google Scholar] [CrossRef] [Green Version]
  56. Martins, J.; Tavares, A.; Solieri, M.; Bertogna, M.; Pinto, S. Bao: A lightweight static partitioning hypervisor for modern multi-core embedded systems. In Proceedings of the Workshop on Next Generation Real-Time Embedded Systems (NG-RES 2020), Bologna, Italy, 21 January 2020. [Google Scholar]
Figure 1. Sensor system architecture.
Electronics 11 00766 g001
Figure 2. ROS architecture/interface between the sound source localization and separation system and the characterization algorithm.
Electronics 11 00766 g002
Figure 3. Three-dimensional (3D) view of the PCB microphone array with the microphone position (numbered 1 to 7). (a) Top-view. (b) Bottom-view.
Electronics 11 00766 g003
Figure 4. Data acquisition system with the PDM to PCM converter.
Electronics 11 00766 g004
Figure 5. Block diagram of the conversion of PDM to PCM signal.
Electronics 11 00766 g005
Figure 6. Block diagram of the energy sound source localization algorithm.
Electronics 11 00766 g006
Figure 7. System software stack.
Electronics 11 00766 g007
Figure 8. Sensor system prototype to localize and identify sound sources in an SAV and location of each microphone in the PCB to calculate the DoA. (a) Sensor system prototype. (b) Microphone’s location on a XY referential.
Electronics 11 00766 g008
Figure 9. Data acquisition by the three types of microphones at different frequencies. (a) Sine wave at 220 Hz. (b) Sine wave at 440 Hz. (c) Sine wave at 880 Hz. (d) Sine wave at 1760 Hz.
Electronics 11 00766 g009
Figure 10. Sine wave acquisition for frequencies above the filter’s passband. (a) Sine wave at 3520 Hz. (b) Sine wave at 7040 Hz.
Electronics 11 00766 g010
Figure 11. Box plot of the DoA measurements at different frequencies and distances. (a) Sine wave at 220 Hz. (b) Sine wave at 440 Hz. (c) Sine wave at 880 Hz. (d) Sine wave at 1760 Hz.
Electronics 11 00766 g011
Figure 12. Moving sound pattern and respective calculated DoA. (a) Sound source path. (b) Direction of arrival of a sound source over the time.
Electronics 11 00766 g012
Table 1. DoA accuracy at different frequencies and distances.
Sound Source Distance
50 cm75 cm100 cm150 cm
Sine
Wave
Frequency
220 Hz99.62%98.92%98.33%97.33%
440 Hz99.54%99.56%96.94%97.45%
880 Hz99.92%99.20%99.48%99.46%
1760 Hz99.76%99.86%98.24%98.67%
Table 2. FPGA resources utilization.
ResourceUtilizationAvailableUtilization (%)
LUT18,628230,4008.09%
LUTRAM4550101,7604.47%
FF21,725460,8004.71%
BRAM19131261.22%
DSP4917282.84%
IO143603.89%
BUFG55440.92%
MMCM1812.50%
Publisher’s Note: MDPI stays neutral with regard to jurisdictional claims in published maps and institutional affiliations.

