Article

A Novel Strategy for Monitoring a PV Junction Box Based on LoRa in a 3 kW Residential PV System

Department of Electrical Engineering, Pusan National University, Pusan 46241, Korea
*
Authors to whom correspondence should be addressed.
Electronics 2022, 11(5), 709; https://doi.org/10.3390/electronics11050709
Submission received: 27 January 2022 / Revised: 24 February 2022 / Accepted: 24 February 2022 / Published: 25 February 2022
(This article belongs to the Special Issue IoT Applications for Renewable Energy Management and Control)

Abstract

:
Recently, 3 kW residential PV (Photovoltaic) junction boxes have mainly been installed on the roof or outer wall of building. Wired and wireless monitoring systems are being implemented by RS-485 and WIFI/IoT. However, conventional monitoring systems have a communication limitation according to the distance and environment. It cannot receive any information when a failure of the PV junction box occurs. Therefore, there is a need for a strategy to determine whether the fuse and diode in the PV junction box are faulty through voltage and current sensors. In this paper, we propose a novel strategy for monitoring PV junction boxes, based on LoRa (Long Range). The TTGO LoRa32 V2.0 module with LoRa and various input and output ports is utilized. The wireless TX module transmits various data collected from the PV junction box to the RX module in real time. In addition, the RX module displays the received data on an LCD (Liquid Crystal Display) screen so that the user can intuitively identify it, and the data is recorded on the internal storage device or database in the web server. The manufactured PV junction box monitoring system was tested under a 3 kW PV system. Additionally, communication reception has stable signal intensity overall, both indoors and outdoors. In particular, it shows excellent characteristics in maintaining RSSI (Received Signal Strength Indicator) > −99 dBm and PER (Packet Error Rate) < 2.7%, up to a radius of 200 m, even in NLOS (Non Line-Of-Sight) environments. Although some packet loss occurred, it was confirmed that invisible communication was possible up to 300 m.

1. Introduction

The South Korean government has been implementing the ’Renewable Energy 3020′ policy since 2017 to lower the average temperature of the Earth, which is rising amid global climate change, and to reduce greenhouse gas emissions [1,2]. The plan is to increase the proportion of power generation from renewable energy with low carbon emissions to 20% by 2030, of which PV power generation accounts for 57% (36.5 GW) [3]. Solar power supply facilities in various forms are expected to increase in the future, and a remote monitoring system for each system is being operated for the seamless control and management of these power generation facilities [4,5].
There are many benefits that can be achieved with a PV monitoring system. The PV monitoring system is most suitable for the smart grid, which promotes the use of alternative energy by exchanging real-time information in both directions to increase the efficiency of transmission and distribution. It is possible to verify real-time PV generation facilities using communication technology and to build an efficient management system [6]. In addition, it is able to predict the failure of PV arrays with PCS (power conversion system) and to prepare for performance degradation due to deterioration. Because the high-quality human resources can be reduced by various monitoring technology, it can be performed in parallel with other tasks. A common PV monitoring technique stores several data, such as power, energy, voltage, current, module temperature and horizontal and vertical insolation, in the local monitoring server of the power plant from the inverter [7]. The local server of each power plant in various regions transmits the accumulated data to the integrated monitoring server. The integrated monitoring server stores data sent from each local server and provides data information as a web service so that data can be monitored on a web page. Additionally, the collected data is analyzed to predict the amount of power generated or used for failure analysis.
Until now, most monitoring systems have been studied for the purpose of determining fault diagnosis, based on data from PCS [8]. In the PV system configuration, continuous monitoring was performed by focusing on the power conversion device. On the other hand, additional monitoring of the PV array output and PV junction box composed of diodes and fuses, has not been performed for a long time [9]. In a PV system, the PV array generates a lower voltage compared to the DC-link and grid voltages. However, due to continuous surge voltage, inrush current and the heat generated by the high current inside the junction box, fuse blowout and failure of the diode to prevent reverse current occurs frequently [10]. For those reasons, continuous monitoring is also required for the PV junction box. This causes the power supplied from the PV array to the inverter to be cut off. The PV system cannot produce power as much as the design capacity. Moreover, in the case of a PV generation facility, to which a large inverter is applied, an individual failure of a PV module is able to cause very large losses in the entire system [11]. For this reason, PV junction boxes require continuous monitoring for stable power production.
In the case of the residential PV system, it is difficult to directly check power generation information because these systems are mainly installed on the roof and exterior walls [12]. This problem is being solved by using a small monitoring system that does not require additional operational personnel, equipment and space [13,14]. In general, The PV monitoring system sustainably provides real-time data and status information about PV modules and PCSs [15,16,17]. In the case of wired transmission, Modbus TCP (Transmission Control Protocol) and OPC (OLE for Process Control) is an open protocol. This means manufacturers can integrate it into their equipment for free. It has become an industry standard communication protocol and is now the most common means of connecting industrial electronic devices. It is widely used by many manufacturers in various industries. When RS-485 serial communication based on Modbus TCP and OPC is used in a monitoring system, the communication distance is usually up to about 1 km. Nevertheless, there are inconveniences due to wired installation work and it is difficult to change the installation location [18]. Thereby, wireless communication, such as WIFI/IoT, is being expanded rapidly. In addition to this, PV generation data can be received anywhere in the world where the Internet is available, with simple installation and connection [19]. However, if the WIFI/IoT communication environment is not in place, it is difficult to use the service, and WIFI/IoT maintenance costs frequently occur [20].
Recently, with the development of IoT (Internet of Things) technology, PV monitoring technology using short-range wireless communication technology has been developed. There are representative communication platforms include WIFI, Bluetooth, Zigbee, SigFox and LoRa [21]. While Bluetooth and WIFI have a high data transfer rate of up to 2 Mbps, both radio coverages can reach up to only 10 m indoors and 50 m outdoors [22]. Compared to both platforms, ZigBee has a relatively high data transfer rate (20–250 kbps) and a radio coverage of less than 100 m [23]. Thus, a ZigBee is applied to various monitoring systems. However, when there is an obstacle, such as a thick wall, the communication coverage becomes very short. SigFox has a very long communication distance of up to 13 km under LOS (line of sight) communication, and the low module price is a merit [24]. On the contrary, since it has a very low data transfer rate of less than 100 bps, there are restrictions in monitoring the PV junction box in the case of a large-scale PV system or a large amount of processed data. LoRa is a representative technology of low-power long-distance communication and provides a very wide communication range with low power [25,26,27,28]. In an open area, LoRa gives a wide coverage of over 10 km in perfect conditions and consumes 10 mW at most [29]. It also has a data transmission rate of up to 10 kbps [30]. Unlike WIFI or Bluetooth, which only support short distance communication, two LoRa devices with a proper antenna are able to communicate data over a long distance. Since the data transmission speed is not fast compared with other communication systems, it is difficult to transmit video and image data in real time, but there is no problem in transmitting text data only [31]. In Korea, the frequency band of LoRa communication is 915 MHz and has an unlicensed band [32]. For this reason, it is used for commercial purposes, such as wide-area IoT services, and even business operators are able to stay in business [33]. This enables long-distance, low-power wireless network monitoring without charging additional costs. A monitoring system consisting of LoRa communication and subsystems could be an innovative development strategy for building micro-networks in residential and commercial buildings. It is useful for providing and managing a monitoring system in order to implement microgrids, such as power quality improvement, reliability improvement and energy loss minimization [34,35]. Similarly, the monitoring system for load scheduling for houses and buildings has been applied to minimize power consumption and costs. Overall, there is a trend towards strengthening the construction of smart homes, including improving the energy efficiency of houses and disseminating monitoring [36].
In this paper, we propose a novel strategy for monitoring PV junction boxes based on LoRa in a 3 kW residential PV system. According to the proposed design and fabrication, it is possible to continuously monitor the status of the PV junction box from a long distance and to recognize the fault condition quickly. We demonstrated performance tests on the prototype in various environments and obtained remarkable results. Thus, a PV junction box monitoring system based on LoRa is regarded as a very useful IoT application. The conventional PV junction box design in a PV system is reviewed in Section 2. The proposed PV junction box monitoring system is presented in Section 3. Section 4 presents the TX/RX module design and fabrication. Section 5 shows the experimental setup. The results and discussion are presented in Section 6. Finally, the conclusion is given in Section 7.

2. Conventional PV Junction Box Design

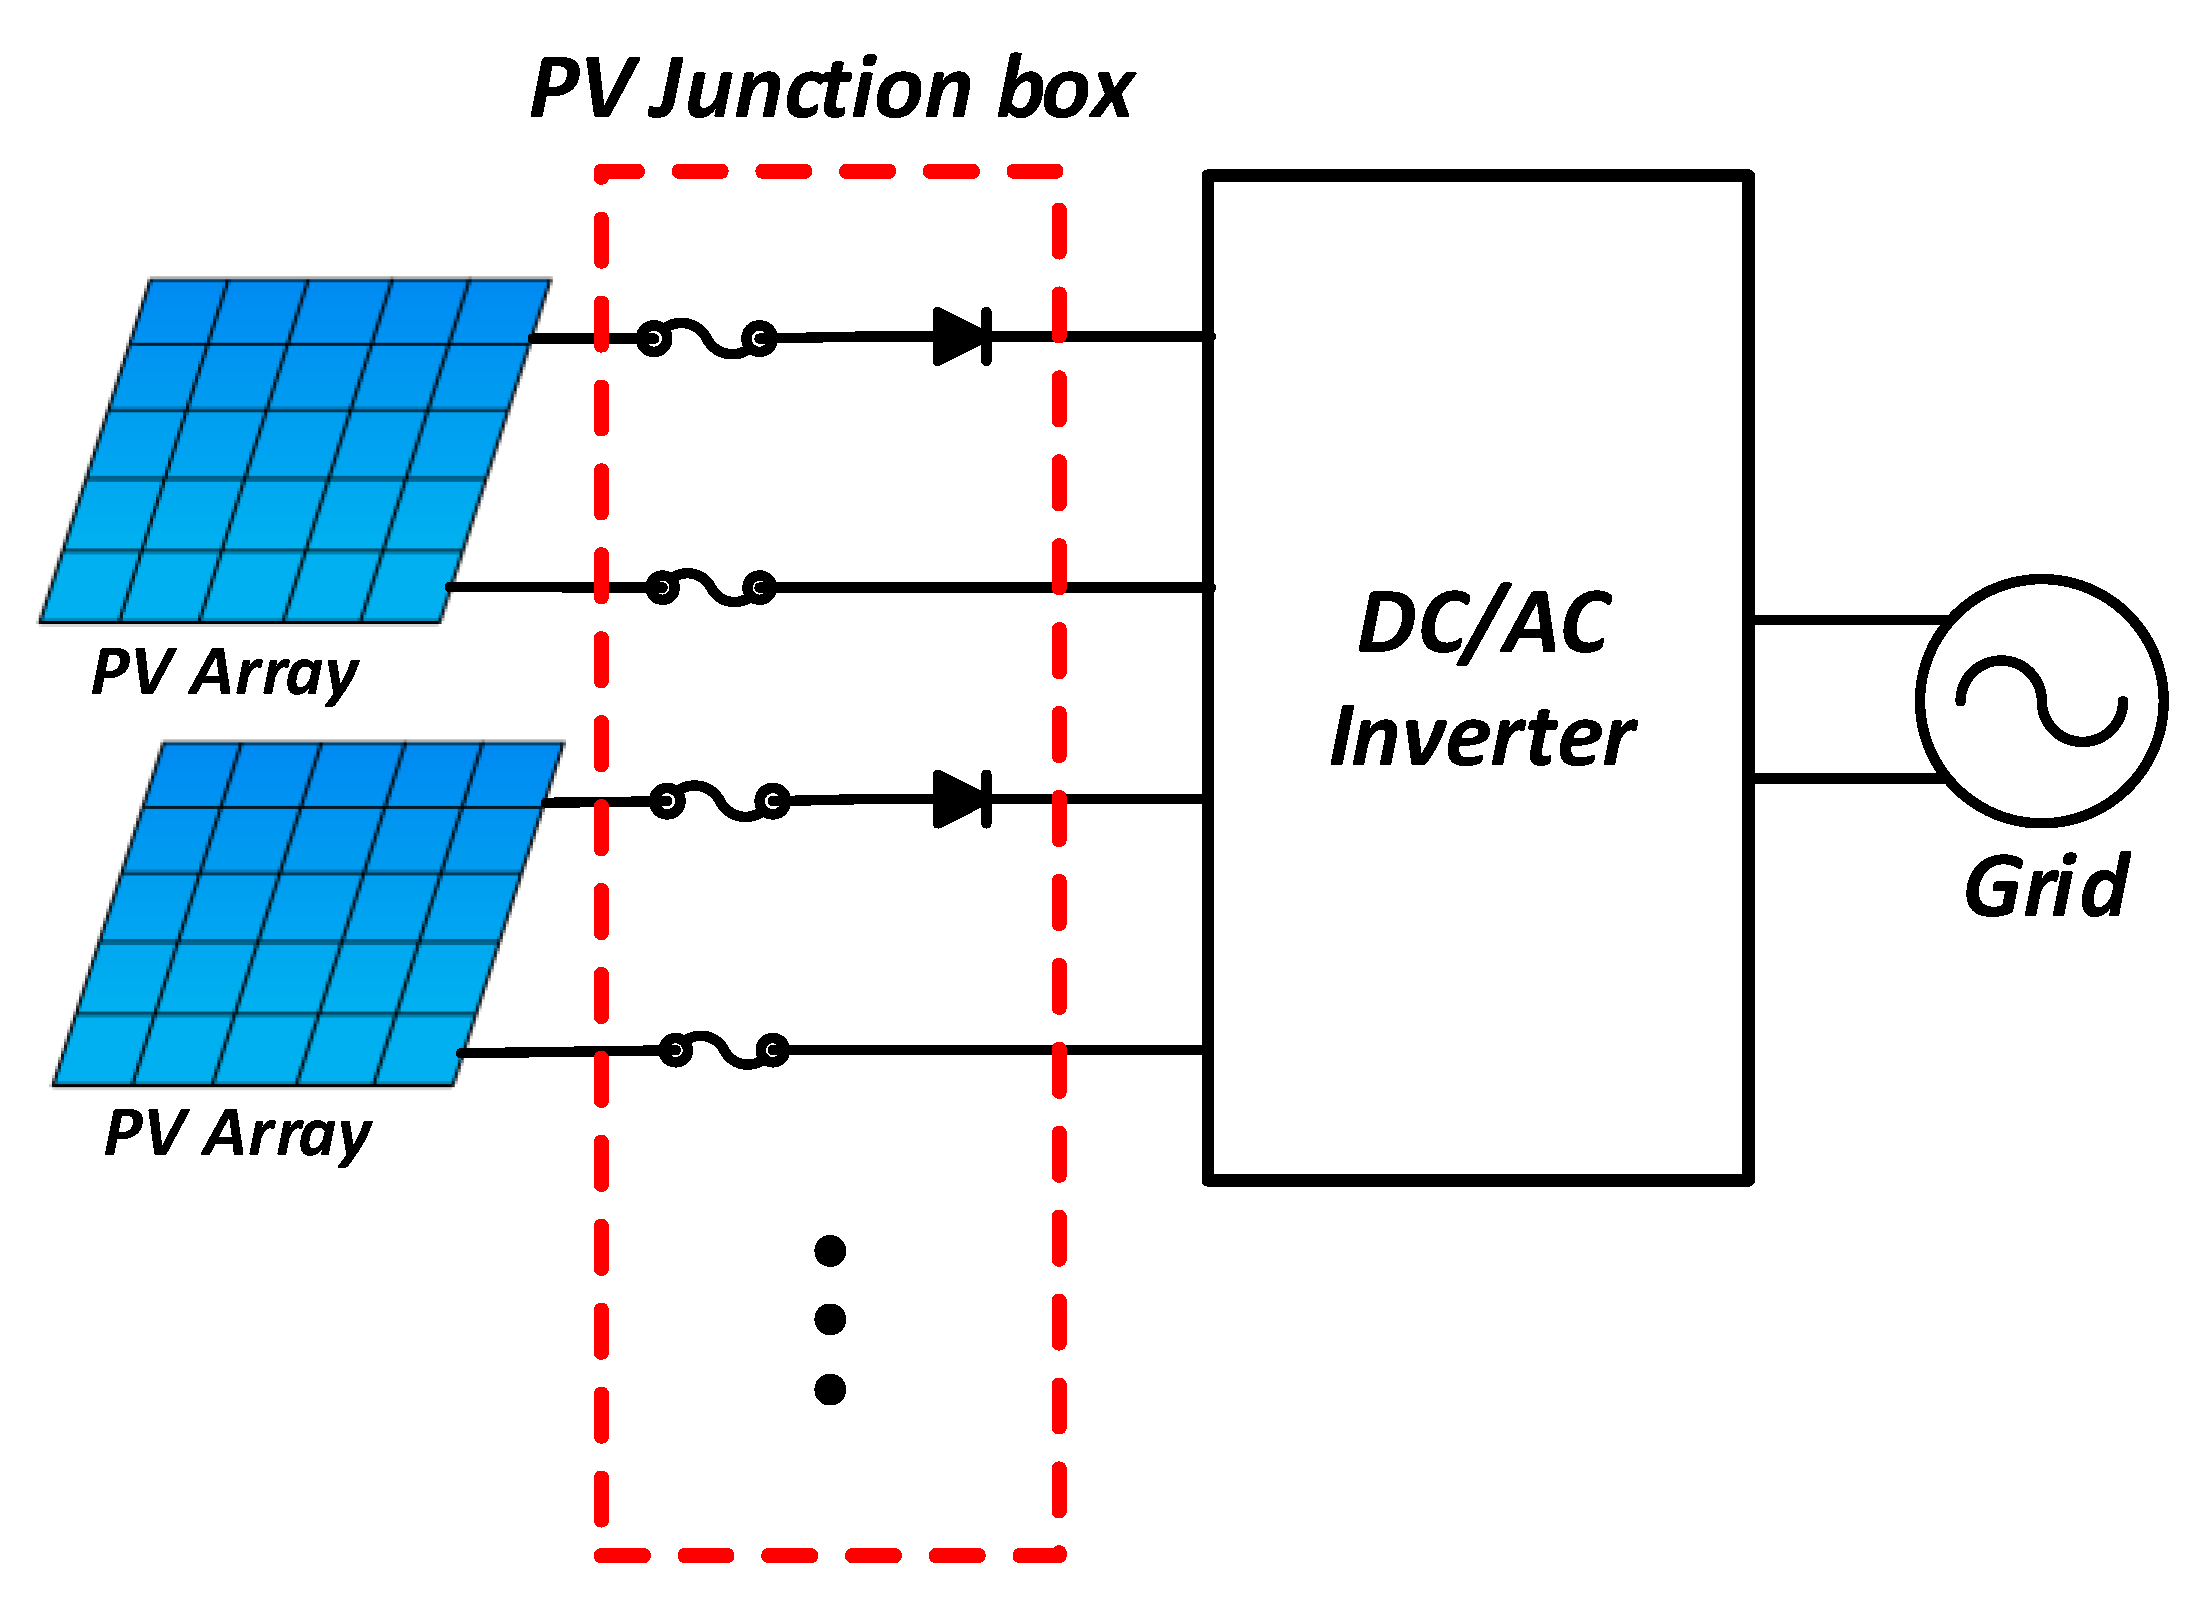
In PV systems used for a variety of purposes worldwide, PV arrays are configured in single or multiple forms in parallel. A voltage imbalance caused by this configuration occurs when a non-constant amount of light is incident on each PV array, making a loss in power generation. In addition, the induced overcurrent in the PV array or inverter is able to damage the entire PV array. To avoid this problem, PV arrays are configured in parallel according to the appropriate capacity. A PV junction box usually consists of two input fuses and a diode. The input fuses protect the DC/AC inverter from the high inrush current generated from the PV array and also break the high current induced from the DC/AC inverter to the PV array. A diode is mounted at the rear of the fuses and is used to block the high voltage induced by the DC/AC inverter, or to cut off the circulating current due to voltage imbalance. Figure 1 shows the design of the PV junction box applied to a general PV system.
Most PV systems are designed to operate for more than 10 years. However, since the PV system is mainly operated during the daytime, direct sunlight or heat from the power device causes the failure of the PV panel and the power conversion system (PCS). Consequently, protective and alarm functions are applied to these major devices to prevent breakdown. Moreover, it is equipped with a monitoring system to check the PCS status in real time. It would help to stably operate the PV system. On the other hand, the PV junction box is an important instrument that transmits power from the PV array to the inverter. When a high current flows into the PV junction box, the diode temperature rises significantly. Therefore, a type of diode having a large allowable current or a low threshold voltage is used to cope with a high current. In addition, a heat sink is mounted to lower the diode temperature. Nevertheless, the temperature inside the PV junction box maintains a high value, and if this state continues for a long time, diodes have an insulation breakdown due to deterioration. Due to the diode failure, the PV array cannot transmit power and the total power generation is reduced. For this reason, the PV junction box is required to monitor various indicators.
There are several merits to continuously monitoring a PV junction box. When a problem occurs for the first time, the monitoring system collects reasonable data. Sometimes it detects the intrinsic problem in spite of the adverse effect. When handling or managing the PV system, users can receive the PV junction box status in real time. Due to these advantages, various problems occurring in the PV junction box can be quickly solved.

3. Proposed PV Junction Box Monitoring System

3.1. Concept of PV Junction Box Monitoring System

The proposed PV junction box monitoring system consists of two parts (TX/RX modules). The TX module collects various data produced in the PV junction box, converts it into a digital signal, and transmits it through the antenna. In contrast, the RX module reads the received data, displays it on the user screen, and stores it in the database. In addition, real-time remote monitoring can be implemented in a WIFI-available background.

3.1.1. Configuration of TX Module

The conventional PV junction box is composed of a fuse that suppresses a high inrush current, and a diode preventing reverse current caused by voltage imbalance. In order to monitor the PV junction box, it is necessary to collect several data that can be helpful to users. The input of the PV junction box is generally connected to the PV array and the output is connected to a PCS or inverter. The voltage and current input from the PV array are output through a fuse and a diode. Besides this, the condition of the fuse and diode can be checked by measuring the voltage and current. Whether the fuse and diode conditions can be monitored, depends on the measured voltage and current. If the voltage sensor is between the fuse and the diode, the measurement system can monitor both conditions without multiple sensors. When only the fuse has some trouble, no voltage or 0 V is measured. On the other hand, when the diode doesn’t work properly, the PV array voltage is measured normally, but the PV current is not measured at the diode. This method is effective in case of the breakdown of the fuse and diode. Figure 2 shows the configuration of the TX module in our proposed PV junction box.
The various semiconductor components are fairly sensitive to temperature and humidity. In particular, the inside of the PV junction box is narrow and generally there is no cooling device, so it is vulnerable to temperature and humidity. Therefore, it is necessary to continuously monitor the temperature and humidity inside the PV junction box. Since the PV junction box is mainly installed on the PV array support or the outer wall, we don’t need to consider the internal temperature rise due to direct sunlight.
An appropriate power source is required to operate the PV junction box monitoring system. There are two options: either the PV power is supplied from the PV array, or from commercial power on the grid side. The PV junction box monitoring system does not have to be running all the time, as the PV system is only operated during the day. Commercial power is less efficient than PV power. Therefore, PV power is proposed as the main power source of the TX module. A DC-DC converter that can withstand the high voltage of the PV array and respond to a large pulsating voltage is applied. Since the DC-DC converter operates only when sufficient PV power is supplied, the operating time of the PV system can be calculated. The power supplied through the DC-DC converter activates the main control board (ESP32 & LoRa Module) and each sensor. In the main control board, the ESP32 module converts the analog signal obtained from each sensor into a digital signal and performs the entire operation sequence. The various data collected from the advanced PV junction box are as follows:
  • PV array voltage and current
  • PV array power and energy
  • Temperature and humidity in PV junction box
  • PV inverter operation time
  • The operation condition of the fuse and diode
The LoRa module converts digitized information into packets for LoRa communication and transmits it to the RX module (user interface) through the antenna. The TX module that covers 868/915 MHz frequency band performs data transmission at 0.5 s intervals.

3.1.2. Configuration of the RX Module

The RX module serves to provide visual information to the user by processing the PV junction box data received from the TX module. To visualize these data, an LCD screen and related devices are required. In addition, since the PV junction box needs to check all previous states through continuous monitoring, it is necessary to store the collected data in the database. Sometimes it is located in an area where the administrator or user cannot monitor the PV junction box. In this case, a network system must be in place to monitor the PV junction box. Accessing the WLAN (Wireless LAN) using WIFI is one of the most effective means of solving this problem. Therefore, the user or manager is able to monitor the PV junction box anywhere, at any time. Figure 3 shows the configuration of the RX module for monitoring the PV junction box.

3.2. Operation Algorithm of PV Junction Box Monitoring System

In order to monitor the status of the PV junction box, an appropriate operation algorithm is required for each TX/RX module. Figure 4 presents a flow chart of the proposed operation algorithm in the PV junction box monitoring system. When the power source generated from the PV array turns on the RX module, all parameter values are initialized to default values. Then, the analog signals created from the voltage and current sensors are output as digital signals by the A/D converter (ADC). The most common problem is DC output errors occasioned by noise signals. To suppress high-frequency noise, the digital low pass filter (DLPF) without extra analog circuit was adopted. Equation (1) shows the first-order DLPF. PV array voltage and current have a wide range of potential change depending on the intensity of the sunlight. Accordingly, a very low cut-off frequency causes a high phase lagging, making it difficult to accurately measure the voltage and current of the PV array. On the other hand, a high cut-off frequency cannot properly remove high-frequency noise from voltage and current sensors. Since each sensor has different characteristics of such high-frequency noise, the optimal cut-off frequency was derived through several processes. Considering the increase of the lagging phase, the sampling frequency was set to 2 kHz and the cut-off frequency to 60 Hz.
y n = f s f s + 2 π f c y n 1 + 2 π f c f s + 2 π f c x n
where f s is the sampling frequency and f c is the cutoff frequency.
The designed DLPF removes the high-frequency noise included in the initial voltage and current level. The filtered voltage and current values are used to determine fuse and diode failure conditions. If the voltage level is 0 V and the current level is 0 A, the fuse is recognized as a fault condition. Otherwise, if the measured voltage level is equal to the open circuit voltage of the PV array and the current level is 0 A, it can be determined that the fault condition is a diode failure. In the two cases above, an inverter shutdown can be expected due to a problem in the PV junction box. When the voltage and current levels are implemented within a defined range, it is verified that the inverter operates normally. Each information is combined with data collected from other sensors and transmitted to the RX module. If the power is supplied indefinitely, the TX module operation algorithm is continuously repeated.
The RX module is turned on from the built-in battery or an external power source. All parameters are initialized and the LoRa signal is scanned by a 915 MHz antenna. When a packet including the PV junction box information is received, it is classified into each parameter and displayed on the LCD screen. Additionally, all parameters are constantly saved on the SD card of the RX module and accumulated to the web server.

4. TX/RX Module Design and Fabrication

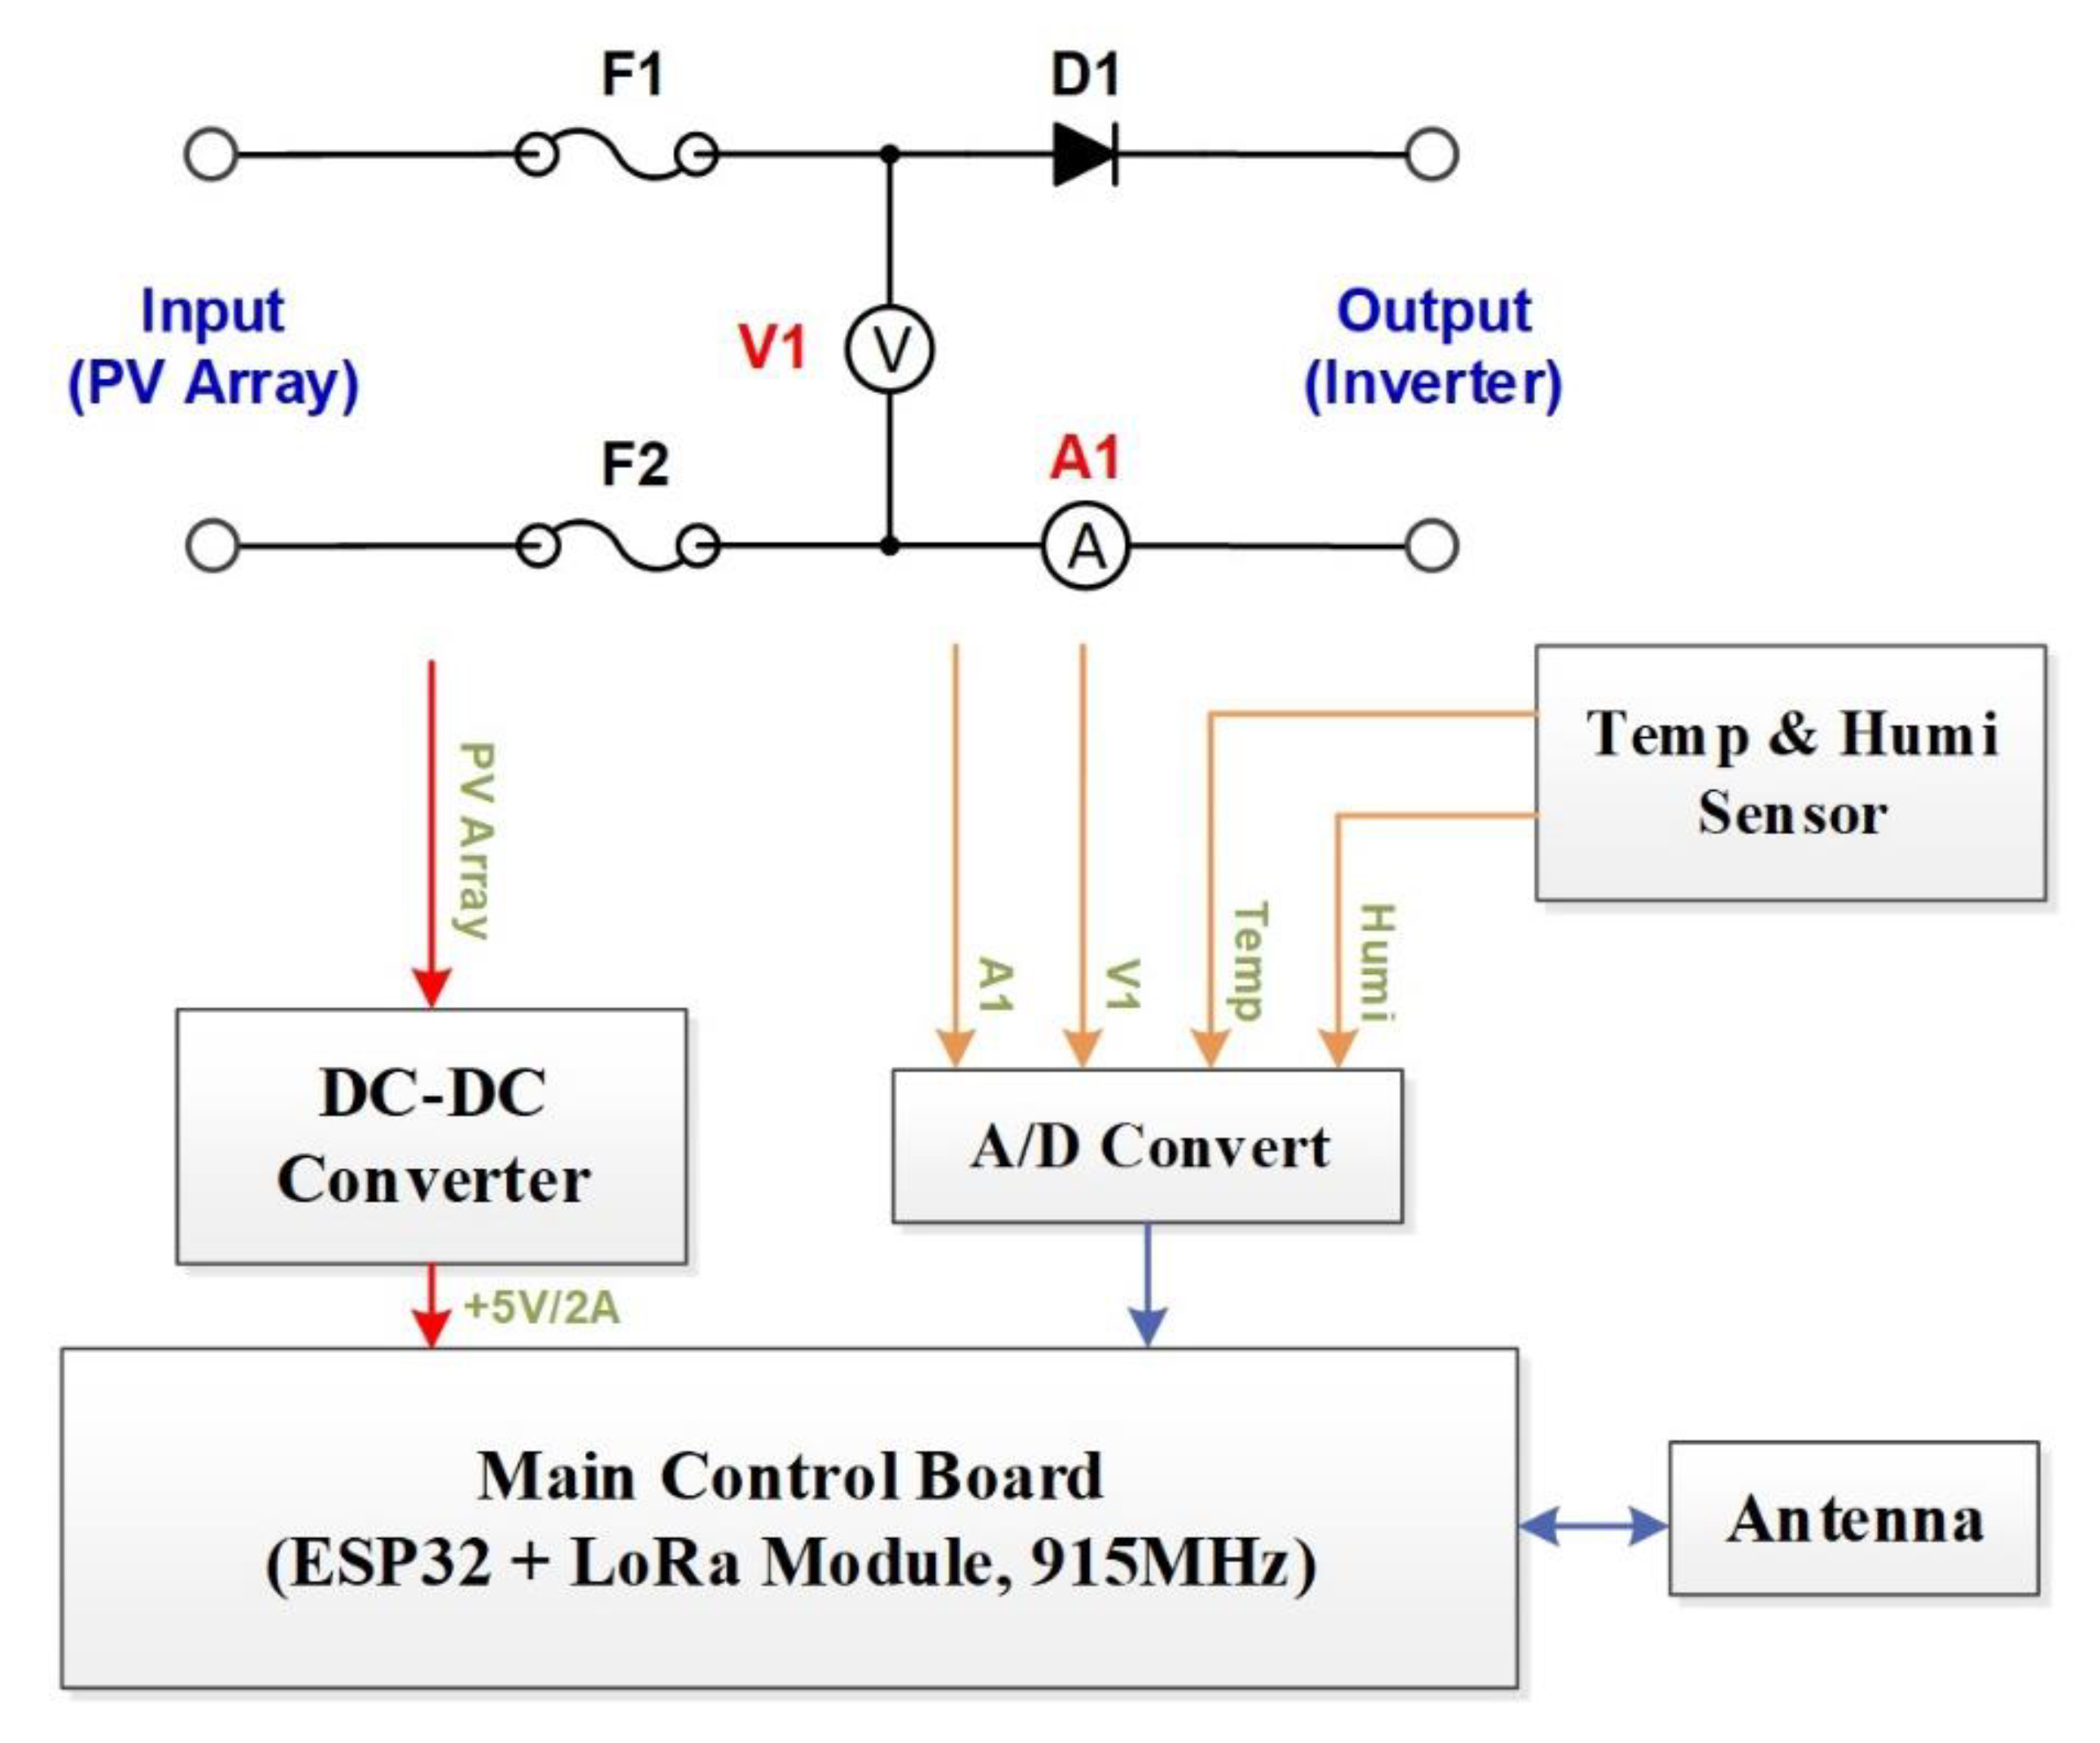
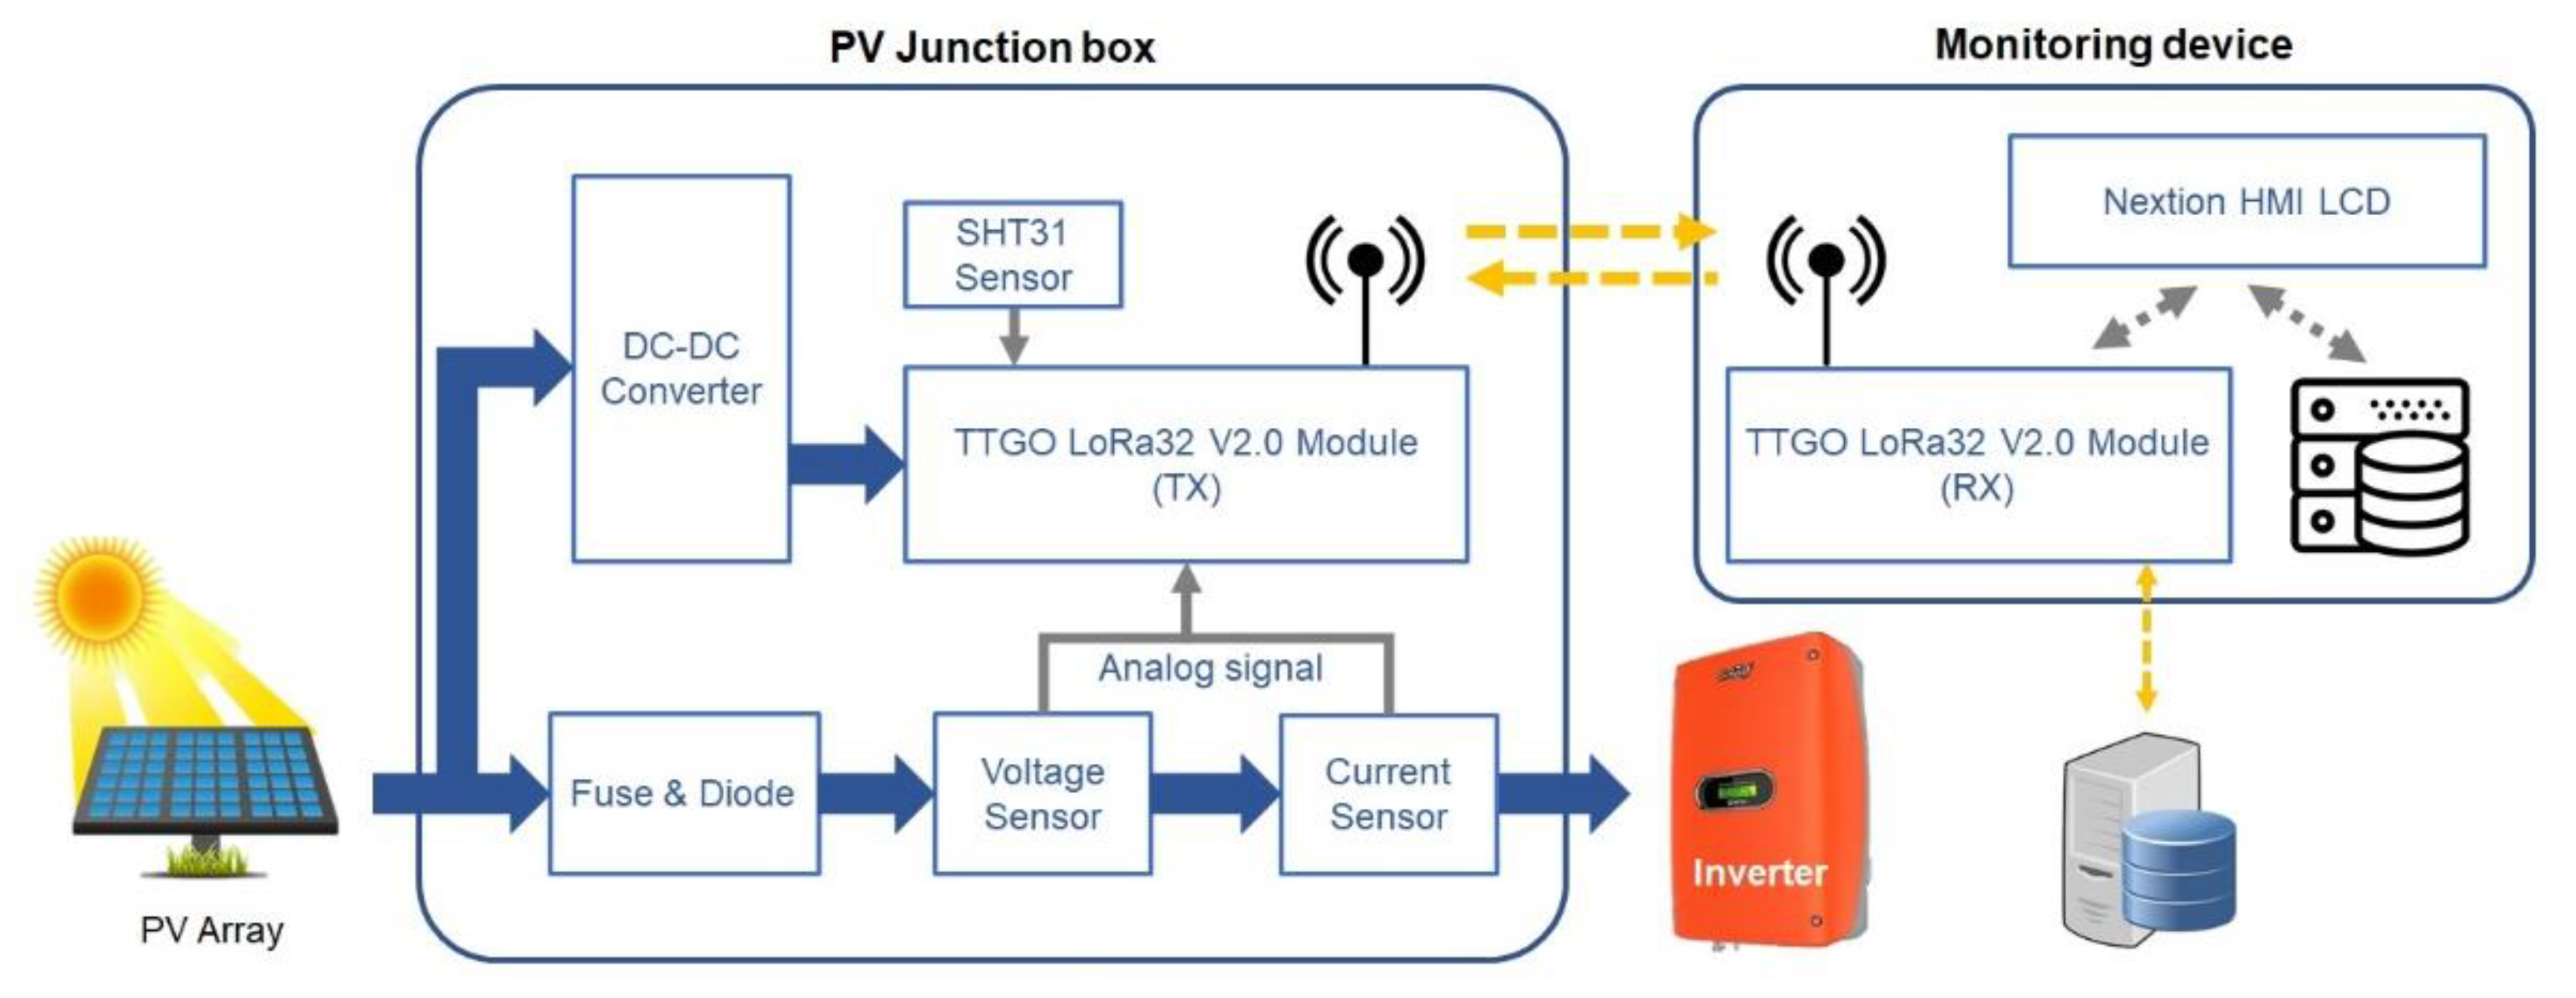
The proposed PV junction box monitoring system is made up a TX module that collects various data and transmits it as a LoRa signal, and an RX module that processes the received data and displays it on the user screen or stores it in the database. If the system is connected to the ethernet, all data is saved to the web server using the MySQL program. Otherwise, it is saved to the SD card in the RX module. Figure 5 shows the schematic diagram of the proposed PV junction box monitoring system.
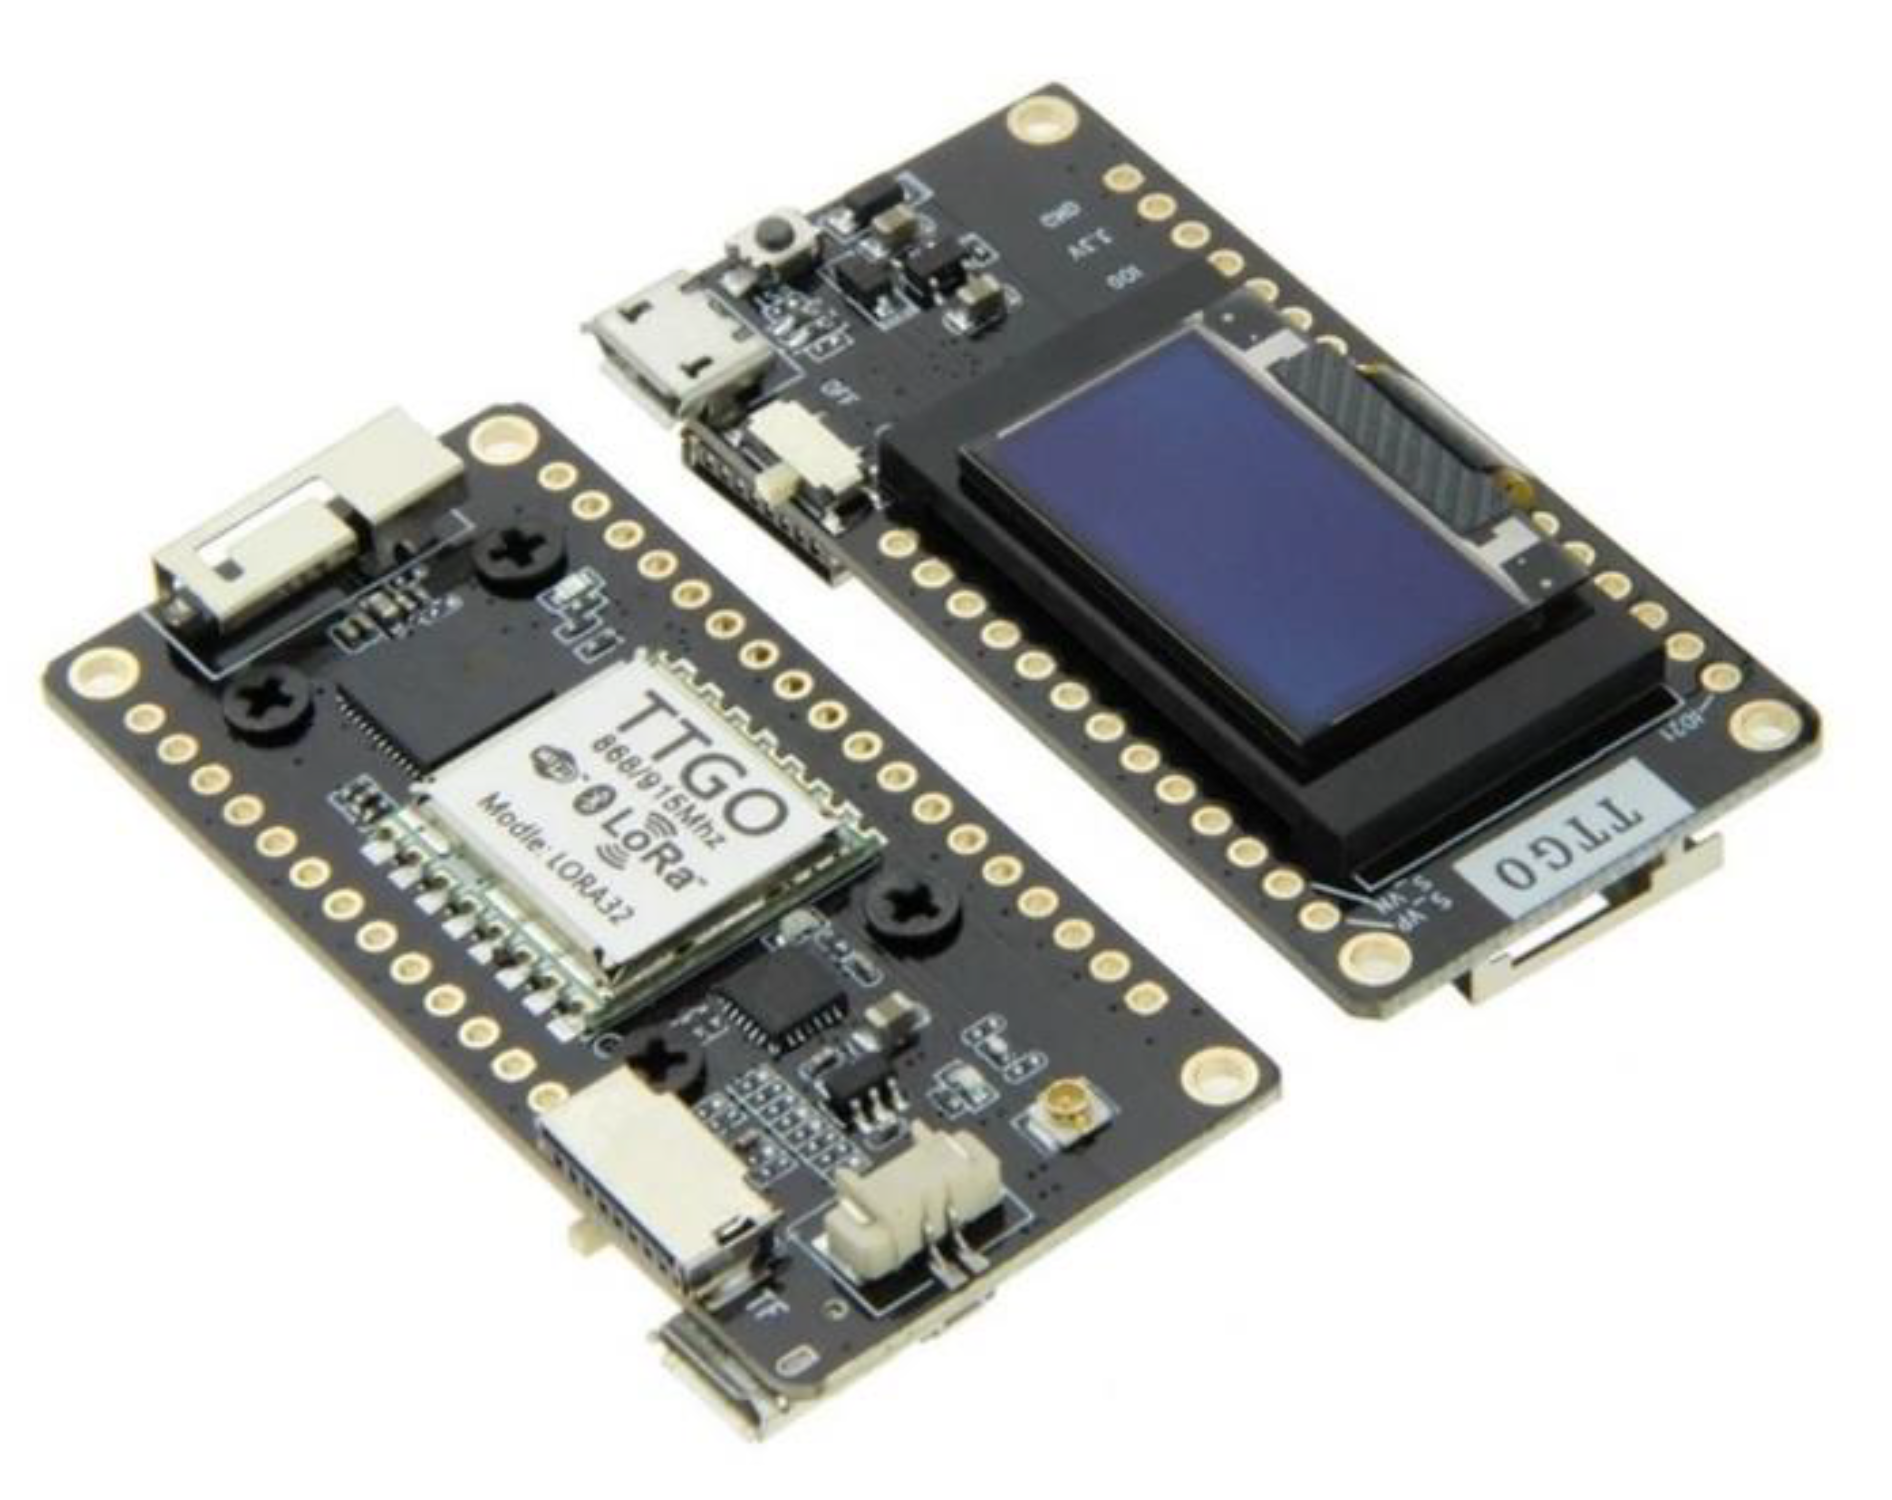
Since the residential PV system is designed as a single array, the fuse and diode mounted on the conventional PV junction box are arranged in a single structure in the TX module. To implement the proposed system ideally, various I/O ports, digital signal processing, low-power LoRa protocol and WIFI technology are required. The ESP32 (Espressif Systems Co., Ltd., Shanghai, China) and SX1276 (Semtech Corporation, Camarillo, CA, USA) are essential microcontrollers implementing these functions. The TTGO LoRa32 V2.0 module (Shenzhen Xin Yuan Electronic Technology Co., Ltd., Guangdong, China) integrated with individual chips is applied to the TX and RX modules. As the ESP32 board is open-source hardware, it has a great merit in the expandability of parts. Figure 6 and Table 1 show the configuration and specifications of the TTGO LoRa32 V2.0 module.
An external power source is required to operate the TX module. The power is provided by the PV array of the PV junction box. This can be performed even in case of a blackout. Therefore, a DC-DC converter operating with a high potential difference was applied up to a 10 W capacity. A constant voltage of 5 V DC with pulsation was applied. Meanwhile, several sensors were connected to the TX module to measure voltage, current, temperature and humidity. The total power consumption of the TX module, including TTGO LoRa32 V2.0 and several sensors, was calculated to be less than 2 W. Due to its low power requirements, it did not cause any power supply problems to the TX module.
In order to reduce the size and cost of the TX module, the voltage sensor is designed as a voltage divider with resistors. Thus, the voltage sensor is capable of measuring a maximum of 300 V. A Hall sensor allows non-contact detection of direct and alternating currents, using a hall element, a magneto-electric converting element. The ACS758LCB-050U (Allegro MicroSystems, Worcester, MA, USA) offers extremely stable output offset voltage and nearly zero magnetic hysteresis. This current sensor can measure a large current of up to DC 50 A in a simple way.
Since the heat level produced by the diode increases the PV junction box internal temperature, it is necessary to sustainably monitor the internal environment using a temperature sensor. The SHT31 sensor (SENSIRION, Staefa, ZH, Switzerland) has a wide measurement range from −40 °C to +120 °C with high accuracy of ±1.5% RH and ±0.2 °C under normal conditions. When a high temperature is detected, an alarm icon is displayed on the user screen. In order to reduce the production cost of the system and the module size, it was designed as an integrated PCB board. Figure 7 shows the assembled PV junction box with the TX module.
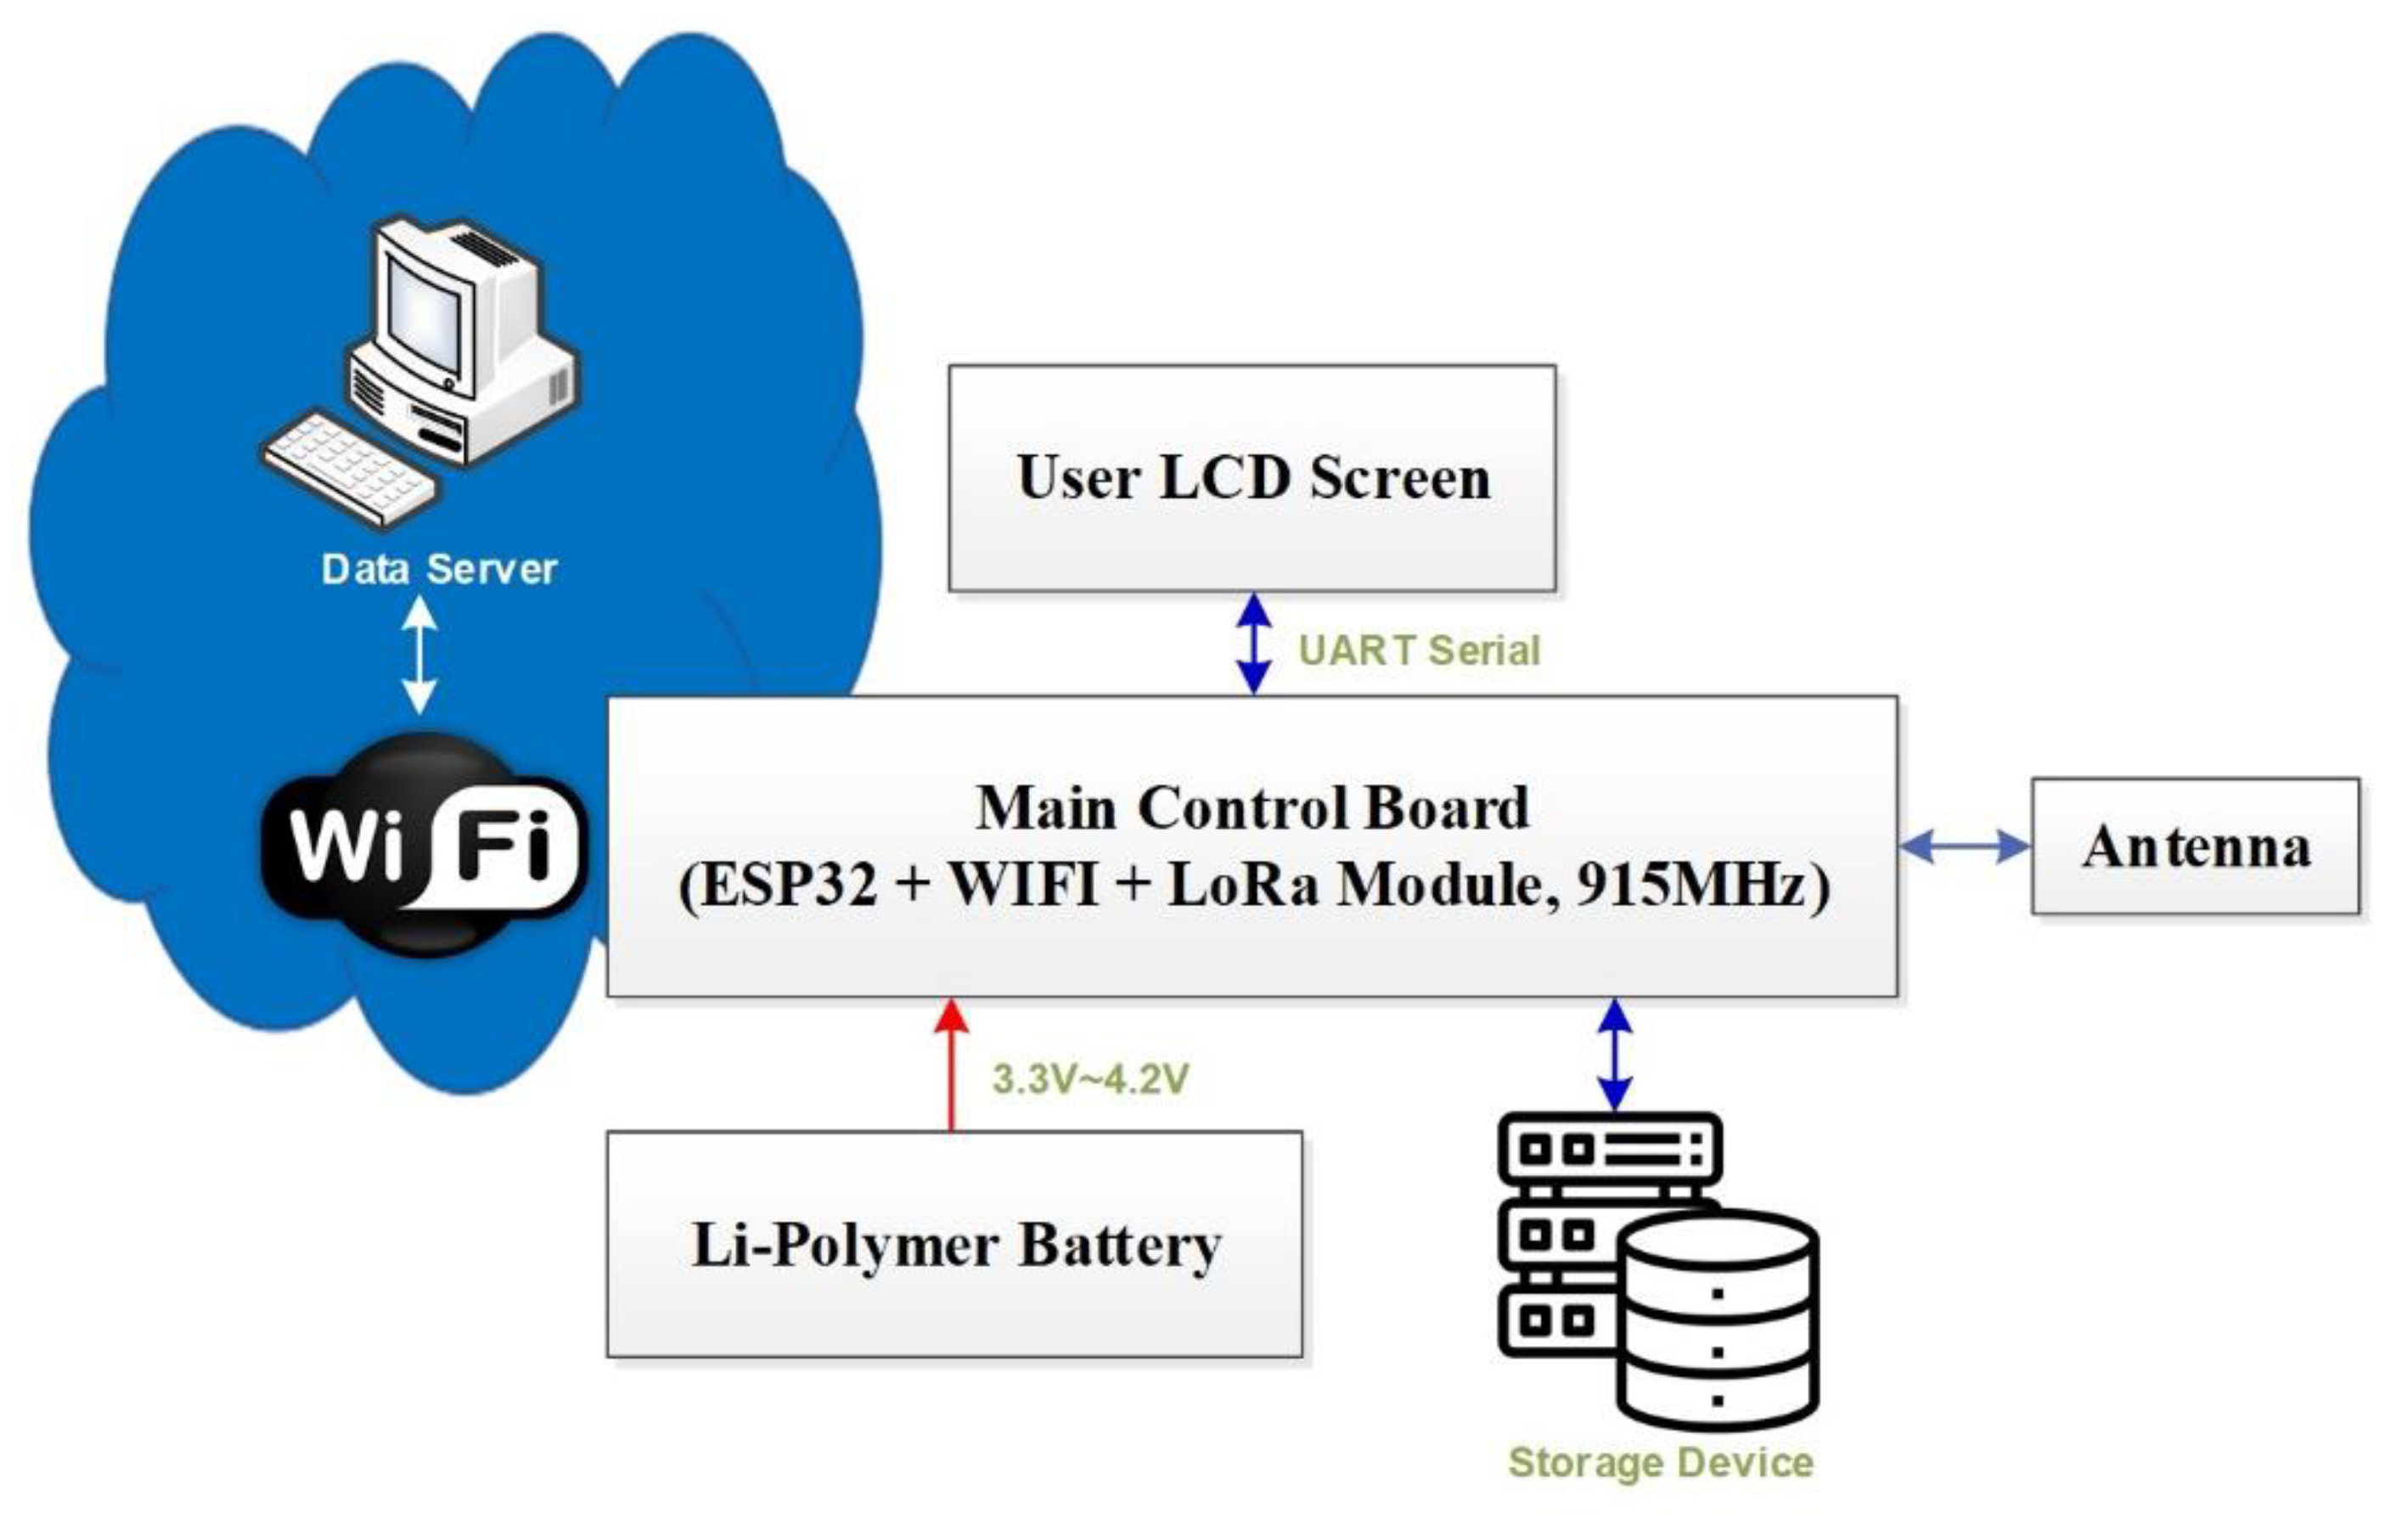
The RX module is comprised of a TTGO LoRa32 V2.0 module, a Nextion HMI LCD and lithium-polymer battery, etc. For long-distance communication, it is designed to be used with an internal battery, rather than using an external power supply only. A lithium-polymer battery (3.7 V/3000 mAh) with a large capacity is applied so that the RX module can be operated for several hours even in an environment without external power. In the RX module, the TTGO LoRa32 V2.0 module receives packet information from 915 MHz antenna and measures RSSI, measuring the power present in a received RF (Radio Frequency) signal. The processed data is displayed on a 0.86 inch OLED (Organic Light Emitting Diodes). All data presented above are saved in the storage device at 1-min intervals. If a WLAN environment is established, the PV junction box can be connected to the ethernet via WIFI. Ultimately, the proposed PV junction box monitoring system including the IoT system is materialized.
In addition, the RX module is equipped with a 5 inch Nextion HMI LCD manufactured by ITEAD Studio Co. (Shenzhen, China) to increase user visibility. The utility device has the advantage of being easy to implement by using the Nextion Editor V1.63.3 program, and comfortable to operate by supporting the pressure-sensitive touch screen function. Furthermore, the Nextion HMI LCD communicates fuse and diode condition, date and time, based on serial communication with the TTGO LoRa32 V2.0 module, and has RTC (Real Time Clock) and EEPROM (Electrically Erasable Programmable Read Only Memory) functions to store background information in the long term. Figure 8 shows the manufactured RX module, including the TTGO LoRa32 V2.0 module, the LCD screen and the Li-Pol battery, etc.

5. Experiment Setup

Figure 9a shows the proposed PV junction box monitoring system connected to a 3 kW PV system. The PV array consists of 12 PV modules (6S2P) and is installed on the roof at a tilt of 30 degrees, facing south. The 3.5 kW inverter promptly converts the DC voltage produced from the PV array into an AC voltage (220 VAC, 60 Hz) to supply to the grid via a circuit breaker. The proposed PV junction box was installed between the PV array and the 3.5 kW inverter. Figure 9b shows the GUI (Graphical User Interface) of the RX module that displays the PV junction box information. In order to enhance the intuitiveness of the user and manager, the data received from the PV junction box was displayed in a gauge type on the LCD screen. In addition, since the RX module is designed in a compact size and is portable, the installation position is free. A WLAN environment was established so that the information from the PV junction box was stored in the database through the web server.
In general, a large number of houses and irregular structures are densely located in a place where a home PV system is installed. In the case of a PV power plant, the PV junction boxes and the PV monitoring center are quite far from each other. LoRa communication in NLOS environments inevitably has a shorter data transmission distance than in LOS environments. Because of this, it is necessary to verify whether the PV junction box monitoring system operates normally in NLOS environments. Several experiments were conducted to determine the communication range of the RX module inside and outside the building, and to check out the operational status of the proposed PV junction box monitoring system. Figure 10 shows the location of the PV junction box monitoring system, where the experiment was conducted, and the travel route of the RX module. Red dotted lines are drawn at intervals of 50 m radiating out from the place where the PV junction box is installed, and the distance traveled by carrying the RX module is marked with a light green solid line.

6. Results and Discussion

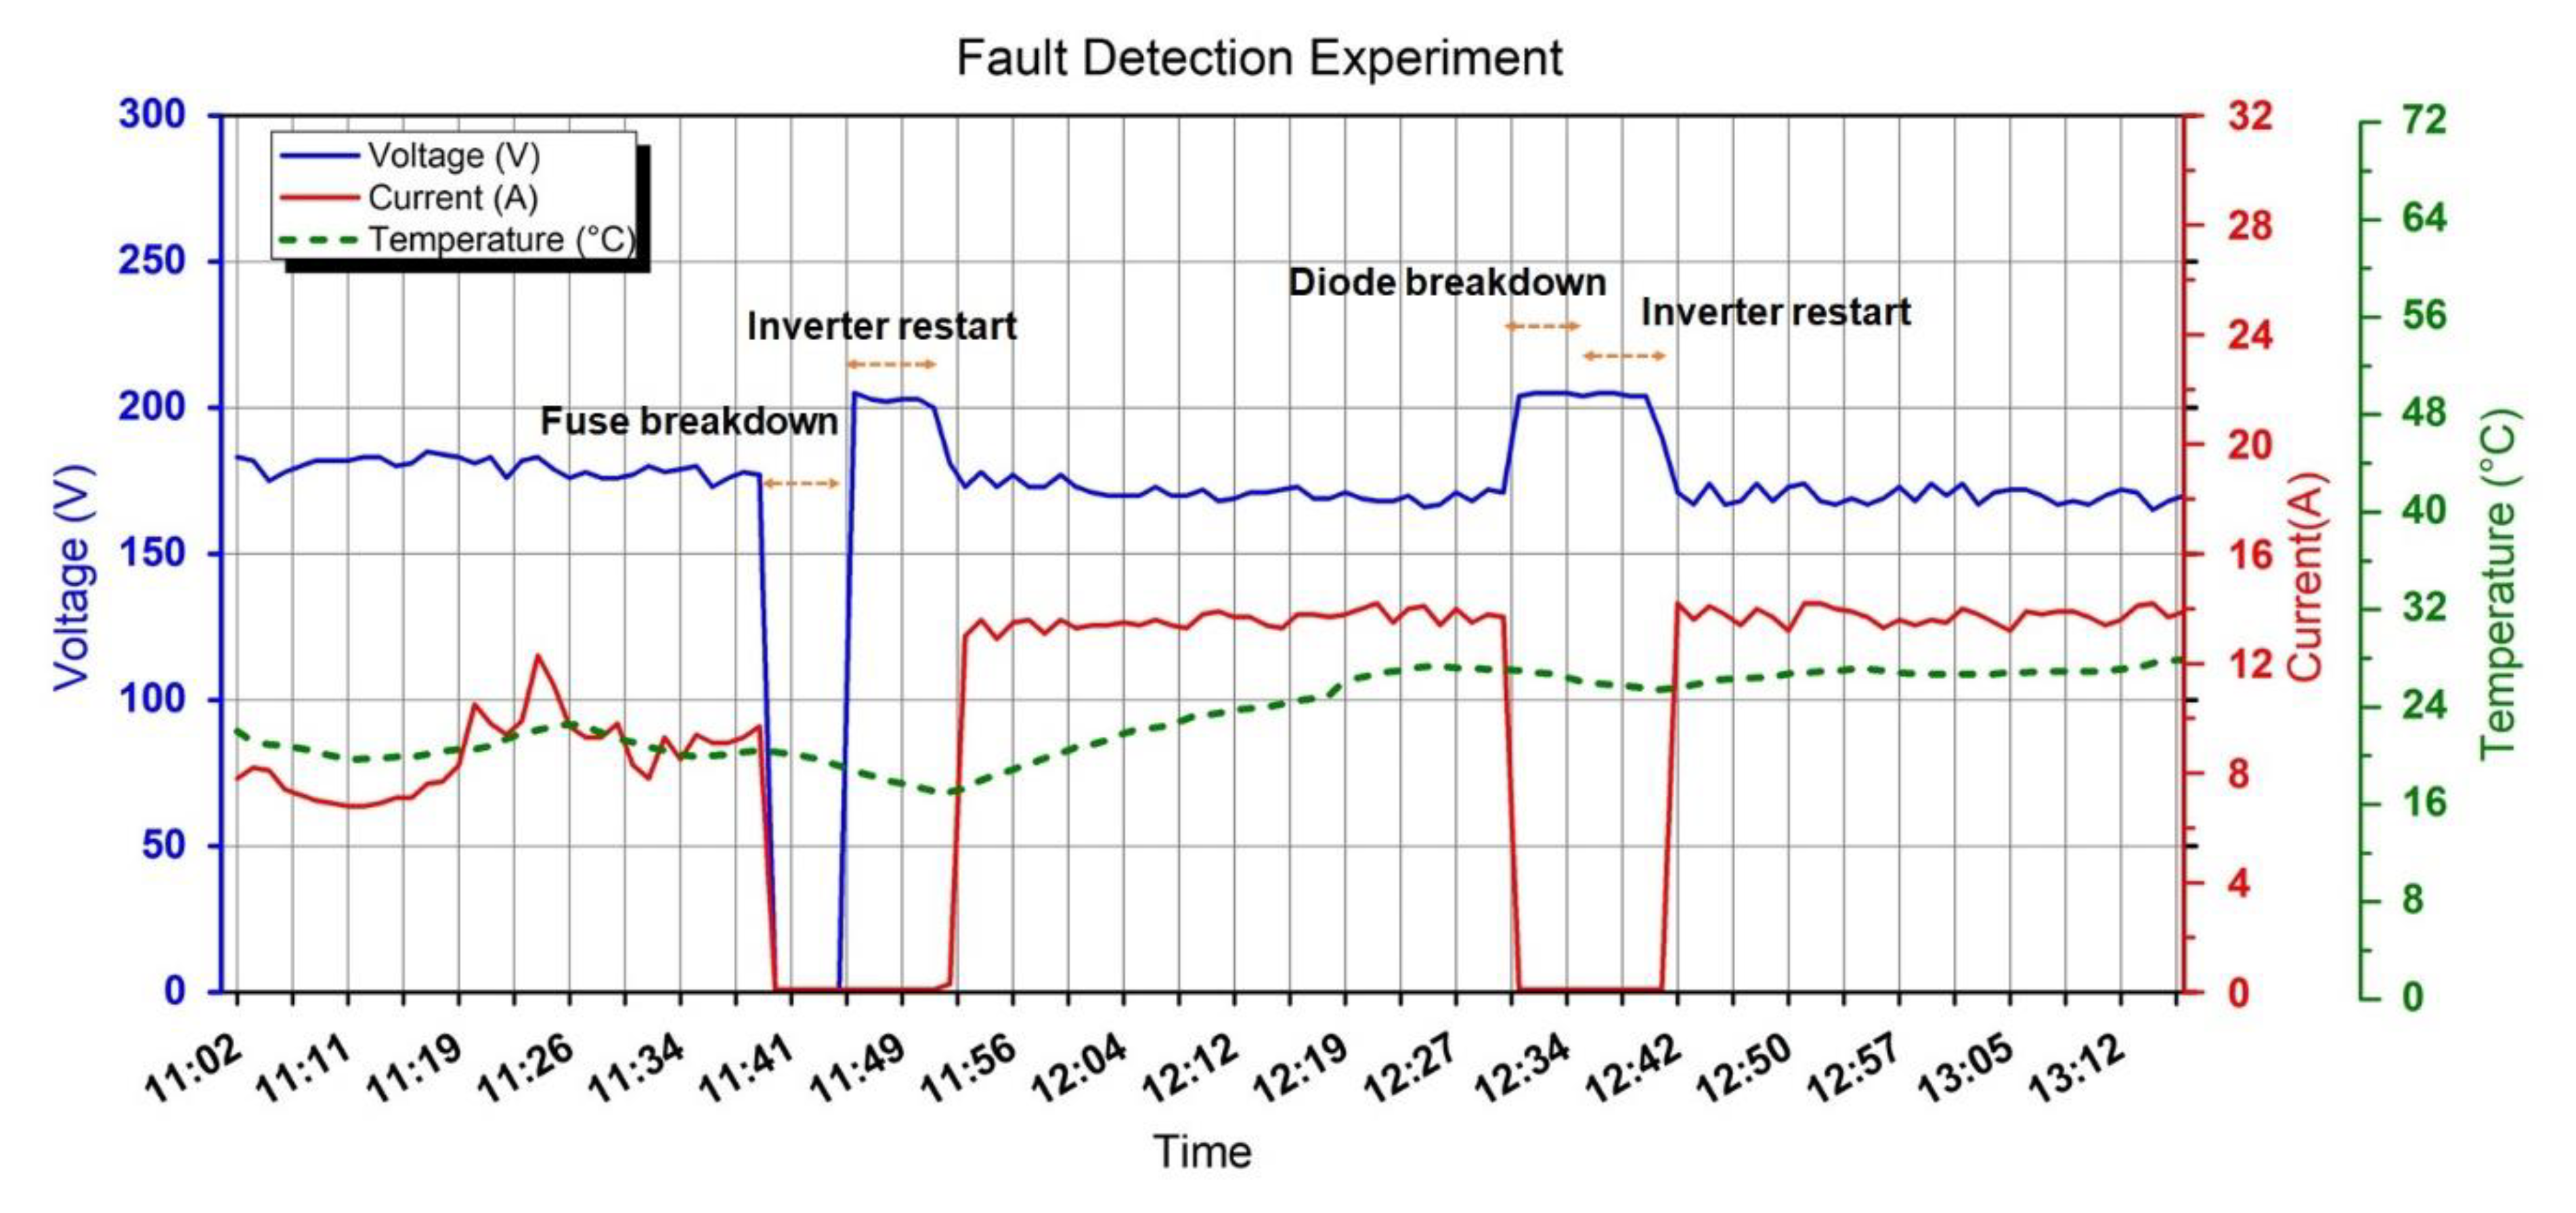
Figure 11 shows the result of the fault detection experiment. Fuse and diode failure situations were implemented. When the fuse was broken down at 11:39, the input voltage and current became zero values. After recognizing the fault condition and replacing the fuse, the inverter restarted. It is confirmed that 300 s is counted in standby mode and then PV power is ordinarily produced. When the diode was out of order at 12:33, the input voltage rises as much as VOC and the current reaches zero. After replacing the diode, the inverter restarted without any problems after a count of 300 s.
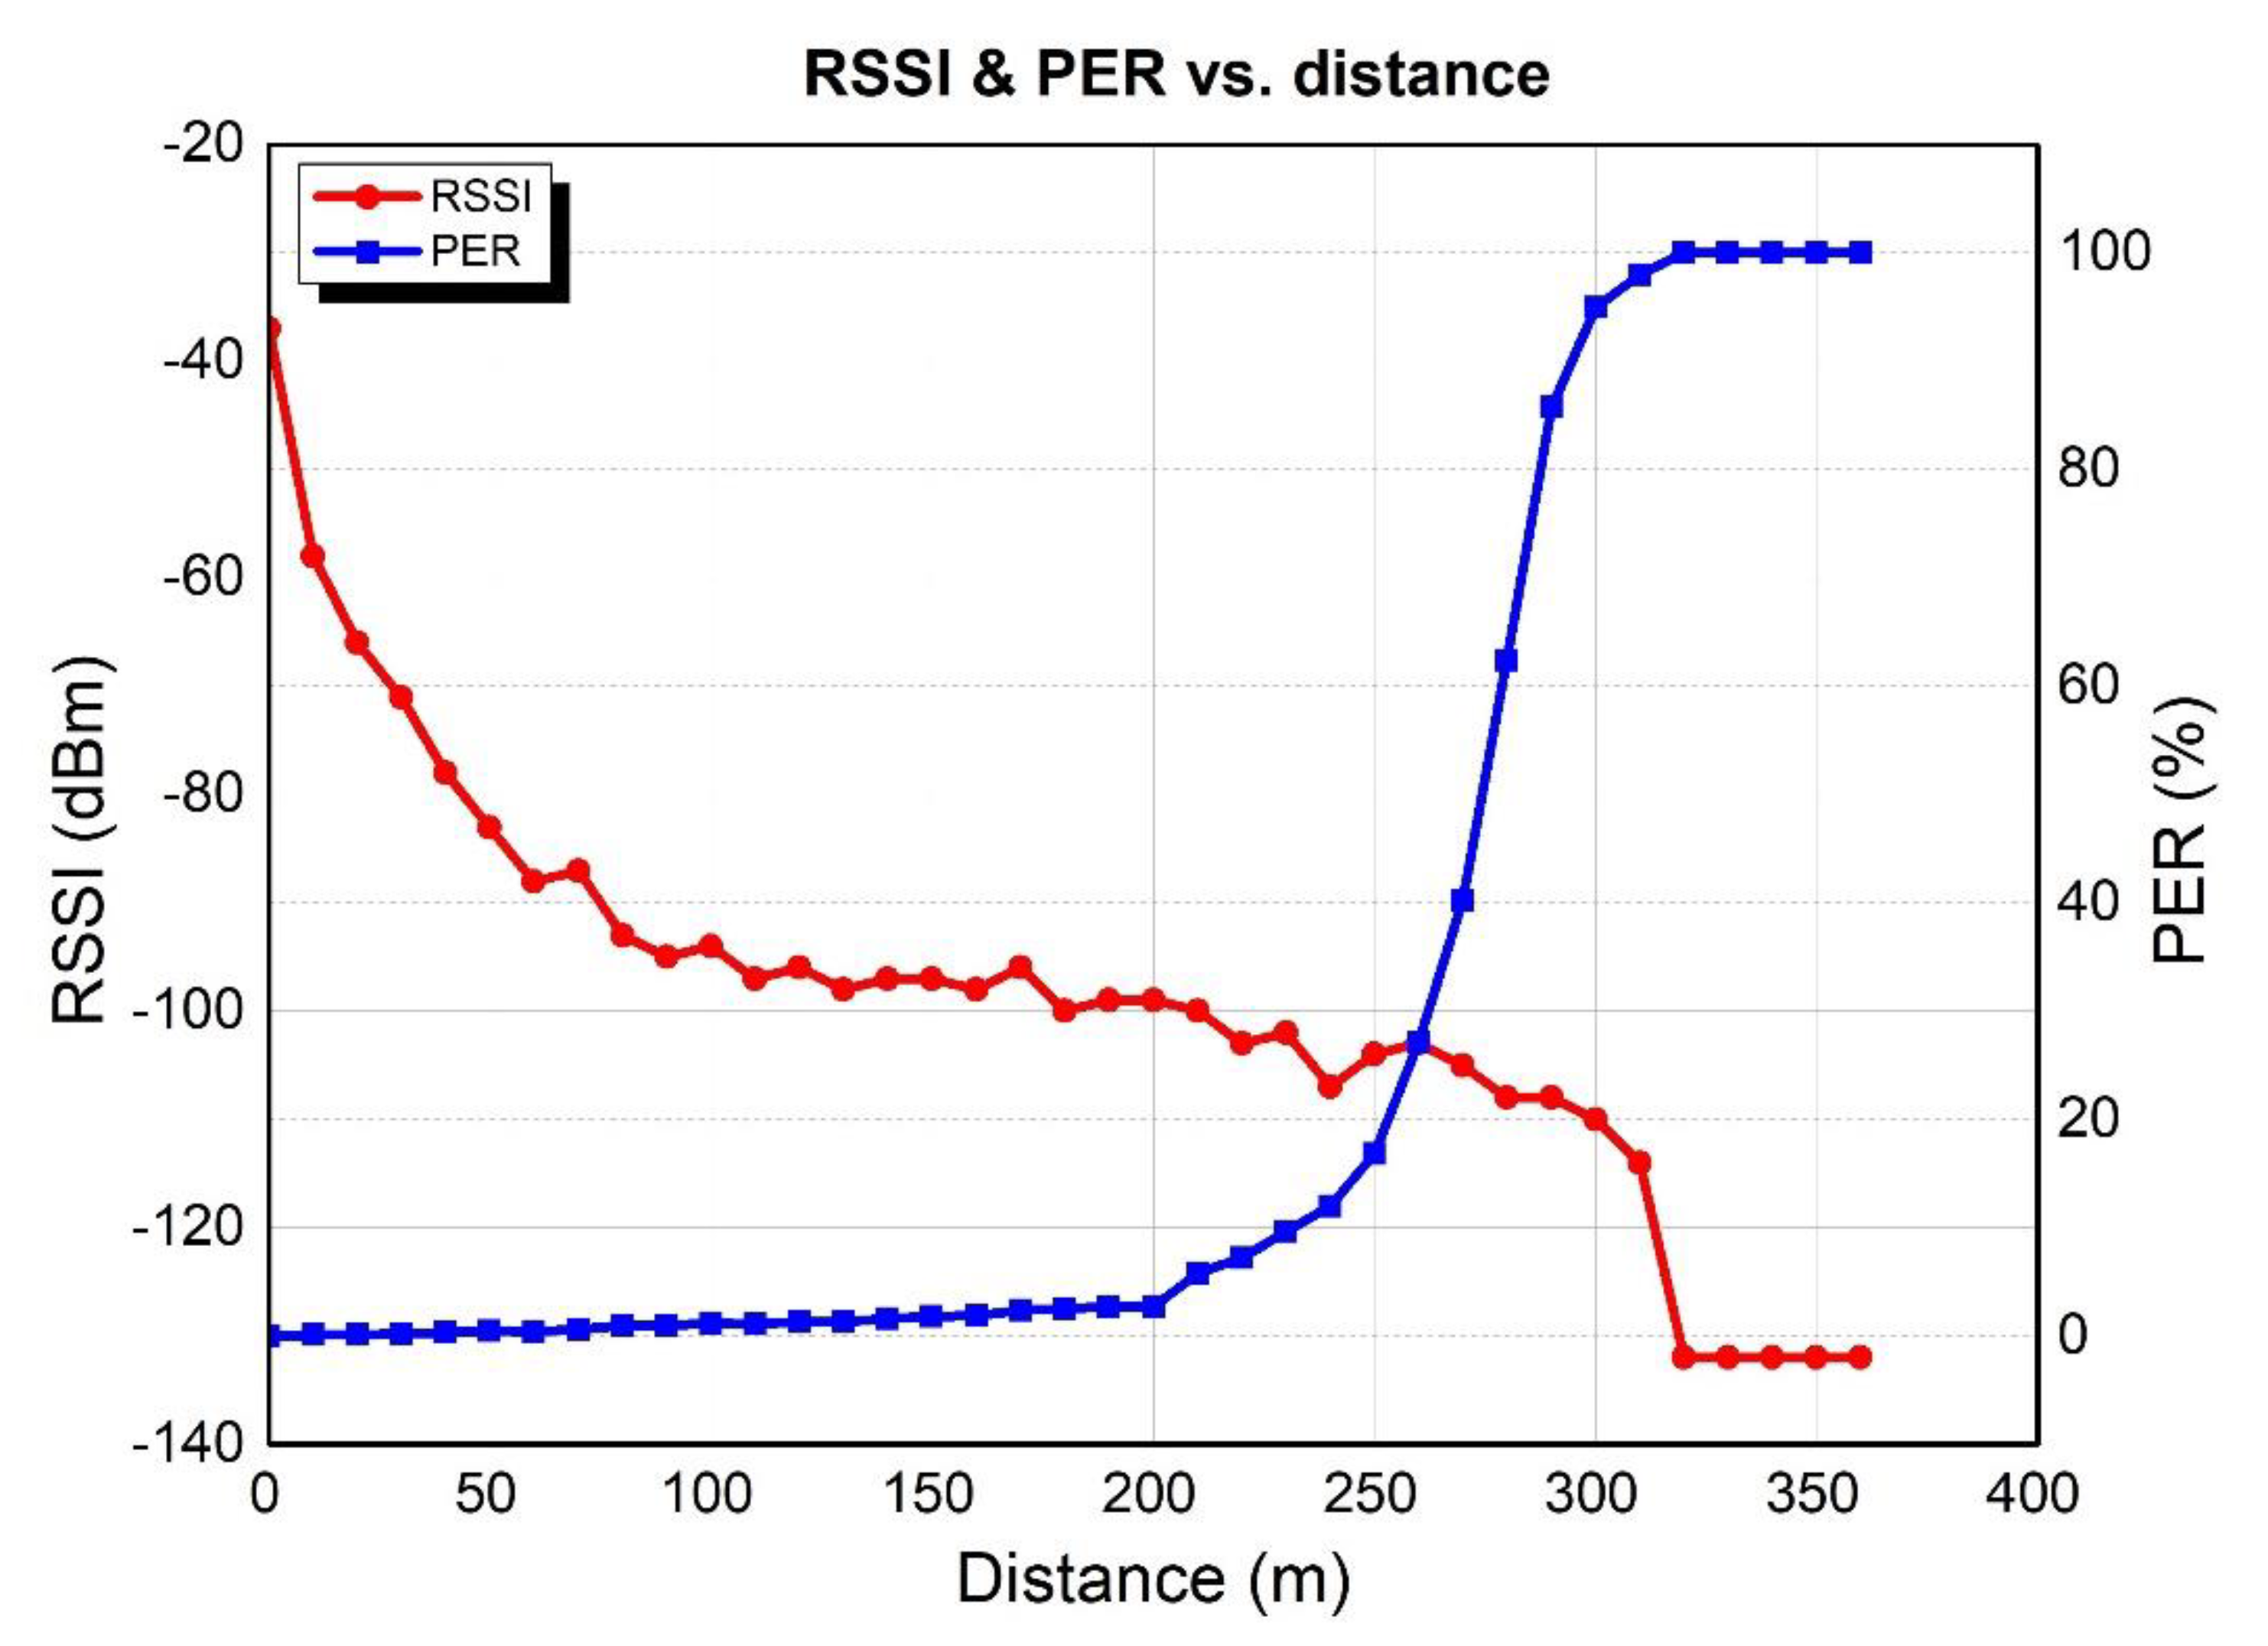
The RSSI and PER measurements from the RX module according to distance in the NLOS environment is shown in Figure 12. RSSI was measured at 10m intervals from the TX module. PER was calculated based on the number of errors from 100 data entries. Up to a 40 m distance, RSSI was maintained above −80 dBm and PER was below 2%. We can see that the RSSI level decreased rapidly as the distance increased, due to the NLOS environment. At a distance of 200 m or more, the PER level appeared to increase as the signal strength received from the RX module decreased. Between 200 m and 300 m, reliable communication was not available due to the rapid increase in the packet error rate. This showed that communication of the RX module is completely cut off over 320 m.
The PV junction box is usually installed outside of the house and the monitoring device is placed inside of the house. Although the inside of the house is an NLOS environment, there is no problem in LoRa communication due to the short distance of within 20 m from the PV junction box. The RSSI level measured inside the house was −80–−97 dBm. Consequently, the PV junction box monitoring system can be operated in stature without communication problems in the house where the PV system is installed. Figure 13 shows the RSSI measured in the house during the day. The average RSSI was measured to be −84.7 dBm. Except for the temporary decrease in RSSI around 18:00 when the PV power was significantly reduced, the overall reception rate was constant.
Figure 14 shows the LoRa RSSI compared to WIFI according to indoor and outdoor distances. When the RX and TX modules were inside the house, both LoRa RSSI and WIFI RSSI communicated smoothly. However, outside the house, the WIFI RSSI decreased sharply as the distance increased, and the WIFI was disconnected at about 12 m. On the other hand, LoRa RSSI showed a slight decrease from outside the house, and also maintained a constant RSSI as the distance increased.
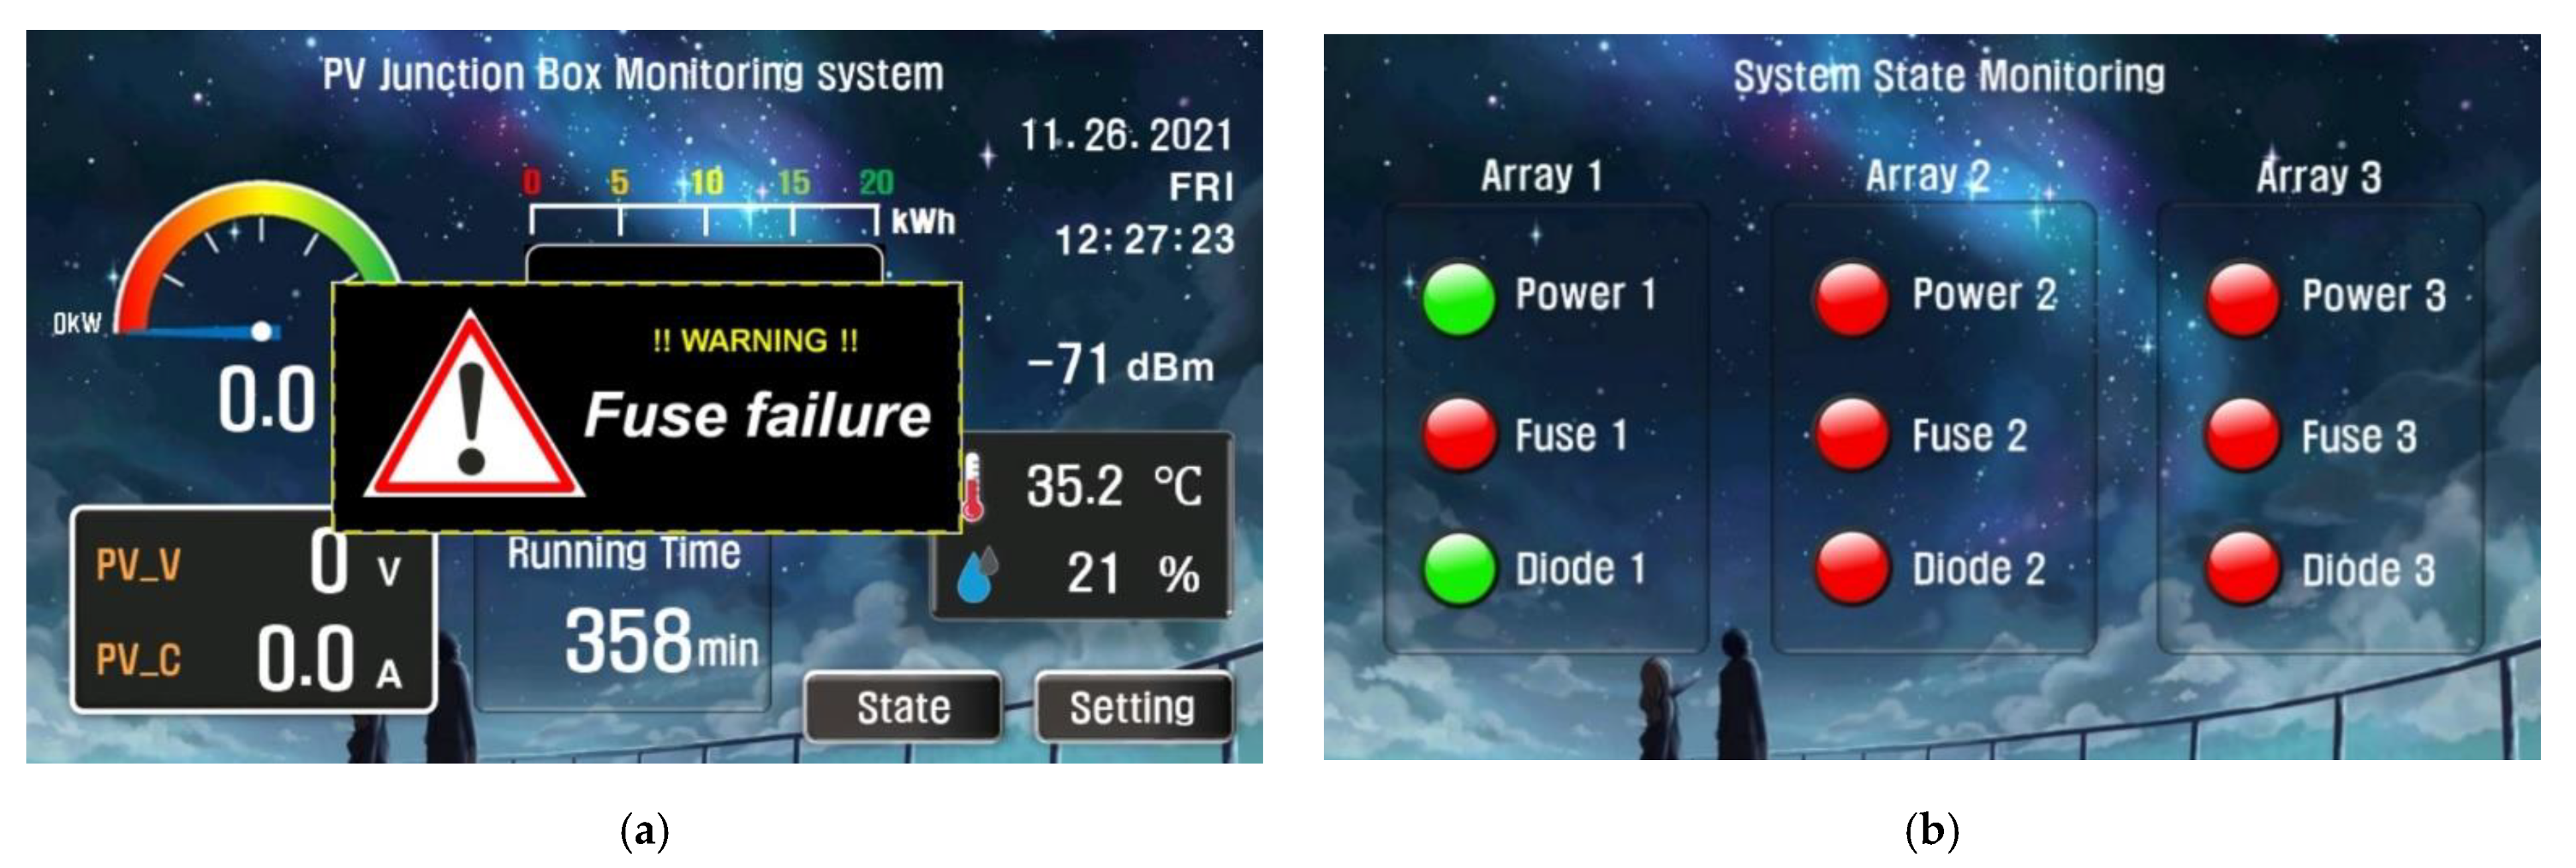
Figure 15a shows the warning message displayed on the LCD screen of the monitoring device when a fuse failure actually occurs in the PV junction box. The component status of the PV junction box for each PV array is shown in Figure 15b. The TX module has a total of 18 ADC ports. Excluding the ports in charge of LoRa communication, 13 ADC ports can be activated, and if the PV array is monitored with the voltage and current sensor, a total of 6 PV arrays can be monitored. This can be applied not only to residential PV systems, but also to large-scale PV power plants.
The various data obtained from the PV junction box for a day in summer are in Figure 16a, b. The output power gradually increased as time passed and tended to decrease sharply at some points due to the blocking of the sunlight by clouds. The maximum output power was 2.4 kW and the accumulated energy was 17.3 kWh. As the current level flowing through the diode increased, the temperature inside the PV junction box also increased significantly. It recorded 72.0 °C during the day. If high internal temperatures continue for a long time, it will shorten the lifespan of the parts. With reference to these results, a cooling device controlling the internal PV junction box temperature is required.
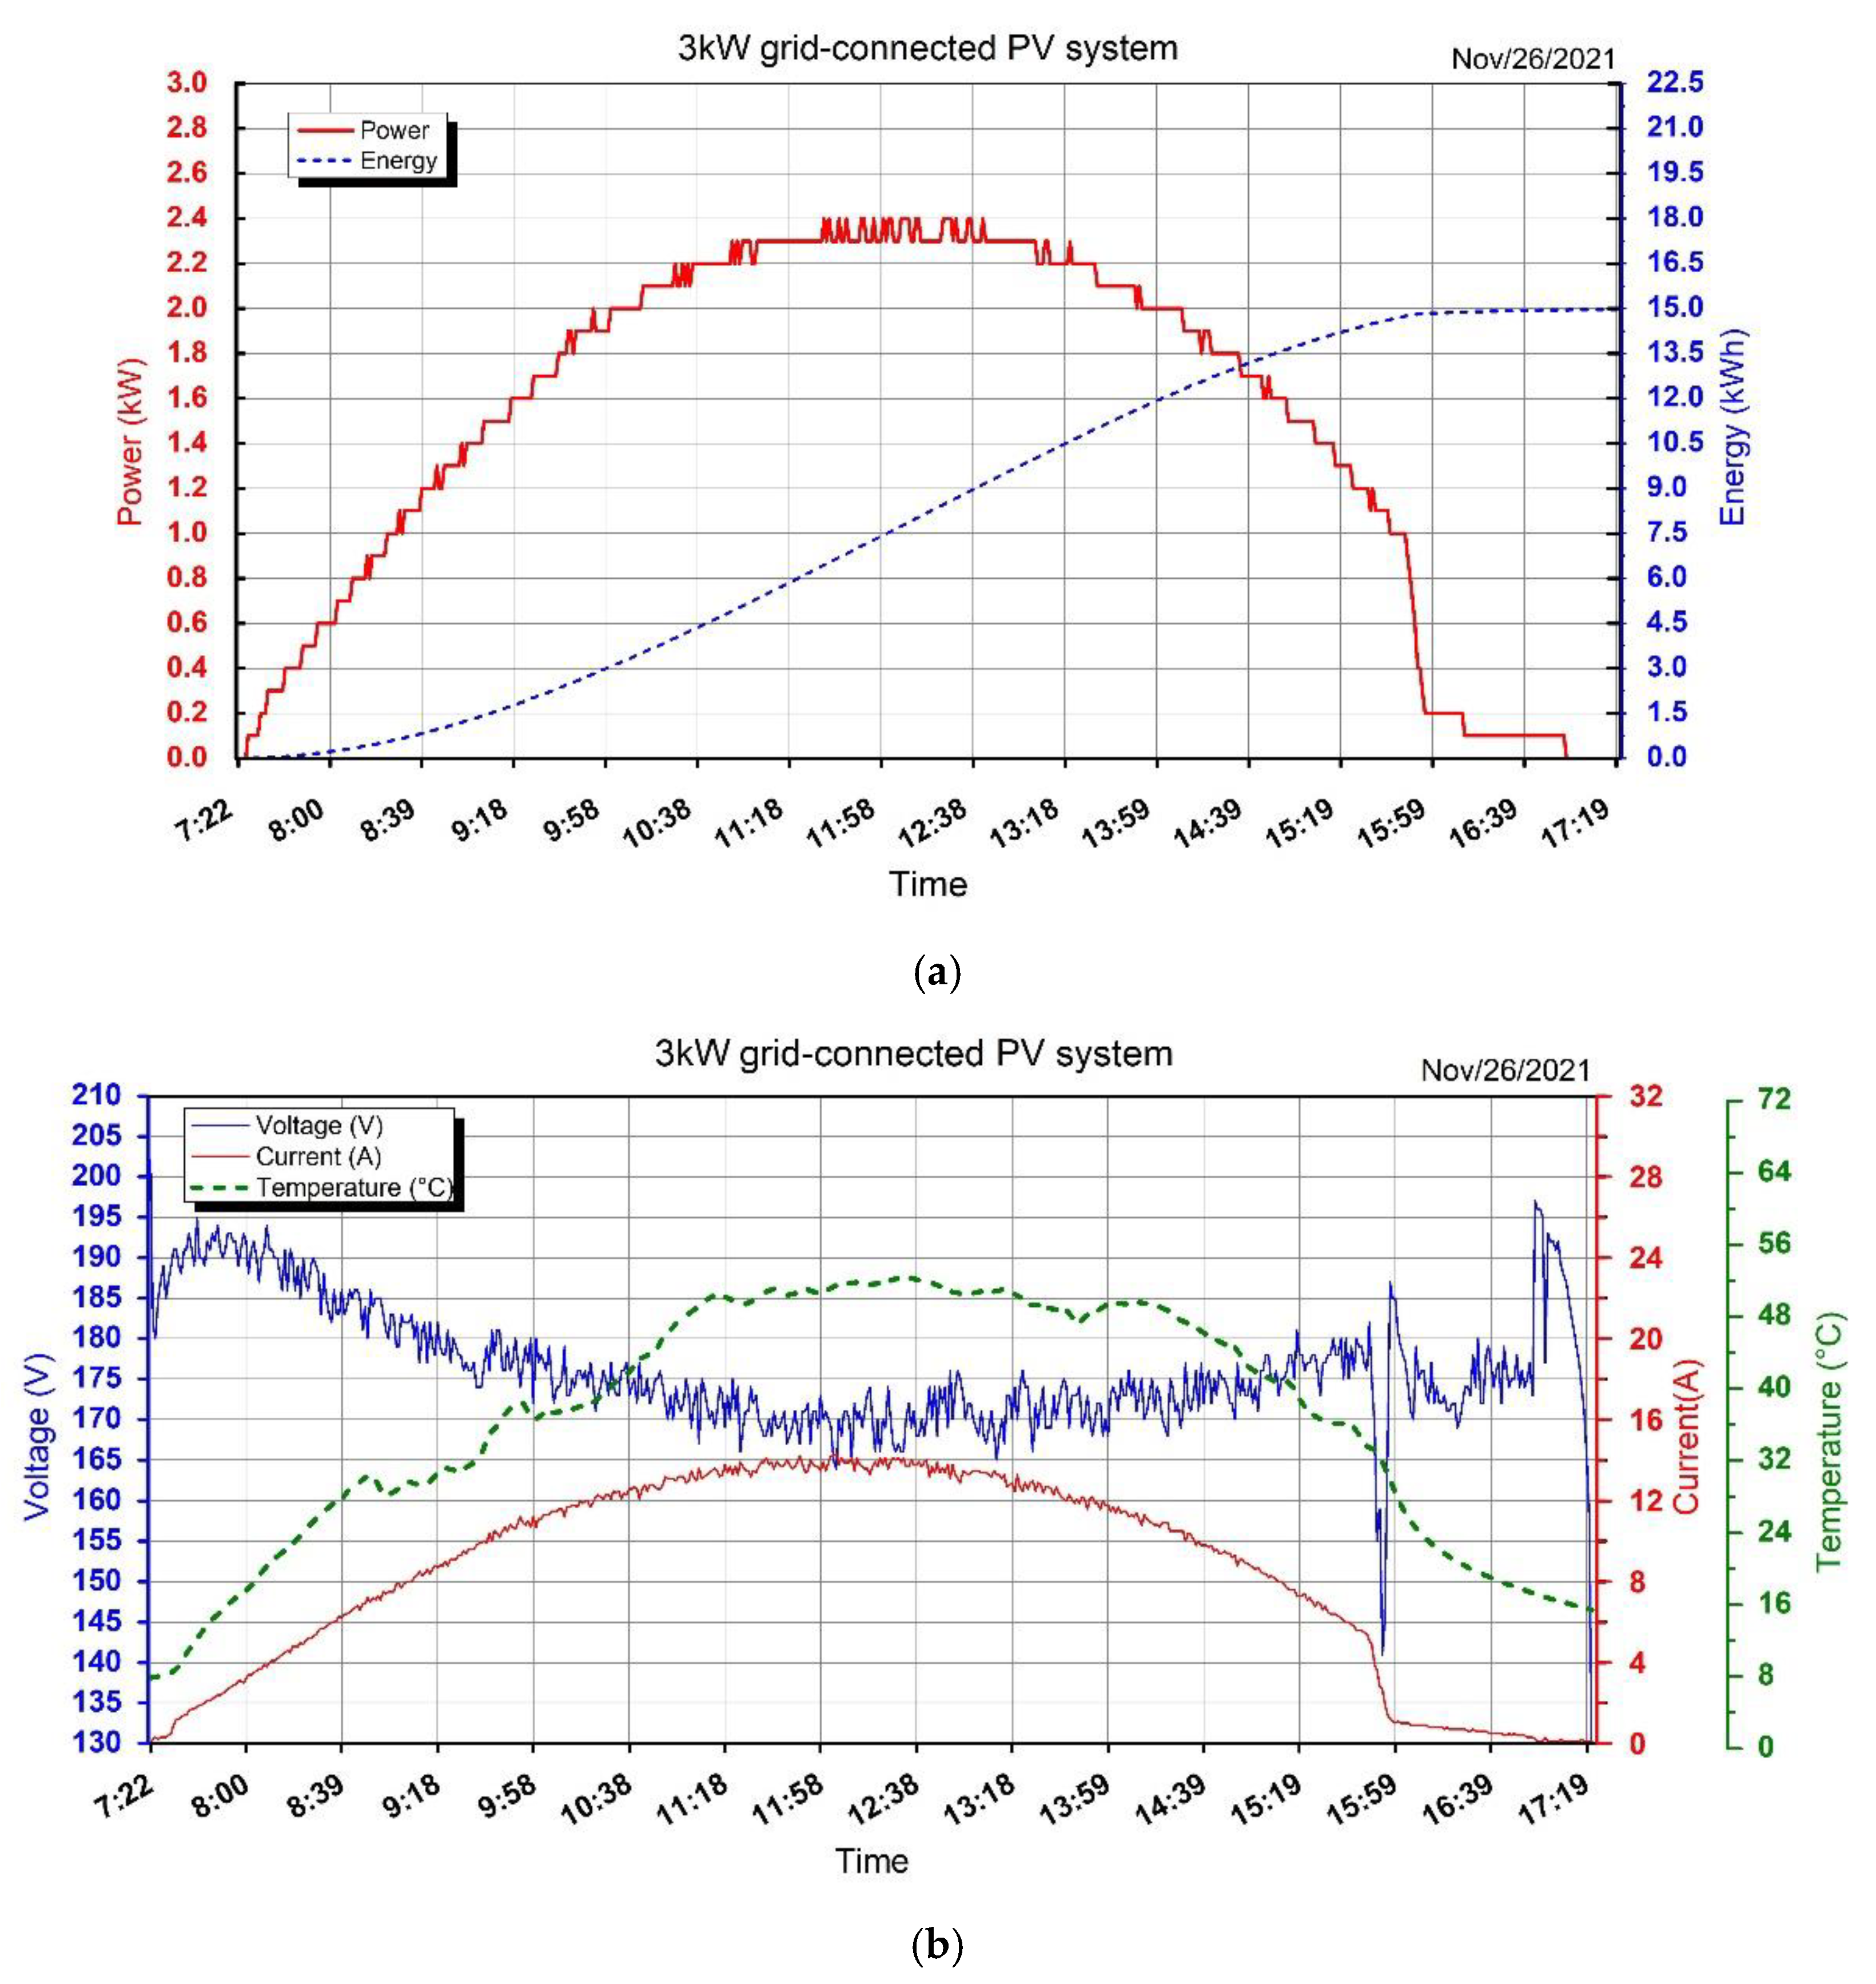
The various data obtained from the PV junction box for a day in winter are in Figure 17a, b. The output power in winter rose constantly as the sun rose, and the maximum power (2.4 kW) output was around noon. On a clear day, there was no sharp drop in output power due to clouds, but at around 15:50 the sun was obscured by a low mountain in the west and the output power was significantly reduced. The total power production for the day was 14.9 kWh. The temperature inside the PV junction box recorded a maximum of 52.4 °C due to the low air temperature in winter.
The output of the PV array in summer and winter did not exceed the maximum of 2.4 kW for several reasons. First, since the solar altitude angle rises to a maximum of 76.5 degrees at noon in summer, the incidence angle of sunlight on the PV array was 106.5 degrees higher than 90 degrees. Second, the surface temperature of the PV array in summer rose to 60–70 °C. Thus, the PV array efficiency decreased in inverse proportion to the temperature rise. In winter at noon, because the solar altitude angle rises only to 29 degrees, the incidence angle of sunlight on the PV array was 59 degrees lower than 90 degrees. As a result, the output of the PV array was inevitably reduced.
The PV array is connected to a web server using WIFI to perform real-time monitoring and data storage. For data redundancy, PV junction box information is stored in both an SD card and the web server by the RX module at 1 min interval. Table 2 shows the PV junction box information stored in the database.

7. Conclusions

In this paper, we suggest a novel strategy for monitoring a PV junction box based on LoRa in a 3 kW residential PV system. Conventional PV junction boxes have limited real-time monitoring compared to inverters. Moreover, conventional monitoring systems have a communication limitation according to the distance and environment. To improve the problems of the conventional PV junction box, we designed a TX/RX module operation algorithm and manufactured a novel PV junction box that monitors the status of fuses and diodes by measuring voltage and current. We continuously collected several data, such as the voltage, current, power, temperature and running time during summer and winter. As a result, it was confirmed that when a fuse failure occurs, the status is displayed promptly to notify the user. In addition, it was experimentally verified that LoRa provides wider coverage than WIFI under the influence of the building. Finally, the PV junction box monitoring system achieved excellent characteristics of RSSI > −99 dBm and PER < 2.7%, up to a radius of 200 m in an NLOS environment. Hence, the proposed system in the paper provides an improvement in the operating efficiency of the PV system. Nowadays, residential PV systems tend to be highly concentrated. If numerous PV junction box monitoring systems are distributed in a cramped area, unexpected signal interference is caused in the RX module. In the near future, we will conduct additional investigations into simultaneous TX transmissions (from multiple PV junction boxes) to the RX module, in order to evaluate the performance of LoRa in terms of interference.

Author Contributions

K.P. and M.-S.K. conceptualized the idea of this research project. M.-S.K., D.-H.K. and H.-J.K. discussed a novel strategy for monitoring a PV junction box based on LoRa in a 3 kW residential PV system. The proposed solution and technique were designed by M.-S.K., D.-H.K. and H.-J.K. The TX/RX modules with the PV junction box were designed by M.-S.K. The fabrication and experimental setup were mostly carried out by M.-S.K. and D.-H.K. under the supervision of H.-J.K. and K.P. The paper was written by M.-S.K., H.-J.K. and K.P. All authors have read and agreed to the published version of the manuscript.

Funding

This research received no external funding.

Conflicts of Interest

The authors declare no conflict of interest.

References

  1. Kim, J.-H.; Kim, S.-Y.; Yoo, S.-H. Public acceptance of the “Renewable Energy 3020 Plan”: Evidence from a contingent valuation study in South Korea. Sustainability 2020, 12, 3151. [Google Scholar] [CrossRef] [Green Version]
  2. Vincent, I.; Lee, E.-C.; Cha, K.-H.; Kim, H.-M. The WASP model on the symbiotic strategy of renewable and nuclear power for the future of ‘Renewable Energy 3020’ policy in South Korea. Renew. Energy 2021, 172, 929–940. [Google Scholar] [CrossRef]
  3. Lee, S.-H.; Choi, D.; Park, J.-W. Power-sensitivities-based indirect voltage control of renewable energy generators with power constraints. IEEE Access 2021, 9, 101655–101664. [Google Scholar] [CrossRef]
  4. Nishimwe, H.L.F.; Yoon, S.-G. Combined optimal planning and operation of a fast EV-charging station integrated with solar PV and ESS. Energies 2021, 14, 3152. [Google Scholar] [CrossRef]
  5. Barrueto Guzmán, A.; Barraza Vicencio, R.; Ardila-Rey, J.A.; Núñez Ahumada, E.; González Araya, A.; Arancibia Moreno, G. A cost-effective methodology for sizing solar PV systems for existing irrigation facilities in chile. Energies 2018, 11, 1853. [Google Scholar] [CrossRef] [Green Version]
  6. Marzband, M.; Ghazimirsaeid, S.S.; Uppal, H.; Fernando, T. A real-time evaluation of energy management systems for smart hybrid home Microgrids. Electr. Power Syst. Res. 2017, 143, 624–633. [Google Scholar] [CrossRef]
  7. Kopacz, C.; Spataru, S.; Sera, D.; Kerekes, T. Remote and centralized monitoring of PV power plants. In Proceedings of the International Conference on Optimization of Electrical and Electronic Equipment (OPTIM), Bran, Romania, 22–24 May 2014; pp. 721–728. [Google Scholar]
  8. Leva, S.; Mussetta, M.; Ogliari, E. PV module fault diagnosis based on microconverters and day-ahead forecast. IEEE Trans. Ind. Electron. 2019, 66, 3928–3937. [Google Scholar] [CrossRef]
  9. Borza, P.; Kaplani, E. An embedded microcontroller unit for PV module monitoring and fault detection. In Proceedings of the 2019 8th International Conference on Renewable Energy Research and Applications (ICRERA), London, UK, 27–28 April 2019; pp. 557–562. [Google Scholar]
  10. Wu, Y.-E.; Wang, J.-W. Novel high-efficiency high step-up DC–DC converter with soft switching and low component voltage stress for photovoltaic system. Processes 2021, 9, 1112. [Google Scholar] [CrossRef]
  11. Brooks, A.E.; Cormode, D.; Cronin, A.D.; Kam-Lum, E. PV system power loss and module damage due to partial shade and bypass diode failure depend on cell behavior in reverse bias. In Proceedings of the 2015 IEEE 42nd Photovoltaic Specialist Conference (PVSC), New Orleans, LA, USA, 14–19 June 2015; pp. 1–6. [Google Scholar]
  12. Ustun, T.S.; Nakamura, Y.; Hashimoto, J.; Otani, K. Performance analysis of PV panels based on different technologies after two years of outdoor exposure in Fukushima, Japan. Renew. Energy 2019, 136, 159–178. [Google Scholar] [CrossRef]
  13. Beránek, V.; Olšan, T.; Libra, M.; Poulek, V.; Sedláček, J.; Dang, M.-Q.; Tyukhov, I.I. New monitoring system for photovoltaic power plants’ management. Energies 2018, 11, 2495. [Google Scholar] [CrossRef] [Green Version]
  14. Espinosa-Gavira, M.J.; Agüera-Pérez, A.; González de la Rosa, J.J.; Palomares-Salas, J.C.; Sierra-Fernández, J.M. An on-line low-cost irradiance monitoring network with sub-second sampling adapted to small-scale PV systems. Sensors 2018, 18, 3405. [Google Scholar] [CrossRef] [PubMed] [Green Version]
  15. Chouder, A.; Silvestre, S.; Taghezouit, B.; Karatepe, E. Monitoring, modelling and simulation of PV systems using LabVIEW. Sol. Energy 2013, 91, 337–349. [Google Scholar] [CrossRef]
  16. Shariff, F.; Rahim, N.A.; Hew, W.P. Zigbee-based data acquisition system for online monitoring of grid-connected photovoltaic system. Expert Syst. Appl. 2015, 42, 1730–1742. [Google Scholar] [CrossRef]
  17. Kim, B.-K.; Park, J.-B.; Shen, J.; Kim, S.-Y.; Rho, D.-S. Implementation of monitoring and control systems for 50KW PV systems using the wire-wireless network. Int. J. Grid Distrib. Comput. 2012, 5, 45. [Google Scholar]
  18. Chen, C.-Y.; Liu, C.-Y.; Kuo, C.-C.; Yang, C.-F. Web-based remote control of a building’s electrical power, green power generation and environmental system using a distributive microcontroller. Micromachines 2017, 8, 241. [Google Scholar] [CrossRef] [Green Version]
  19. Rokonuzzaman, M.; Mishu, M.K.; Amin, N.; Nadarajah, M.; Roy, R.B.; Rahman, K.S.; Buhari, A.M.; Binzaid, S.; Shakeri, M.; Pasupuleti, J. Self-sustained autonomous wireless sensor network with integrated solar photovoltaic system for internet of smart home-building (IoSHB) applications. Micromachines 2021, 12, 653. [Google Scholar] [CrossRef]
  20. Sukič, P.; Štumberger, G. Intra-minute cloud passing forecasting based on a low cost iot sensor—A solution for smoothing the output power of PV power plants. Sensors 2017, 17, 1116. [Google Scholar] [CrossRef] [Green Version]
  21. Dangana, M.; Ansari, S.; Abbasi, Q.H.; Hussain, S.; Imran, M.A. Suitability of NB-IoT for indoor industrial environment: A survey and insights. Sensors 2021, 21, 5284. [Google Scholar] [CrossRef]
  22. Ansari, S.; Ayob, A.; Lipu, M.S.H.; Saad, M.H.M.; Hussain, A. A review of monitoring technologies for solar PV systems using data processing modules and transmission protocols: Progress, challenges and prospects. Sustainability 2021, 13, 8120. [Google Scholar] [CrossRef]
  23. Rashidi, Y.; Moallem, M.; Vojdani, S. Wireless Zigbee system for perormance monitoring of photovoltaic panels. In Proceedings of the 2011 37th IEEE Photovoltaic Specialists Conference, Piscataway, NJ, USA, 13 June 2011; pp. 3205–3207. [Google Scholar]
  24. Gomez, C.; Veras, J.C.; Vidal, R.; Casals, L.; Paradells, J. A sigfox energy consumption model. Sensors 2019, 19, 681. [Google Scholar] [CrossRef] [Green Version]
  25. Cattani, M.; Boano, C.A.; Römer, K. An experimental evaluation of the reliability of lora long-range low-power wireless communication. J. Sens. Actuator Netw. 2017, 6, 7. [Google Scholar] [CrossRef] [Green Version]
  26. Bor, M.; Vidler, J.; Roedig, U. LoRa for the Internet of Things. In Proceedings of the 1st International Workshop on New Wireless Communication Paradigms for the Internet of Things (MadCom), Graz, Austria, 15–17 February 2016; pp. 361–366. [Google Scholar]
  27. Rizzi, M.; Ferrari, P.; Flammini, A.; Sisinni, E. Evaluation of the IoT LoRaWAN solution for distributed measurement applications. IEEE Trans. Instrum. Meas. 2017, 66, 3340–3349. [Google Scholar] [CrossRef]
  28. Rohan, C.; Audet, J.; Keating, A. Small split-ring resonators as efficient antennas for remote lora IoT systems—A path to reduce physical interference. Sensors 2021, 21, 7779. [Google Scholar] [CrossRef] [PubMed]
  29. Li, L.; Ren, J.; Zhu, Q. On the application of LoRa LPWAN technology in sailing monitoring system. In Proceedings of the 2017 13th Annual Conference on Wireless On-demand Network Systems and Services (WONS), Jackson Hole, WY, USA, 21–24 February 2017; pp. 77–80. [Google Scholar]
  30. Marais, J.M.; Malekian, R.; Abu-Mahfouz, A.M. LoRa and LoRaWAN testbeds: A review. In Proceedings of the 2017 IEEE African, Cape Town, South Africa, 18–20 September 2017; pp. 1496–1501. [Google Scholar]
  31. Su, Z.; Lin, Y.; Shen, V.R.L. Intelligent Environmental Monitoring System based on LoRa Long Range Technology. In Proceedings of the 2019 IEEE Eurasia Conference on IOT, Communication and Engineering (ECICE), Yunlin, Taiwan, 3–6 October 2019; pp. 354–357. [Google Scholar]
  32. Penã Queralta, J.; Gia, T.N.; Zou, Z.; Tenhunen, H.; Westerlund, T. Comparative study of LPWAN technologies on unlicensed bands for M2M communication in the IoT: Beyond LoRa and LoRaWAN. Procedia Comput. Sci. 2019, 155, 343. [Google Scholar] [CrossRef]
  33. Adelantado, F.; Vilajosana, X.; Tuset-Peiro, P.; Martinez, B.; Melia-Segui, J.; Watteyne, T. Understanding the limits of LoRaWAN. IEEE Commun. Mag. 2017, 55, 34–40. [Google Scholar] [CrossRef] [Green Version]
  34. Mohammad, Z.; Morteza, A.N.; Padmanaban, S.; Pandav, K.M.; Holm-Nielsen, J.B. Energy management strategy for solid-state transformer-based solar charging station for electric vehicles in smart grids. IET Renew. Power Gener. 2020, 14, 3843–3852. [Google Scholar]
  35. Tseng, K.-H.; Chung, M.-Y.; Chen, L.-H.; Chang, P.-Y. Green smart campus monitoring and detection using LoRa. Sensors 2021, 21, 6582. [Google Scholar] [CrossRef]
  36. Azimi Nasab, M.; Zand, M.; Eskandari, M.; Sanjeevikumar, P.; Siano, P. Optimal planning of electrical appliance of residential units in a smart home network using cloud services. Smart Cities 2021, 4, 1173–1195. [Google Scholar] [CrossRef]
Figure 1. The conventional PV junction box configuration in a PV system.
Electronics 11 00709 g001
Figure 2. The configuration of the TX module in proposed PV junction box.
Electronics 11 00709 g002
Figure 3. The configuration of the RX module for monitoring the PV junction box.
Electronics 11 00709 g003
Figure 4. A flow chart of the proposed operation algorithm in PV junction box monitoring system.
Electronics 11 00709 g004
Figure 5. The schematic diagram of the proposed PV junction box monitoring system.
Electronics 11 00709 g005
Figure 6. The configuration of TTGO LoRa32 V2.0 module for proposed PV junction box monitoring system.
Electronics 11 00709 g006
Figure 7. The assembled PV junction box with TX module.
Electronics 11 00709 g007
Figure 8. The manufactured RX module, including TTGO LoRa32 V2.0 module, LCD screen, Li-Pol battery, etc.
Electronics 11 00709 g008
Figure 9. The experiment setup of proposed PV junction box system: (a) the proposed PV junction box monitoring system connected to a 3 kW PV system; (b) the GUI of the RX module that displays the PV junction box information.
Electronics 11 00709 g009
Figure 10. The location of the PV junction box monitoring system and the travel route of the RX module.
Electronics 11 00709 g010
Figure 11. The result of fault detection experiment obtained in database.
Electronics 11 00709 g011
Figure 12. RSSI and PER measurements from RX module, recorded as distance in the NLOS environment.
Electronics 11 00709 g012
Figure 13. The RSSI measured in the house during the day.
Electronics 11 00709 g013
Figure 14. The LoRa RSSI compared to WIFI, according to indoor and outdoor distances.
Electronics 11 00709 g014
Figure 15. The warning message and PV junction box conditions displayed on the LCD screen of monitoring device: (a) Pop-up warning message; (b) PV junction box component status for each PV array.
Electronics 11 00709 g015
Figure 16. Various data obtained from PV junction box for a day in summer: (a) Power and energy flow; (b) Voltage, current and temperature flow.
Electronics 11 00709 g016aElectronics 11 00709 g016b
Figure 17. Various data obtained from PV junction box for a day in winter: (a) Power and energy flow; (b) Voltage, current and temperature flow.
Electronics 11 00709 g017
Table 1. Specification of TTGO LoRa32 V2.0 module.
ParameterValueUnit
Input voltage5VDC
Acceptable current10–14mA
Frequency band915MHz
Transmission power20dBm
Receiver sensitivity−139dBm
I/O ports18pin
Operation temperature−40–85°C
Table 2. The PV junction box information stored in the database.
DateEnergyRunning TimeMax. TempFuse StatusDiode Status
July/25/202113.8 kWh846 min65.3 °CNormalNormal
July/26/202115.1 kWh852 min68.1 °CNormalNormal
July/27/202117.2 kWh859 min72.8 °CNormalNormal
July/28/202116.7 kWh856 min74.2 °CNormalNormal
July/29/202116.9 kWh855 min73.7 °CNormalNormal
July/30/202117.3 kWh850 min72.0 °CNormalNormal
November/22/20218.8 kWh624 min39.2 °CNormalNormal
November/23/20219.6 kWh630 min39.5 °CNormalNormal
November/24/202111.2 kWh613 min43.9 °CNormalNormal
November/25/202112.1 kWh617 min48.9 °CNormalNormal
November/26/202114.9 kWh614 min52.4 °CNormalNormal
November/27/202114.6 kWh613 min48.5 °CNormalNormal
Publisher’s Note: MDPI stays neutral with regard to jurisdictional claims in published maps and institutional affiliations.

