Article

Sensitivity Characterization of Multi-Band THz Metamaterial Sensor for Possible Virus Detection

School of Electrical Engineering, University of Belgrade, Bulevar Kralja Aleksandra 73, P.O. Box 35-54, 11120 Belgrade, Serbia
*
Author to whom correspondence should be addressed.
Electronics 2022, 11(5), 699; https://doi.org/10.3390/electronics11050699
Submission received: 31 December 2021 / Revised: 4 February 2022 / Accepted: 11 February 2022 / Published: 24 February 2022
(This article belongs to the Special Issue Advances in Micro- and Nano-Electronics)

Abstract

:
The recent COVID-19 pandemic has shown that there is a substantial need for high-precision reliable diagnostic tests able to detect extremely low virus concentrations nearly instantaneously. Since conventional methods are fairly limited, there is a need for an alternative method such as THz spectroscopy with the utilization of THz metamaterials. This paper proposes a method for sensitivity characterization, which is demonstrated on two chosen multi-band THz metamaterial sensors and samples of three different subtypes of the influenza A virus. Sensor models have been simulated in WIPL-D software in order to analyze their sensitivity both graphically and numerically around all resonant peaks in the presence of virus samples. The sensor with a sandwiched structure is shown to be more suitable for detecting extremely thin virus layers. The distribution of the electric field for this sensor suggests a possibility of controlling the two resonant modes independently. The sensor with cross-shaped patches achieves significantly better Q-factors and refractive sensitivities for both resonant peaks. The reasoning can be found in the wave–sample interaction enhancement due to the better electromagnetic field confinement. A high Q-factor of around 400 at the second resonant frequency makes the sensor with cross-shaped patches a promising candidate for potential applications in THz sensing.

1. Introduction

The current COVID-19 pandemic has placed enormous pressure on medical diagnostics to provide the fastest results possible in order to stop the spread of the virus and provide the best medical care to infected patients. Besides SARS-CoV-2, which has caused the recent outbreak, there are many viruses with significant potential to lead to future pandemics. One of the most concerning groups are respiratory viruses such as avian influenza (AI) virus whose subtypes were used as samples in this paper, as they tend to spread not only by contact but also via droplets and aerosols which makes their transmission particularly difficult to control [1]. Proper surveillance is then essential not only for monitoring seasonal outbreaks but for detecting unusual events that may indicate novel virus types [2].
All of the above emphasizes the need for high-precision reliable diagnostic tests able to detect extremely low virus concentrations nearly instantaneously. Conventional methods such as real-time polymerase chain reaction or loop-mediated isothermal amplification (molecular approach), chemiluminescence immunoassay, and enzyme-linked immunosorbent assay (immuno-based detection) often do not satisfy all mentioned requests as they have certain limitations reflected in their high time consumption, difficulties during use and/or poor sensitivity [3]. In order to overcome these deficiencies and increase the general effectiveness of tests, researchers have been looking for alternative label-free methods for virus detection [4].
One of the proposed methods that has attracted worldwide interest is THz spectroscopy. In the THz range, the excitation of intra and intermolecular vibrations is greater than the absorption which marks THz technology as effective in sensing applications [5]. Terahertz range correlates to the vibrational resonances of significant biomolecules such as proteins, RNA, and DNA [6]. In addition, THz technology is known for its non-ionizing nature which makes it suitable for label-free sensing. At the same time, THz wavelengths can be much larger than the size of particles in the sample which results in low spatial resolution. Therefore, there is a need to maximize the interaction between particles and generated waves which can be achieved by utilizing THz metamaterials [7]. From a macroscopic perspective, metamaterials can be regarded as homogenous materials, but they are in fact matrices of meta-atoms with electric and magnetic resonances [8]. The electromagnetic (EM) properties of metamaterials strongly depend on the design of meta-atoms which is highly customizable in terms of the choice of geometry and materials. As a result, many different THz metamaterials were investigated through computer simulations and laboratory measurements for various applications [9,10,11].
Detectors based on THz metamaterials are proven to be capable of the accurate screening process and detection of biomaterials such as viruses [6]. In terms of the virus particle size, they cover a wide range of dimensions, from 30 nm for bacteriophage to around 120 nm for SARS-CoV-2. These detectors can be realized as absorbers, reflectors, or antennas. For example, the THz absorber for AI virus detection presented in [12] uses a Jerusalem cross metamaterial cell based on spoof surface plasmon polaritons resonance mode. Metamaterial reflector could be implemented using graphene H shapes at a semiconductor substrate as shown in [13] where the detection of AI viruses has been performed by observing the reflection response. An example of slot antenna realization with silver nano-wires to improve virus detection is given in [14]. Plasmonic sensors for detecting Zika viruses could use particles of gold in order to improve sensor quality [15]. A multi-resonance detecting chip presented in [16] was used to detect the AI virus concentration from the obtained transmittance. Transmission spectrum has also been observed in [17] for the purpose of detecting PRD1 and MS2 viruses using THz metamaterial with split-ring resonators.
In general, THz sensing methods are based on (i) measuring the shifts in resonant frequencies produced by the refractive change of the sensor surrounding caused by the presence of sample or (ii) measuring the absorption spectrum to identify the peaks that correspond to the investigated sample. If using the sensing method based on the frequency shift, a narrower peak and high Q-factor (defined as fresonant/FWHM where FWHM is a full-width at half-maximum) are needed in order to provide a better resolution for the frequency shifting. Narrowband THz perfect metamaterial absorbers (PMAs) have become valuable candidates for such sensing techniques. However, their bandwidths are typically larger than 10% of the central resonant frequency which results in a relatively low Q-factor [18]. In order to improve the sensing capabilities of narrowband PMAs by increasing Q-factor, many different physical mechanisms have been exploited such as reduction of material losses by eliminating the middle layer of dielectric in typical metal–dielectric–metal structures or suppressing the absorption and radiation loss by the diffraction grating induced guided resonance mode [19,20].
In this paper, we propose a novel method for sensitivity analysis that should provide detailed sensing characterization of the chosen sensor and assist in its practical use. The main goal of the proposed method is to accompany the complete process of detection, from choosing the right sensor for the application of interest to the analysis of measurement data in order to determine the properties of an unknown sample. Therefore, it should be able to provide a suitable comparison of different sensors, showcase both strengths and weaknesses of the chosen sensor, facilitate utilization in the laboratory conditions and finally, help in collecting, organizing, and processing the obtained data.
In order to respond to all of the mentioned requests as well as possible, the proposed method uses a combined graphical and numerical approach. The graphical part considers detection curves for different samples and contributes to easier visualization of the sensor capabilities to estimate the properties of the specific sample. Additionally, it can be utilized in the laboratory for the rapid assessment of measurement results. On the other hand, the numerical part of our method offers numerous possibilities for a detailed characterization of both sensor and the obtained results as it complements the graphical part in terms of precision.
The method was demonstrated on two different PMAs. In Section 2, the properties of the chosen sensors and virus samples are thoroughly described. In Section 3, the proposed method for sensitivity analysis will be presented and supported with the results obtained through 3D EM simulations of the chosen PMAs with and without deposited virus samples. The conclusions drawn from the analysis will be presented in Section 4.

2. Materials and Methods

Two different dual-band THz PMAs have been chosen for the purpose of demonstration as they produce more complex frequency responses and therefore require broader sensitivity analysis compared to the single-band sensors. The first PMA is a conventional planar metal-dielectric-metal sandwiched structure presented in [21]. The second PMA is based on a dielectric/metal structure from [20] whose dimensions we have optimized for the chosen virus samples. We will refer to these two absorbers as SquarePMA and CrossPMA, respectively.

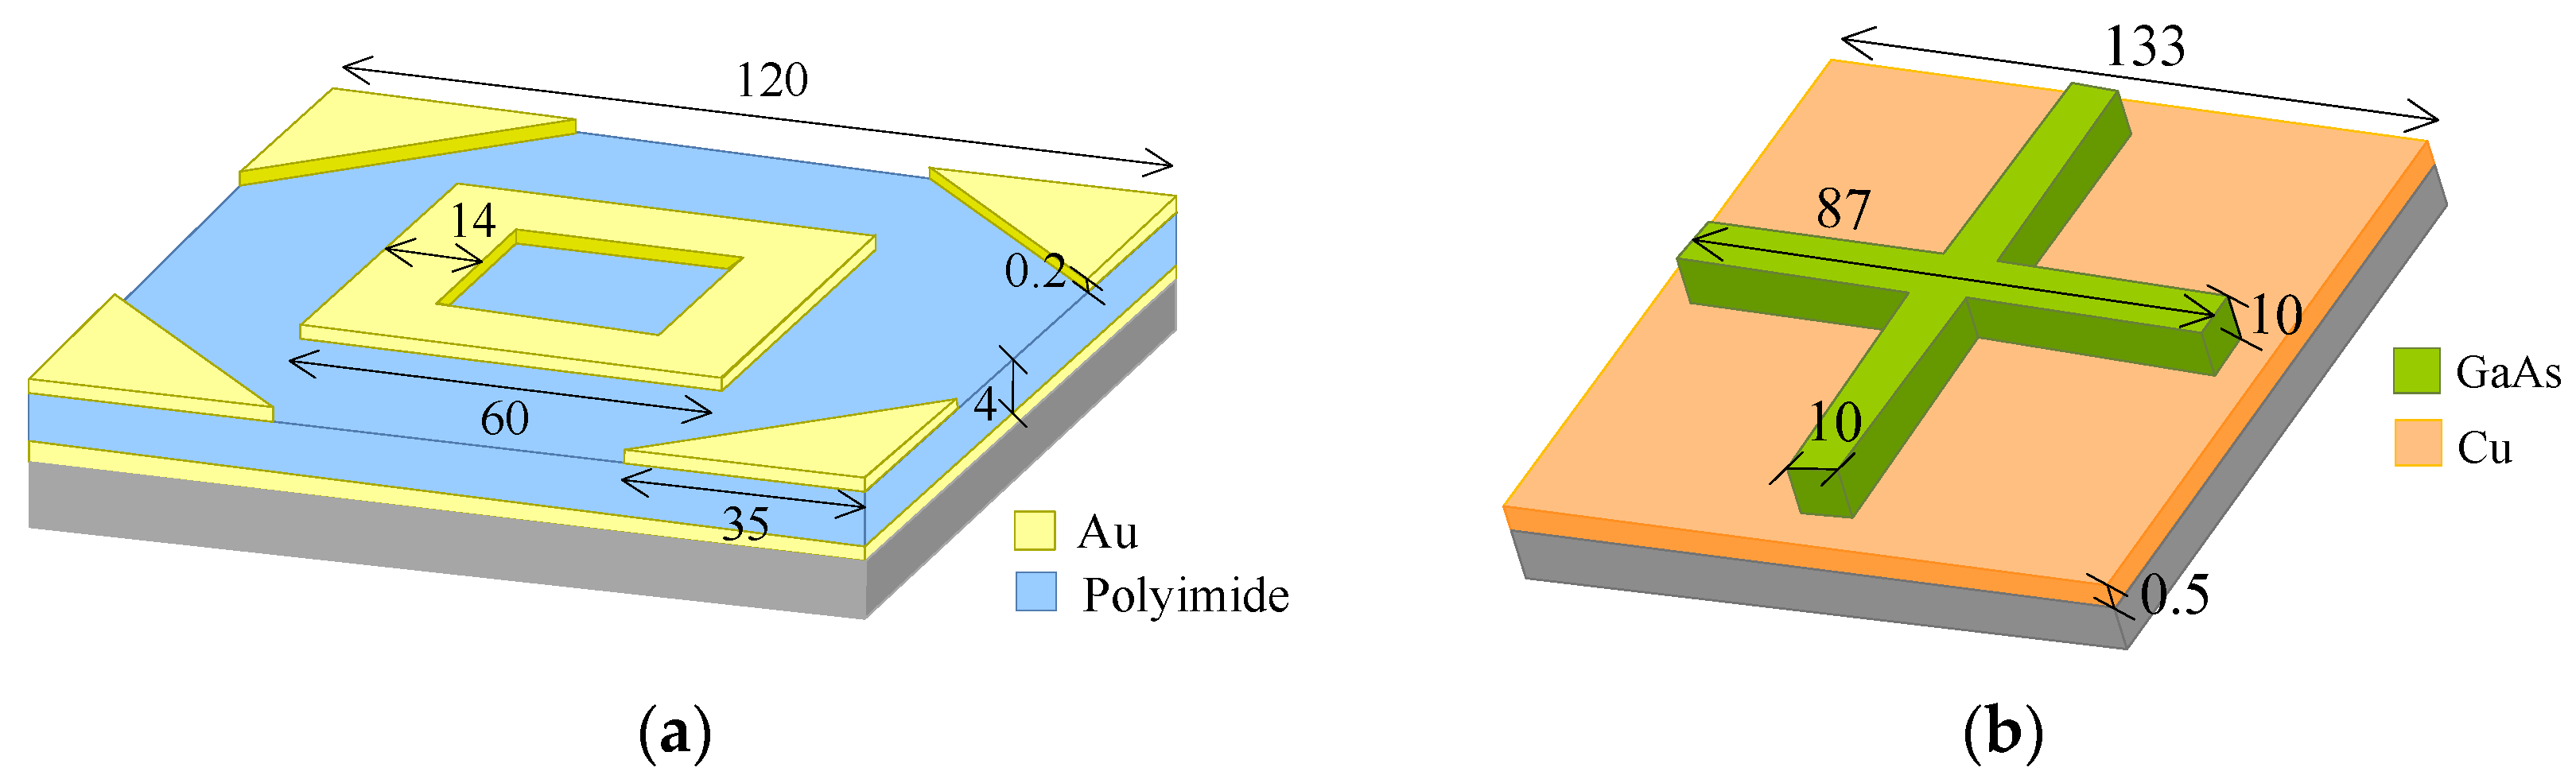
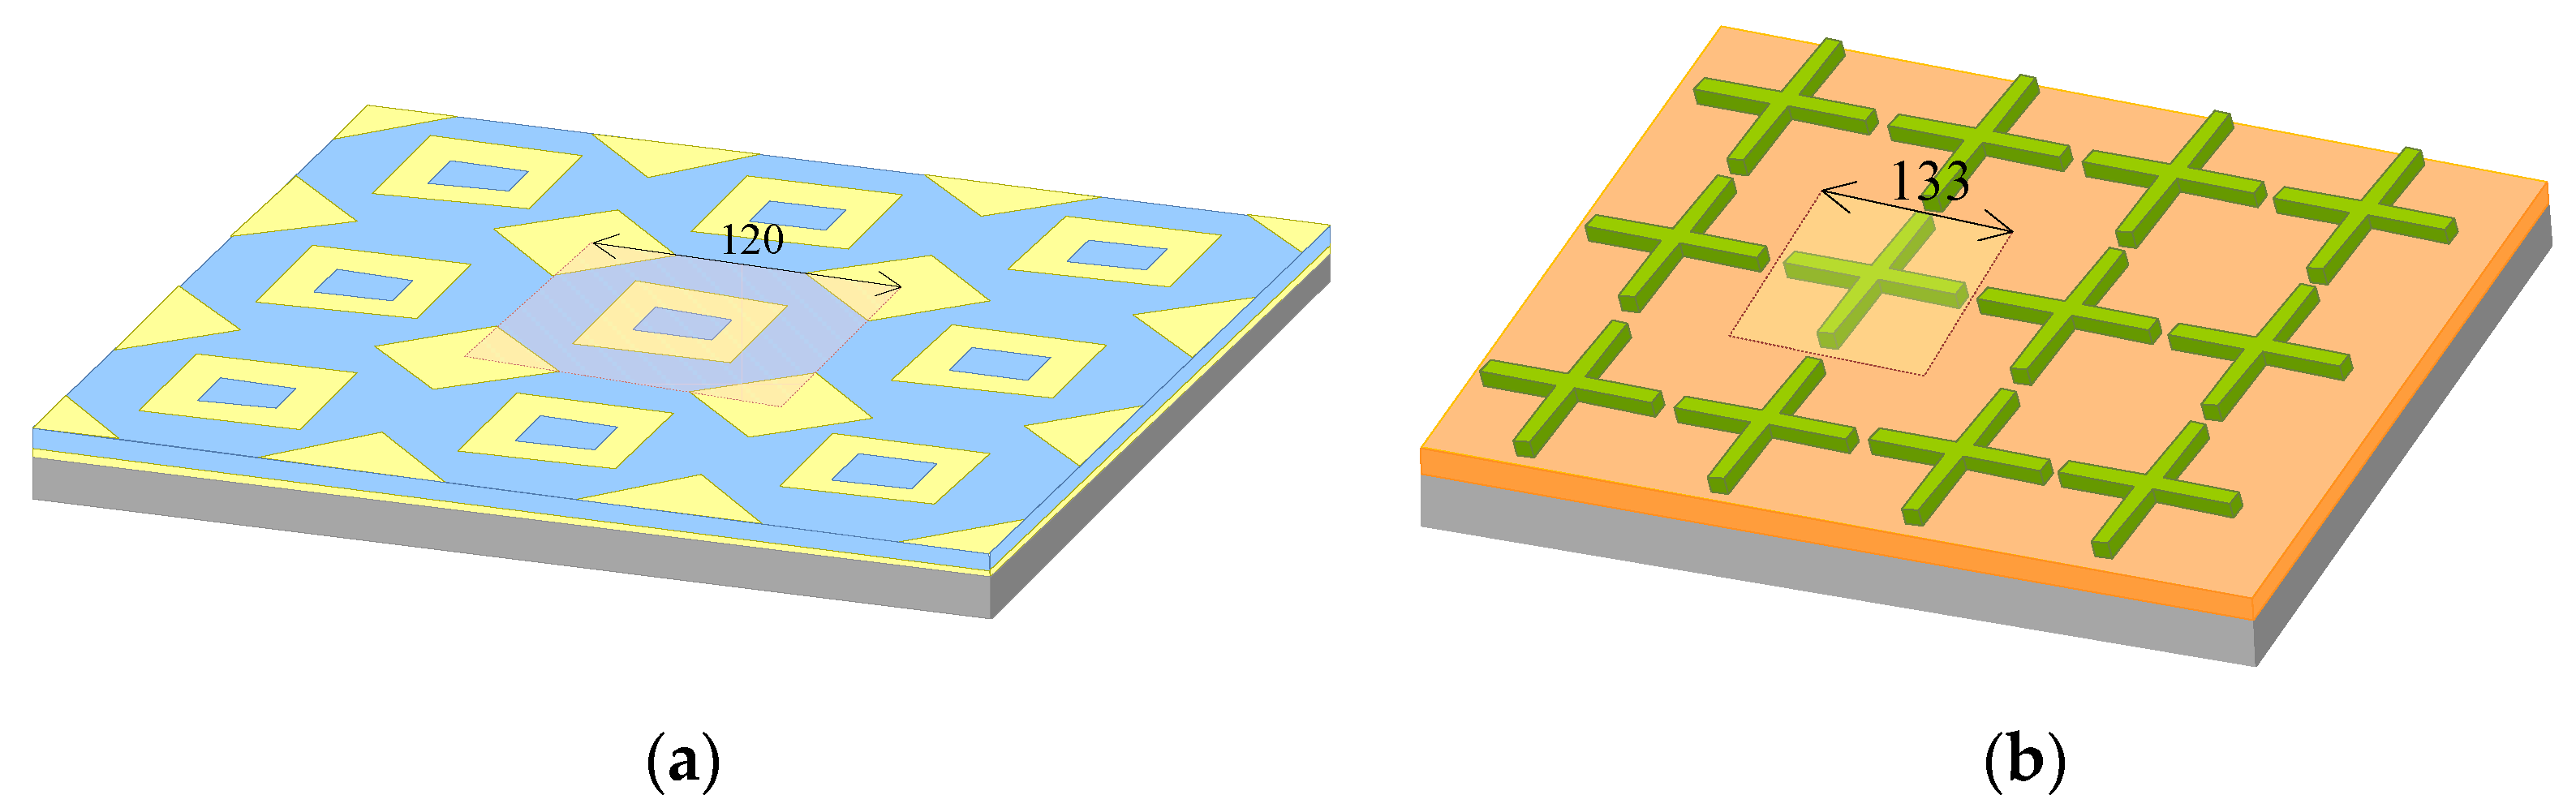
2.1. Unit Cells Design and Modelling
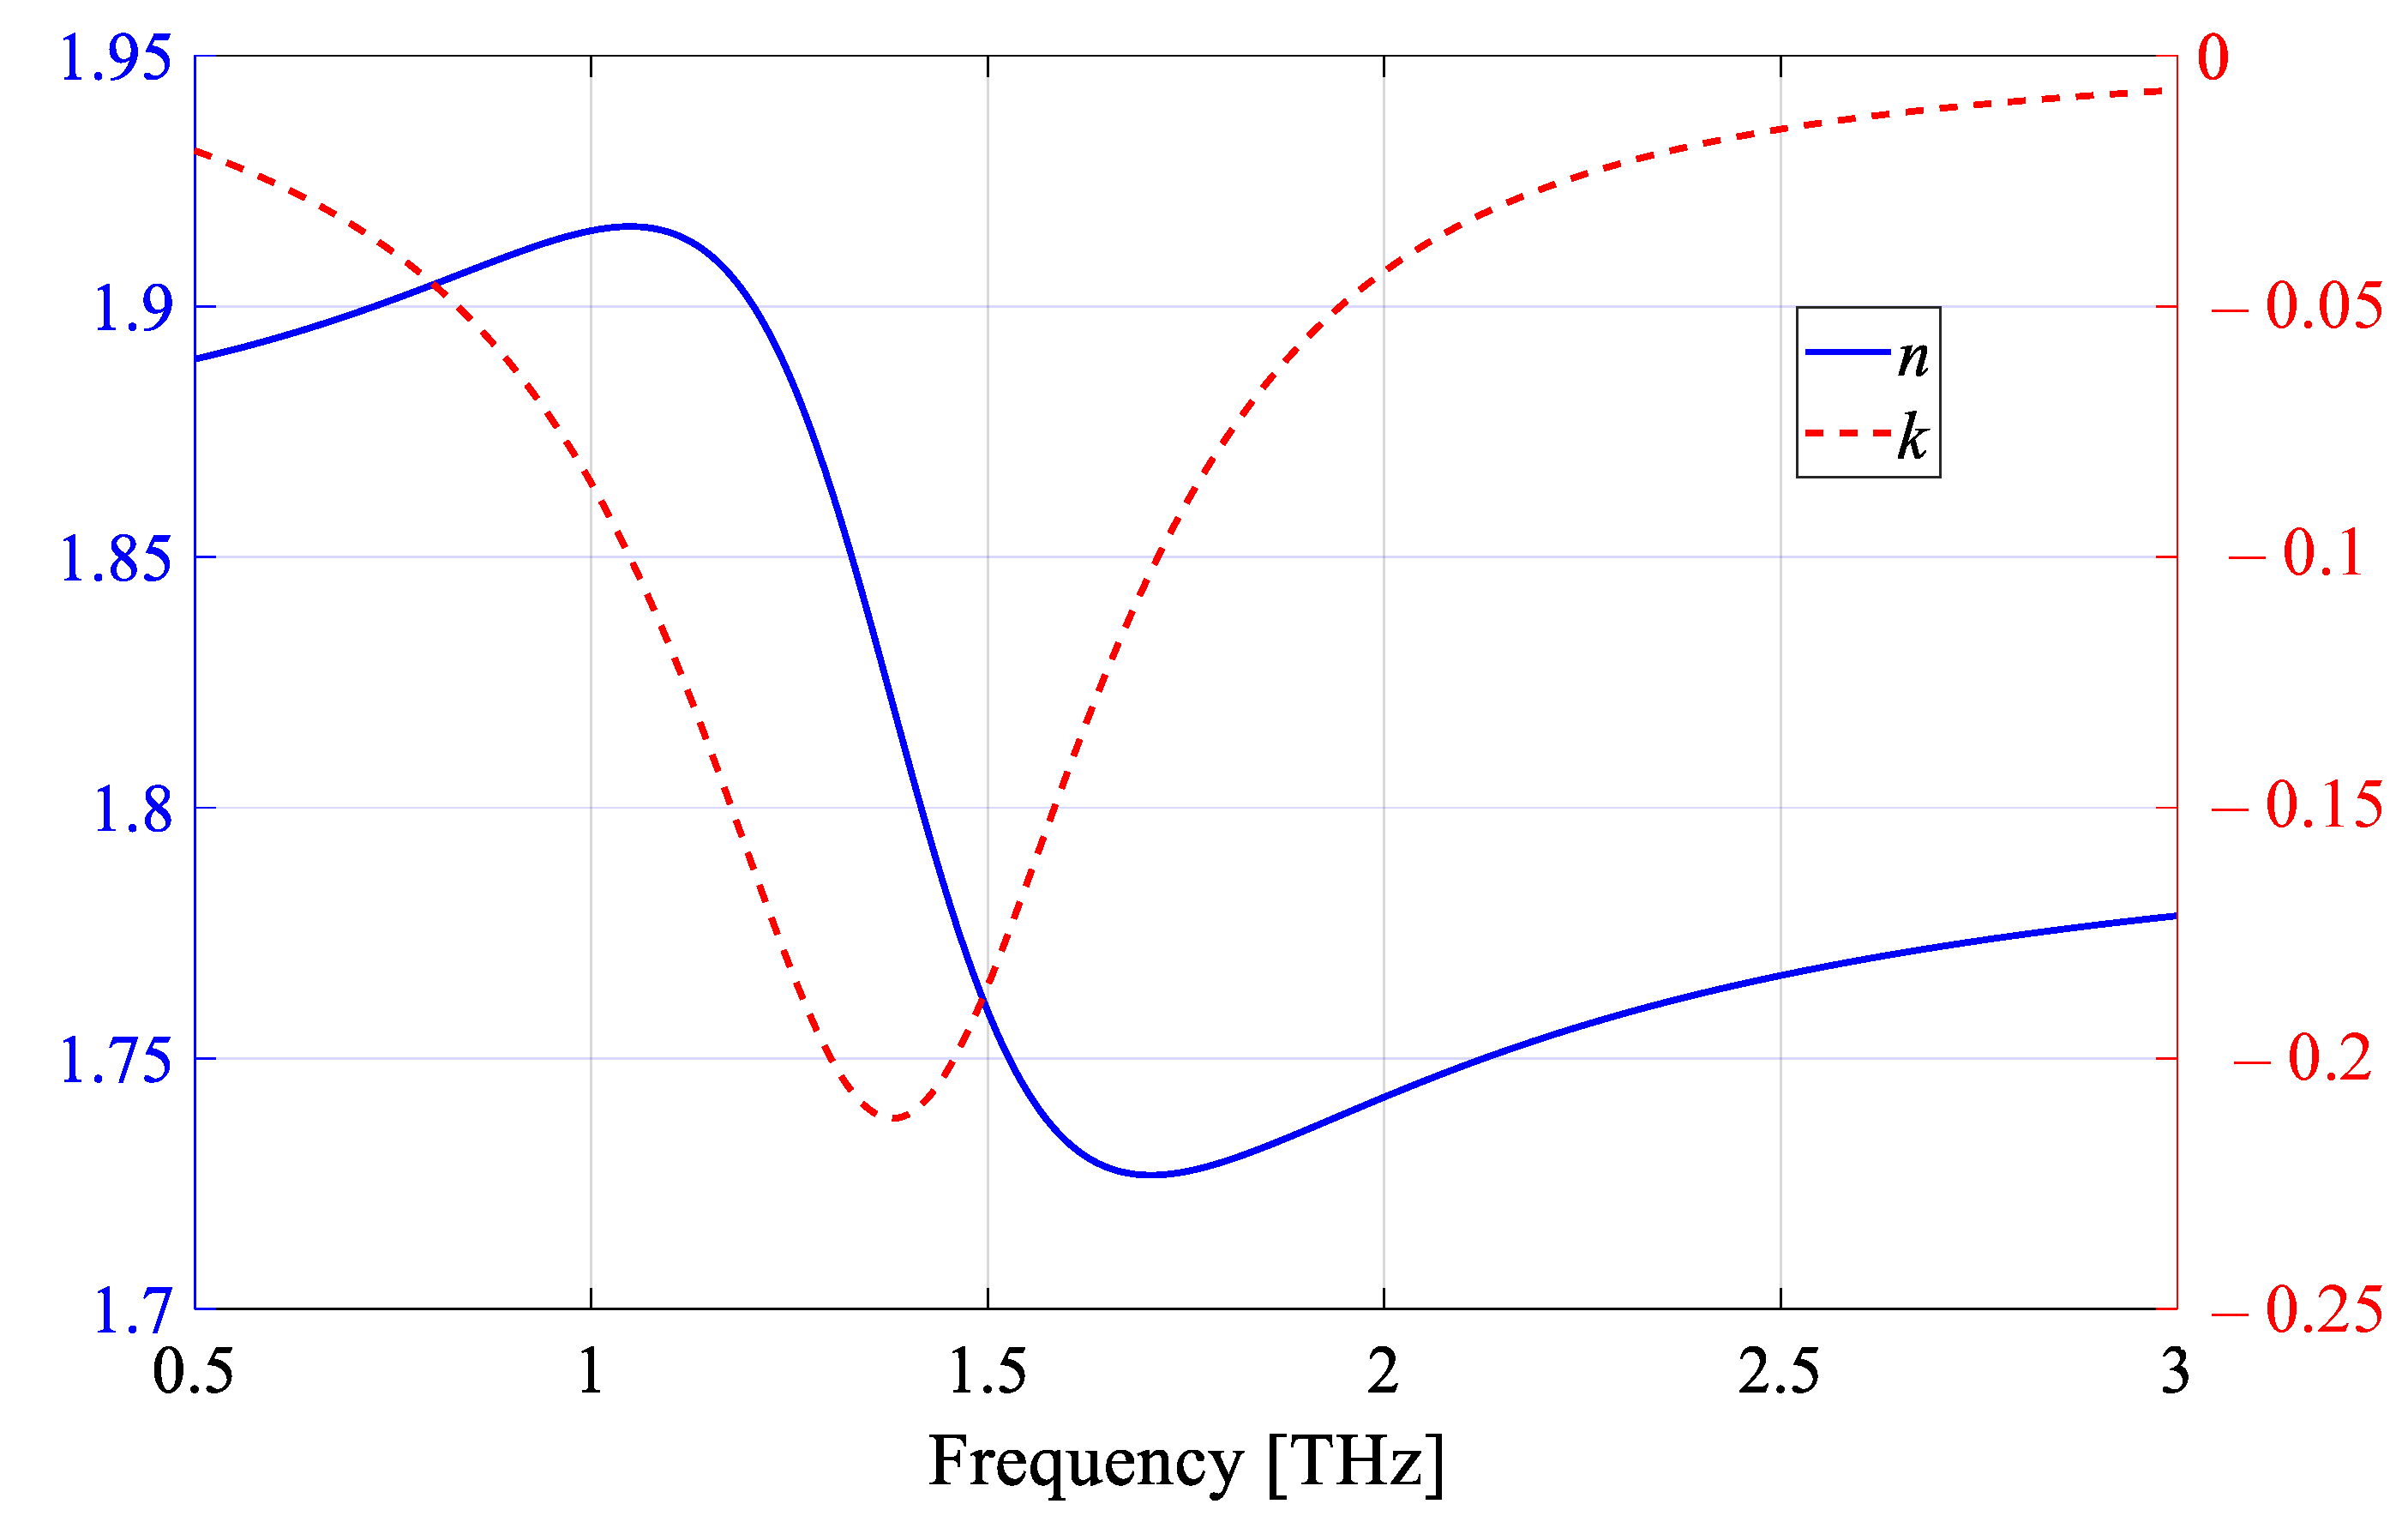
The unit cells of SquarePMA and CrossPMA are presented in Figure 1a,b, respectively. The SquarePMA unit cell structure is composed of a ground layer and a resonator both made of gold with a layer of polyimide of ε = 3.5 ( 1 + j 0.0027 ) in between. The resonator involves a square frame and four orthogonal triangles. The CrossPMA unit cell consists of a cross-shaped patch made of GaAs with ε = 12.9 + j 0.0774 printed on a copper film. The dimensions of interest are given in Figure 1.
The conductivity of both gold and copper varies with the increase in frequency. This variation can be taken into account by using the Drude model:
σ = ε 0 ω p 2 γ j ω
where ω p = 2 π f p is the plasma frequency and γ is the damping rate. The corresponding values are 1.32∙1016 s−1 and 10.5∙1013 s−1 for copper and 1.35∙1016 s−1 and 12.8∙1013 s−1 for gold [22].
Additionally, the thickness of the metallic ground layer for both PMAs is over the skin depth for all operating frequencies which is crucial in order to minimize the dissipation loss and achieve better confinement in the sensor structure. The ground layer provides isolation between the substrate and the metamaterial sensor thus eliminating the effect of electric field decay [23].
The proper modeling of a complete metamaterial sensor structure requires repeating described unit cells periodically along the x- and y-axes, thus creating the orthogonal lattices shown in Figure 2.
The metamaterial structures from Figure 2 have been modeled in WIPL-D software by using periodic boundary conditions (PBC) along the x- and y-axes. PBC option is only available in the scatterer operation mode [24]. For these particular structures, we have chosen the bistatic radar cross-section (RCS) mode as the position of the field generator is fixed all the time. Port 1 and Port 2 have been placed above and below the structures, respectively. Port 1 was illuminated by the TEM plane wave propagating along the z-axes.
As a result of WIPL-D simulations, we have obtained frequency-dependent scattering parameters of the observed sensor structures. With Port 1 being the excited port, two main parameters of interest are s 11 and
s 21 which give valuable information about the incident power distribution after the interaction. The incident power divides into reflected, transmitted, and absorbed power, all completely described by the obtained scattering parameters. Transmitted power defined through normalized transmitted power | s 21 | 2 is negligible because of the metallic ground plane. Reflected power defined through normalized reflected power | s 11 | 2 is not as small as transmitted power and it varies greatly with the change of frequency. Under these conditions, absorbed power is defined through the absorption (A) in the simplified form:
A = 1 | s 11 | 2
According to (2), local minima of | s 11 | correspond to the local maxima of A. For the purpose of this analysis, we have chosen to observe the absorption response rather than the reflection response since the chosen THz metamaterial sensors are designed as PMAs.

2.2. Virus Samples

The main sample selection criterion that we have set in order to thoroughly explore the sensing capabilities of the chosen sensors is the existence of many subtypes with relatively similar optical properties. We also wanted to investigate whether these sensors are appropriate for the relevant medical purpose. For these reasons, we have chosen three different subtypes of influenza A virus (IAV)—H1N1, H5N2, and H9N2. IAVs are RNA viruses that represent a major threat to human health as they can cause highly contagious respiratory illnesses. The potential pandemic risk posed by IAV subtypes is constantly assessed through regular monitoring and even evaluation tools developed with assistance from influenza experts. Subtypes that have been used as samples in this paper are currently mostly marked as subtypes with moderate risk [25].
We have modeled all three virus subtypes as dielectric layers that continuously cover the top surface of the sensor. The frequency-dependent complex permittivity of samples has been calculated by squaring the complex refractive index (ñ = n + j k) for each used frequency. In order to obtain ñ, we have used the Drude–Lorentz model:
n ˜ = ε = 1.5 2 ω p 2 ω 2 ω 0 2 + j ω γ
where ε is the complex permittivity, ω p = 4 10 12 s 1 is the plasma frequency,
ω 0 = 2.8 π 10 12 s 1 is the resonant frequency and γ = 4 10 12 s 1 is the damping coefficient. Then, we modified n ˜ for each virus strain according to optical properties retrieved by THz spectroscopy given in Table 1 [26]. An example of the dependence of the refractive index on frequency is given for H9N2 in Figure 3.
The refractive index of the sample depends on the virus concentration as Table 1 suggests. Consequently, two samples of different concentrations of the same virus subtype can be regarded in a similar manner as two samples of different virus subtypes.

3. Results and Discussion

The results for chosen dual-band THz metamaterial sensors are presented with a focus on the characterization of their performance in the process of IAV detection.

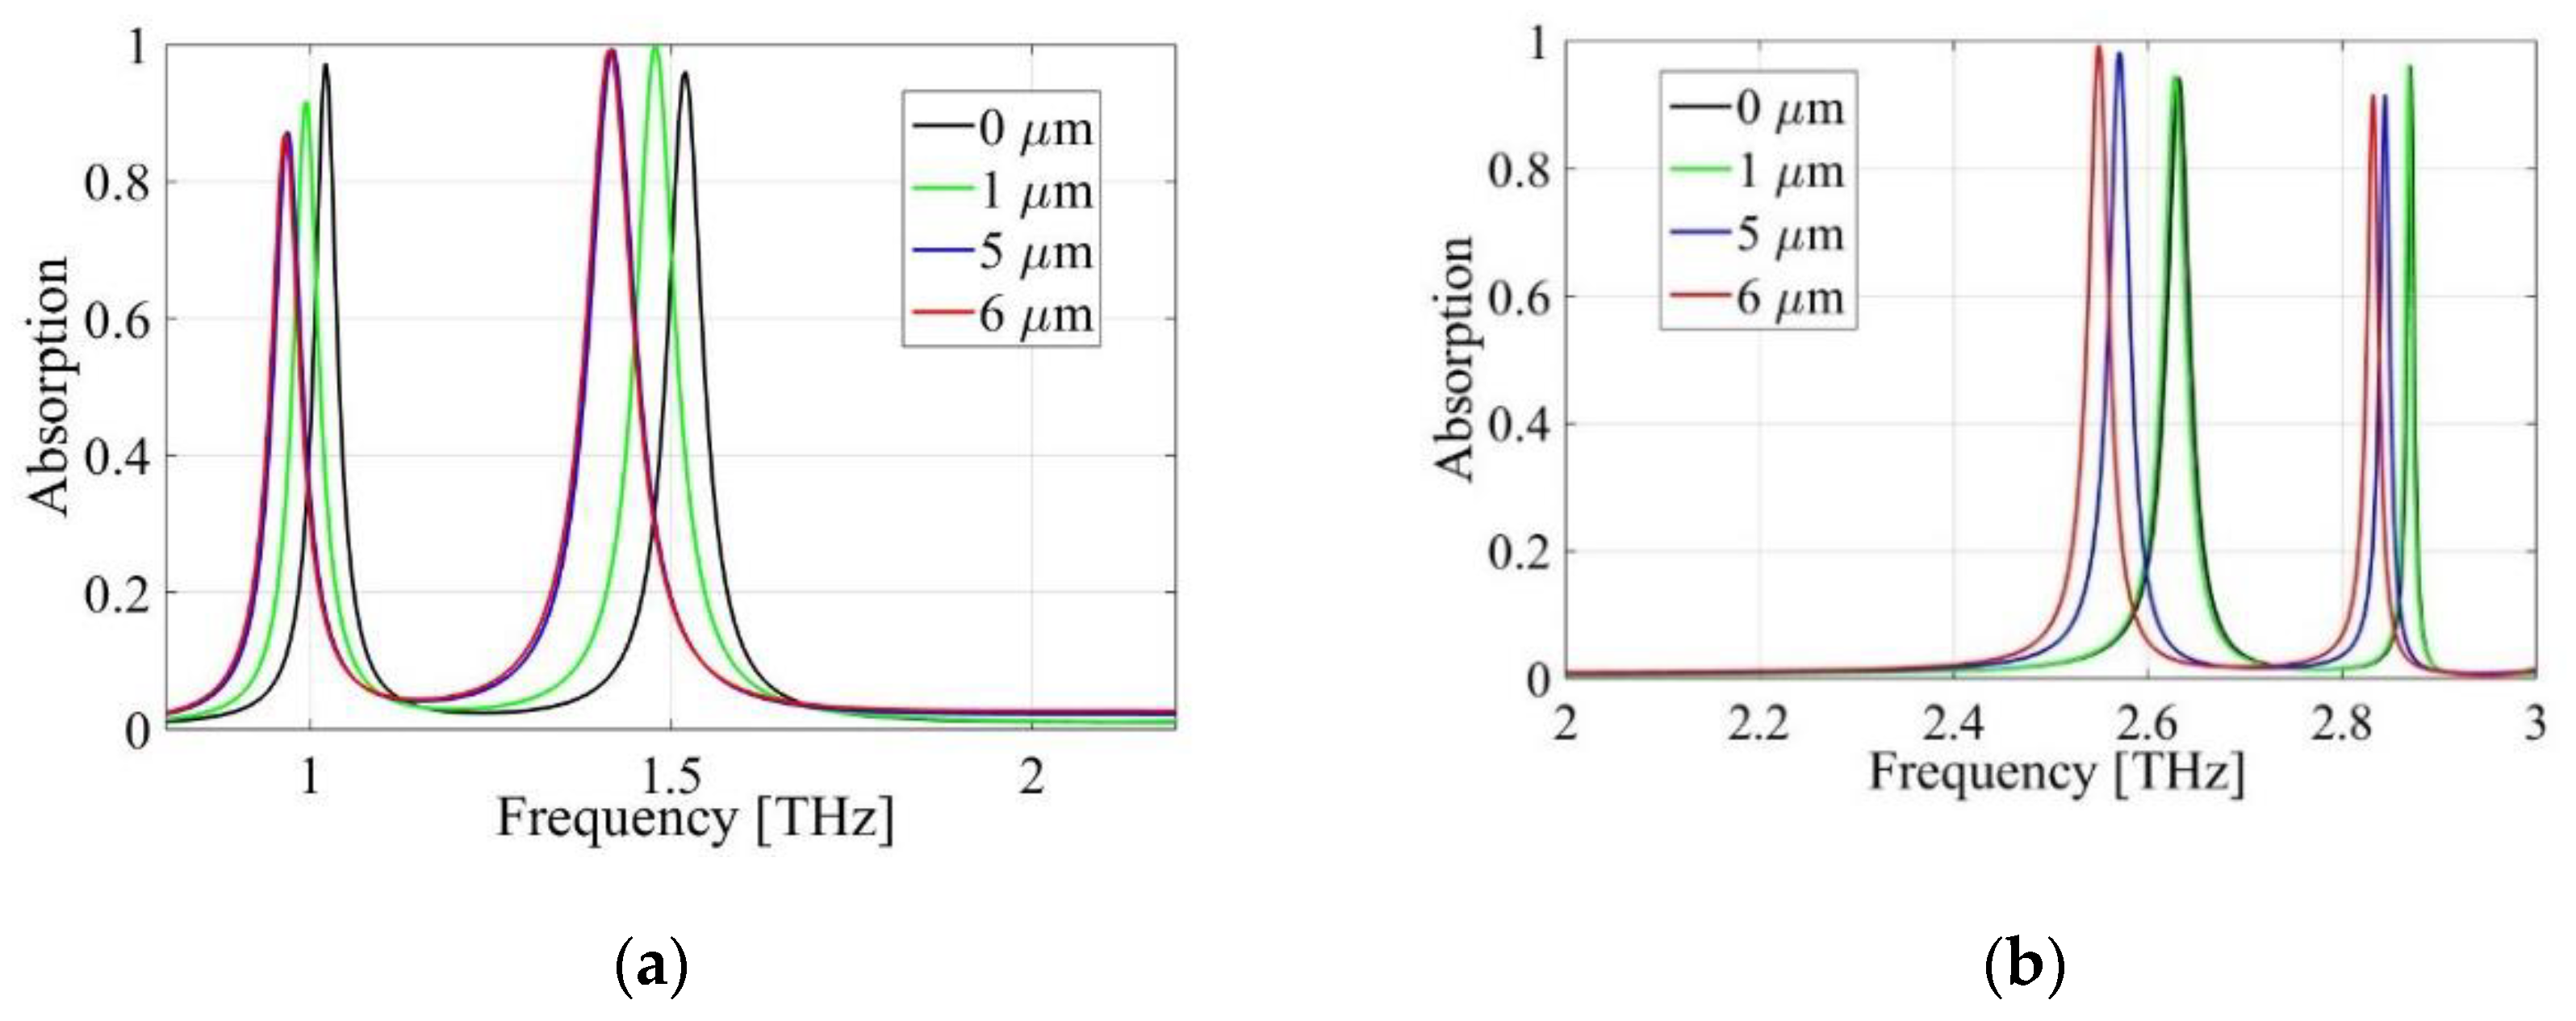
3.1. Absorption Responses of Sensor

The absorption responses for the SquarePMA and CrossPMA are given in Figure 4.
Figure 4a shows two resonant peaks with high values of absorption of 97.25% and 96.03%. The strong absorption can be contributed to the combination of two effects. The first one is the impact of the top metallic layer and the second one is the Fabry–Pérot effect due to the multi-reflection between two metallic layers [27]. FWHM (full-width at half-maximum) for the absorption peaks are 39 GHz and 59 GHz, respectively. The corresponding Q-factors are 26.2 and 25.8.
Figure 4b reveals two distinct resonant peaks with absorptions of 94.26% and 96.06%, respectively. FWHM of the first absorption peak is 28 GHz with a relatively high Q value of about 94. The second peak is significantly narrower with an FWHM of 7 GHz which results in a 4.36 times higher Q-factor of 410. The narrow absorption peak can be attributed to the combined effect of the surface lattice resonance of the cross-shaped resonator array and the guided mode in the GaAs cross patch as suggested in [20].
A review of parameters for estimating sensing performance is given for both PMAs in Table 2.

3.2. Principles of Detection

The differences between the absorption responses of the chosen sensors with and without a presence of the sample have been observed. The examples given in Figure 5 correspond to three different thicknesses of H9N2 layers.
Figure 5 shows that as the thickness increases, the resonant peak shifts to the left towards the lower frequencies. By determining the frequency shift between the original peak and the peak shifted due to the presence of the sample, virus detection can be performed and its thickness value can be determined. Figure 5a indicates that the frequency shifting of the SquarePMA absorption peaks decreases with the increase in virus layer thickness. On the contrary, the peaks of CrossPMA response experience greater shifts for thicker layers as shown in Figure 5b.
It should be noted that the frequency shift is not the only possible reference parameter, as the amplitude of the absorption peaks also varies with the modifications of the sample. Although the peak amplitude is less noise-resistant and therefore impractical to become the main reference parameter, it can be used in the manner that will be discussed later in the paper. A physical mechanism behind the modulation of the PMA resonant frequency and amplitude involves the redistribution of electric and magnetic fields when the sample is deposited on the top layer of sensors [23].

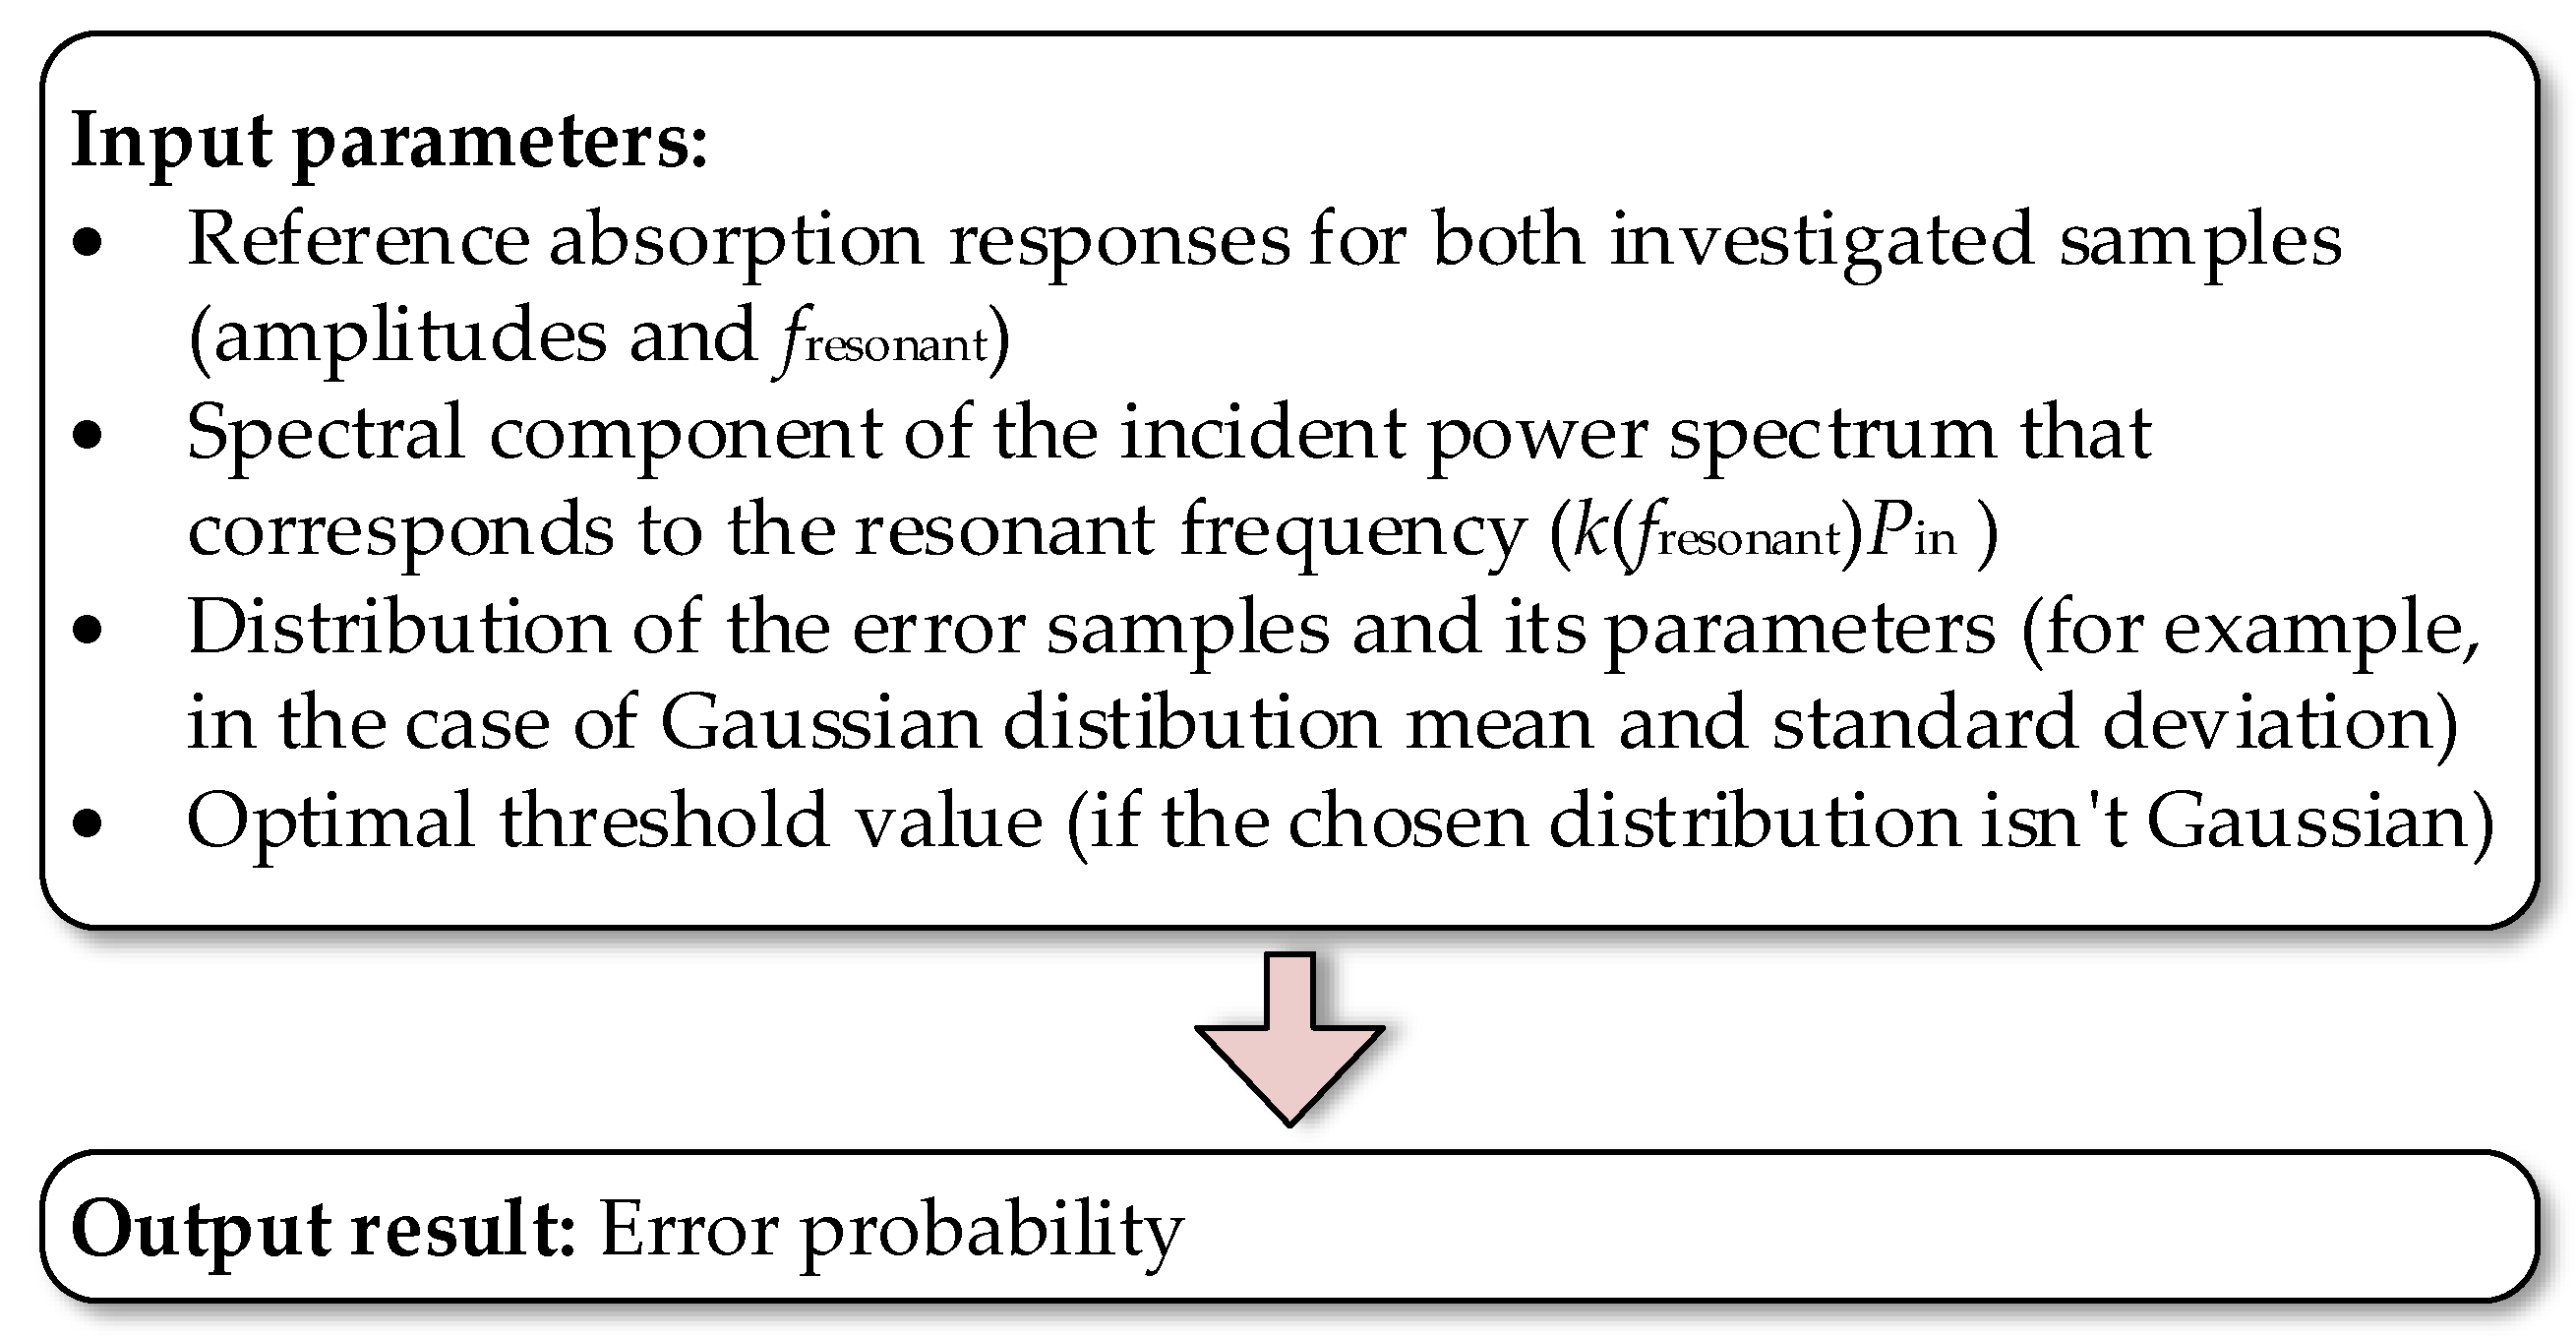
3.3. Introducing Quantities of Interest for Sensitivity Analysis

Our starting point in developing this method was the graphical representation of peak frequency shift in terms of the virus layer thickness. Examples of mentioned graphic representations are shown in Figure 6. The detection curve given in Figure 6a saturates for certain virus layer thickness which limits the sample thickness that can be detected with a relatively small probability of error. The main reason for that is found in an abrupt expansion of the range of thickness values that correspond to the same frequency shift after reaching the critical value ( d max ) which represents the maximal sample thickness that can be properly detected.
If we name the saturation frequency shift Δfsat and the resolution of measuring system Δfres, we can determine d max using the following formula:
d max = d ( Δ f sat Δ f res )
where Δ f sat Δ f res is the corresponding frequency shift that must be brought below the saturation frequency shift in order to avoid the high error probability. The smallest frequency step that can be created on this occasion is the resolution step which results in obtaining the maximum value for d max . On the other hand, the detection curve shown in Figure 5b does not reach saturation at all. It has a completely different shape with two distinct regions for thicknesses below and above 10 µm which corresponds to the cross-patch height. This distinction suggests the sensor’s different behavior when the cross-patch is completely submerged by the sample. Consequently, the definition of d max must be adapted. In the first region, frequency shifts for both peaks slowly increase with the increase in layer thickness (Figure 5b). On the other hand, in the second region, increasing the thickness leads to the complete disappearance of the first peak as shown in Figure 7. Therefore, d max corresponds to the largest thickness for which the peak still has a measurable absorption. Minimal absorption can vary depending on the measurement equipment and procedure. For example, half of the absorption peak value when the sensor is unloaded can be declared for minimal absorption that can be detected.
The detection is not only limited by the upper bound d max , but also by the lower bound d min . The enlarged portion of Figure 6a is given in Figure 8. The zero value of the frequency shift corresponds to the case of the sensor without the sample. Therefore, the first non-zero virus thickness we can properly detect is defined by the smallest possible frequency step we can make above zero which is the resolution frequency. One more parameter we should consider when determining d min is the size of particles in the sample. The smallest thickness we can theoretically detect is determined by a single layer of particles. Therefore, for d min , we take the maximal value between the thickness for Δfres and 0.1 µm which is the average size of IAV particles according to [28]:
d min = max ( d ( Δ f res ) , 0.1 μ m )
Previously explained d min and d max define the sensor thickness bandwidth (TBW):
T B W = d max d min
The sensitivity can be loosely interpreted as a parameter that describes the proximity of adjacent detectable thicknesses. Graphically, we can understand sensitivity as the slope of the curve linearization in some relevant parts of the sensor’s TBW. As the curves given in Figure 6 are non-linear, sensitivity varies throughout the TBW. It should be noted that this sensitivity differs from the commonly used sensitivity parameter S that is defined as Δfn where Δf is a shift of a resonant frequency per change of the refractive index of the sensor’s surrounding Δn. Parameter S also determines the FoM (figure of merit) of the sensor defined as S/FWHM.
Let us define general sensitivity as the slope of the characteristic that has been linearized in the whole TBW. Although the original curve significantly deviates from this linearization, this parameter can be a good starting point for comparing both multiple sensor structures and the sensor behavior around different resonant peaks or with different samples. General sensitivity can be calculated as:
Gen . Sensitivity = Δ f tot d max d min
where Δ f tot is the total frequency shift between Δ f ( d max ) and Δ f ( d min ) .
In a similar way, we can also separately define the sensitivities for thinner and thicker layers. A graphical review of all of the introduced parameters essential for further analysis is given in Figure 9.

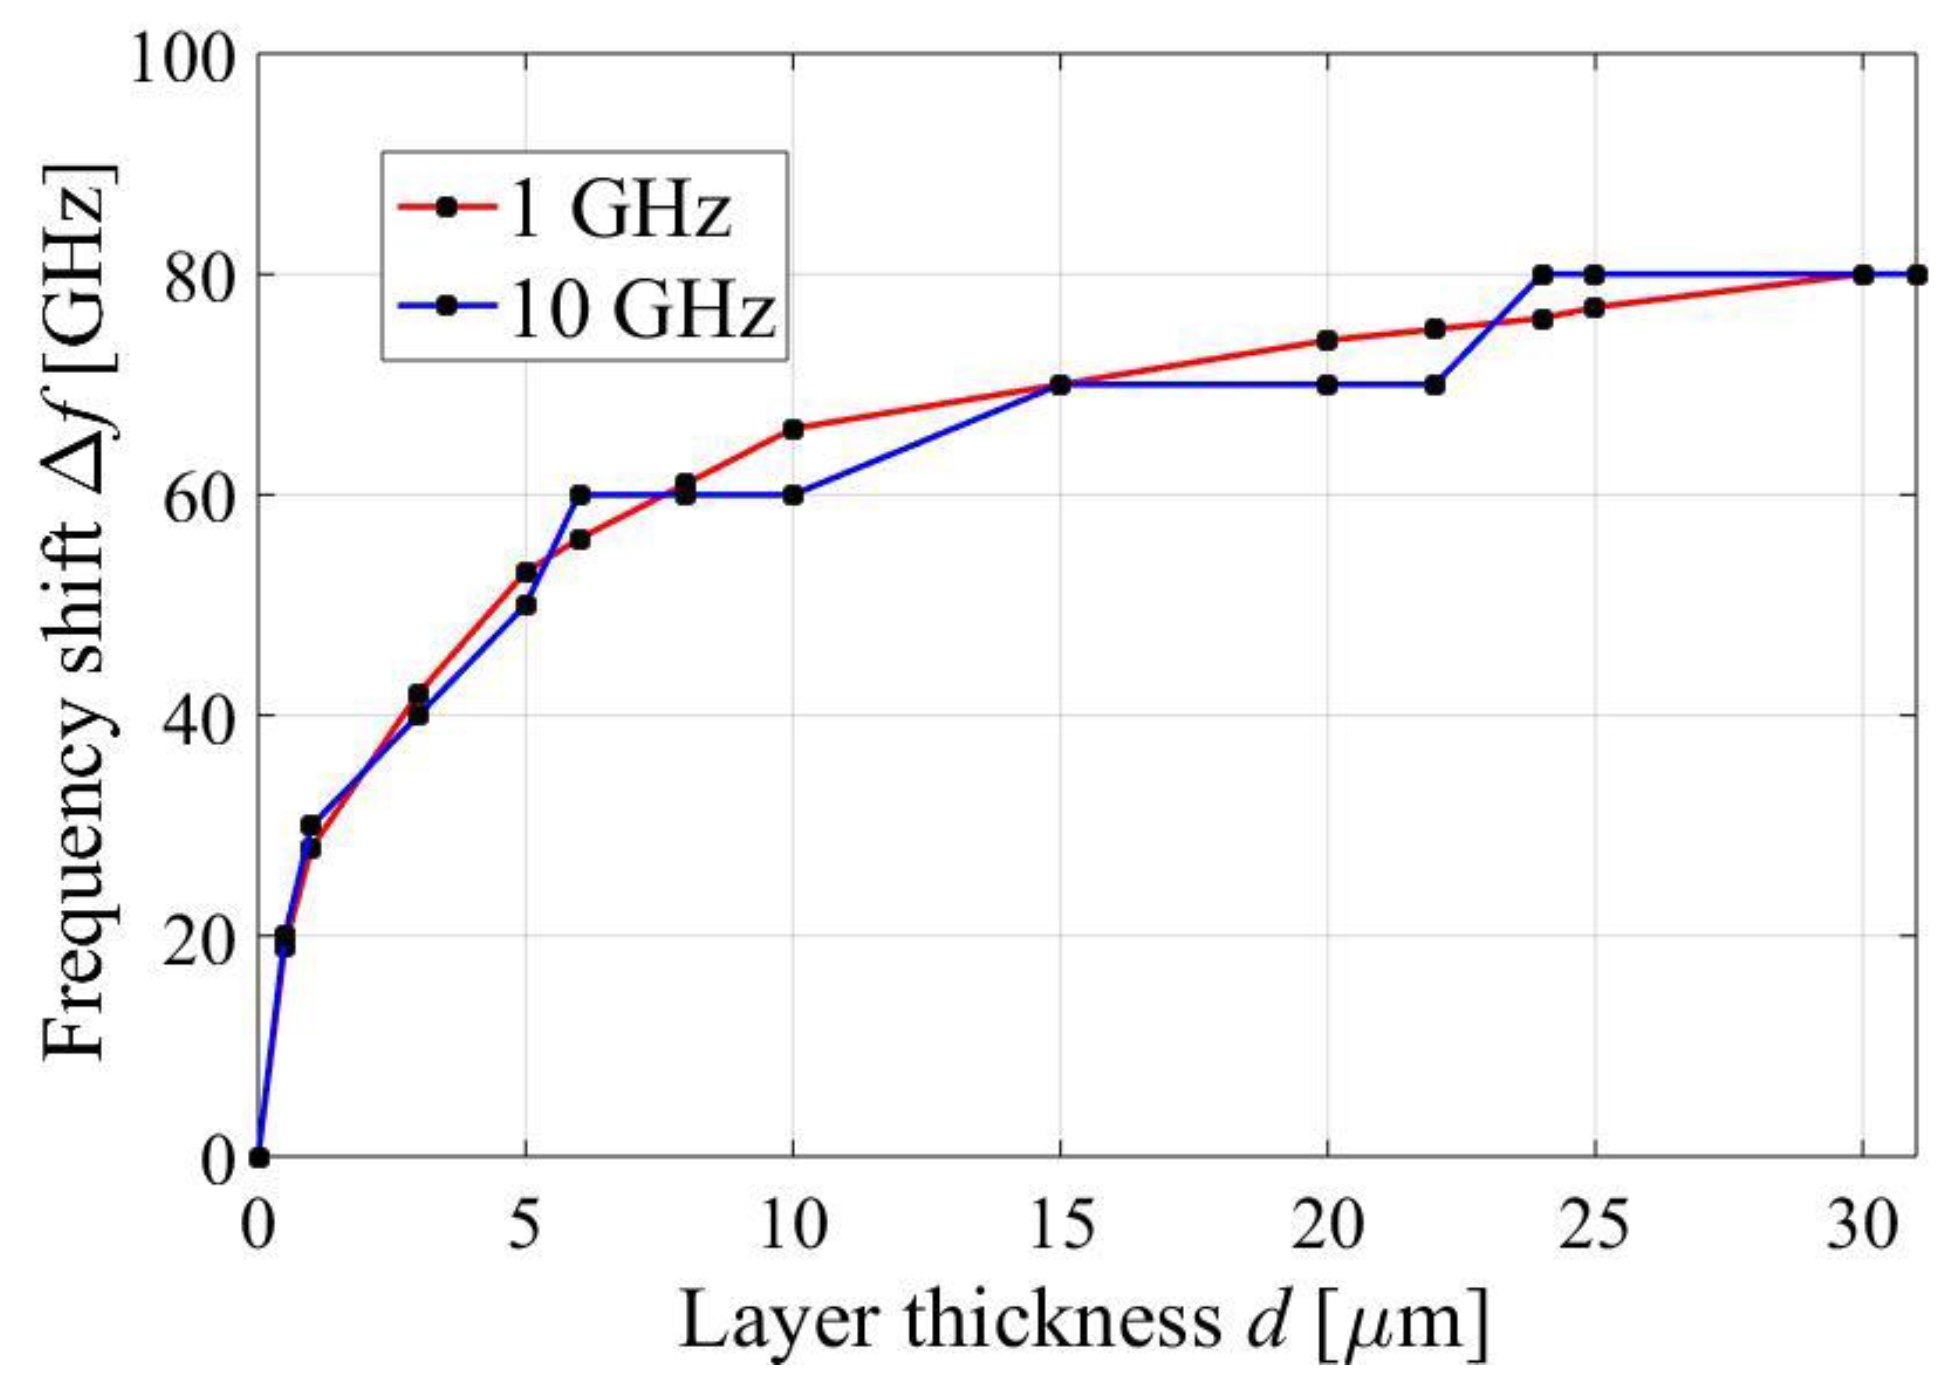
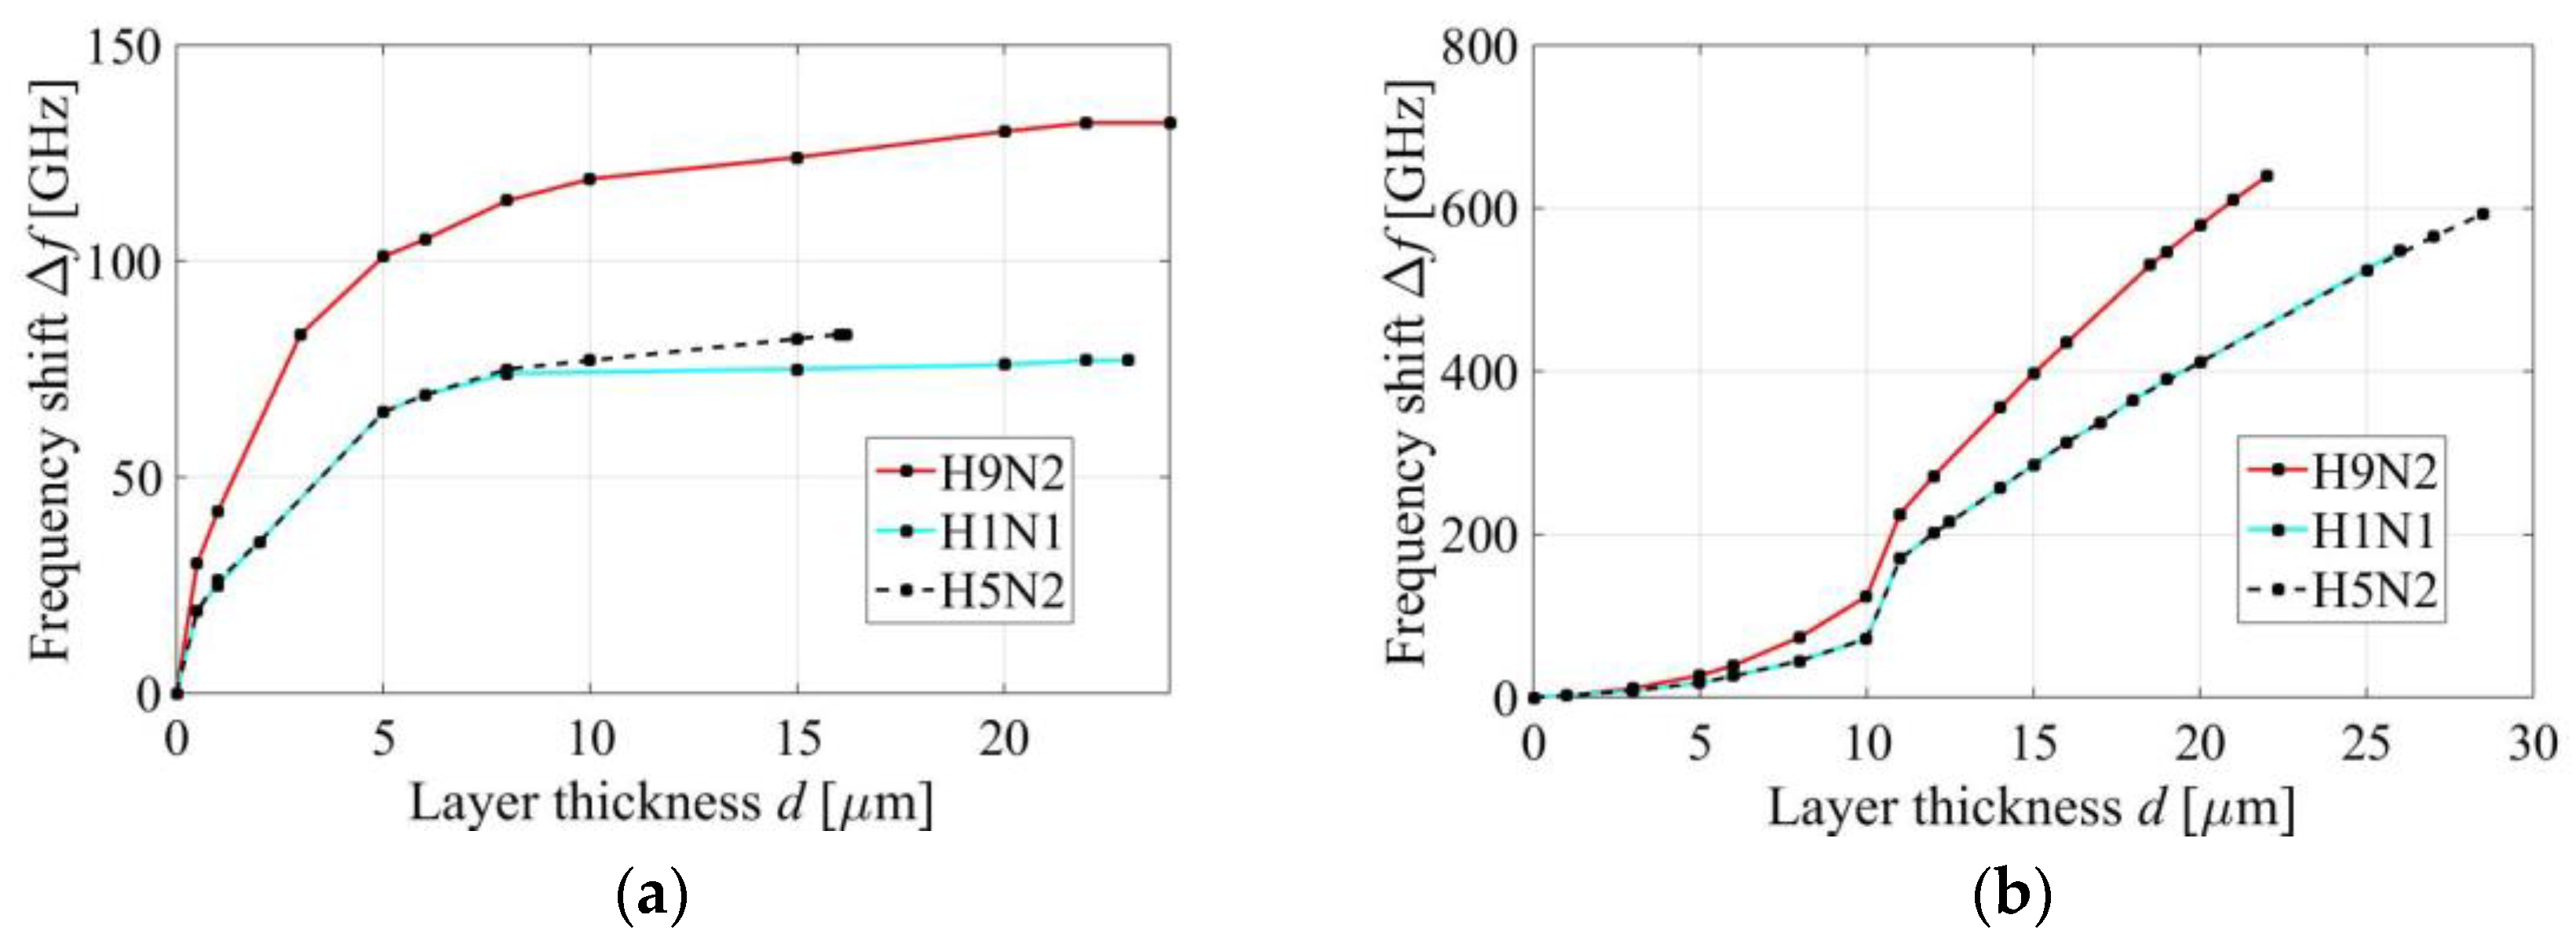
3.4. First Peak of the Absorption Response

The simulation results for all three IAV strains and both PMAs in the first resonant peak frequency range are given in Figure 10 and Table 3 and Table 4.
The curves presented in Figure 10a follow similar dependencies for all three virus strains, but the one that corresponds to H9N2 is the most prominent while the other two overlap almost completely. Since the values of parameters of interest are not very far from each other for H1N1 and H5N2, the differentiation by observing only Figure 10a becomes significantly more difficult. The numerical representation from Table 3 gives more precise values for these parameters which facilitates their further analysis.
Table 3 indicates that the sensitivities for detecting H1N1 and H5N2 using the chosen sensor are lower than the sensitivity for H9N2. Sensitivities for the thinner layer are greater than for thicker layers for all three virus subtypes (the values of 1 µm and 15 µm were taken as reference for comparison).
The analysis has been conducted for two different resolutions as the achievable resolution greatly depends on the used method, equipment, and the presence of noise. For example, a typical THz time-domain spectroscopy (THz TDS) system has frequency resolution in the order of 1 GHz [29] which we have taken as a higher resolution in comparison with ten times lower resolution achieved with Δ f res of 10 GHz. Results from Table 3 show that a change in resolution can cause significant variations of estimated sensitivity parameters. For the resolution of 1 GHz, the sensor can detect the lowest possible thickness for all three strains, unlike the case of 10 GHz resolution. The zeros in Table 3 for 10 GHz resolution indicate the inability of detecting layers thicker than 15 µm for all three virus strains. The sensor’s TBW decreases when the resolution step increases. As for the general sensitivity, it appears that the sensor is generally more sensitive for 10 GHz, but it should be taken into account that the detection curves for different resolutions do not show the same level of deviation from the characteristic that has been linearized during the process of general sensitivity calculation making these values irrelevant for comparison (Figure 11).
Detection curves for CrossPMA have the same shape with two distinct regions below and above 10 µm for all three viruses (Figure 10b). The relation between detection curves for H1N1 and H5N2 is similar to the corresponding relation for SquarePMA in terms of the overlapping for the smaller thicknesses. The detection curve for H9N2 is completely separated from the other two which reflects significantly higher values for general and sensitivity for thinner layers (Table 4). TBW is the broadest for H5N2 and the narrowest for H9N2.
For all three virus subtypes, CrossPMA shows over 10 times higher general sensitivity compared to the SquarePMA (Table 3 and Table 4). On the other hand, CrossMPA is not able to detect the smallest theoretical virus layer thickness of 0.1 µm and its sensitivity for thinner layers is significantly smaller compared to the corresponding values for SquareMPA. Neither of the observed sensors has particularly good performance with extremely thick layers.

3.5. Second Peak of the Absorption Response

The same analysis has been repeated around the second peak for both PMAs. The results are presented in their graphical and numerical form in Figure 12 and Table 5 and Table 6.
Comparison between Figure 12a and previously shown Figure 10a suggests that SquarePMA has similar behavior in terms of the detection curve shape, but with two major differences. Firstly, the frequency shifting is far more pronounced which causes an increase in general sensitivity as well as sensitivity for layers thinner than 1 µm (Table 5). Secondly, the separation between detection curves for H1N1 and H5N2 becomes more distinct for the thicker layers.
Figure 12b suggests that CrossPMA shows similar behavior in the first and the second absorption peak range. Table 6 gives a more precise view of the differences between the two absorption peaks. According to data presented in Table 6, CrossPMA has wider TBW as well as slightly smaller general sensitivity around the second peak. The relation between the two sensors remains similar as it was around the first resonant peak except for the increase in the general sensitivity which is somewhat less pronounced.

3.6. Qualitative Analysis of Sensor Detection

Figure 10 suggests that it is possible to distinguish different virus types by their response as the corresponding curves do not overlap completely. Let us formalize the condition for such differentiation. If we define Δ f qual as the frequency shift between two curves for the same layer thickness, two samples can be distinguished by their type if Δ f qual Δ f res as it is the smallest frequency step we can recognize. Otherwise, we cannot detect the frequency shift between curves and therefore we are not able to identify sample type by using only the frequency shift as a reference parameter.
According to Figure 10 and Figure 12 and the already presented results, we can clearly identify the H9N2 sample in the whole sensor TBW, but we cannot do the same for the other two types due to the proximity of their responses caused by the similarity of their optical properties (Table 1). We hereby propose two possible solutions to this problem:
(1)
Decreasing the resolution frequency Δ f res if possible,
(2)
Adding the peak amplitude as another reference parameter.
The reasoning behind (1) is intuitive and can be directly seen from the formalized condition for qualitative differentiation. Having said that, it is not always feasible to decrease the resolution frequency since it is fairly limited by the used measurement method, equipment, and duration of the analysis.
As for the second possible solution, we have been motivated by the well-known result from the engineering electromagnetics for the reflection of a uniform plane at normal incidence [30]. We have observed a simplified idealized theoretical model of CrossPMA that can serve as a proof of concept for differentiating two virus samples that have practically the same real part of complex permittivity, but different imaginary parts, by analyzing the amplitude values (Figure 13). Three different regions shown in Figure 13 correspond to: (1) surrounding air, (2) virus layer of complex permittivity ε _ 2 and thickness d, and (3) perfect electric conductor (PEC).
The equivalent reflection coefficient for this simplified model can be calculated as:
R e = R 12 + T 12 T 21 R 23 e 2 γ 2 d 1 R 21 R 23 e 2 γ 2 d
where Rij and T i j ( i , j { 1 , 2 , 3 } ) are complex reflection and transmission coefficients and γ 2 is the propagation constant in the second region. Absorption is then obtained by A = 1 | R e | 2 . The value of ε _ 2 has been varied according to data given in Table 7. The results have shown that a greater value of absorption is achieved for H1N1 compared to H5N2, with a relative difference between amplitudes of about 30%.
However, the peak amplitude is not often used as a main reference parameter for analysis since it is very sensitive to the effects of random and systematic errors in spectroscopy measurements. Any signal measured in the process of THz TDS encounters three different types of noise: (1) the noise of the emitter, (2) the shot noise in the receiver, and (3) signal independent noises (for example, thermal noise) [31].
In addition, noise is not the only source of error in the THz TDS measurement as pointed out in [32]. The cumulative effect of these errors produces variations in the spectral parameters of the measured signal. This leads to possible errors in decision making in the detection process. In the noiseless analysis such as simulations conducted in this paper, a non-zero difference in peak amplitudes is a sufficient condition for differentiating two samples that induce the same frequency shift with 100% certainty. However, in a real measurement process, the mentioned variations of the measured signal define the signal-to-noise ratio (SNR) which determines the minimum detectable signal change [29].
In order to investigate the performance of the chosen sensor in terms of qualitative differentiation, we have created an Octave script along with WIPL-D sensor models that can estimate the effects encountered in the real measurement to some extent. We assume that the simulation results are the reference. In practical cases, reference results would be obtained by analyzing the virus samples of known type, concentration, and thickness. The simulated absorption response represents a relation between the incident power on the input and the absorbed power on the output. Therefore, in order to obtain the absorbed power spectrum, we had to multiply the simulated absorption response with the incident power spectrum.
The incident power spectrum depends on the emitter. For example, the input signal in THz TDS is generated by an ultrafast optical laser and therefore, its power and duration, which define its power spectrum, are dependent on the characteristics of the chosen laser source [33,34]. Additionally, the emitter pulse propagates through many components of the experimental setup before reaching the sample. This propagation can have a significant effect on the pulse spectrum. Having all this in mind, in order to simplify the analysis and make it universal in terms of the chosen procedure and used equipment, we have modeled the incident power spectrum as proportional to the source power spectrum with frequency-dependent coefficient k ( f ) .
The reference absorbed power spectrums of two samples are then created by multiplying their absorption responses with the incident power spectrum of the form k ( f ) P in where P in is the source power spectrum. It should be noted that since we investigate two peaks that have maximums for the same value of frequency, we are only interested in the spectral component that corresponds to that particular resonant frequency f resonant . Therefore, as an input parameter, we only need k ( f resonant ) P in rather than the whole incident power spectrum.
Next, we had to model the error in the frequency domain and superpose it on the reference spectrums. For the purpose of demonstration, for error samples, we have chosen Gaussian distribution with zero mean, although the distribution can be chosen completely arbitrarily depending on the experimental process and represents one of the input parameters of our model (Figure 14).
For the estimation of error probability, we have used the following formula:
P e = P ( sample 1 ) P ( sample 2 | sample 1 ) + P ( sample 2 ) P ( sample 1 | sample 2 )
where P ( sample 1 ) is the probability of occurrence of sample 1 and P ( sample 2 | sample 1 ) is the probability of error in decision making when sample 1 is present. Similar explanations apply for P ( sample 2 ) and P ( sample 1 | sample 2 ) .
The probabilities of occurrence alongside with the distribution of error samples define the optimal decision threshold. If we have no prior knowledge of the sample type, it is rational to assume that the probabilities of occurrence for both samples are equal to 0.5 or 50%. Since we have also assumed Gaussian sample distribution, the optimal threshold in our analysis was set right in the middle between two reference amplitudes of the absorbed power for the frequency f resonant .
In an effort to estimate the error probability, we have carried out a large number of iterations. In each iteration, we have generated the error samples, picked the sample that corresponded to
f resonant , added it to the reference absorbed power amplitude of sample 1, checked if the value of the changed amplitude remained on the same side of the threshold; if not, we have marked such event as an error in decision making. We have repeated the same process for sample 2. As a result, we have obtained the probabilities P ( sample 2 | sample 1 ) and P ( sample 1 | sample 2 ) as the number of registered errors for the case of each of the samples divided by the number of iterations. Finally, the error probability can be calculated by using (9).
The results for different combinations of input parameters are shown in Table 7. Reference absorption amplitudes A ( f resonant ) and resonant frequency f resonant have been read from the results of conducted simulations for two different layer thicknesses deposited on the CrossPMA. The values for P in have been taken from [33,34] for demonstration purposes. The standard deviation for Gaussian error sample distribution (SD) has been varied from 0.00001 to 0.05 to observe its effect on the estimated error probability. The parameter k ( f resonant ) has been set to 0.85 and has not been varied in Table 7 since it is regarded together with P in within their product. Therefore, its change has the same effect as the change of P in .
By observing the values presented in Table 7, we can draw several important conclusions:
  • Since the difference between reference absorption amplitudes for samples is rather small, if the incident power spectral component for f resonant is relatively low and simultaneously the standard deviation of the error sample distribution is relatively high, the estimated error probability is extremely high as it is approaching 50%. It should be noted that the error probability of 50% can be achieved without any measurement with a random guess of the sample type.
  • The estimated error probability decreases significantly with a decrease in the standard deviation of the error sample distribution.
  • If we increase the input power, we can decrease the error probability to some extent, but not significantly since the values of error samples have the predominant effect on the error probability.
  • With the increase in virus layer thickness, the difference between the reference amplitudes increases. As a result, there is an improvement in the error probability.
Therefore, the analysis has shown that CrossPMA can differentiate types of two samples that induce the same frequency shift based solely on the difference of their respective peak amplitudes, but under certain conditions and with a certain degree of quality.

3.7. Comparison of Sensors

We have investigated the sensing capabilities of two dual-band PMAs in order to estimate which one is more suitable for the detection of three IAV subtypes: H1N1, H5N2, and H9N2. CrossPMA has a significantly higher Q-factor for both resonant frequencies compared to SquarePMA. The very high Q-factor of the second resonant peak makes CrossPMA a promising candidate for potential applications in THz sensing. Two sensors have completely different behavior with the increase in sample thickness as shown in Figure 10 and Figure 12. The general sensitivity calculated for the entire TBW is significantly higher for CrossPMA. On the other hand, SquarePMA is able to detect the theoretically thinnest layer of the virus as opposed to CrossPMA. In general, SquarePMA has higher sensitivity for detecting extremely thin virus layers with thickness below 1 µm.
In order to better understand the underlying physical mechanism of two PMAs, the distributions of electric and magnetic fields have been calculated for both sensors at both resonant frequencies in the presence of a 10 µm thick H9N2 layer. The results are shown in Figure 15. Figure 15a shows that the electrical field concentrates at the square ring at the first resonant frequency and at the edges of the triangles at the second resonant frequency which can be ascribed to the excitation of an electric dipole and quadrupole respectively. The electric field distribution suggests the possibility of controlling two resonant modes independently since there is no cross-coupling between the two resonators [21]. On the contrary, the dual-band absorption of CrossPMA is achieved by integrating two different modes in a single structure. The electric field distribution is gathered in the central part of the unit cell for both modes and additionally, in the area between units for the second mode as shown in Figure 15b. Therefore, the second resonant mode can be attributed to the inter-cell interaction. Figure 15c,d show the distribution of magnetic field in the cross-sections of two PMAs. Figure 15d indicates that the EM field energy is dominantly confined in the volume of the sample deposited on CrossPMA as opposed to the confinement in the polyimide layer of the SquarePMA shown in Figure 15c. In order to achieve high sensitivity for refractive sensing, the sample should be placed at the strongest wave–matter interaction zone [35]. Proper confinement of electromagnetic fields results in significantly enhanced interaction between the sample and the THz wave by enabling a larger duty cycle of the interaction zone [36]. Therefore, the difference in the field localization is responsible for the significantly higher sensitivity of CrossPMA. A difference in sensitivities of the two resonant modes of SquarePMA is probably induced by the slightly better field confinement of the second resonant mode (Figure 15c).
A comparison between the observed PMAs and previously reported THz metamaterial-based devices is given in Table 8. CrossPMA has the highest FOM for both resonant modes.

4. Conclusions

In this research, we proposed a novel method for sensitivity characterization of two dual-band THz perfect metamaterial absorbers for possible IAV detection. The PMA based on a conventional planar metal-dielectric-metal sandwiched structure has two resonant peaks at 1.021 THz and 1.520 THz with corresponding Q-factors of 26.2 and 25.8 and sensitivities of 100 GHz/RIU and 168 GHz/RIU. The dielectric-metal PMA with cross patches achieves high Q-factors and sensitivities of (i) 94 and 1900 GHz/RIU at 2.631 THz, and (ii) 410 and 1050 GHz/RIU at 2.871 THz, which makes it a promising candidate for potential applications in THz sensing. We analyzed the sensors’ behavior in the presence of IAV samples. The detection curves showed that two PMAs respond differently to the increase in sample thickness. The PMA with a sandwiched structure has lower general sensitivity, but higher sensitivity for thinner layers compared to the PMA with cross-shaped patches. Both sensors have difficulties in qualitatively distinguishing two samples of very similar optical properties. In order to enhance sensing performance in the case of samples with approximately equal real parts, but different imaginary parts of complex permittivity, we have investigated the possibility of amplitude-variation sensing.
The physical origin of the observed PMAs has been investigated by examining the distribution of electric and magnetic fields at resonant frequencies. The electric field distribution of the PMA with a sandwiched structure suggests the possibility of controlling two resonant modes independently. On the other hand, the PMA with cross-shaped patches shows better confinement of the resonant field in the sample which is crucial for obtaining high sensitivity for refractive sensing.
Our future research efforts are directed towards fabricating the laboratory prototype of the presented structures and evaluating their performance experimentally.

Author Contributions

Conceptualization, A.K. and M.P.; methodology, D.T.; validation, A.K., M.P. and D.T.; formal analysis, D.T.; investigation, A.K.; resources, A.K.; writing—original draft preparation, A.K.; writing—review and editing, M.P.; visualization, A.K. and M.P.; supervision, M.P. and D.T.; project administration, M.P.; funding acquisition, A.K. and M.P. All authors have read and agreed to the published version of the manuscript.

Funding

This research was supported in part by the Ministry of Education, Science and Technological Development of the Republic of Serbia, project no. 62114, and by the Innovation Fund of the Republic of Serbia, project no. 74002. The authors would like to acknowledge the contribution of the EU COST Action CA18223.

Data Availability Statement

Data is contained within the article. The data presented in this study are available in this article.

Conflicts of Interest

The authors declare no conflict of interest.

References

  1. Kutter, J.S.; Spronken, M.I.; Fraaij, P.L.; Fouchier, R.A.; Herfst, S. Transmission routes of respiratory viruses among humans. Curr. Opin. Virol. 2018, 28, 142–151. [Google Scholar] [CrossRef]
  2. Influenza-Vaccine-Preventable Diseases. Available online: https://www.who.int/immunization/monitoring_surveillance/burden/vpd/WHO_SurveillanceVaccinePreventable_09_Influenza_R2.pdf?ua=1 (accessed on 29 December 2021).
  3. Krokhine, S.; Torabi, H.; Doostmohammadi, A.; Rezai, P. Conventional and microfluidic methods for airborne virus isolation and detection. Colloid Surf. B 2021, 206, 111962. [Google Scholar] [CrossRef] [PubMed]
  4. Kovačević, A.; Potrebić, M.; Tošić, D. Sensitivity Analysis of Possible THz Virus Detection Using Quad-Band Metamaterial Sensor. In Proceedings of the IEEE 32nd International Conference on Microelectronics (MIEL), Nis, Serbia, 12–14 September 2021; pp. 107–110. [Google Scholar]
  5. Xu, W.; Xie, L.; Ying, Y. Mechanisms and applications of terahertz metamaterial sensing: A review. Nanoscale 2017, 37, 13864–13878. [Google Scholar] [CrossRef]
  6. Akter, N.; Hasan, M.M.; Pala, N. A Review of THz Technologies for Rapid Sensing and Detection of Viruses including SARS-CoV-2. Biosensors 2021, 11, 349. [Google Scholar] [CrossRef] [PubMed]
  7. Choudhury, B.; Menon, A.; Jha, R.M. Active Terahertz Metamaterial for Biomedical Applications; Springer: Singapore, 2016. [Google Scholar]
  8. Kodama, C.H.; Coutu, R.A., Jr. THz Metamaterial Characterization Using THz-TDS. In Terahertz Spectroscopy—A Cutting Edge Technology; Uddin, J., Ed.; IntechOpen: London, UK, 2017; Chapter 6. [Google Scholar]
  9. Xie, Q.; Dong, G.; Wang, B.; Huang, W. Design of Quad-Band Terahertz Metamaterial Absorber Using a Perforated Rectangular Resonator for Sensing Applications. Nanoscale Res. Lett. 2018, 13, 137. [Google Scholar] [CrossRef] [PubMed] [Green Version]
  10. Niknam, S.; Yazdi, M.; Amlashi, S.B. Enhanced Ultra-Sensitive Metamaterial Resonance Sensor based on Double Corrugated Metal stripe for Terahertz Sensing. Sci. Rep. 2019, 9, 7516. [Google Scholar] [CrossRef] [Green Version]
  11. Ma, A.; Zhong, R.; Wu, Z.; Wang, Y.; Yang, L.; Liang, Z.; Fang, Z.; Liu, S. Ultrasensitive THz Sensor Based on Centrosymmetric F-Shaped Metamaterial Resonators. Front. Phys. 2020, 8, 584639. [Google Scholar] [CrossRef]
  12. Cheng, D.; He, X.; Huang, X.; Zhang, B.; Liu, G.; Shu, G.; Fang, C.; Wang, J.; Luo, Y. Terahertz Biosensing Metamaterial Absorber for Virus Detection Based on Spoof Surface Plasmon Polaritons. Int. J. RF Microw. Comput.-Aided Eng. 2018, 28, e21448. [Google Scholar] [CrossRef]
  13. Keshavarz, A.; Vafapour, Z. Sensing Avian Influenza Viruses Using Terahertz Metamaterial Reflector. IEEE Sens. J. 2019, 19, 5161–5166. [Google Scholar] [CrossRef]
  14. Hong, J.T.; Jun, S.W.; Cha, S.H.; Park, J.Y.; Lee, S.; Shin, G.A.; Ahn, Y.H. Enhanced Sensitivity in THz Plasmonic Sensors with Silver Nanowires. Sci. Rep. 2018, 8, 15536. [Google Scholar] [CrossRef] [Green Version]
  15. Ahmadivand, A.; Gerislioglu, B.; Tomitaka, A.; Manickam, P.; Kaushik, A.; Bhansali, S.; Nair, M.; Pala, N. Extreme Sensitive Metasensor for Targeted Biomarkers Identification Using Colloidal Nanoparticles-Integrated Plasmonic Unit Cells. Biomed. Opt. Express 2018, 9, 373–386. [Google Scholar] [CrossRef] [PubMed]
  16. Lee, D.-K.; Kang, J.-H.; Kwon, J.; Lee, J.-S.; Lee, S.; Woo, D.H.; Kim, J.H.; Song, C.-S.; Park, Q.-H.; Seo, M. Nano Metamaterials for Ultrasensitive Terahertz Biosensing. Sci. Rep. 2017, 7, 8146. [Google Scholar] [CrossRef]
  17. Park, S.J.; Cha, S.H.; Shin, G.A.; Ahn, Y.H. Sensing Viruses Using Terahertz Nano-Gap Metamaterials. Biomed. Opt. Express 2017, 8, 3551–3558. [Google Scholar] [CrossRef] [Green Version]
  18. Wang, B.X.; Huang, W.Q.; Wang, L.L. Ultra-narrow terahertz perfect light absorber based on surface lattice resonance of a sandwich resonator for sensing applications. RSC Adv. 2017, 7, 42956–42963. [Google Scholar] [CrossRef] [Green Version]
  19. Yan, F.; Li, Q.; Tian, H.; Wang, Z.; Li, L. Ultrahigh Q-factor dual-band terahertz perfect absorber with dielectric grating slit waveguide for sensing. J. Phys. D Appl. Phys. 2020, 53, 235103. [Google Scholar] [CrossRef]
  20. Hu, D.; Meng, T.; Wang, H.; Ma, Y.; Zhu, Q. Ultra-narrow-band terahertz perfect metamaterial absorber for refractive index sensing application. Results Phys. 2020, 19, 103567. [Google Scholar] [CrossRef]
  21. Yin, W.; Shen, Z.; Li, S.; Zhang, L.; Chen, X. A Three-Dimensional Dual-Band Terahertz Perfect Absorber as a Highly Sensitive Sensor. Front. Phys. 2021, 9, 665280. [Google Scholar] [CrossRef]
  22. Stebunov, Y.V.; Yakubovsky, D.I.; Fedyanin, D.Y.; Arsenin, A.V.; Volkov, V.S. Superior sensitivity of copper-based plasmonic biosensors. Langmuir 2018, 34, 4681–4687. [Google Scholar] [CrossRef] [Green Version]
  23. Cong, L.; Tan, S.; Yahiaoui, R.; Yan, F.; Zhang, W.; Singh, R. Experimental demonstration of ultrasensitive sensing with terahertz metamaterial absorbers: A comparison with the metasurfaces. Appl. Phys. Lett. 2015, 106, 031107. [Google Scholar] [CrossRef]
  24. WIPL-D Pro 17, 3D Electromagnetic Solver, WIPL-D d.o.o., Belgrade, Serbia. 2021. Available online: http://www.wipl-d.com (accessed on 14 February 2022).
  25. Summary of Influenza Risk Assessment Tool (IRAT) Results. Available online: https://www.cdc.gov/flu/pandemic-resources/monitoring/irat-virus-summaries.htm (accessed on 29 December 2021).
  26. Amin, M.; Siddiqui, O.; Abutarboush, H.; Farhat, M.; Ramzan, R. A THz graphene metasurface for polarization selective virus sensing. Carbon 2021, 176, 580–591. [Google Scholar] [CrossRef]
  27. Wang, B.; Sadeqi, A.; Ma, R.; Wang, P.; Tsujita, W.; Sadamoto, K.; Sawa, Y.; Nejad, H.R.; Sonkusale, S.; Wang, C.; et al. Metamaterial Absorber for THz Polarimetric Sensing. In Proceedings of the SPIE, Terahertz, RF, Millimeter, and Submillimeter-Wave Technology and Applications XI, San Francisco, CA, USA, 29 January–1 February 2018; Volume 10531, pp. 1–7. [Google Scholar]
  28. Vajda, J.; Weber, D.; Brekel, D.; Hundt, B.; Müller, E. Size distribution analysis of influenza virus particles using size exclusion chromatography. J. Chromatogr. A 2016, 1465, 117–125. [Google Scholar] [CrossRef] [PubMed] [Green Version]
  29. Naftaly, M. Metrology Issues and Solutions in THz Time-Domain Spectroscopy: Noise, Errors, Calibration. IEEE Sens. J. 2013, 13, 8–17. [Google Scholar] [CrossRef]
  30. Hayt, W.H., Jr.; Buck, J.A. Engineering Electromagnetics; McGraw-Hill Education: New York, NY, USA, 2019. [Google Scholar]
  31. Duvillaret, L.; Garet, F.; Coutaz, J.-L. Influence of noise on the characterization of materials by terahertz time-domain spectroscopy. J. Opt. Soc. Am. B 2000, 17, 452–461. [Google Scholar] [CrossRef] [Green Version]
  32. Withayachumnankul, W.; Fischer, B.M.; Lin, H.; Abbott, D. Uncertainty in terahertz time-domain spectroscopy measurement. J. Opt. Soc. Am. B 2008, 25, 1059–1072. [Google Scholar] [CrossRef] [Green Version]
  33. Naftaly, M.; Miles, R.E. Terahertz Time-Domain Spectroscopy for Material Characterization. Proc. IEEE 2007, 95, 1658–1665. [Google Scholar] [CrossRef]
  34. Zaytsev, K.I.; Gavdush, A.A.; Chernomyrdin, N.V.; Yurchenko, S.O. Highly Accurate in Vivo Terahertz Spectroscopy of Healthy Skin: Variation of Refractive Index and Absorption Coefficient Along the Human Body. IEEE Trans. Terahertz Sci. Technol. 2015, 5, 817–827. [Google Scholar] [CrossRef]
  35. Hu, X.; Xu, G.; Wen, L.; Wang, H.; Zhao, Y.; Zhang, Y.; Cumming, D.R.S.; Chen, Q. Metamaterial absorber integrated microfluidic terahertz sensors. Laser Photonics Rev. 2016, 10, 962–969. [Google Scholar] [CrossRef] [Green Version]
  36. Lan, F.; Luo, F.; Mazumder, P.; Yang, Z.; Meng, L.; Bao, Z.; Zhou, J.; Zhang, Y.; Liang, S.; Shi, Z.; et al. Dual-band refractometric terahertz biosensing with intense wave-matter-overlap microfluidic channel. Biomed. Opt. Express 2019, 10, 3790. [Google Scholar] [CrossRef]
  37. Cong, L.; Singh, R. Sensing with THz metamaterial absorbers. arXiv 2014, arXiv:1408.3711. [Google Scholar]
  38. Wang, B.X.; Zhai, X.; Wang, G.Z.; Huang, W.Q.; Wang, L.L. A novel dual-band terahertz metamaterial absorber for a sensor application. J. Appl. Phys. 2015, 117, 014504. [Google Scholar] [CrossRef]
Figure 1. Unit cell of (a) SquarePMA and (b) CrossPMA with given dimensions in µm.
Electronics 11 00699 g001
Figure 2. Orthogonal lattice of unit cells for (a) SquarePMA and (b) CrossPMA with given spatial periods in µm.
Electronics 11 00699 g002
Figure 3. Real (n) and imaginary (k) part of the refractive index for H9N2.
Electronics 11 00699 g003
Figure 4. Absorption response of (a) SquarePMA and (b) CrossPMA with resonant frequencies in THz.
Electronics 11 00699 g004
Figure 5. Comparison between absorption responses of sensor with different thicknesses of H9N2 sample for (a) SquarePMA and (b) CrossPMA.
Electronics 11 00699 g005
Figure 6. Detection curves for H9N2 around the first absorption peak with Δfres = 1 GHz for (a) SquarePMA and (b) CrossPMA.
Electronics 11 00699 g006
Figure 7. Absorption responses of CrossPMA for three different H9N2 thicknesses above 10 µm.
Electronics 11 00699 g007
Figure 8. Detail from Figure 5a around the origin.
Electronics 11 00699 g008
Figure 9. Graphical review of the introduced sensitivity parameters.
Electronics 11 00699 g009
Figure 10. Detection curves around the first peak for (a) SquarePMA and (b) CrossPMA.
Electronics 11 00699 g010
Figure 11. Detection curves of SquarePMA performance for different resolutions.
Electronics 11 00699 g011
Figure 12. Detection curves around the second peak for (a) SquarePMA and (b) CrossPMA.
Electronics 11 00699 g012
Figure 13. Idealized theoretical model of CrossPMA.
Electronics 11 00699 g013
Figure 14. Input and output parameters of our error probability model (Octave script).
Electronics 11 00699 g014
Figure 15. Distribution of electric field for (a) SquarePMA, (b) CrossPMA and magnetic field for (c) SquarePMA, (d) CrossPMA for sensors loaded with 10 µm thick H9N2 sample at the resonant frequencies.
Electronics 11 00699 g015
Table 1. Optical properties of three IAV strains for specific protein concentration.
Strain NameProtein Concentration
[mg/mL]
Refractive Index: A n + B j k
AB
H1N10.5411.4
H5N20.211
H9N20.281.21.4
Table 2. Comparison of sensing performance.
StructureResonant Frequency [THz]Q-FactorS [GHz/RIU]FOM [RIU−1]
SquarePMA1.02126.21002.56
1.52025.81682.85
CrossPMA2.63194190067.86
2.8714101050150
Table 3. Numerical representation of sensitivity parameters around the first peak for SquarePMA.
Virus SubtypesH9N2H1N1H5N2
Resolution[GHz]110110110
dmin[μm]0.10.250.10.50.10.5
dmax28.3322208158
dmaxdmin28.2321.7519.97.514.97.5
Sensitivity
[GHz/nm]
General (×10−3)2.67442.75861.93472.66672.58392.6667
d ≤ 1 μm0.02720.02670.01720.020.01720.02
d ≥ 15 μm (×10−4)6.751702000
Table 4. Numerical representation of sensitivity parameters around the first peak for CrossPMA. Minimal absorption is declared at 50% of the absorption value of the unloaded sensor.
sssVirus SubtypesH9N2H1N1H5N2
dmin[μm]0.3330.50.5
dmax141516
dmaxdmin13.66714.515.5
Sensitivity
[GHz/nm]
General (×10−3)34.462626.32
d ≤ 1 μm0.0030.0020.002
d ≥ 15 μm (×10−4)00310
Table 5. Numerical representation of sensitivity parameters around the second peak for SquarePMA.
Virus SubtypesH9N2H1N1H5N2
dmin[μm]0.10.10.1
dmax212015
dmaxdmin20.919.914.9
Sensitivity
[GHz/nm]
General (×10−3)5.98093.6285.248
d ≤ 1 μm0.040.02360.0247
d ≥ 15 μm (×10−4)11.66720
Table 6. Numerical representation of sensitivity parameters around the second peak for CrossPMA. Minimal absorption is declared at 50% of the absorption value of the unloaded sensor.
Virus SubtypesH9N2H1N1H5N2
dmin[μm]0.50.50.5
dmax222628.5
dmaxdmin21.525.528
Sensitivity
[GHz/nm]
General (×10−3)29.6721.4521.14
d ≤ 1 μm0.0020.0020.002
d ≥ 15 μm (×10−4)345.7239.1228.1
Table 7. Results of estimated error probability for different input parameters.
InputOutput
Samplesfresonant [THz]εr (fresonant)A (fresonant)Pin [W]SDPe
1 µm:
H1N1,
H5N2
2.629H1N1:
2.176 + j 0.035
H5N2:
2.176 + j 0.025
H1N1: 0.94535
H5N2: 0.94476
0.20.0550%
0.20.000010%
1.20.0549.4%
1.20.000527.2%
6 µm:
H1N1,
H5N2
2.576H1N1:
2.173 + j 0.038
H5N2:
2.173 + j 0.027
H1N1: 0.99192
H5N2: 0.98562
1.20.00050%
Table 8. Comparison of sensor properties among designs in previous works.
StructureResonant Frequency [THz]Q-FactorS [GHz/RIU]FOM [RIU−1]
Graphene H-shaped
reflector [13]
1.71649.185402.86
Cross-shaped absorber [37]0.6377.0361522.67
Complementary
cross-shaped absorber [37]
0.7927.1891632.05
Metallic strip absorber [38]1.4207.13001.5
2.99059.8220034
SquarePMA1.02126.21002.56
1.52025.81682.85
CrossPMA2.63194190067.86
2.871410.11050150
Publisher’s Note: MDPI stays neutral with regard to jurisdictional claims in published maps and institutional affiliations.

