Abstract
Verification is one of the core steps in integrated circuits (ICs) manufacturing due to the multifarious defects and malicious hardware Trojans (HTs). In most cases, the effectiveness of the detection relies on the quality of the sample images of ICs. However, the high-precision and noiseless images are hard to capture due to the mechanical precision, manual error and environmental interference. In this paper, an effective approach for processing the low-quality image data of ICs is proposed. Our approach can successfully categorize the partial pictures of multiple objected ICs with low resolution and various noise. The proposed approach extracts the high-frequency texture components (HFTC) of the images and constructs a graph with the correlationship among features. Subsequently, the spectral clustering is conducted for obtaining the final cluster indicators. The low-quality images of ICs can be successfully categorized by the proposed approach, which will provide a data foundation for the following verification tasks. In order to evaluate the effectiveness of the proposed approach, several experiments are conducted in the simulated datasets, which are generated by corrupting the real-world data in different conditions. The clustering results reveal that our approach can achieve the best performance with good stability compared to the baselines.
1. Introduction
In the integrated circuit (IC) manufacturing industry, verification is one of the core steps during the design and production. Recently, verification techniques based on the computer vision or artificial intelligence have attracted extensive attention [1,2,3]. The effectiveness of these verification techniques basically relies on the high quality of images. In this paper, our purpose is to effectively categorize the low-quality ICs’ images in order to reduce the strict requirements for samples and provide a data foundation for the following verification procedures. The hardware assurance and part obsolescence of semiconductor microelectronics have created a critical need for the reliability verification. There are two categories of objects including the unintentional defects and the malicious hardware Trojans (HTs). Limited by the mechanical precision and the workmanship, various defects may exist such as the errors of solder joints, stains and elements damages. Nowadays, the main phases of the IC’s production are distributed globally, including design, synthesis, fabrication and distribution [4]. This global cooperation model makes ICs become vulnerable to the HTs, which can leak secret information, invalidate the IC or cause other catastrophic consequences [5,6,7]. In recent years, many relevant studies have been conducted. The logic encryption techniques are applied in [8,9,10]. However, these techniques require large performance overhead, and the techniques using emerging transistors [11] and spintronic devices [12] are developed. The vision-based techniques are one of the attractive branches in recent years. A machine vision-based defect inspection system structure is designed, which is to show the relevant technologies in the vision defect inspection [13]. A SEM-based acquisition technique, named SEMBA, for white team HTs detection is proposed [14], which is based on the wet etching, scanning electron microscopy and multiple image alignment. A computer vision-based framework for the HT detection on golden IC and IUA images is designed [15]. A HTs detection method named Golden Gates is designed to achieve a comparable level of accuracy to reverse engineering only with less time cost [16]. The histogram of oriented gradient (HOG) and support vector machine (SVM) are combined for HT detection [17]. In [18], a “Trojan Scanner” framework is proposed for the untrusted foundry threat model while the trusted golden layout is available. Moreover, deep learning-based techniques attract a lot of attention in the field of IC design and analysis [19,20,21,22]. In [23], carbon nanotube metal–oxide-semiconductor field-effect transistors (CNT-MOSFETs) are modeled and simulated by ANN. An artificial neural network-based robust hybrid algorithm, which consists of particle swarm optimization (PSO) and limited memory Broyden–Fletcher–Goldfarb–Shanno (L-BFGS), is proposed in [24]. A Deep Siamese CNN model-based technique is proposed in [25] for dealing with the lack of IC datasets and features by few-shot learning.
According to the investigation, the cost of the scanning electron microscope (SEM) is too high for small or medium-sized manufacturers to afford. In order to verify the products, they can only entrust the professional facilities at a certain price per hour for chip verification. The inner reason is that the effectiveness of the existing verification techniques basically depends on the high-quality of the images. Most of the existing defects and HTs detection techniques have a strict requirement for the high-quality images of chips scanned by the SEM. With the golden chips for references, the defects and HTs could be detected and located. However, most of the existing techniques are still hard to implement in practical application because of several problems. Firstly, a high-precision image is collected from the specific equipment, which is expensive and can only be obtained by entrusting the research institute. Secondly, there is a large scale of the pixel points in the full picture of chips, which greatly increases the difficulty of locating the defects. Furthermore, the scanned images of chips may contain various interferences due to mechanical error and environmental noise. The strict requirements of the noiseless high-quality image have to be met for the effectiveness of the existing methods, which is costly and has become one of the biggest obstacles between academia and industry. Hence, an alternative low cost and easy to implement way is worth exploring.
Motivated by this phenomenon, our goal is to propose an effective way to process the low-quality images of ICs and provide a data foundation for the detection tasks. In order to achieve this goal, the strict constrains of data needed to be relaxed by the “low-quality” images which can be obtained under the following practice situations.
- Limited by the visual range of the general microscope and the resolution of the camera, an image with high precision and full range of one chip is hard to obtain. The data of one chip could consist of the partial view images captured by multiple scans.
- The environment of data acquisition is hard to strictly control. The data images may contain a variety of noise with drastic changes of temperature, humidity and illuminant, etc.
- Data may suffer from damages during the transmission, such as the network fluctuation in wireless transmission and the data corruption of the storage medium.
In order to overcome those difficulties in practice, an effective approach is proposed in this paper for processing the low-quality image data of ICs. In the proposed approach, the unlabeled partial images of all object chips are assembled as a dataset. Firstly, the key information, called the High-Frequency Texture Components (HFTC) [26], of images will be extracted. Subsequently, a graph of data points will be constructed with an adjacency matrix calculated by the correlationship among the HFTC of all samples. The conventional normalized cut (Ncut) will be applied to the graph and the data points will be categorized into independent clusters. With the cluster indicators, each image could be easily located to the reference golden chips and be beneficial to the verification task. The experiments on simulation data show that the proposed approach can effectively process the low-quality images of ICs and achieve a better performance than the benchmark and the state-of-the-art methods.
2. Background Knowledge
In this section, the related background knowledge will be introduced briefly, including the conventional spectral clustering and the high-frequency texture component.
2.1. Spectral Clustering
According to the Spectral Graph Theory [27], the relationship among data points can be represented by a graph structure with vertices and edges, denoted as . The goal of spectral clustering is to conduct a cut on the edges and to obtain several independent sub-graphs. The vertices in the same sub-graph can be categorized into the same cluster. Given a dataset , a graph G can be determined by calculating the weighted adjacency matrix (or similarity matrix) . Generally, the weights of pairwise points are estimated by Gaussian Kernel function, which is defined as . Spectral clustering aims to find the best way to cut the graph apart, which can be written as:
is the sum of the weights of all edges that connect subsets A and B. Without an appropriate normalization, there could be a meaningless situation that a sub-graph contains only one vertex while the others all belong to another sub-graph. To avoid that, all the subsets should be ensured to be “large enough”. Therefore, a normalization term should be added. So, the object function of spectral clustering can be written as
where
denotes the number of vertices in . is the sum of the degrees of all vertices in . This problem can be effectively converted to an eigenvalue decomposition problem with some intermediate variables.
2.2. High-Frequency Texture Component
Images consist of multiple components, including the structure component and texture component. The texture component retains the morphological information, while the structure component represents the structure of the image. The texture component can well reveal the essential characteristic of the image. With the information provided by texture components, the images could be effectively reconstructed by compressive sensing methods [28].
There are several techniques for extracting the texture component of images [25,29]. One simple and efficient way for implementation is to extract the high-frequency information. In our previous work [26], the morphology characteristic of the human face image is effectively extracted and utilized for distinguishing different individuals. However, the key information of the IC’s images is the layouts and shapes of the elements. The edges of elements will create the pixel change regions in the images, which can also be effectively captured and extracted by the high-pass filter. Even though the images of ICs are low resolution or noisy, the features extracted by HFTC are sufficient for categorization and beneficial for the following procedures.
3. The Proposed Approach
For most conventional clustering methods, all the information of the data is considered during the procedure. However, when the samples are noisy, these methods might be invalidated, especially when the noise is not sparse or the noise energy is high. When different samples are corrupted by large area pixel loss, traditional methods would probably categorize them into the same cluster due to the high energy of noise. Inspired by our previous work [26] that the HFTC features selected from face images can well maintain the valuable morphology information while the noise is greatly weakened, we believe the key knowledge of the low-quality ICs’ images could be better utilized through the HFTC extraction. Specifically, the valuable information of the ICs’ images exists in the layout of the elements, which can be effectively retained by HFTC extraction. At the same time, the influence of environment noise or pixel loss (caused by block noise, stains, shadows or damages) will be effectively reduced during the extraction procedure, which will promote the success of the following clustering.
The partial images of several object chips are denoted by , where N is the number of samples. The height and width of sample images are denoted by H and W, respectively. Let denote the frequency domain of sample. The can be obtained through two-dimensional Fast Fourier Transformation (2D FFT):
The subscripts and denote the coordinates. In order to reduce the noise and ignore the less important components, a well-designed high-pass filter is applied. After an inverse 2D FFT to the filtered images, the HFTC of the samples can be obtained, denoted by :
It is noteworthy that, due to the diversity of the practical environments and objects, the selection and design of the filter could be different.
According to the Spectral Graph Theory, a graph structure could be constructed by calculating the relationship among data points with an appropriate measurement. Generally, Gaussian Kernel function is a wide choice for measuring the relationship by absolute distance. In this case, it is not a good option. For example, two different chips with similar black regions caused by the same reason could be categorized into the same cluster due to the adjacency measured by absolute distance. Therefore, the correlationship matrix R is estimated by a better relationship evaluation, with the elements defined as:
The denotes the vectorization operation. The is the Frobenius-norm. The element represents the relationship between the ith and lth samples. In order to avoid the meaningless value of the self-correlation, the diagonal elements of are set to be 0 specifically:
Generally, a graph is constructed with fully connected vertices, where every edge between data points is under consideration. In order to further improve efficiency, the less important vertices, which are far from the center, could be ignored. In this paper, a semi-connection graph is constructed by selecting the k nearest points.
Define the cluster indicator , which indicates the belonging relationship of data points. If the ith sample belongs to jth cluster, the jth element of is 1, otherwise is 0. Assume that a dataset with samples of the same object are adjacent to each other. Specifically, there are samples in the pth cluster. Therefore, the indicator vector is with adjacent 1s. We can have the relationship of the indicator vector and the number of samples:
Assisted with , the values of the graph cut can be expressed conveniently as follows:
where represents the degree matrix, which is a diagonal matrix with the elements defined as the sum of rows or columns of . The object function of spectral clustering can be rewritten as:
According to the definition of cluster indicator, the elements of are either 1 or 0. Each vector contains (N is the number of samples) possibilities. When the graph is cut into K sub-graphs, the possibility of the indicator matrix is . The optimization problem is NP-hard and unsolvable. Due to the discrete restriction of , the problems above are NP-hard. In order to make these problems solvable, an alternative continuous solution of is obtained. Set and the problem (10) can be transformed into an optimization problem:
where L is the Laplacian matrix defined by . The is the trace of matrix. Similarly, for Ncut (13), set , and the problem can be written as an optimization objective function:
Therefore, the problems above can be effectively solved with eigenvalue decomposition (EVD). The final discrete cluster indicators are obtained by applying conventional Kmeans to Y. The core steps of the approach are summarized in Algorithm 1. The proposed scheme is easy for implementation with the following major procedures. Given a set of low-quality partial images of multiple chips, the first step is to extract the HFTC of samples by (4) and (5). Subsequently, the semi-connection graph of data points is constructed by (6). Finally, the cluster indicators can be obtained by conducting the spectral clustering methods (12) or (13).
| Algorithm 1: HFSC for the low-quality images of ICs. |
| Input: A set of the partial view images of ICs , number of the clusters K, the order and the cut-off frequency of the Butterworth filter |
| Output: The cluster indicators corresponding to each data point |
| Initialize filter by parameters and |
| for all do |
| Apply 2D FFT to each sample for the frequency domain information as |
| Extract HFTC for all samples by the Butterworth filter according to |
| end for |
| Construct the graph by calculating the element of by |
| Compute the degree matrix |
| Compute the Laplacian matrix |
| Symmetrize by if needed |
| Compute F by solving Function |
| or |
| Obtain the cluster indicators by conducting Kmeans to Y |
4. Experimental Results
For evaluating the effectiveness of the proposed approach, several experiments are conducted in the simulation datasets, which are generated from the real-world scanning electron microscope with different settings.
4.1. Data Preparation
In the implementation, it is hard to collect sufficient samples by limited quantities of the low-resolution equipment. An alternative scheme is to generate simulated samples with the high-quality images for the following reasons. Firstly, the high-quality image itself represents the upper bound of the data samples, which means all “low-quality” images should be in a worse situation than the original high-quality image. Secondly, by setting different downsampling rates, the resolutions could be expediently regulated for simulating different equipment conditions. Last but not least, the signal-to-noise ratio (SNR) of picture is closely related to the sensor size, which is the main difference between the high-precision and low-precision equipment. By covering different strengths and types of noise, the low-quality images are almost consistent with the actual pictures captured by the low-precision equipment. In order to better simulate the practice situation, we entrust an authoritative research institution, named Science and Technology on Reliability Physics and Application of Electronic Component Laboratory, for the high-quality chip images scanned by electron microscope. The full view of one chip is presented in Figure 1. The height and width of this picture are 6960 pixels and 5084 pixels, respectively. Figure 2 presents the local partial views of the full picture. Because of the high-precision equipment and the well-controlled environmental interference, the layout and outlines of elements can be clearly recognized. The defects of chips exist in the scanned images in the form of the irregular black regions (such as the stains in Figure 2).
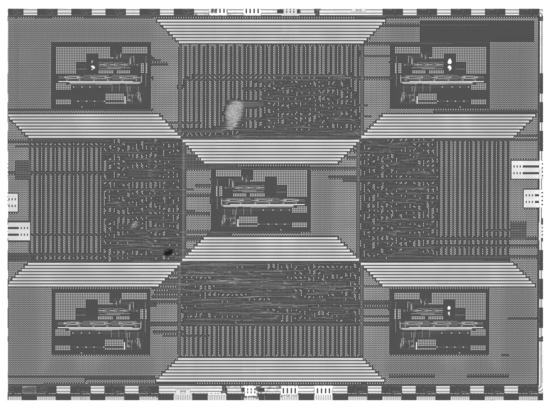
Figure 1.
The full view of the chip’s image scanned by electron microscope.
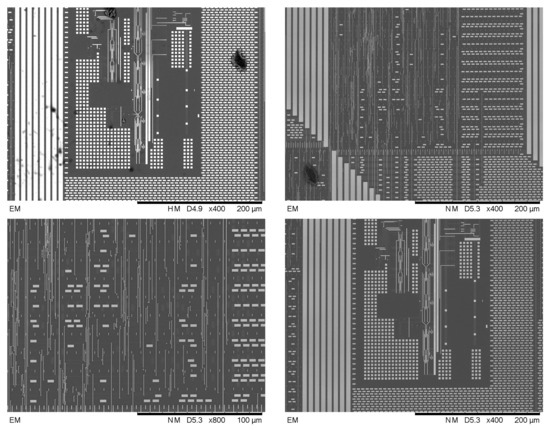
Figure 2.
The partial views of the real-world chip’s image.
Before the clustering experiment, the raw image data of the chip are processed by two major steps. Firstly, all the lines of the raw images are detected by the Hough transform. Then, the required edges and angles of the lines are obtained by a filter in the horizontal direction. Based on the obtained angle, all pictures can be rotated to the unified direction. Secondly, all samples are converted to gray-scale images for the reason that the proposed approach focuses on the texture components rather than the color. The histogram equalization is applied for the gray-scale images in order to widen the gray level range of the samples, which will enhance the contrast of the images. In the practice situation, high-quality images of chips are hard to obtain, limited by the accuracy of the equipment, the interference of environment and the error of operation. Without the high-precision equipment, the full information of a chip usually consists of several partial views scanned by the lower precision lens. We split the full view pictures into several parts and further control the resolution by downsampling in proportion. The real defects of chips are extracted and covered on the simulated data samples by setting different sizes and numbers. The environmental interference is simulated by adding the Gaussian noise and the salt-and-pepper noise in different strengths. Figure 3 presents a part of the simulated low-quality images of ICs. The simulated datasets are presented in the table below.
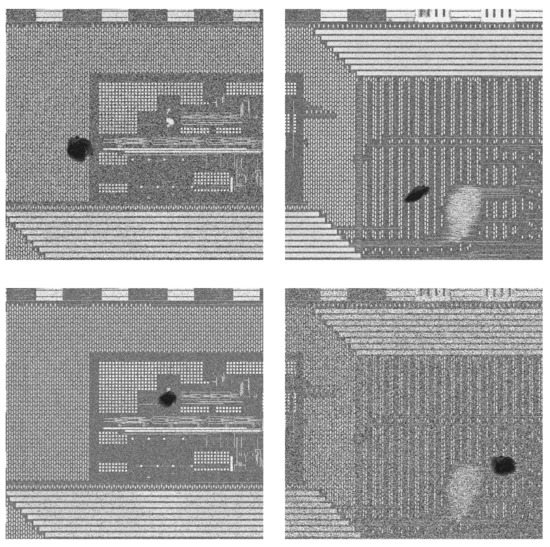
Figure 3.
Data samples corrupted by Gaussian noise or salt-and-pepper noise with different intensity and simulated defects.
The parameters are limited in an appropriate range, which is reasonable in the actual data acquisition. The number after the noise category is the strength parameter. “Gaussian 10” denotes that the intensity of Gaussian noise is 10 dB. “Salt-and-pepper 20” denotes that the density of the salt-and-pepper noise is 20%, which means 20% of pixels are noised. The “10” in “defects” indicates the number of the simulated defects on a chip. The values of the parameter indicate the severity of data corruption.
It is noteworthy that the noise has different structures and distributions in different datasets in practical situations. Therefore, the most suitable filter parameters for different datasets might be different and must be comprehensively considered in practice.
In this section, five general performance indicators are selected. The accuracy (ACC) is calculated by conducting the Hungarian algorithm to best map among ground true labels and cluster results. The normalized mutual information (NMI) is a normalized measurement of the similarity between labels of the same sample. The Purity is an estimate of the proportion, which denotes how many samples are correctly categorized to all samples. The F-measure (F) is obtained by calculating the weighted ratio of precision and recall. The adjust rand index (ARI) indicates the similarity between two clusters. The mentioned indicators will be recorded as percentage. The larger indicator values denote the better clustering performance.
4.2. Single Factor
In this section, the influence of a single factor will be tested. The unexpected defects could be in various sizes. The data corruption during the transmission will also cause the pixel loss. These situations can be simulated by setting different sizes and numbers of the defects, which can cause the pixel loss and create the black regions.
In this experiment, datasets are set up with the same salt-and-pepper noise in 20% density and gradually increase the size or number of the black regions. The accuracy of the HFSC and the baseline methods are presented by the line chart in Figure 4 and Figure 5. As can be seen, the proposed approach obtains the best clustering performance compared to the baselines. Furthermore, when the size or number of the defects increases, the conventional clustering techniques may suffer from the impact caused by the pixel loss and the accuracy tends to decrease. On the contrary, the proposed approach can well maintain the valuable information and weakened the influence of the corruption, so that the accuracy can hold at a high level.
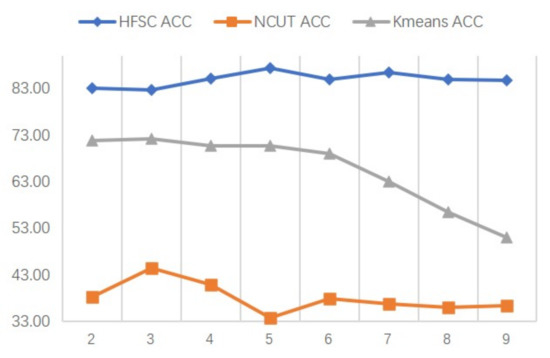
Figure 4.
The clustering accuracy varies with the size of the defects. The diamond, square and triangle represent the HFSC, Ncut and Kmeans, respectively.
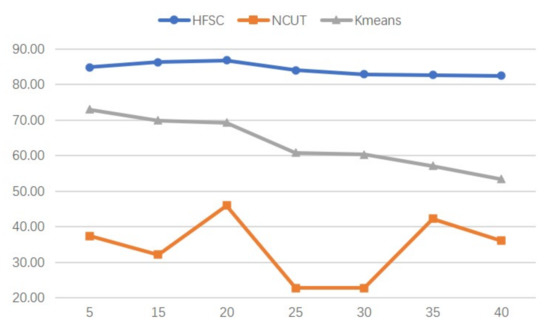
Figure 5.
The clustering accuracy varies with the number of the defects. The diamond, square and triangle represent the HFSC, Ncut and Kmeans, respectively.
4.3. Comprehensive Factors
In this section, the effects of comprehensive factors will be tested. We conduct clustering to the simulated datasets both in different noise and pixel loss conditions. The setups for the objected datasets are listed in Table 1 with the corresponding indexes. The clustering results are presented in Table 2 and Table 3 by the five performance indicators. Three conventional clustering methods are selected for comparison, including spectral clustering with normalized cut (Ncut), Kmeans and sparse subspace clustering (SSC) [30]. Two newer clustering algorithms from recent years are also added for comparison, USENC [31] and SC-SRGF [32]. As shown in the table, HFSC achieves the best performances among all datasets. Furthermore, the proposed approach has a stability property. As the intensity of noise and the level of the pixel loss changes, the performances of the general methods may oscillate. Specifically, the accuracy of Ncut, Kmeans and SSC are fluctuating in the range of 15.83%, 21.67% and 16.67%, respectively. Most of the situations’ HFSC achieve 100% accuracy and fluctuate within 6% in the remaining datasets. This phenomenon reveals that our approach can well maintain the valuable information of the low-quality ICs’ images with different corruptions. Moreover, the stability property of the proposed approach can well deal with ICs’ images captured in the various conditions.

Table 1.
Simulated datasets with different settings.
Table 2.
The clustering performances of the proposed approach and the comparison methods for the simulated datasets (1∼6). The bold denotes the best results.
Table 3.
The clustering performances of the proposed approach and the comparison methods for the simulated datasets (7∼12). The bold denotes the best results.
There are still some directions of the proposed approach that are worth studying in the future. In order to obtain the valuable features, expert guidance is needed for the parameters tuning of the filters. It will be great progress to propose a scheme which can tune the parameters without the prior human knowledge. Moreover, there may be a challenge for this approach to obtain a high accuracy for very large ICs, chips or data with high noise and a large number of defects. Furthermore, how to effectively utilize the HFTC information to improve the existing verification techniques is worth exploring.
5. Conclusions
In this paper, we focus on the low-quality images of integrated circuits. With the developing needs of the verification in IC manufacturing, many techniques have been invented for defects and hardware Trojan detection. However, most of the existing methods have a strict requirement for the quality of data images. In practice, the high-quality images can only be captured by the high-precision equipment in a strictly controlled environment, which is expensive. Furthermore, interference is unavoidable due to mechanical error or the workmanship. In a normal manufacturing environment, the visual range and resolution of the camera are limited. The objected chips are scanned by multiple partial views, which may suffer from noise and data corruption. Therefore, an approach is proposed in this paper for processing the low-quality images in order to provide a data foundation for the following verification tasks. The high-frequency texture components of the samples are firstly extracted, which contain the morphological features of images. Assisted with the correlationship among the HFTC of samples, a graph structure of data points is constructed. The clustering indicators are obtained by conducting a normalized cut to the graph. The simulated datasets are made from the real-work scanning electron microscope of chips in various conditions according to the practice data acquisition. The experiments in simulated datasets reveal the effectiveness of the proposed approach with the high clustering precision and the stable property to the level of the data corruption.
Author Contributions
Conceptualization, Z.L., J.L., Y.L. and X.X.; methodology, Z.L.; software, G.T.; validation, Z.L., J.L.and Y.L.; formal analysis, Z.L.; investigation, Z.L., Y.L. and C.S.; resources, J.L., Y.L. and C.S.; data curation, G.T., C.S. and L.Z.; writing—original draft preparation, Z.L.; writing—review and editing, J.L. and Y.L.; visualization, G.T.; supervision, X.X., Y.L. and L.Z.; project administration, J.L.; funding acquisition, Y.L., J.L. and C.S. All authors have read and agreed to the published version of the manuscript.
Funding
This research was funded by the Key-Area Research & Development Program of Guangdong Province grant number 2019B010145001, National Natural Science Foundation of China grant number 62001127 and Guangzhou Municipal Science and Technology Project grant numbers 202102021077 and 201904010210. The APC was funded by 2019B010145001.
Conflicts of Interest
The authors declare no conflict of interest.
References
- Zhang, Z.; Lu, Y.; Lv, C.; Mao, Q.; Yan, S. Restoration of integrated circuit terahertz image based on wavelet denoising technique and the point spread function model. Opt. Lasers Eng. 2021, 138, 106413. [Google Scholar] [CrossRef]
- Chao, Y.; Ma, C.; Shan, W.; Feng, J.; Zhang, Z. Adaptive Directional Cubic Convolution for Integrated Circuit Chip Defect Image Interpolation. Int. J. Circuits 2021, 15, 1084–1090. [Google Scholar] [CrossRef]
- Zhou, B.; Aksoylar, A.; Vigil, K.; Adato, R.; Joshi, A. Hardware Trojan Detection using Backside Optical Imaging. IEEE Trans. Comput.-Aided Des. Integr. Circuits Syst. 2020, 40, 24–37. [Google Scholar] [CrossRef]
- Nasr, A.A.; Abdulmageed, M.Z. Automatic Feature Selection of Hardware Layout: A Step toward Robust Hardware Trojan Detection. J. Electron. Test. 2016, 32, 357–367. [Google Scholar] [CrossRef]
- Xue, M.; Bian, R.; Wang, J.; Liu, W. Building an accurate hardware Trojan detection technique from inaccurate simulation models and unlabelled ICs. Comput. Digit. Tech. IET 2019, 13, 348–359. [Google Scholar] [CrossRef]
- Ye, M.; Zhang, D.; Yap, Y.K. Recent Advances in Electronic and Optoelectronic Devices Based on Two-Dimensional Transition Metal Dichalcogenides. Electronics 2017, 6, 43. [Google Scholar] [CrossRef]
- Kaintura, A.; Dhaene, T.; Spina, D. Review of Polynomial Chaos-Based Methods for Uncertainty Quantification in Modern Integrated Circuits. Electronics 2018, 7, 30. [Google Scholar] [CrossRef]
- Roy, J.A.; Koushanfar, F.; Markov, I.L. EPIC: Ending piracy of integrated circuits. In Proceedings of the Design, Automation and Test in Europe, DATE 2008, Munich, Germany, 10–14 March 2008. [Google Scholar]
- Alasad, Q.; Yuan, J. Logic Obfuscation against IC Reverse Engineering Attacks Using PLGs. In Proceedings of the IEEE International Conference on Computer Design, Boston, MA, USA, 5–8 November 2017; pp. 341–344. [Google Scholar]
- Qutaiba, A.; Yu, B.; Yuan, J.S. E2LEMI:Energy-Efficient Logic Encryption Using Multiplexer Insertion. Electronics 2017, 6, 16. [Google Scholar]
- Alasad, Q.; Yuan, J.S.; Bi, Y. Logic Locking Using Hybrid CMOS and Emerging SiNW FETs. Electronics 2017, 6, 69. [Google Scholar] [CrossRef]
- Alasad, Q.; Lin, J.; Yuan, J.S.; Fan, D.; Awad, A. Resilient and Secure Hardware Devices Using ASL. ACM J. Emerg. Technol. Comput. Syst. (JETC) 2021, 17, 1–26. [Google Scholar] [CrossRef]
- Guo, F.; Guan, S.A. Research of the Machine Vision Based PCB Defect Inspection System. In Proceedings of the 2011 International Conference on Intelligence Science and Information Engineering, Wuhan, China, 20–21 August 2011. [Google Scholar]
- Courbon, F.; Loubet-Moundi, P.; Fournier, J.; Tria, A. SEMBA: A SEM Based Acquisition technique for fast invasive Hardware Trojan detection. In Proceedings of the European Conference on Circuit Theory & Design, Trondheim, Norway, 24–26 August 2015. [Google Scholar]
- Vashistha, N.; Rahman, M.T.; Shen, H.; Woodard, D.L.; Asadizanjani, N.; Tehranipoor, M. Detecting Hardware Trojans Inserted by Untrusted Foundry Using Physical Inspection and Advanced Image Processing. J. Hardw. Syst. Secur. 2018, 2, 333–344. [Google Scholar] [CrossRef]
- Shi, Q.; Vashistha, N.; Lu, H.; Shen, H.; Asadizanjani, N. Golden Gates: A New Hybrid Approach for Rapid Hardware Trojan Detection using Testing and Imaging. In Proceedings of the 2019 IEEE International Symposium on Hardware Oriented Security and Trust (HOST), McLean, VA, USA, 5–10 May 2019. [Google Scholar]
- Sun, C.; Li, L.; Zhou, W.; Tan, X.; He, Y. Research on the Detection Method of HOG-SVM for Doping Modified Hardware Trojan. J. Phys. Conf. Ser. 2020, 1550, 032086. [Google Scholar] [CrossRef]
- Vashistha, N.; Lu, H.; Shi, Q.; Rahman, M.T.; Tehranipoor, M.M. Trojan Scanner Detecting Hardware Trojans with Rapid SEM Imaging Combined with Image Processing and Machine Learning. In Proceedings of the 44th International Symposium for Testing and Failure Analysis, Phoenix, AZ, USA, 28 October–1 November 2018. [Google Scholar]
- Hammouda, H.B.; Mongia, M.; Zièd, G.; Kamel, B. Neural-Based Models of Semiconductor Devices for SPICE Simulator. Am. J. Appl. Sci. 2008, 5, 385–391. [Google Scholar] [CrossRef]
- Bahubalindruni, P.G.; Tavares, V.G.; Barquinha, P.; Duarte, C.; Cardoso, N.; Oliveira, P.; Martins, R.; Fortunato, E. a-GIZO TFT neural modeling, circuit simulation and validation. Solid State Electron. 2015, 105, 30–36. [Google Scholar] [CrossRef][Green Version]
- Ismail, A.; Jeng, D.S.; Zhang, L.L. An optimised product-unit neural network with a novel PSO–BP hybrid training algorithm: Applications to load–deformation analysis of axially loaded piles. Eng. Appl. Artif. Intell. 2013, 26, 2305–2314. [Google Scholar] [CrossRef]
- Hou, C.; Xiao, Y.; Cao, Y.; Lai, C.; Cao, Y. Prediction of synchronous closing time of permanent magnetic actuator for vacuum circuit breaker based on PSO-BP. IEEE Trans. Dielectr. Electr. Insul. 2017, 24, 3321–3326. [Google Scholar] [CrossRef]
- Hayati, M.; Rezaei, A.; Seifi, M. CNT-MOSFET modeling based on artificial neural network: Application to simulation of nanoscale circuits. Solid-State Electron. 2010, 54, 52–57. [Google Scholar] [CrossRef]
- Peng, Y.; Deng, W.; Luo, Z.; Wu, J.; Huang, J. Hybrid modeling routine for metal-oxide TFTs based on particle swarm optimization and artificial neural network. Electron. Lett. 2020, 56, 453–456. [Google Scholar] [CrossRef]
- Sharma, R.; Sharma, G.K.; Pattanaik, M. A Few Shot Learning based Approach for Hardware Trojan Detection using Deep Siamese CNN. In Proceedings of the 34th International Conference on VLSI Design and 20th International Conference on Embedded System (VLSID), Guwahati, India, 20–24 February 2021. [Google Scholar]
- Liang, Z.; Guo, S.; Liu, D.; Li, J. Spectral clustering based on high-frequency texture components for face datasets. IET Image Process. 2021, 15, 2240–2246. [Google Scholar] [CrossRef]
- Surhone, L.M.; Tennoe, M.T.; Henssonow, S.F. Spectral Graph Theory; American Mathematical Society: Providence, RI, USA, 2010. [Google Scholar]
- Sun, Y.; Chen, J.; Liu, Q.; Liu, B.; Guo, G. Dual-Path Attention Network for Compressed Sensing Image Reconstruction. IEEE Trans. Image Process. 2020, 29, 9482–9495. [Google Scholar] [CrossRef]
- Suresh, G.; Rao, C.S. Copy Move Forgery Detection through Differential Excitation Component-Based Texture Features. Int. J. Digit. Crime Forensics 2020, 12, 27–44. [Google Scholar] [CrossRef]
- Elhamifar, E.; Vidal, R. Sparse subspace clustering. In Proceedings of the IEEE Conference on Computer Vision & Pattern Recognition, Miami, FL, USA, 20–25 June 2009. [Google Scholar]
- Huang, D.; Wang, C.D.; Wu, J.; Lai, J.; Kwoh, C.K. Ultra-Scalable Spectral Clustering and Ensemble Clustering. IEEE Trans. Knowl. Data Eng. 2019, 32, 1212–1226. [Google Scholar] [CrossRef]
- Cai, X.; Huang, D.; Wang, C.D.; Kwoh, C.K. Spectral Clustering by Subspace Randomization and Graph Fusion for High-Dimensional Data. In Pacific-Asia Conference on Knowledge Discovery and Data Mining; Springer: Berlin/Heidelberg, Germany, 2020; pp. 330–342. [Google Scholar]
Publisher’s Note: MDPI stays neutral with regard to jurisdictional claims in published maps and institutional affiliations. |
© 2022 by the authors. Licensee MDPI, Basel, Switzerland. This article is an open access article distributed under the terms and conditions of the Creative Commons Attribution (CC BY) license (https://creativecommons.org/licenses/by/4.0/).