Article

Time Series Network Data Enabling Distributed Intelligence—A Holistic IoT Security Platform Solution

by
Aikaterini Protogerou
1,2,
Evangelos V. Kopsacheilis
1,*,
Asterios Mpatziakas
1,
Kostas Papachristou
1,
Traianos Ioannis Theodorou
1,
Stavros Papadopoulos
1,
Anastasios Drosou
1 and
Dimitrios Tzovaras
1
1
Information Technologies Institute, Centre of Research & Technology—Hellas, 6th Km Harilaou—Thermi, 57001 Thessaloniki, Greece
2
Department of Applied Informatics, University of Macedonia, 156 Egnatia Str., 54636 Thessaloniki, Greece
*
Author to whom correspondence should be addressed.
Electronics 2022, 11(4), 529; https://doi.org/10.3390/electronics11040529
Submission received: 31 December 2021 / Revised: 31 January 2022 / Accepted: 4 February 2022 / Published: 10 February 2022

Abstract

:
The Internet of Things (IoT) encompasses multiple fast-emerging technologies controlling and connecting millions of new devices every day in several application domains. The increased number of interconnected IoT devices, their limited computational power, and the evolving sophistication of cyber security threats, results in increased security challenges for the IoT ecosystem. The diversity of IoT devices, and the variety of QoS requirements among several domains of IoT application, impose considerable challenges in designing and implementing a robust IoT security solution. The aim of this paper is to present an efficient, robust, and easy-to-use system, for IoT cyber security operators. Following a by-design security approach, the proposed system is a platform comprising four distinct yet cooperating components; a distributed AI-enhanced detection of potential threats and anomalies mechanisms, an AI-based generation of effective mitigation strategies according to the severity of detected threats, a system for the verification of SDN routing decisions along with network- and resource-related policies, and a comprehensive and intuitive security status visualization and analysis. The distributed anomaly detection scheme implementing multiple AI-powered agents is deployed across the IoT network nodes aiming to efficiently monitor the entire network infrastructure. Network traffic data are fed to the AI agents, which process consecutive traffic samples from the network in a time series analysis manner, where consecutive time windows framing the traffic of the surrounding nodes are processed by a graph neural network algorithm. Any detected anomalies are handled by a mitigation engine employing a distributed neural network algorithm, which exploits the recorded anomalous events and deploys appropriate responses for optimal threat mitigation. The implemented platform also includes the hypothesis testing module, and a multi-objective optimization tool for the quick verification of routing decisions. The system incorporates visualization and analytics functionality and a customizable user interface.

1. Introduction

During the last decade, the Internet of Things (IoT) emerged as the next big wave of innovation, with unlimited possibilities for changing the way people live. Initiated from the interconnection of RFID devices, it is estimated that the number of connected objects exceeded the number of people connected to the Internet in the late 2010s. In 2020, the evolution of IoT led to an installed basis of 20 billion interconnected devices globally [1]. The dynamics of IoT market growth are also depicted in the forecasts relevant to the needs of IoT device connectivity. Ericsson predicts that global revenue of the communications service provider IoT will increase at a combined annual growth rate of 24.9% until 2023 [2]. In 2020, 1.5 billion IoT devices were connected via cellular 3GPP (3rd Generation Partnership Project) access technologies. This figure will reach 5 billion by 2025.
The evolution of information technologies created new opportunities for malicious activity against targets connected to the internet. More and more assets are connected to the internet, while the proliferation of novel devices such as smartphones offers additional methods of intrusion. The number of cyber threats has increased in number and become more sophisticated and novel. Cyber attacks are the fastest-growing crime regarding the IoT. In December 2020, the estimated cost of cybercrime to the global economy was reported to be more than EUR 880 billion each year [3].
In this landscape, cyber security for IoT is an even more challenging objective due to the key intrinsic features of IoT infrastructures and vulnerabilities. These emerge as a result of the large number of installed devices, combined with their limited computing power and the fact that they are often deployed in an unattended, automated and poorly managed way (e.g., in many cases they use of the default passwords). The limited computing power, a consequence of the need for lower device costs and low energy consumption, allows the IoT devices to connect to the internet, where they can be easily compromised and even recruited by the attacker to launch further attacks. At the same time, the limited computing power combined with the need for reduced energy consumption does not allow the deployment of conventional countermeasures running on each device. Furthermore, a critical fact with considerable impact regarding the IoT security challenges is the lack of relevant international standards. The IoT implementations have emerged with a rapid pace in recent years due to the effectiveness of device connectivity offered by the internet, without a corresponding evolution in standardization. As a result, a standardization gap is evident so far.
The rest of this paper is organized as follows: Section 2 presents the design and methodology steps and discusses the system architecture by analyzing each separate implemented module. Section 3 shows the experimental results of the anomaly detection and mitigation algorithms against distinct attack cases. Finally, Section 4 concludes the paper and presents a discussion of the research findings and the authors’ future work prospects.

1.1. Rationale

The internetworking of IoT devices (i.e., their interconnection to core networks or to the cloud), for the majority of cases, is a task allocated to edge-routing devices operating in heterogeneous networks. These devices offer additional potential targets for the attacker. The deployment of edge devices in heterogeneous networking environments has dramatically increased with the adoption of IoT technology around the globe. Along with the expansion of IoT infrastructures came an increase in adversarial actions of variable severity, which aimed to affect the continuity of provided services or gain access to sensitive information, both at an individual and organizational level. Additionally, IoT ecosystems with time-sensitive services, e.g., intelligent transportation systems, smart manufacturing or medical care, have emerged, where the risk of imminent cyberattacks needs to be detected in a timely manner allowing for prompt mitigation actions.
The attacks against IoT infrastructures increase as device connectivity evolves. They become more and more sophisticated as known types of attacks develop into new forms and combinations. Denial-of-service, malware and port-scanning attacks are closely connected to IoT technology, often targeting specific hardware with known vulnerabilities, such as edge systems bearing particular processors. The connection of “Things” to the internet exposes them to distributed attacks, where abnormal traffic originates from multiple network sources. Frequently, IoT devices are deployed using default passwords, unpatched exploitable firmware or present security holes in authentication and authorization mechanisms. This results in very weak security levels, making IoT devices tempting targets for attackers. The plethora of hackable IoT devices presents an additional threat because it allows attackers to formulate huge botnets. Likewise, port-scanning attacks have become more sophisticated in order to determine open ports running particular applications and services.
Such vulnerabilities and attacks targeting services of the IoT have significant economic and security consequences. Therefore, implementing effective and secure IoT platforms and networks is valuable for both the industry and end-users. Within this context, a generic, secure IoT framework was designed and implemented aiming to optimize the security in IoT networks in a cross-layered manner, utilizing advanced methods for the detection and mitigation of diverse types of threats along with smart tools for decision support.
The aim of this paper is to present an efficient, robust, and easy-to-use system for IoT cyber security operators. Following a by-design security approach, the proposed system is a platform comprised by four distinct yet cooperating components. The system components offer the following functionality: (a) detection of potential threats and anomalies, (b) generation of effective mitigation strategies according to the severity of detected threats, (c) verification of SDN routing decisions along with network- and resource-related policies, and (d) comprehensive and intuitive security status visualization and analysis (i.e., put humans in the loop for reasoning, hypothesis testing and interference in decision making). The above functionality is achieved by using multiple artificial intelligence (AI) and machine learning (ML) techniques. For the detection of anomalies and identification of threats, we apply such AI and ML techniques on a model time series consisting of successive samples of network traffic data.

1.2. Related Work

IoT system security has been a matter of extensive research by both academia and the industry over the past several years. The dynamic nature of such a complex infrastructure poses a significant abstraction when it comes to continuous service provision and fault tolerance: Due to this nature, various diverse approaches were proposed. In the following section, some indicative research on the subject, focusing on systems that use AI for IoT cyber security, is presented. In [4], anomaly detection-as-a-Service is proposed on top of VARYS—a technology-agnostic Monitoring-As-a-Service framework. The conducted work addresses the detection of anomalies in an efficient way as part of a holistic system where operators can configure monitoring and detecting services. In [5], a system titled CAMLPAD is proposed. The platform supports data analysis and anomaly detection in a real-time approach. It utilizes a number of ML approaches to analyze data, and then visualizes the results in order to assist the administrator’s decision making. A holistic approach to edge computing offloading using AI technology is also proposed in [6]. The framework sits squarely with the technology of the industrial IoT (IIoT), in which the need for service accuracy and low delay is prominent. Another study [7] proposed a data-driven IoT security system. The described architecture presents a Big-Data-oriented approach for intelligent data collection, monitoring and analysis, and security assessment, in order to provide an end-to-end solution for a platform called “Secure IoT”. In [8], a threat detection system for a wireless sensor network (WSN) is presented. In an attempt to increase the network security level, a central system comprising the core, text user interface, analysis, detection, data storage and data visualization works in conjunction with the mobile platform subsystem that is responsible for applying passive or active threat detection. In [9], a paradigm of using a time series analysis with deep learning is presented. This approach leads to enhanced feature extraction, compared to traditional analysis approaches. A method for anomaly detection using time series and deep learning methods in cyber security applications is presented in [10]. This method demonstrated, in a bank applications environment, the fast detection of suspicious operator activity as soon as it was happening (during the first hour), while other methods could identify the threat only after a long period of time (days). In [11], a method to capture the distribution of multivariate time series of sensors and actuators under normal working conditions of a cyber-physical system (i.e., an extensive and critical IoT ecosystem) is presented. This work proposed a novel generative adversarial networks-based anomaly detection (GAN-AD) method for such complex networked CPSs. In this article [12], a low-cost method for real-time, on-road vehicle recognition is introduced. The so called SenseMag method implements a map of sensors and aggregates magnetic signal information each time a vehicle arrives or departs from a sensor point. Adopting a hierarchical recognition model, it first estimates the speed/velocity and distance between sensor nodes, and then predicts the length of the vehicle. Contributing to the research of magnetic sensing approaches, this article adopts several semiautomated learning techniques in order to design filters, features and hyperparameters and achieve the highest recognition accuracy. In [13], DRA-EERS, a dynamic routing algorithm for software-defined wireless sensor networks (SDWSNs) is proposed, based on energy-efficient relay selection. To find the best path according to energy-efficient criteria, first, the state-transition probability of each node is calculated and a link weight is attributed to the network links relevant to the link cost and reward values, while considering the location of the nodes. An adjustable coefficient is set to accommodate the trade-off between energy efficiency and throughput, proving the algorithms’ outperformance compared to Dijkstra’s shortest path algorithm. In [14], the residual-energy aware feature of a sensor node in time-varying wireless sensor networks is studied and modelled as a Markov chain. The aim of the authors was to evaluate the state-transition probability of a network node, with regard to its energy level, and then propose an energy-efficient routing algorithm. An effort was made towards showcasing how the proposed algorithm can effectively extend the network’s lifetime while considering node-residual energy changes. In this paper [15], a framework based on a deep attention graph convolutional network is proposed. The aim of the paper was to address the challenge of classifying high-resolution hyperspectral images of physical and chemical non-Euclidean structures. The authors integrate an attention mechanism by proposing a new similarity measurement method and design a deep graph convolutional network to extract deep abstract features of the hyperspectral images in an attempt to distinguish similar bands from high-dimensional spectral space, focus on important spectral information, and extract non-Euclidean features, ultimately showcasing the outperformance of the proposed framework compared to baselines in terms of several evaluation criteria. This paper [16] proposes a distributed clustering algorithm to organize resources in IoT environments based on agents. In this approach, a structure of agents is constructed, while each represents a single smart device. Neighbouring agents are assigned to similar vectorized content, thus leading to the virtual grouping of agents of similar functionality, which in turn renders the discovery operations faster and more efficient in a highly dynamic IoT environment.

1.2.1. Previous Work in Anomaly Detection Techniques

Several research studies have proposed graph-based anomaly detection techniques, which involve modelling IoT entities and their communication links as the nodes and edges of a graph network. In [17], a graph-based anomaly detection study was described, in which web traffic (i.e., web requests and connections to web servers) was modelled using graphs to identify potential botnets. In [18], temporal features were gathered to identify anomalous graph edges inside dynamic graphs implementing an attention-based temporal graph convolutional network (GCN) model. Another dynamic graph anomaly detection system was proposed in [19], using deep auto-encoders in combination with clustering techniques on the network’s nodes to detect anomalies in real time. In [20], another approach, that used a Graph Neural Network (GNN) to detect anomalies was proposed. The interconnections of the relevant nodes, as well as numerous topological properties of the graph, were taken into account in the computed adjacency matrix in this study. The studies of [21,22] presented edge-level anomaly detection algorithms. The malicious edges were examined using the density of sub-graphs, as well as structural, temporal, and content feature extraction and a greedy search mechanism. In [23], a probabilistic approach was used to suggest an anomalous node detection model. In [24] a comprehensive overview of recurrent, convolutional, auto-encoder, and spatial-temporal graph neural network techniques was provided, leading to a taxonomy of GNN processes used in various IoT application domains. In [25,26], agents employing a GNN model were proposed to provide both localized monitoring in IoT networks and feature exchange in a distributed synergistic detection mechanism. This SoA method was implemented in conjunction with an SoA mitigation algorithm and verification tool to construct a holistic approach to security in IoT environments. The study of [27] exploits a multi-agent algorithm to propose an anomaly detection method, based on activity footprints. The IoT2Vec method is used to translate usage logs and activities into high-dimensional, real-valued vectors, attempting to group similar services’ behaviours and allow for comparisons. A multi-agent system is implemented, enabling communication in a peer-to-peer mode. Each agent reflects the activity of certain IoT devices and is able to move in a virtual grid space, in a way that groups of agents moving closely and forming clusters represent normally operating devices, whereas outcast agents suggest dissimilar unexpected behaviour.

1.2.2. Previous Work in the Mitigation of Anomalies

There are two distinct approaches to the mitigation of threats in cyber systems under attack, including IoT networks. The first approach focuses on the mitigation of a specific attack type or method, e.g., a sinkhole attack where the attacker causes large traffic flows to pass from a node under their control in order to obtain data; this can be mitigated by more secure protocols. Various comprehensive reviews contain such approaches, such as [28]. The second approach is to utilize a scheme to select the appropriate countermeasures to the threats or attacks faced by the system based on the values of some predefined security-related metrics. This approach allows the mitigation of attacks from multiple sources and/or steps. These solutions can be further divided into four separate subgroups: the first group includes approaches that measure the values of one or more KPIs but offer no automation in terms of countermeasure selection. An example is presented in [29], where the values for some KPIs, calculated based on multiple sets of different mitigation action choices, are presented numerically and visually to the security operator. The second group involves approaches that automate the mitigation of attacks using heuristic methods based on thresholds for the values of KPIs. Such an example is presented in [30]: based on predefined scenarios and values, the system chooses sets of predefined responses. The third group includes approaches where the selection of mitigation actions is based on the optimization of the value of a single KPI or transforming the problem to a single objective problem, e.g., [31], where the authors select attack responses based on minimizing the cost of deploying them. Finally, the fourth class includes the approaches where the selection of mitigation actions is based on the optimization of the values of multiple KPIs which might be antagonistic to each other but better describe the impact of the action on the system. This approach was chosen for the proposed mitigation module while other examples are available in [32,33].

1.2.3. Previous Work in Verification Techniques

Policy-based schemas control security incidents that occur throughout the wide deployment of IoT infrastructure, such as the incident concerning the smart city domain, which is the case in [34]. In this approach, data, wireless network topology and IoT devices are examined for untrustworthiness considering their reporting history and the predefined policy rules. Evidently, IoT systems are susceptible to attacks that originate from an ever-changing heterogeneous nature, which in fact impedes the conformance to privacy and security attributes. Of course, policy frameworks do not affect only security regulation but also the influence other parameters with respect to the overall system’s performance. This is the case regarding cloud-provided services. A trade-off between minimum response time, minimum cost, ease of deployment, and adequate resources utilization within numerous data centres formulate a policy that aims to achieve the high performance described in [35]. Service broker policy is identified as the mechanism responsible for supporting routing decisions in the general concept of meeting user needs by allocating services in the most optimized manner, (with respect to the aforementioned measurements). Several brokerage policy algorithms were proposed considering different success parameters, as presented in [36], where three cost-aware, service-brokering algorithms and a load-balancing algorithm, were proposed. The latter define policies with the intention of minimizing the processing and response time by distributing scheduled activities in the most effective manner. The policy-based selection of resources in the cloud was also considered in [37], where a focus is drawn to services lifecycle management. This procedure involves a service manager, which coordinates the services, including construction, management, reporting, metering and/or auditing. The most important parameter to take into account is the quality of services provided. As described, the on-demand provision of services is needed in all scenarios of IoT development. Big Data produced by the communication of several edge devices necessitates handling policies, which consider delay and bandwidth levels, setting as a goal a successful equilibrium between low latency, high accuracy and generality in order to support interoperable operation among infrastructures. Such design policy is defined in [38], where the main components involved in fog architecture refer to the authentication and authorization mechanisms, offloading management, location services, system monitoring, resource management and VM scheduling. Analysing the data derived from the fog operation is also a challenging task, as addressed in [39]. A policy for data analytics is proposed, conforming to cost-efficient resource provisioning and low computational complexity to guarantee QoS.

1.2.4. Previous Work in Visual Analytics Systems

While there are numerous approaches to detect and mitigate cyber attacks against critical infrastructures, including IoT networks, the majority of studies fail to take into account their integration into a single control system [40]. Data from multiple cyber security modules can quickly become complex and large, and a user-friendly method to effectively utilize such data is through visualization [41], which is enabled though data mining and statistics [42]. Visualizations should provide a receptive method, enhancing the security operators’ knowledge to allow them to discover explanations for observed anomalous situations in the network [43]. Additionally, the application of the visualization of cyber-security-related incidents can enhance cyber security awareness, even in non-expert users [44] and increase threat- and security-related knowledge transfer between users [45]. For readers further interested in this subject, there are numerous reviews on network security visualization, such as [41,42,43].

1.2.5. Novel Contributions

Contrary to the current state-of-the-art approaches in this work, we provide a solution to confront and manage security threats in IoT environments in a holistic manner, by synergistically accommodating routing verification, anomaly detection, and mitigation actions in IoT networks, all interconnected and visualized in an enriched, user-friendly visual analytics module. A key feature of the proposed platform is the combination of separate SoA techniques, which tackle the challenges of anomaly detection and mitigation in a novel architecture enhanced with AI mechanisms. In terms of anomaly detection, the implementation of the graph neural network model works in a distributed manner employing a multi-agent structure, which reflects the network of IoT nodes and their interconnections, thus enabling scalability in highly demanding and dynamic IoT ecosystems. In this approach, the agents independently monitor local IoT nodes by extracting network statistics. In addition to well-known merits of multi-agent systems, information exchange among the network of agents, enables them to obtain an overview of their directly attached neighbourhood, hence recognizing an imminent threat on nodes that are one step away from them. To accommodate the low complexity of the detection strategy, the number of agents required is customizable to the size of the underlying IoT environment. In conjunction, a mitigation engine initiates actions implementing a multi-objective deep reinforcement learning algorithm to find the optimal countermeasures. Aside from being based on SoA, AI detection and mitigation principles, the proposed solution presents a unified verification methodology responsible for estimating the effectiveness of SDN routing decisions, taking into account energy consumption, QoS, and thus considering the need for resource-constrained IoT solutions.

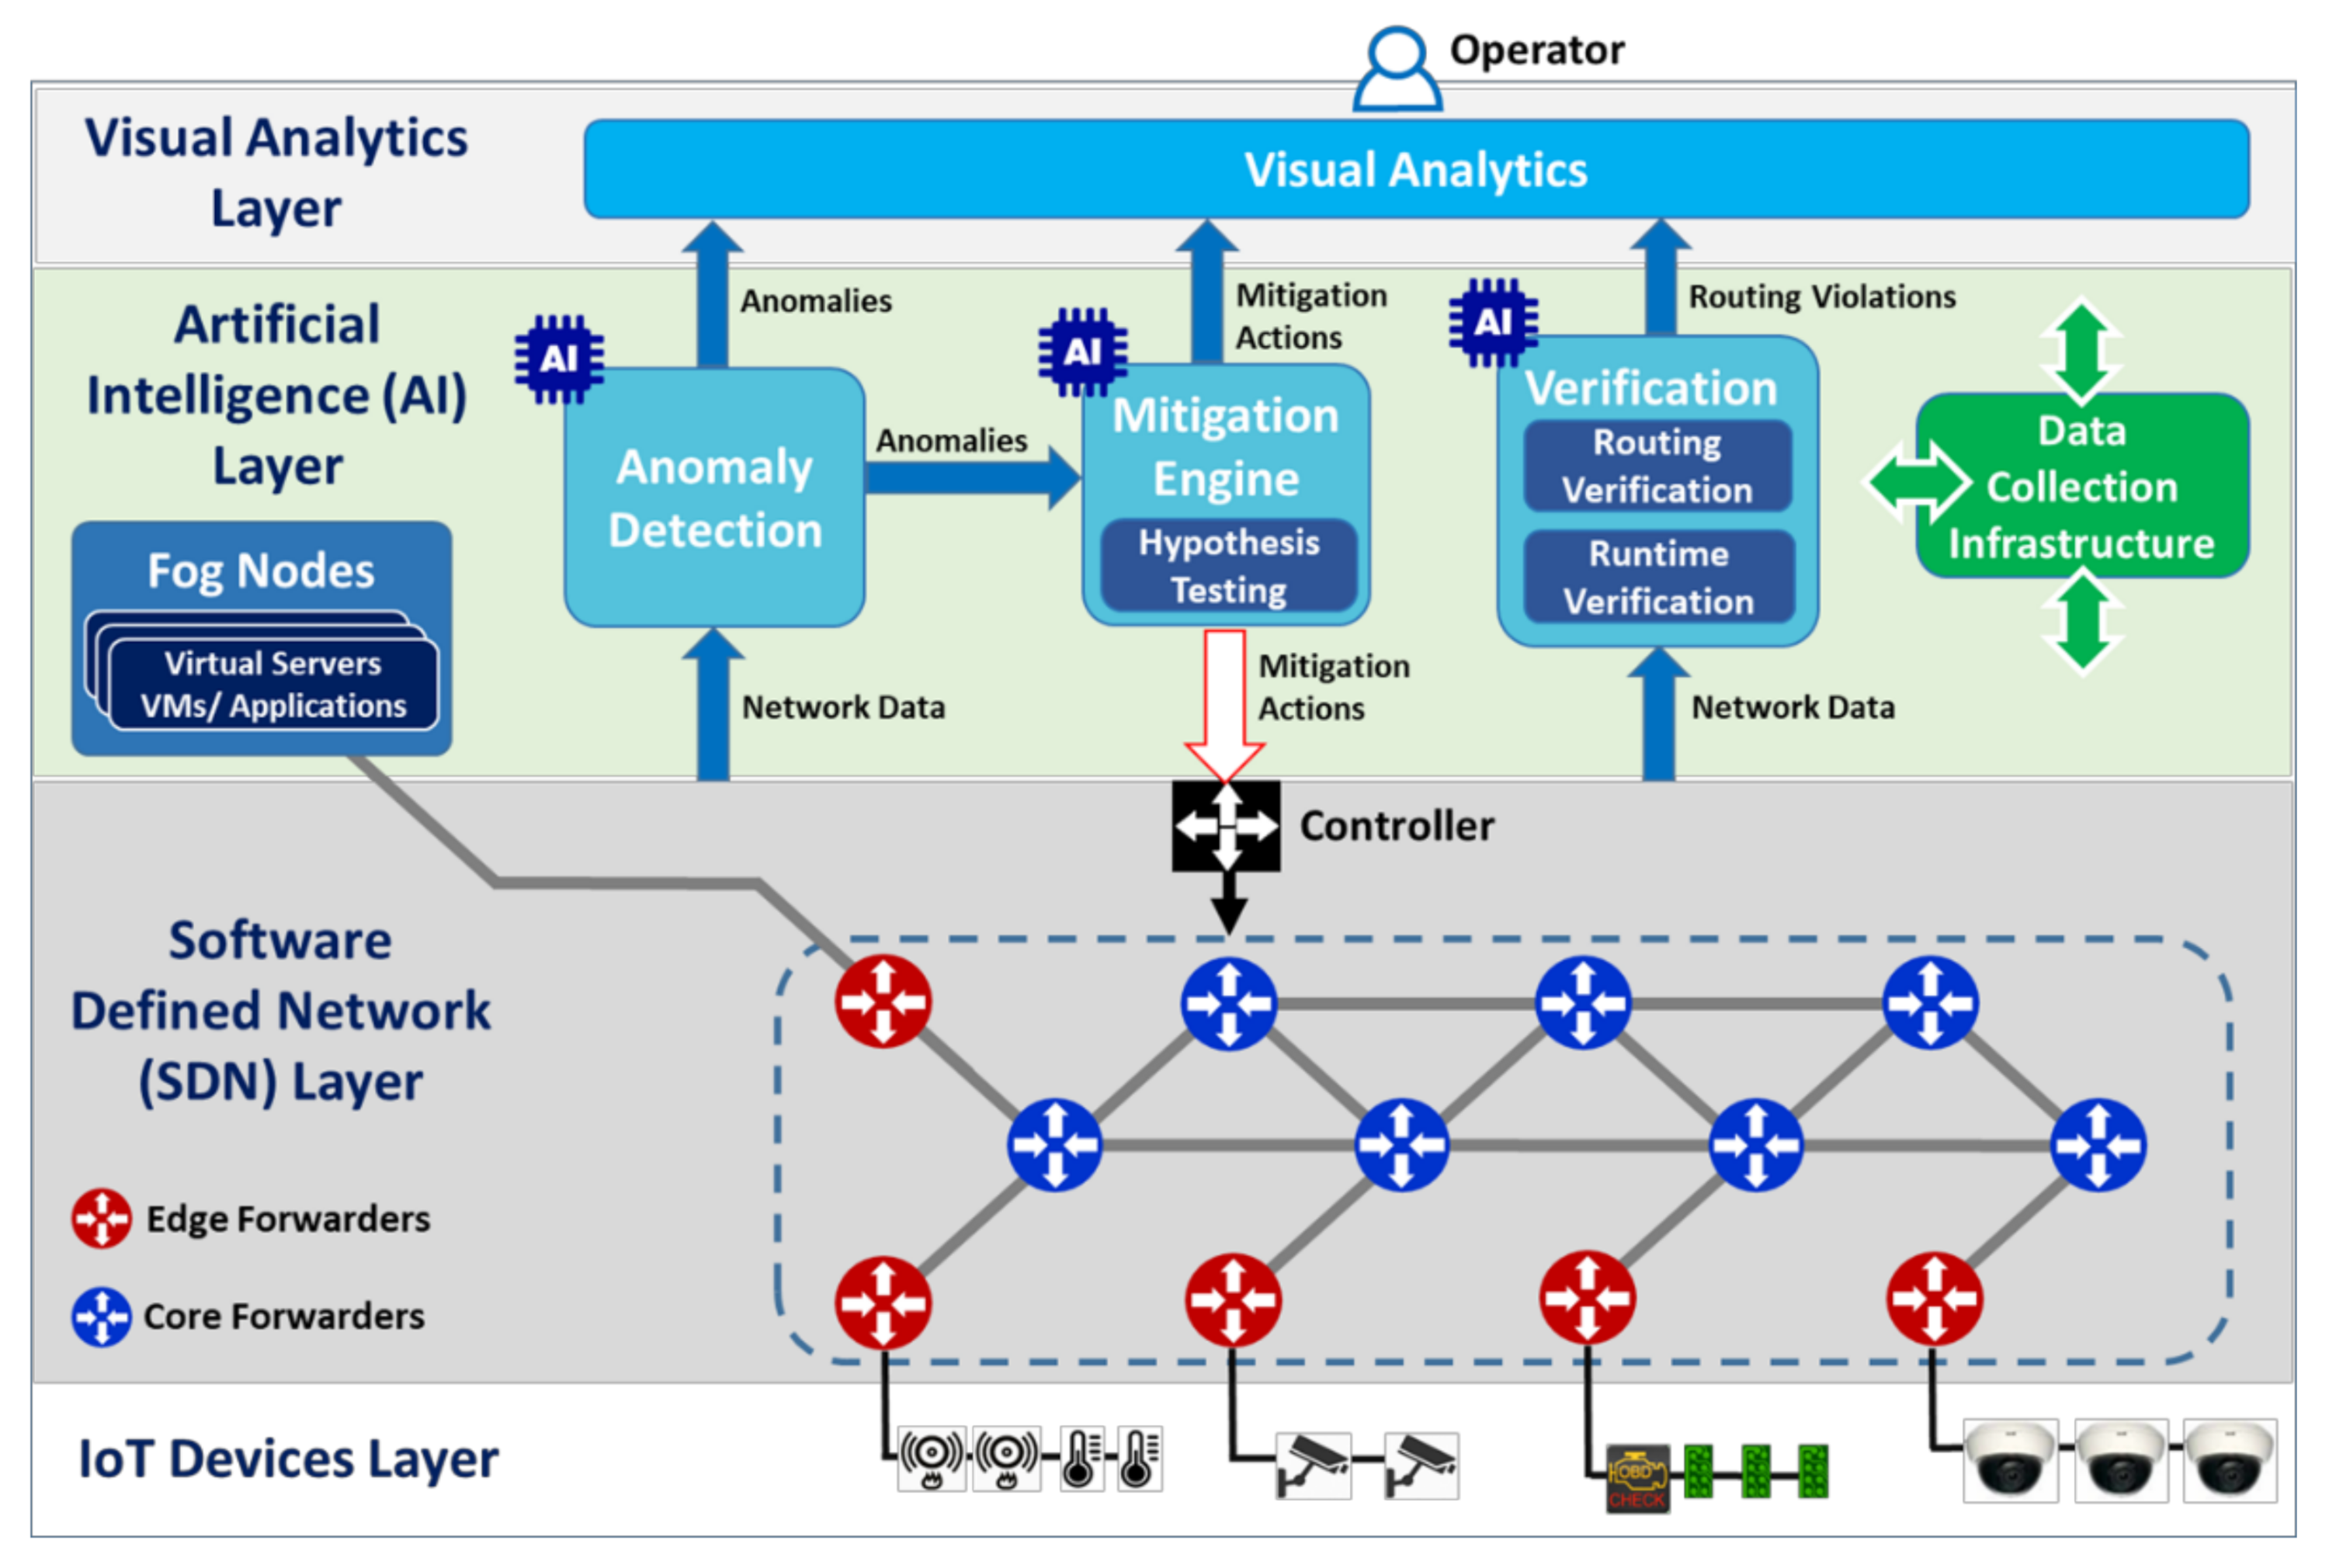
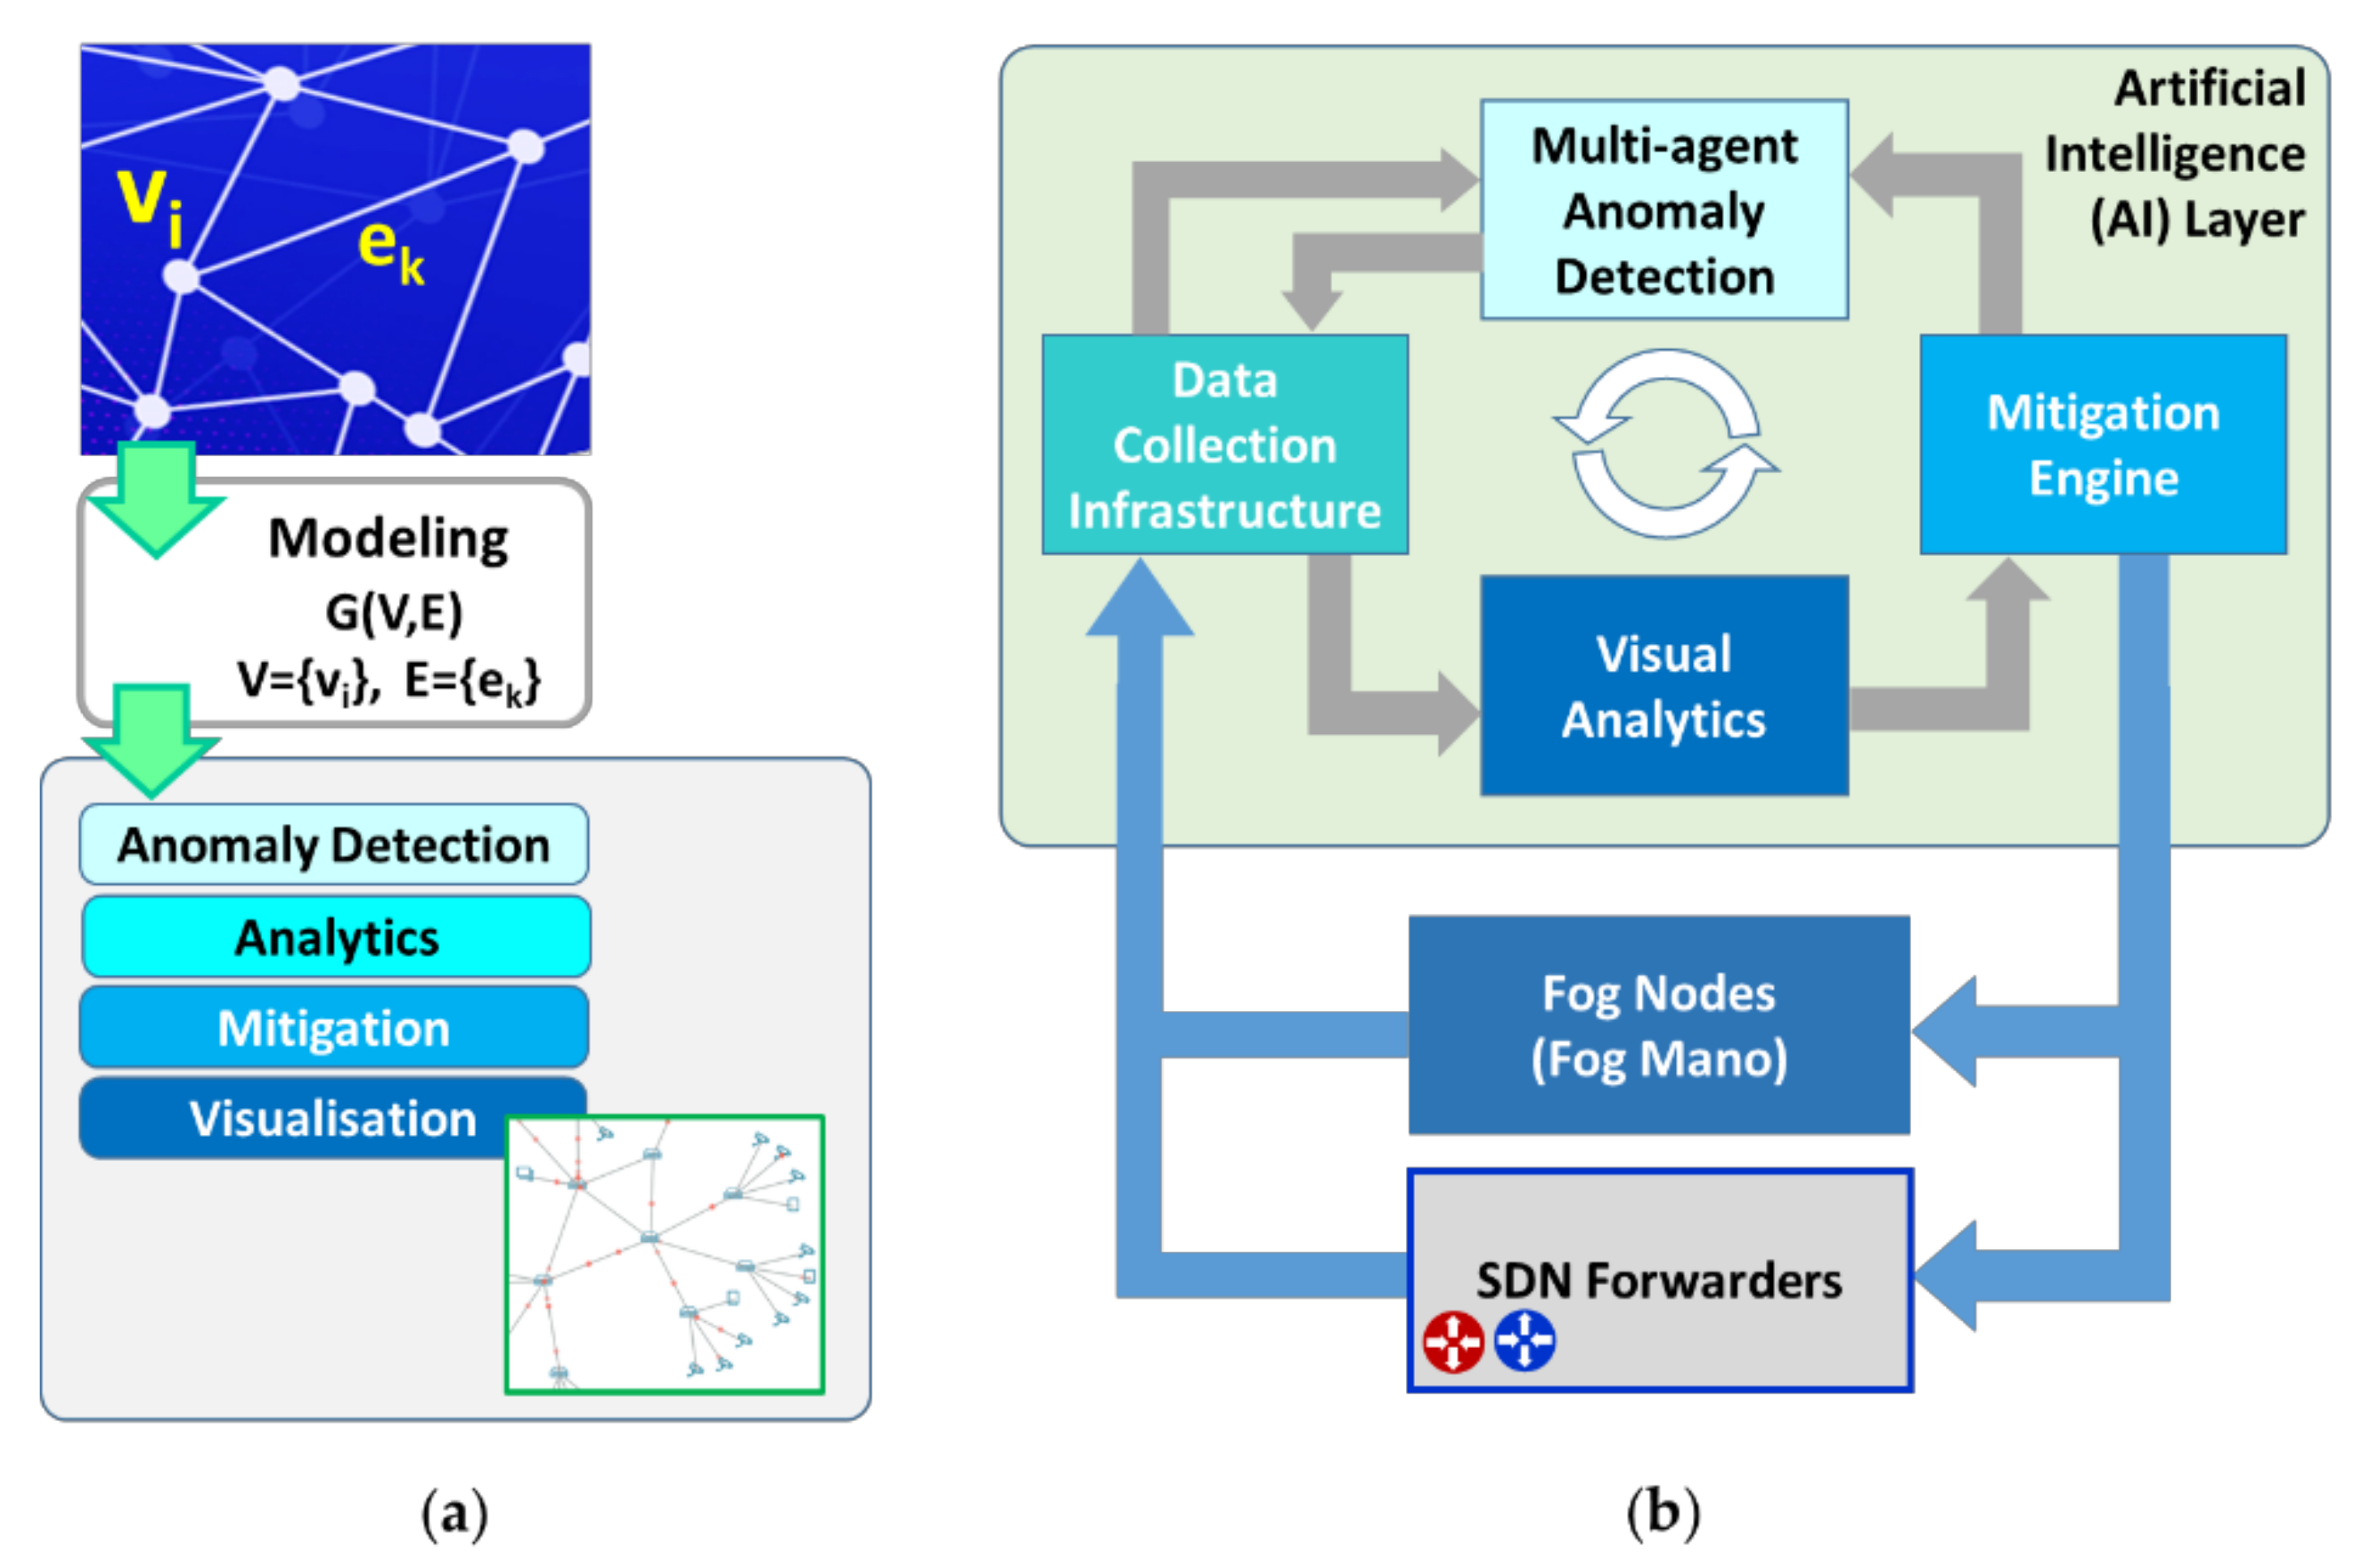
2. Design Methodology and System Architecture

2.1. Research Design

Within the work of the SerIoT project, an extensive analysis and recording of user, system, technical, interface and operational requirements was made. The aim was to select the appropriate mechanisms in order to extend the current literature and innovatively contribute to a secure-by-design IoT architecture. To this end, technical, operational and interface requirements were based both on the project’s description of work and SoA approaches, considering the design and implementation of each module separately. Additionally, KPI values were selected to evaluate the system’s performance and to validate the fulfilment of requirements and outperformance of the proposed modules in terms of accuracy, time-efficiency, scalability, resource constraints compliance and high QoS demand, when compared to competitive solutions. User requirements, gathered through questionnaires addressed to network operators, set the base for the resourceful GUI design of the visual analytics system. Following this approach, the overall integration strategy was determined, ensuring the IoT platform functioned seamlessly in a coherent and logical manner, dealing adequately with the research problem initially stated.
The following section describes the architecture of the proposed IoT cyber security framework. The basic considerations that lead the design approach are related to the heterogeneity of the networked devices and their limited computing power. An IoT network allows different devices to collect and exchange data enabling multiple IoT technologies and applications to be utilized by different users (for example citizens and companies) in heterogeneous domains (e.g., intelligent transportation systems, industrial automation, etc.). In such an extended IoT infrastructure, the key elements suitable for deploying security countermeasures are edge devices. The need for device connectivity is served by a flexible network substrate realized by a software-defined network (SDN). Software-defined networking (SDN) technology facilitates a dynamic network configuration and central control of the network and offers high network performance and monitoring capabilities in such a heterogeneous field of devices. However, the established flow rules by the SDN affect the energy consumption and quality of service (QoS) of the network, while IoT devices and SDN elements are also susceptible to failures and attacks. In the overall landscape, we should also consider the existence of cloud infrastructures that offer a variety of services and run applications that use data generated from IoT devices, as well as managing the underlying IoT infrastructures. The cloud is accessible through fog nodes, i.e., devices that forward traffic from the SDN to the cloud and vice versa.
The proposed framework follows a layered architecture encompassing four tiers. These are: (a) the IoT device layer, which includes several types of devices such as sensors, IP cameras, actuators, etc., connected to the entire system through IP compatible links; (b) the SDN layer comprised by the core and edge router devices; (c) the cloud MANO including the fog nodes; and (d) the artificial intelligence (AI) layer, upon which the anomaly detection and mitigation components rely. At the end of the workflow, a visual analysis of all gathered data, reports the security status reports, detection results, mitigation actions and node-specific information to the network operator through a comprehensive visual user interface. Figure 1 presents an overview of the entire architecture.
The Artificial Intelligence (AI) layer includes the following main components:
  • The anomaly detection (AD) component, which utilizes a decentralized multi-agent approach based on a graph neural network (GNN) algorithm to discover anomalous traffic that might threaten network operation;
  • The mitigation engine, i.e., the component that allows for the mitigation of any discovered threat by using multi-objective deep reinforcement learning to reach an optimal decision. This includes the hypothesis testing submodule;
  • The routing verification component, which aims to verify that SDN routing decisions are optimal regarding energy, QoS and security properties through the multi-objective optimization employing evolutionary algorithms;
  • The runtime verification component is a supplementary, heuristic tool used for early warnings about new types of attacks (i.e., types assaulting the system for the first time). It monitors network and resource statistics and reports deviations when exceeding predefined limits.
These components are presented in detail in the following sub-sections. In addition, the front-end component, i.e., the visual analytics, is presented. This provides an integrated dashboard to the entire system and supports different views. It uses a variety of analytics and visualization techniques to process network and fog resource data, and anomaly detection and mitigation results. The visual analytics dashboard allows the end user to visually inspect the network condition, manually perform mitigation actions or receive notifications about important events such as attacks, routing and resource violations.
In addition, the proposed architecture embeds several elements with key functionalities described as follows. The data collection infrastructure is a data pool that serves all AI components. It is the database of the system and stores different types of network data collected and aggregated by various layers, devices and subsystems. The forwarders are hardware/software devices, responsible for forwarding packets in the software-defined network (SDN). Forwarders that connect either IoT devices or the fog nodes to the SDN communication substrate are referred as edge forwarders. Working closely with the controller, they forward packets according to the SDN rules received by the controller. The controller is a software component, responsible for packet forwarding in the data plane of the SDN. This enforces the forwarders to apply mitigation measures. The fog nodes provide access to flexible computer systems aiming to engage either an IoT service or component included in the proposed security framework. They are able to place and control compute services as virtual machines (VMs) distributed in edge systems.

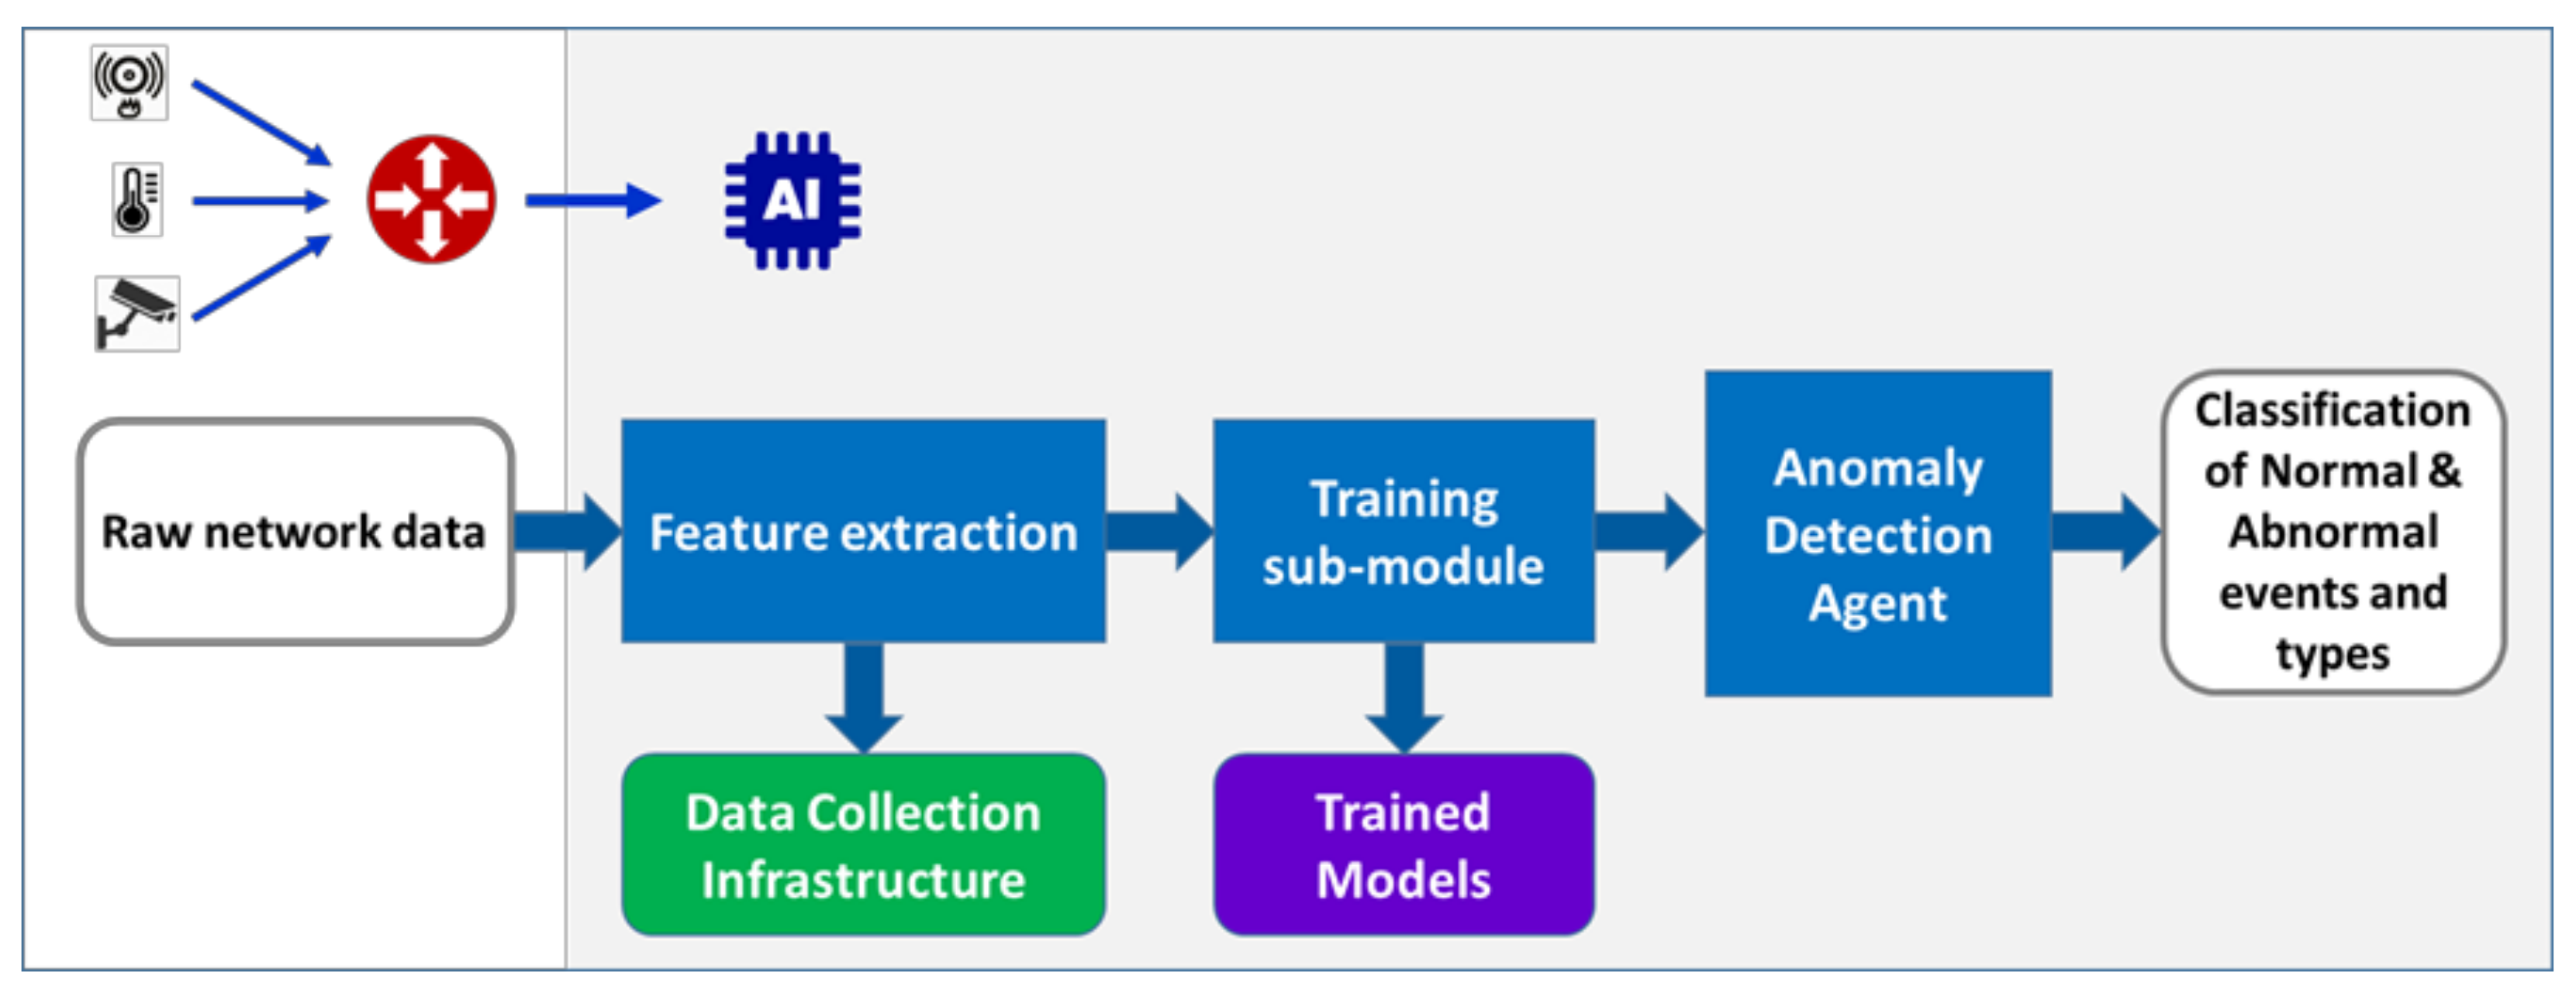
2.2. Multi-Agent Anomaly Detection

Intrusion detection tasks are commonly performed in a centralized manner, which generally aims to identify multiple- or single-type [46] threats, i.e., binary classification approach. We propose a distributed AI architecture for the classification of attacks, consisting of agents implemented in multiple points across the network, in order to perform anomaly detection in a synergistic manner. Our goal is to perform the local monitoring of network nodes and their corresponding IoT edge devices, while exchanging information regarding observed behaviours and detected anomalies. This parallelization of tasks caused by the localization of anomaly detection distributes the processing and energy cost, and reduces the total required time to identify abnormal network behaviour.
The proposed approach combines dynamic graph anomaly detection characteristics in conjunction with window-based events. The main idea of the approach encompasses a detection algorithm bound to a time window, so as to indicate an abnormal pattern in the input graph data. Several previous instances of graph data are compared with this method to point out whether an anomalous event takes place. Graph data involve relations among entities, and traffic statistics communicated through the interconnection links. The merits inherited by graph-based anomaly detection techniques are exploited in order to powerfully represent the inter-dependencies as links and correlations among IoT-related entities in a dynamically changing environment. This causes a significant advantage to be exploited—the inability of the adversarial user to identify the entire targeted network infrastructure. To this end, the swarm of agents holistically monitors the network labelling the node’s, edge’s and neighbour’s attributes, allowing for a neighbouring anomaly detection, ultimately identifying distributed cyberattacks originating at multiple distant points.
Cooperation among agents is depicted by the representation of their relations. Towards this purpose, GNNs are adopted. For each agent, we define a graph as a tuple G = (V, E) where V = {vi}I = 1:N is the set of nodes and each vi is a node’s attribute, while E = {ek}k = 1:N is the set of edges, where each ek is the edge’s attribute. Supporting co-operation among the interconnected network devices, the proposed anomaly detection method offers several of the advantages generally created by the multi-agent systems. To address cyber threats as denial-of-service attacks (TCP SYN, UDP Flood), the AD module engages a network of agents, upon which it reflects the network of involved devices, their inter-communication links and significant traffic characteristics. Each agent is installed on a monitoring node of the network to implement the GNN algorithm. The algorithm takes a series of samples of traffic statistics as inputs, which are collected in successive time windows, and processes the time series data to classify each chunk as benign or abnormal eventually reporting a probability score. Traffic information deriving from neighbouring agents is also fed to the algorithm, which in turn results in a probability score describing the neighbour’s score of infection. To this end, each node and edge are associated with a feature vector.
Figure 2 shows the dataflow inside the proposed framework: the raw network data generated in the IoT devices layer are forwarded via the router devices in the SDN layer to finally reach the agents. The agents are able to fetch the required data either by filtering traffic statistics from the data collection infrastructure or by enabling traffic collectors directly at significant network interfaces, mainly addressing the needs of each IoT Infrastructure scenario. The captured time series data are processed to extract the relevant traffic features and train the GNN algorithm to detect a variety of network anomalies, such as TCP SYN, UDP flood, sinkhole or SSL attacks caused by unauthorized connection attempts. In this article, we demonstrate the detection results of a TCP SYN attack. When the trained model is produced and loaded, each agent is run, independently performing near-real-time detection.
The interaction of the multi-agent anomaly detection (AD) module with the rest of the components is depicted in Figure 3. The multi-agent AD module directly communicates with the data collection infrastructure, the fog nodes (fog MANO: fog management and orchestration), and the visual analytics components.
As explained, the detection algorithm uses as input data network-related statistics which can be retrieved from either the fog MANO, with the implementation of a traffic capturing mechanism, and via a direct analysis of specific network interfaces or the data collection infrastructure. The multi-agent anomaly detection analyzes abnormal data, whilst the visual analytics component, through the data collection infrastructure activity, illustrates information for the network operator that can aid in efficient decision making. The mitigation engine receives the results of the analysis and determines the optimal mitigation actions. The network operator is finally instructed to apply the needed mitigation actions to the SDN controller, which enforces the forwarders to comply. This process is illustrated in Figure 3.

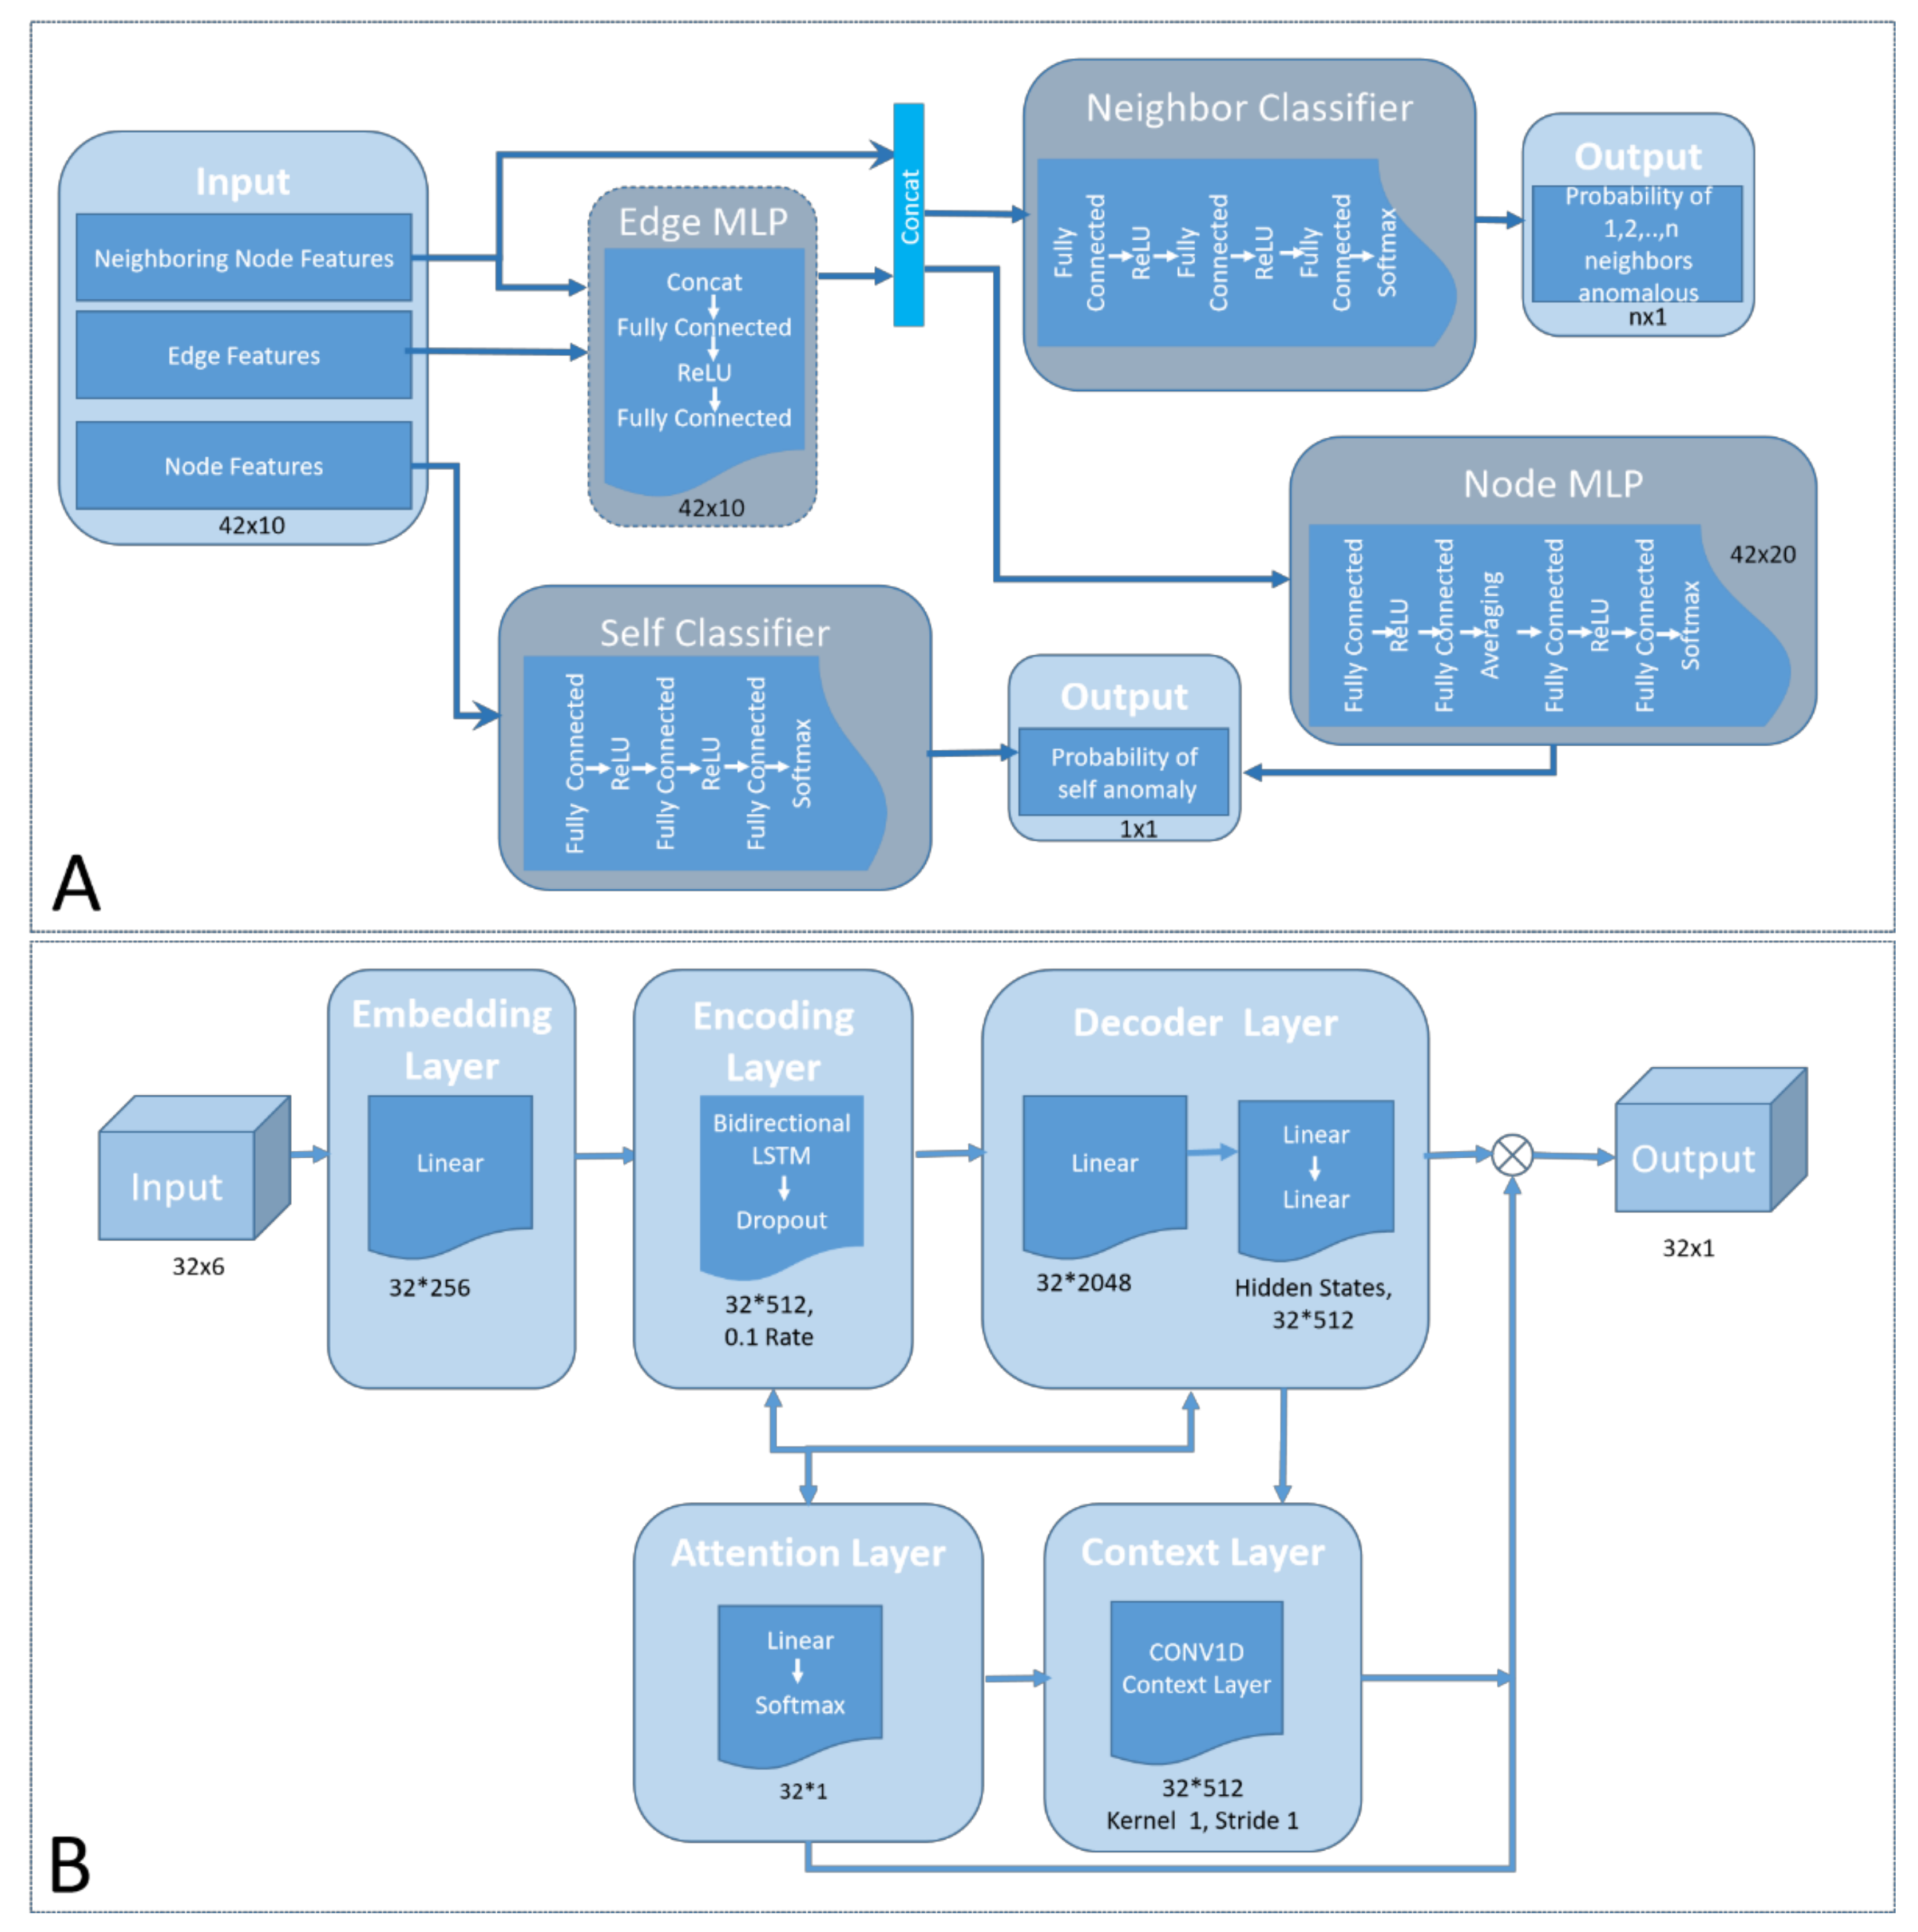
2.2.1. Multi-Agent Anomaly Detection Model Architecture

We constructed a graph, G(V, E), where V represents the set of nodes and E the set of edges of the network. Each graph neural network model, implemented by each agent, comprises two multi-layer perceptrons for edge and node classification. In detail, the edge deep neural network takes the traffic statistics of neighbouring nodes as inputs and updates the edges’ feature vector, whereas the node deep neural network is fed by the adjacent updated edge features along with its own features, in order to update the feature vector of each particular node.
This process creates a new value of the vector, a value that is treated as a new sample of a time series. A vector defined as r i j = p s i , p r i , b s i , b r i , d u r i , t i m e s t a m p i contains records with multiple indexes, where j V , E . The vector contains records, such as “ps” (packets sent) that defines the number of packets sent from one node/edge to another in a certain period of time (1 s) and “pr” (packets received), defining the number of packets received from a node in a predefined period of time. Moreover, the value “bs” (bytes sent) defines the number of bytes sent from one node/edge to another in a certain period of time, while “br” (bytes received) shows the number of bytes received from a node. Furthermore, the value “dur” (connection duration) depicts the connection time in which two nodes/edge exchange data and a timestamp which consists of a datetime format. Finally, Δt is defined as Δ t t 1 , t 2 , R Δ t is defined as R Δ t = r i j t i m e s t a m p Δ t .
Probability scores are reported to spread the knowledge regarding the status of the environment (neighbouring nodes) and the status of a node itself. A single node reveals a probability of the existence of an abnormality related to itself and to its interconnected nodes. The purpose of this action is to take advantage of the transferred information in such a way as to obtain a clear view of the environment and be able to protect against attacks diagnosed in the near neighbourhood. Hence, the problem arises when multiple results coming from a number of nodes, indicate diverse values of the probability of abnormal behaviour for the same neighbour. Thus, a rule must be applied to consolidate the values into one single result and feed the mitigation engine accordingly.
To solve this problem, we considered a model-based aggregation, taking place on a central agent, which gathers results, and then reports a single probability value for the set of agents to the data collection infrastructure. We adopted a logit model to combine the probabilities derived from several sources. Equation (1) shows the adopted aggregation model:
p ^ G α = i = 1 N p i 1 p i 1 / N α 1 + i = 1 N p i 1 p i 1 / N α
G is used to denote the geometric mean. The unknown quantity “a” is used to indicate the confidence of forecasting the probability score, which we assume to be equal for every node in the network. When “a” reaches the value of 1, we assume that the GNN’s architecture provides a reliable forecasting.
Following this principle, the complexity of IoT infrastructure is better accommodated, profiting from the structural representation of features in a localized monitoring solution. Fitting into multiple IoT network topology scenarios, the agents can be installed on edge gateways, servers or SDN forwarders, whereas the edges represent connection links between them. Figure 4 depicts the architecture of the proposed Multi-Agent Anomaly Detection system.
A set of attributes is calculated for the node’s feature vector, extending the authors’ previous work [26]. In the proposed MAS, the agents adopt an alternative to the framework constructed in [47], in order to push forward the collected feature vector values to their directly attached neighbours. Essentially, each agent calculates the set of edge feature values locally for all its active connections pointing to different neighbours, and subsequently stores this information, processing it along with feature values deriving from its environment. Hence, x iterations of this propagating procedure collect information regarding x-distant nodes (neighbours).
When profiling the network infrastructure in which the proposed algorithm applies, we consider a three-layered IoT network solution consisting of the IoT edge devices, fog substrate and the cloud nodes. In line with the most significant IoT application requirements, time-constraint services run on the side of the fog to avoid latency and processing power when data are gathered on a single central unit. This allows the agent to run on a virtual machine or container, appearing as a fog node requiring a minimum resource allocation. To capture network flows, the agent detects a network interface using an IPFIX collector or NetFlow mechanism. Conforming to these scenarios, each agent operates in a distributed manner, analyzing a decreased amount of data compared to the whole transmitted traffic, and then exchanging generated features with its directly attached entities. This procedure is repeated as a time series event for a predefined time-window duration. The experiments throughout this article refer to a 5 s time window, thus the rate of the samples in the time series is 1 per 5 s.

2.2.2. Network Identifiers Extraction

Connection-wise data are divided into node-wise categories, which in turn result in nodes’ and edges’ attributions. The values of the characteristic features indicate the anomalous or benign existence over the network nodes bearing the outlier score. To this end, the attributes of the proposed feature vector are presented in Table 1.
The feature selection process was based both on previous studies [50] and on testing, which allows estimating the significance and relevance of each field in the abnormal traffic, elaborating on each category.
Time-related entities include start time, which refers to the first timestamp of each connection and the duration of each link, measured in microseconds.
Header-related entities include FIN Flag int, indicating the number of packets with FIN flag and, likewise, SYN, RST, PSH, ACK, URG, CWE, ECE flags. Fwd Header Len denotes the length of the forwarded packet’s header.
Flow-related identifiers comprise Src IP, which describes the source IP address of the flow and Dst IP its destination IP. Fields denoted as Dir outline the direction of the communication and finally Label annotates the flow as normal or abnormal.
Payload-related entities include Tot Fwd Pkts, indicating the total number of packets in the forward direction transmitted over the link; Init Fwd Win Byts refers to the total number of bytes sent in initial window in the forward direction; Subflow Fwd Byts denotes the average number of bytes in a sub flow in the forward direction; Flow Pkts/s refers to the number of flow packets per second; Flow Byts/s measures the number of bytes per second; TotLen Fwd Pkts indicates the total size of the packet in the forward direction; Fwd Pkts/s indicates the number of forward packts per second; Subflow Bwd Byts refers to the average number of bytes in a sub flow in the forward direction; and lastly, Fwd IAT Tot indicates the inter-arrival time, the total time between two packets sent in the forward direction.

2.3. Threat Management and Mitigation

The scope of the mitigation engine module is to provide mitigation actions against threats or when an attack to the network is detected based on AI. The main functionality of this component, is the automated decision of mitigation action. The anomalies detected by the anomaly detection module are used as an input, while the manual addition of mitigation actions can be performed from the visual analytics module. The main output of the component, i.e., mitigation actions, are sent to system and saved as historical data.
Additionally, the mitigation engine enables the hypothesis testing submodule. This submodule allows the operator to perform hypotheses via ML algorithms on the performance of different mitigation actions using a tool accessible through the visual analytics module. The user can access past or current mitigation action sets and produce KPI estimates for new or modified mitigation actions. Moreover, the statistical significance of the KPIs estimates is calculated and reported. The module was implemented in Python, while the Pytorch framework was used for the pointer networks.

2.3.1. Mitigation Engine Module

For each of these attack or threat detected by the system, multiple mitigation actions might be available but a single action must be chosen. An AI solution was developed using reinforcement learning via a DNN architecture called pointer networks [51]. We modified the architecture to select a set of countermeasures to be applied, based on optimizing multiple security-related KPIs, while taking into account constraints. Separate DNNs were used to solve the problem separately for each KPI. A decomposition method called the normalized normal constraint method [52] uses the initial solutions to transform the problem into a single objective, also solved by a pointer network. This solution is transformed back to result in the Pareto solution set for the entire multi-objective optimization problem.

2.3.2. Hypothesis Testing Submodule

The purpose of this module is to allow the system operator to ascertain if a set of modified mitigation actions applied to the system are different from the existing mitigation actions in terms of KPI values. A clustering analysis was performed using the KPI values from the original and modified mitigation actions as inputs, along with KPI values from past states of the network. The tool checks if (a) the starting and modified mitigation set results belong to the same or different clusters and (b) if the clusters produced are statistically different. The clustering of the KPI values is performed using the HDBScan algorithm while the Sigclust algorithm tests for statistically significant differences between the different sets. Additional details on the hypothesis testing sub-module are available in [53].

2.4. Routing Verification

Recent advances in SDN technology presented frameworks for effective SDN network management concerning QoS and security [54]. In this section, a unified verification methodology is presented that estimates the effectiveness of the SDN routing decisions by taking into account energy consumption, QoS and security. In brief, real-time network metrics that concern energy, QoS and security information are collected from the SDN subsystem: This information is used for the calculation of specific routing objectives, estimating the importance of a routing decision in terms of these metrics. By employing multi-objective optimization using evolutionary algorithms, a set of the best solutions (i.e., flow rules) is quickly identified, which is then compared with the flow rules created by the SDN, in order to provide a deviation metric.
The presented routing verification methodology models the SDN subsystem of an IoT network as an undirected graph, G = (N,E), where N indicates the set of the nodes that represent the forwarders of the SDN and E is the set of edges that refer to the communication links between two forwarders. Traffic data are collected from the SDN forwarders and their links that concern security, QoS and energy consumption information. In more detail, delays between forwarder connections are used, corresponding to the time needed by packets traveling from node to node. The energy usage within the forwarder per packet is collected as a metric for energy consumption. Regarding the security, each forwarder is characterized by two values representing the confidence and sensitivity of forwarders. Confidence represents the (inverse) probability that the forwarder is infected by malware, while the sensitivity measures how sensitive a forwarder is with respect to different aspects of importance (for example forwarders, which are central in the network, and thus process large amounts of flows and have a high sensitivity.
The aforementioned QoS, energy consumption, and security metrics are used to estimate the total energy consumed, the delays experienced in the network, and how many sensitive and confidence forwarders are included for all the alternative paths of forwarders for the communication between two IoT devices. The optimal path should (1) reduce energy consumption in the network, (2) improve the network QoS, (3) avoid low-confidence forwarders, and (4) protect sensitive forwarders from possible malware infections. These objectives might be contradicting, e.g., the best route for protecting sensitive forwarders might be comprised of a large number of forwarders, thus inducing an extra delay that lowers the QoS. In order to optimize the above objectives simultaneously, our methodology is based on multi-objective optimization approaches that may identify a set of optimal solutions. The solutions included in this set are called Pareto optimal. Without additional subjective preferences regarding the significance of the optimization objectives, all the solutions within the Pareto front are considered as equally effective. Since the number of all the available paths can be very large, i.e., O(n!), in the complete graph of order n, the estimation of Pareto front by calculating all of the available paths is not feasible for realistic SDN networks, where the number of forwarders may be up to some hundreds of forwarders.
In order to quickly estimate the Pareto optimal solution set, a multi-objective routing optimization based on evolutionary algorithms is incorporated in our methodology. Evolutionary algorithms are able to efficiently produce solutions in computations problems using robust approximation models by iteratively optimizing a set of possible solutions called a population. The population is evolved by applying a number of genetic operators to produce a new population. In our approach, a possible solution is represented by a sequence of nodes in the graph representing the forwarders of the SDN network. Each valid solution (i.e., there is a communication link for each pair in the sequence) is characterized by four objectives. The population is evolved using the multi-objective evolutionary algorithms by decomposition (MOEA/D) [55]. MOEA/D finds optimal solutions for each objective, and then evolves the initial population based on these solutions by applying operators.

2.5. Runtime Verification

Policy-based schemas control security incidents which occur throughout the wide deployment of IoT infrastructure, such as the schema concerning the smart city domain, which is the case in [56]. In addition, policy frameworks also influence other parameters with respect to the overall system’s performance. A trade-off between minimum response time, minimum cost, ease of deployment, and adequate resources utilization within the numerous data centres, formulate the high-performance policies described in [35]. The presented runtime verification methodology aims to verify a number of security policies related to the runtime behaviour of the IoT infrastructure. It monitors network and resource statistics (e.g., connections per second) and reports deviations when exceeding predefined limits. In more detail, real-time data are collected from IoT networks such as SDN traffic data, fog resource statistics, detection times of anomalies and processing times of the various SerIoT components (e.g., data collection, formal verification, anomaly detection, etc.). This information is used for the calculation of security policies formulated as key performance indicators (KPIs), which validate the confidentiality, integrity and availability of security properties. These KPI values enable network operators to define different policies based on the demands of the use cases of the network. For example, when setting a low value for the ‘packet per second’ constraint, more connection links are reported. The percentage of deviation for each of the policies is estimated and reported to the IoT network operator.

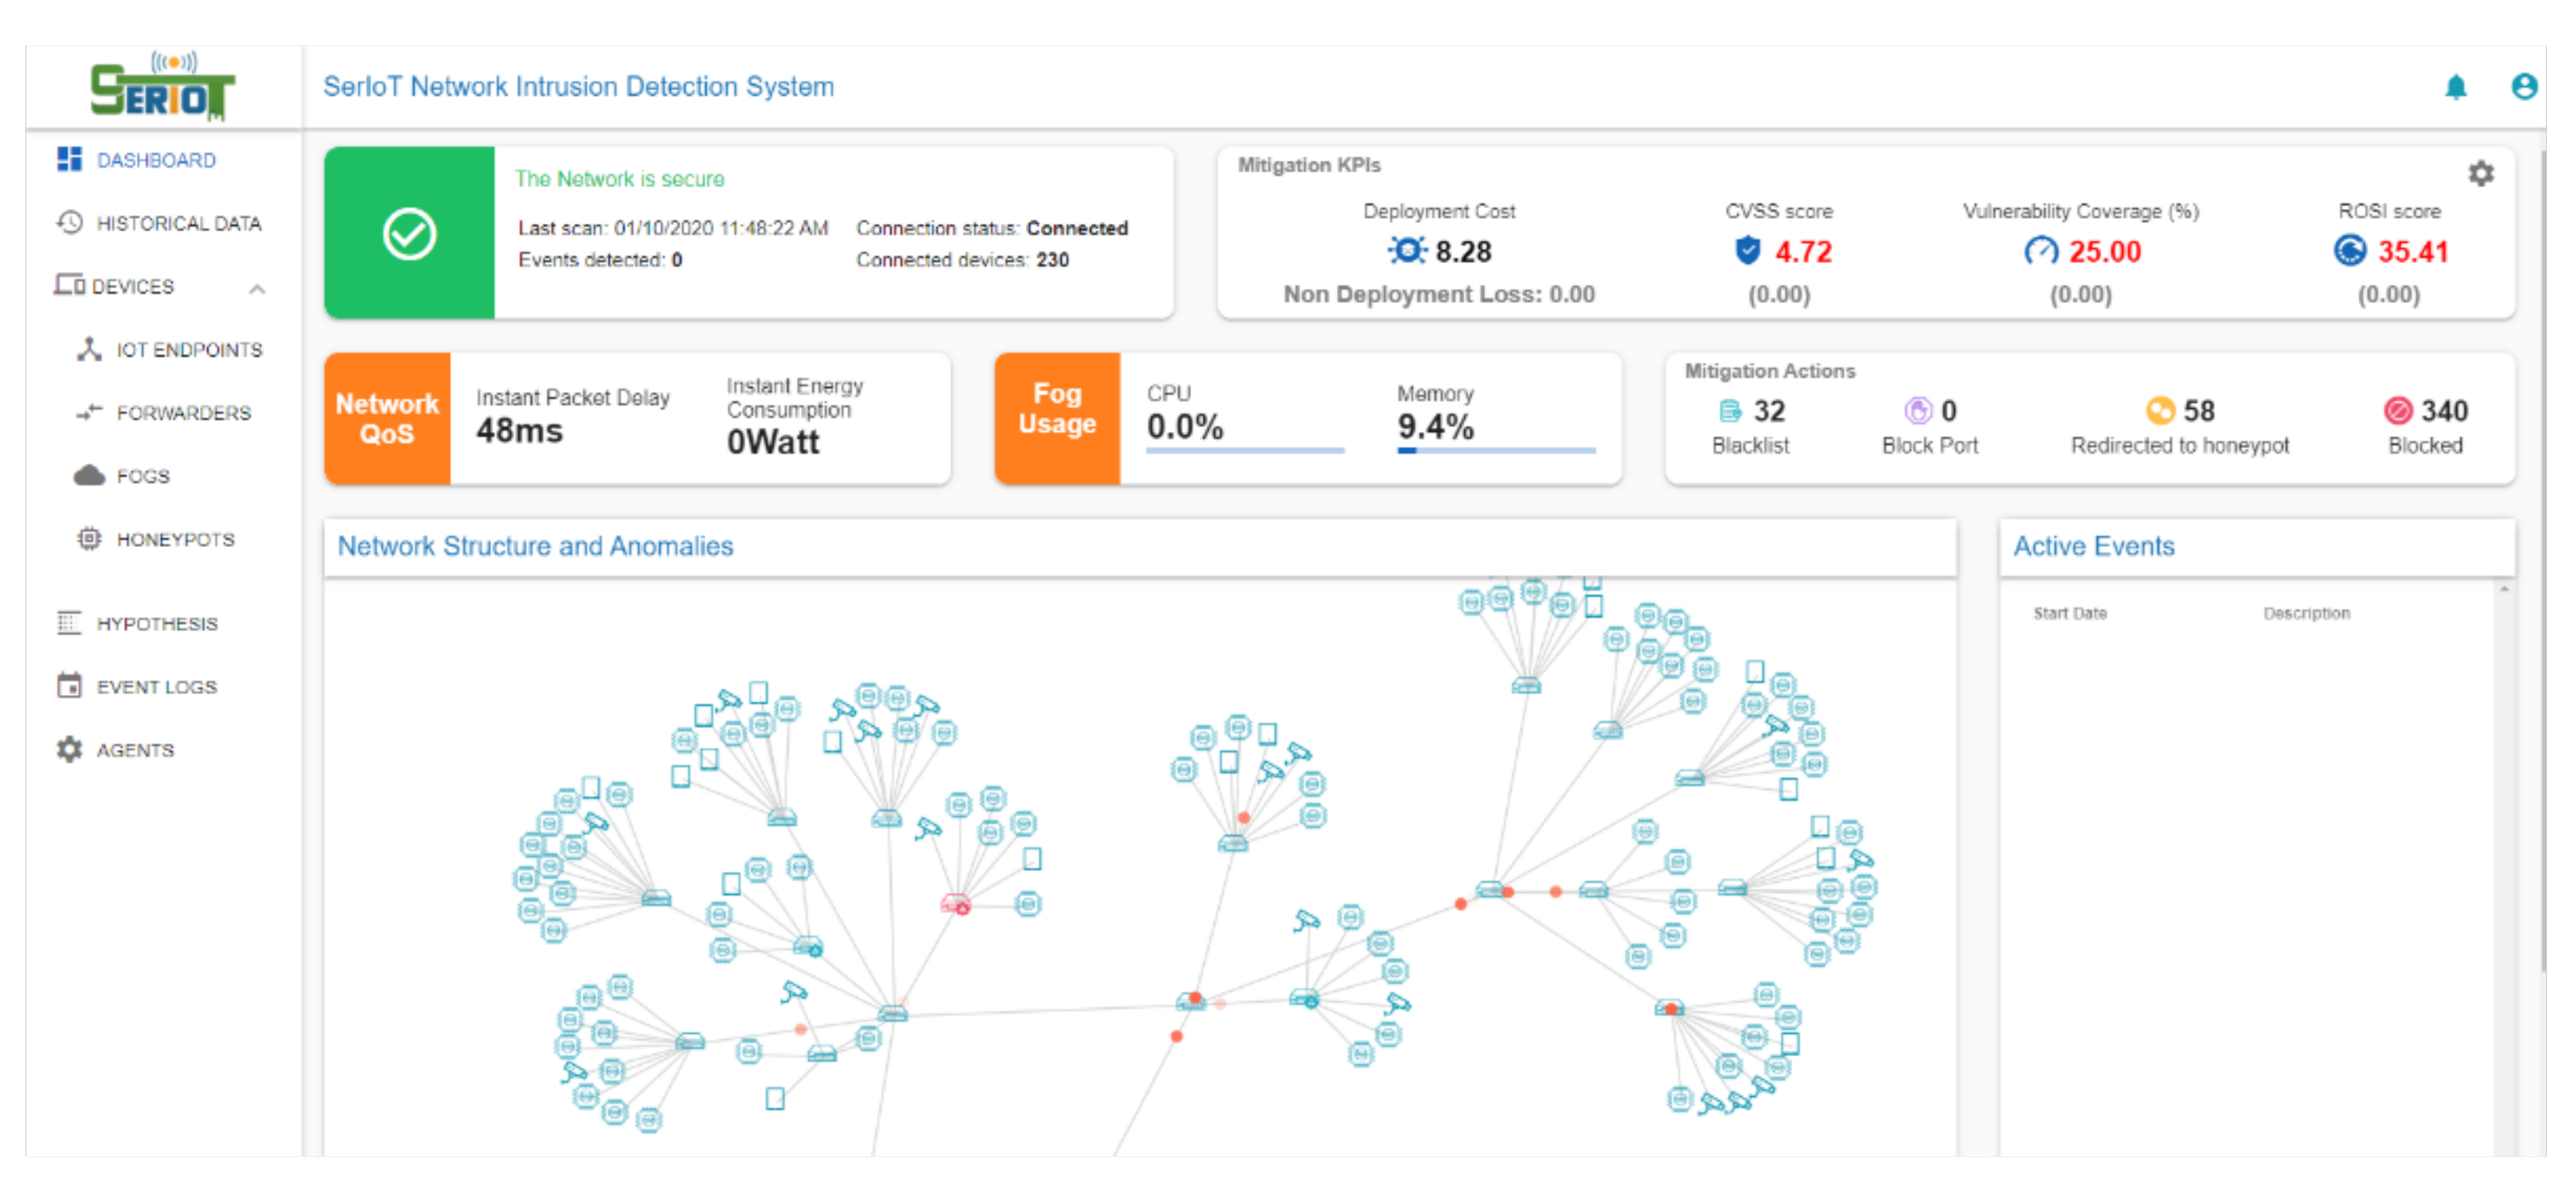
2.6. Visual Analytics

The visual analytics module allows the end user of the proposed system to monitor different aspects of the network as well as the results of the components that participate in the system. More specifically, the user is able to monitor the network topology, network traffic, results of the multi-agent anomaly detection module, results of the verification module, mitigation actions that are deployed in the network, as well as statistics from the honeypots and devices that are contained in the network. In order to visualize the above aspects, the visual analytics consumes the data from the system’s database.
Another usage of the module is the interaction of the user with the network by applying manual mitigation actions using a REST API provided by the mitigation engine. Additionally, by using the same API, the end user is able to access the hypothesis testing submodule in order to investigate how different mitigation actions would affect the network in terms of KPI if they were deployed on the network. Moreover, the visual analytics module can be used for interactions with the agents of the multi-agent anomaly detection module by starting or stopping agents that are deployed on the network. Figure 5 shows the dashboard, i.e., the user interface provided by the visual analytics module.
The dashboard of visual analytics contains information regarding the security status and QoS of the network, fog resource usage information about the mitigation KPIs, as well as the mitigation actions that have been applied in the network. Moreover, the user is able to see the active anomaly, mitigation and constraint violation events. Furthermore, the user is able to monitor the traffic of the network on the topology graph. In the graph, the anomalies of the multi-agent anomaly detection and the mitigation action are also depicted.
Additionally, the user is able to see more information for each node by clicking on them, and can also apply a mitigation action on this node. Finally, the user is able to move the node by using the hypothesis view tool and run a hypothesis test for the selected node. Another view of the visual analytics is the historical data view, which features historical data of the network traffic as well as anomaly results, and it can be used to compare the multi-agent anomaly detection with the ground truth and a centralized approach of detection. The user is able to select the start and end date and see the network traffic and the anomaly results in this period. The devices views contains statistics regarding the IoT Endpoint, the forwarders, the fogs and the honeypots that exists in the network. Moreover, in the hypothesis view the user is able to run hypothesis test. The user is able to build a hypothesis through the definition of mitigation actions on the nodes and then test the hypothesis to investigate whether the KPIs improve compared to the initial values; the results of the hypothesis are depicted in the KPI Metrics. The user is able to apply all of the mitigation actions of the hypothesis to the real network. The agents view shows all the agents that are deployed in the network, and the user is able to start and stop their detection functionality.

3. Experimental Results

In the following section, the experimental results concerning the anomaly detection and mitigation module of our solution are presented. In both cases, the proposed algorithm results are compared against other algorithms commonly used for the same tasks.

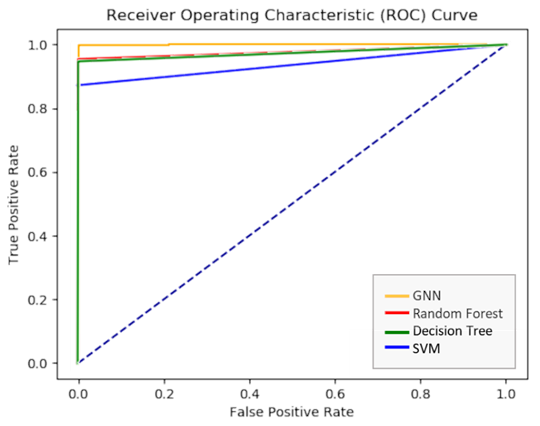
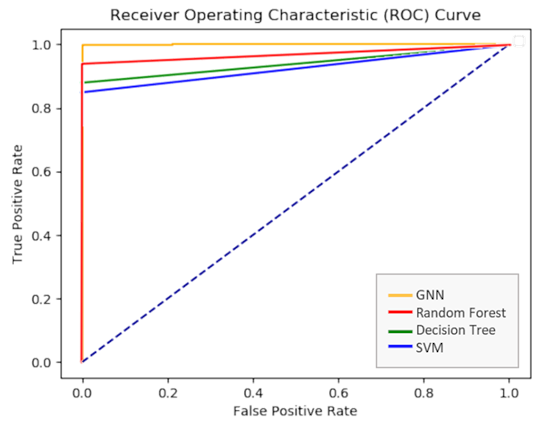
3.1. Anomaly Detection Results

The evaluation of the anomaly detection schema was conducted against a real IoT dataset captured online [34]. The dataset includes a number of cyber attacks such as denial-of-service, UDP flood, and port scanning. Several cases of DoS are captured within separate files. In the examined dataset, the attack originated from multiple IPs inside the range 111.0.0.0/8 to the victim device 192.168.0.24. The target receives a flood of TCP connections to a specific port (19604). By applying a wireshark filter, the abnormal traffic is excluded and annotated for training purposes. In order to address the overfitting issue derived from learning a single destination IP address, the dataset used for testing involved a different range of source IP addresses originating from the 222.0.0.0/8 network. The victim’s IP address and port number was 192.168.0.13:554.
The algorithm was trained in 100 epochs for a configurable time-window of five seconds of incoming traffic. The scores of the metrics used to evaluate detection efficiency, area under the curve (AUC), and the accuracy of detection are presented for the DoS attack dataset. In a separate sub-scenario, random normal and abnormal devices were selected to simulate a node’s unavailability by going offline. The aim was to indicate the performance of the proposed method in detecting outlier cases and to evaluate the results compared with other anomaly detection mechanisms. The latter approaches comply with relevant research on the field of network intrusion detection. Despite illustrating the DoS attack, the adopted algorithm managed to successfully detect both port-scanning and UDP flood attacks, also prompting higher detection results compared to the remaining methods. Table 2 shows the robustness of the proposed method in detecting the abnormal devices in both sub-scenarios.
Figure 6 illustrates the detection efficiency against a denial-of-service attack. All devices are online sending malicious and benign traffic. The diagram depicts lower ROC scores for the remaining centralized machine learning methods, while the proposed method accurately detects the attack benefiting from the feature vector enhancement. In Figure 7, the detection efficiency against the denial-of-service attack is represented. In this sub-scenario, a number of devices appears to be unavailable while impacted by the attack. The diagram depicts the decreasing ROC scores for the remaining centralized machine learning methods.
Information exchange among neighbouring agents optimizes detection when offline devices appear. Classic anomaly detection schemes fail to accurately detect the abnormalities, and due to their centralized behaviour, neighbour nodes remain unaware of the attached nodes’ infection. Initially, all devices are online sending benign traffic, while afterwards the attack occurs. Evidently, the diagram depicts a higher accuracy level for the proposed algorithm, while lower ROC scores are associated with the remaining ML methods. Detection performance benefits from feature vector enhancement. In the meantime, fewer monitoring nodes, as a simulated side-effect of the attack, significantly decrease the detection rates of the remaining algorithms.

3.2. Mitigation Engine Results

For the scenario examined for the validation of the mitigation engine, it is assumed that network is threatened by multiple attacks and some of the network components are already affected by malicious software. Additionally, it is assumed that the anomaly detection component detects anomalies in the traffic of the following 41 devices: four routing controllers using the Open Network Operating System (ONOS), six virtual switches using the Open vSwitch, 20 IP cameras, 10 temperature control sensors and 1 server operating with Windows 10. The performance of the mitigation engine is presented in Table 3 by means of the values of four KPIs. The vulnerabilities for each device along with their KPI-related values are presented in Table 4.
The purpose of the component is to find an optimal set of mitigation actions by minimizing the CVSS and the deployment cost score and maximizing the ROSI and coverage score while maintaining two constrains: a CVSS score lower that 5 (max value is 10) and a coverage score higher than 50%.
Additionally, the results for two algorithms, MOEA/D and the non-dominated sorting genetic algorithm II (NSGA-II) are examined. Both of these AI algorithms belong to the family of evolutionary algorithms: these share the common characteristic of effectively representing numerical knowledge, efficiently producing solutions in computationally difficult problems. Due to these reasons, they are commonly used to tackle multi-objective problems. The DNN model was trained for 50 epochs on synthetic data, while the evolutionary models were implemented using a solution population of 100, evolving for 50 epochs.
As seen in Table 3, the pointer network outperforms the other two approaches: It finds the solutions with the highest coverage, ROSI scores and the lowest deployment cost and CVSS scores. Finally, the system needs to propose a single decision: in this experiment, we first scaled the KPI results to [0,1], and then to a single value using weighted decomposition with equal weights (w = 0.25). The solution with the larger value was chosen for each algorithm. The pointer network resulted in a solution with deployment cost of 7.07, vulnerability score of 100%, CVSS score of 2.9 and ROSI score of 2628%. It outperforms both of the other algorithms in terms of vulnerability, deployment cost score and ROSI score while having a slightly worse performance in terms of the CVSS score. The NSGA-II approach resulted in a solution with deployment cost of 11.97, a vulnerability coverage score of 94.48%, CVSS score of 2.91 and ROSI score of 2514%. The MOEA/D approach resulted in a solution with deployment cost of 11.53, vulnerability score of 57.61, CVSS score of 2.75 and ROSI score of 1666%.

4. Discussion

This paper presents a framework that manages the security of IoT networks. The proposed system aims to support extended IoT ecosystems in a unified, universal and holistic way. We followed a design approach aiming to lead to a universal solution that may support the majority of IoT ecosystems. According to this approach, the IoT devices are connected to edge devices, which provide access to an SDN, that acts as a smart communications core of the ecosystem. In this ecosystem, artificial intelligence (AI) algorithms are implemented by agents and deployed at the edge devices, according to a distributed model.
The agents create samples of network traffic data at regular time intervals. The samples are actually vectors that incorporate information on the specific node and the neighbouring nodes. The samples form a time series, which is analyzed by the AI components, which then derive a forecast, i.e., an estimation of the probability that the specific node is under attack. The AI algorithms provide the means for cyber attack detection. For the detection of anomalies associated with new types of attacks, which have yet unknown patterns of traffic, the system is backed by the verification tool. Following a successful identification of a cyberattack, the mitigation engine module selects and launches the optimal actions and countermeasures to mitigate the threat. The system also includes visual analytics functionality as well.
Experimental results showed that the AI methods supporting the various components of the network produce better results compared to other algorithms and methods commonly used for the same tasks. The system was deployed and showcased in real conditions, verifying that it handles challenges such as large-scale IoT networks or systems that requires low latencies and poor resource utilization. It was demonstrated in several and different applications during the period 2019–2021. Among them, we may mention its application for the protection of IoT infrastructures on automated vehicles, which represent a class of typical high-risk systems when receiving a cyber attack. In this scenario, we used our solution to allow rerouting tests in vehicular communication [57]. The overall aim in this case was to ensure secure and reliable communication among various components of connected intelligent transportation systems (C-ITS). In this context, we demonstrated fleet management and smart intersection scenarios, where vehicles equipped with onboard units (OBU) interact with each other and with roadside units (RSU) to accomplish an optimal flow of traffic, under cyber attacks such as denial-of-service (DoS) and other types.
The overall design approach for this system was oriented to openness and universality, i.e., the ability to support extensive IoT infrastructures at various diverse application domains; with minimal or even zero effort for re-configuration or customization. Another important feature of the system is its intrinsic ability to learn how to mitigate new types of attacks, based on the embedded machine learning process. The system achieved the above requirements.
The above features suggest that the system can outperform in a variety of applications under various unknown and novel types of attacks. As far as the future evolution of the system is concerned, we envision a wide range of potential applications. For example, we are currently envisioning the deployment of an extensive simulation environment (a next-generation cyber range) in order to replicate real-world IoT networks and services, thus evaluating further in a variety of IoT infrastructure models each of the developed components in several cases of distress. Furthermore, we consider developing containerized versions of the anomaly detection, mitigation and routing/runtime verification algorithms, which will be exposed for penetration testing in multiple networking infrastructures and OS systems. A further advancement in the detection algorithm to include topology agnostic features is also under study, in an attempt to enable different IoT environments to benefit from the proposed holistic solution.

Author Contributions

Conceptualization, A.P., S.P., A.D. and D.T.; methodology, S.P., A.D. and D.T.; software, A.P., A.M., K.P. and T.I.T.; validation, E.V.K. and S.P.; writing—original draft preparation, A.P., E.V.K., A.M., K.P. and T.I.T.; writing—review and editing, E.V.K. and A.D.; visualization, A.P. and T.I.T.; supervision, D.T.; project administration, E.V.K. and A.D. All authors have read and agreed to the published version of the manuscript.

Funding

This research was funded by the European Union, Grants No. 780139 and No. 833955.

Institutional Review Board Statement

Not applicable.

Informed Consent Statement

Not applicable.

Data Availability Statement

The data presented in this study are openly available in IEEE Dataport at https://doi.org/10.21227/q70p-q449.

Acknowledgments

This work was supported by the European Union’s Horizon 2020 Research and Innovation Programme, through project “SerIoT—Secure and Safe Internet of Things” under Grant Agreement No. 780139 and project “SDN-microSENSE: SDN—microgrid reSilient Electrical eNergy SystEm” under Grant Agreement No. 833955, during the period 2019–2021. The opinions expressed in this paper are those of the authors and do not necessarily reflect the views of the European Commission.

Conflicts of Interest

The authors declare no conflict of interest. The funders had no role in the design of the study; in the collection, analyses, or interpretation of data; in the writing of the manuscript, or in the decision to publish the results.

References

  1. Gartner Global Research and Advisory Company. Leading the IoT. Available online: https://www.gartner.com (accessed on 6 April 2021).
  2. Ericsson. Cellular Networks for Massive IoT, White Paper. Available online: https://www.ericsson.com (accessed on 6 April 2021).
  3. McAfee. The Hidden Costs of Cybercrime. Available online: https://www.mcafee.com/enterprise/en-us/assets/reports/rp-hidden-costs-of-cybercrime.pdf (accessed on 29 October 2021).
  4. Mobilio, M.; Orr‘u, M.; Riganelli, O.; Tundo, A.; Mariani, L. Anomaly detection as-a-service. In Proceedings of the IEEE International Symposium on Software Reliability Engineering Workshops (ISSREW), Berlin, Germany, 27–30 October 2019; pp. 193–199. [Google Scholar]
  5. Hariharan, A.; Gupta, A.; Pal, Τ. Camlpad: Cybersecurity autonomous machine learning platform for anomaly detection. In Proceedings of the Future of Information and Communication Conference, San Francisco, CA, USA, 5–6 March 2020; Springer: Berlin/Heidelberg, Germany, 2020; pp. 705–720. [Google Scholar]
  6. Sun, W.; Liu, J.; Yue, Y. AI-enhanced offloading in edge computing: When machine learning meets industrial IoT. IEEE Netw. 2019, 33, 68–74. [Google Scholar] [CrossRef]
  7. Roukounaki, A.; Efremidis, S.; Soldatos, J.; Neises, J.; Walloschke, T.; Kefalakis, N. Scalable and configurable end-to-end collection and analysis of IoT security data: Towards end-to-end security in IoT systems. In Proceedings of the IEEE Global IoT Summit (GIoTS), Aarhus, Denmark, 17–21 June 2019; pp. 1–6. [Google Scholar]
  8. Lasota, K.; Bazydło, P.; Kozakiewicz, A. Mobile platform for threat monitoring in wireless sensor networks. In Proceedings of the 3rd IEEE World Forum on Internet of Things (WF-IoT), Reston, VA, USA, 12–14 December 2016; pp. 106–110. [Google Scholar]
  9. Zhipeng, S.; Yuanming, Z.; Jiawei, L.; Jun, X.; Gang, X. A novel time series forecasting model with deep learning. Neurocomputing 2020, 396, 302–313. [Google Scholar] [CrossRef]
  10. Colò, G. Anomaly detection for Cyber Security: Time Series Forecasting and Deep Learning. Int. J. Sci. Res. Math. Stat. Sci. 2020, 7, 40–52. [Google Scholar]
  11. Li, D.; Chen, D.; Goh, J.; Ng, S. Anomaly Detection with Generative Adversarial Networks for Multivariate Time Series. In Proceedings of the 7th International Workshop on Big Data, Streams and Heterogeneous Source Mining: Algorithms, Systems, Programming Models and Applications on the ACM Knowledge Discovery and Data Mining Conference, London, UK, 20 August 2018. [Google Scholar]
  12. Wang, K.; Xiong, H.; Zhang, J.; Chen, H.; Dou, D.; Xu, C.Z. SenseMag: Enabling Low-Cost Traffic Monitoring using Non-invasive Magnetic Sensing. IEEE Internet Things J. 2021, 8, 16666–16679. [Google Scholar] [CrossRef]
  13. Ding, Z.; Shen, L.; Chen, H.; Yan, F.; Ansari, N. Energy-efficient relay-selection-based dynamic routing algorithm for IoT-oriented software-defined WSNs. IEEE Internet Things J. 2020, 7, 9050–9065. [Google Scholar] [CrossRef]
  14. Ding, Z.; Shen, L.; Chen, H.; Yan, F.; Ansari, N. Residual-Energy Aware Modeling and Analysis of Time-Varying Wireless Sensor Networks. IEEE Commun. Lett. 2021, 25, 2082–2086. [Google Scholar] [CrossRef]
  15. Bai, J.; Ding, B.; Xiao, Z.; Jiao, L.; Chen, H.; Regan, A.C. Hyperspectral Image Classification Based on Deep Attention Graph Convolutional Network. IEEE Trans. Geosci. Remote Sens. 2021, 60, 1–16. [Google Scholar] [CrossRef]
  16. Forestiero, A.; Papuzzo, G. Agents-based algorithm for a distributed information system in Internet of Things. IEEE Internet Things J. 2021, 8, 16548–16558. [Google Scholar] [CrossRef]
  17. Tran, M.C.; Heejeong, L.; Nakamura, Y. Abnormal web traffic detection using connection graph. Bull. Netw. Comput. Syst. Softw. 2014, 3, 57–62. [Google Scholar]
  18. Zheng, L.; Li, Z.; Li, J.; Li, Z.; Gao, J. AddGraph: Anomaly detection in dynamic graph using attention-based temporal GCN. In Proceedings of the 28th International Joint Conference on Artificial Intelligence, Macao, China, 10–16 August 2019; AAAI Press: Palo Alto, CA, USA, 2019; pp. 4419–4425. [Google Scholar]
  19. Yu, W.; Cheng, W.; Aggarwal, C.C.; Zhang, K.; Chen, H.; Wang, W. Netwalk: A flexible deep embedding approach for anomaly detection in dynamic networks. In Proceedings of the 24th ACM SIGKDD International Conference on Knowledge Discovery & Data Mining, London, UK, 19–23 August 2018; pp. 2672–2681. [Google Scholar]
  20. Chaudhary, A.; Mittal, H.; Arora, A. Anomaly detection using graph neural networks. In Proceedings of the International Conference on Machine Learning, Big Data, Cloud and Parallel Computing COMITCon), Faridabad, India, 14–16 February 2019; IEEE: New York, NY, USA, 2019; pp. 346–350. [Google Scholar]
  21. Eswaran, D.; Faloutsos, C.; Guha, S.; Mishra, N. Spotlight: Detecting anomalies in streaming graphs. In Proceedings of the 24th ACM SIGKDD International Conference on Knowledge Discovery & Data Mining, London, UK, 19–23 August 2018; pp. 1378–1386. [Google Scholar]
  22. Shin, K.; Hooi, B.; Faloutsos, C. M-zoom: Fast dense-block detection in tensors with quality guarantees. In Proceedings of the Joint European Conference on Machine Learning and Knowledge Discovery in Databases, Skopje, Macedonia, 18–22 September 2016; pp. 264–280. [Google Scholar]
  23. Le Bars, B.; Kalogeratos, A. A probabilistic framework to node-level anomaly detection in communication networks. arXiv 2019, arXiv:1902.04521. [Google Scholar]
  24. Wu, Z.; Pan, S.; Chen, F.; Long, G.; Zhang, C.; Yu, P.S. A comprehensive survey on graph neural networks. arXiv 2019, arXiv:1901.00596. [Google Scholar] [CrossRef] [PubMed] [Green Version]
  25. Gelenbe, E.; Fröhlich, P.; Nowak, M.; Papadopoulos, S.; Protogerou, A.; Drosou, A.; Tzovaras, D. IoT network attack detection and mitigation. In Proceedings of the 9th Mediterranean Conference on Embedded computing, MECO 2020, Budva, Montenegro, 8–11 June 2020; IEEE: New York, NY, USA, 2020; pp. 1–6. [Google Scholar]
  26. Protogerou, A.; Papadopoulos, S.; Drosou, A.; Tzovaras, D.; Refanidis, I. A graph neural network method for distributed anomaly detection in IoT. Evol. Syst. 2020, 12, 19–36. [Google Scholar] [CrossRef]
  27. Forestiero, A. Metaheuristic algorithm for anomaly detection in Internet of Things leveraging on a neural-driven multiagent system. Knowl. Based Syst. 2021, 228, 107241. [Google Scholar] [CrossRef]
  28. Ahemd, M.M.; Wahid, A. IoT Security: A Layered Approach for Attacks & Defenses. In Proceedings of the 2017 International Conference on Communication Technologies (ComTech), Rawalpindi, Pakistan, 19–21 April 2017; IEEE: New York, NY, USA, 2017; pp. 104–110. [Google Scholar]
  29. Gonzalez-Granadillo, G.; Garcia-Alfaro, J.; Alvarez, E.; El-Barbori, M.; Debar, H. Selecting optimal countermeasures for attacks against critical systems using the attack volume model and the RORI index. Comput. Electr. Eng. 2015, 47, 13–34. [Google Scholar] [CrossRef]
  30. Kotenko, I.; Doynikova, E. Dynamical Calculation of Security Metrics for Countermeasure Selection in Computer Networks. In Proceedings of the 24th Euromicro International Conference on Parallel, Distributed, and Network-Based Processing (PDP), Heraklion, Greece, 17–19 February 2016; pp. 558–565. [Google Scholar]
  31. Chehida, S.; Baouya, A.; Bozga, M.; Bensalem, S. Exploration of Impactful Countermeasures on IoT Attacks. In Proceedings of the 9th Mediterranean Conference on Embedded Computing (MECO), Budva, Montenegro, 8–11 June 2020; pp. 1–4. [Google Scholar]
  32. Lee, Y.; Choi, T.J.; Ahn, C.W. Multi-objective evolutionary approach to select security solutions. CAAI Trans. Intell. Technol. 2017, 2, 64–67. [Google Scholar] [CrossRef]
  33. Enoch, S.Y.; Hong, J.B.; Ge, M.; Khan, K.M.; Kim, D.S. Multi-Objective Security Hardening Optimisation for Dynamic Networks. In Proceedings of the ICC 2019—2019 IEEE International Conference on Communications (ICC), Shanghai, China, 20–24 May 2019; pp. 1–7. [Google Scholar]
  34. Hyunjae, K.; Ahn, D.H.; Lee, G.M.; Yoo, J.D.; Park, K.H.; Kim, H.K. IoT network intrusion dataset. IEEE Dataport 2019. [Google Scholar] [CrossRef]
  35. Manasrah, A.M.; Gupta, B.B. An optimized service broker routing policy based on differential evolution algorithm in fog/cloud environment. Clust. Comput. 2019, 22, 1639–1653. [Google Scholar] [CrossRef]
  36. Naha, R.K.; Othman, M.M. Cost-aware service brokering and performance sentient load balancing algorithms in the cloud. J. Netw. Comput. Appl. 2016, 75, 47–57. [Google Scholar] [CrossRef]
  37. Gupte, P.; Bejgum, R.S.R.; Maes, S.H.; Hewlett Packard Enterprise Development LP. Policy Based Selection of Resources for a Cloud Service. U.S. Patent Application No. 14/914,297, 14 July 2016. [Google Scholar]
  38. Yi, S.; Hao, Z.; Qin, Z.; Li, Q. Fog computing: Platform and applications. In Proceedings of the 3rd IEEE Workshop on Hot Topics in Web Systems and Technologies (HotWeb), Washington, DC, USA, 12–13 November 2015; pp. 73–78. [Google Scholar]
  39. Arkian, H.R.; Diyanat, A.; Pourkhalili, A. MIST: Fog-based data analytics scheme with cost-efficient resource provisioning for IoT crowdsensing applications. J. Netw. Comput. Appl. 2017, 82, 152–165. [Google Scholar] [CrossRef]
  40. Angelini, M.; Blasilli, G.; Bonomi, S.; Lenti, S.; Palleschi, A.; Santucci, G.; Paoli, E. BUCEPHALUS: A BUsiness CEntric cybersecurity Platform for proActive anaLysis Using visual analyticS. In Proceedings of the IEEE Symposium on Visualization for Cyber Security (VizSec), New Orleans, LA, USA, 27 October 2021. [Google Scholar]
  41. Damaševičius, R.; Toldinas, J.; Venčkauskas, A.; Grigaliūnas, Š.; Morkevičius, N.; Jukavičius, V. Visual Analytics for Cyber Security Domain: State-of-the-Art and Challenges. In Information and Software Technologies. ICIST 2019; Communications in Computer and Information Science Series; Springer: Berlin/Heidelberg, Germany, 2019; Volume 1078, pp. 256–270. [Google Scholar]
  42. Radoglou Grammatikis, P.; Sarigiannidis, P.; Moscholios, I. Securing the Internet of Things: Challenges, threats and solutions. Internet Things 2019, 5, 41–70. [Google Scholar] [CrossRef]
  43. Shiravi, H.; Shiravi, A.; Ghorbani, A. A Survey of Visualization Systems for Network Security. IEEE Trans. Vis. Comput. Graph. 2012, 18, 1313–1329. [Google Scholar] [CrossRef] [PubMed]
  44. Legg, P. Enhancing cyber situation awareness for Non-Expert Users using visual analytics. In Proceedings of the 2016 International Conference on Cyber Situational Awareness, Data Analytics and Assessment (CyberSA), London, UK, 13–14 June 2016. [Google Scholar]
  45. Empl, P.; Pernul, G. A Flexible Security Analytics Service for the Industrial IoT. In Proceedings of the 2021 ACM Workshop on Secure and Trustworthy Cyber-Physical Systems, Virtual, 28 April 2021. [Google Scholar]
  46. Meidan, Y.; Bohadana, M.; Mathov, Y.; Mirsky, Y.; Breitenbacher, D.; Shabtai, A.; Elovici, Y. N-BaIoT-Network-based detection of IoT botnet attacks using deep autoencoders. IEEE Pervasive Comput. 2018, 17, 12–22. [Google Scholar] [CrossRef] [Green Version]
  47. Battaglia, P.W.; Hamrick, J.B.; Bapst, V.; Sanchez-Gonzalez, A.; Zambaldi, V.; Malinowski, M.; Tacchetti, A.; Raposo, D.; Santoro, A.; Faulkner, R.; et al. Relational inductive biases, deep learning, and graph networks. arXiv 2018, arXiv:1806.01261. [Google Scholar]
  48. Mell, P.; Scarfone, K.; Romanosky, S. Common vulnerability scoring system. IEEE Secur. Priv. 2006, 4, 85–89. [Google Scholar] [CrossRef]
  49. Sonnenreich, W.; Albanese, J.; Stout, B. Return on security investment (rosi)-a practical quantitative model. J. Res. Pract. Inf. Technol. 2006, 38, 239–252. [Google Scholar]
  50. Karthick, R.R.; Hattiwale, V.P.; Ravindran, B. Adaptive network intrusion detection system using a hybrid approach. In Proceedings of the IEEE Fourth International Conference on Communication Systems and Networks (COMSNETS), Bangalore, India, 3–7 January 2012; pp. 1–7. [Google Scholar]
  51. Vinyals, O.; Fortunato, M.; Jaitly, N. Pointer networks. Adv. Neural Inf. Process. Syst. 2015, 28, 2692–2700. [Google Scholar]
  52. Messac, A.; Ismail-Yahaya, A.; Mattson, C. The normalized normal constraint method for generating the pareto frontier. Struct. Multidiscip. Optim. 2003, 25, 86–98. [Google Scholar] [CrossRef]
  53. Mpatziakas, A.; Papadopoulos, S.; Drosou, A.; Tzovaras, D. A Hypothesis Testing tool for the comparison of different Cyber-Security Mitigation Strategies in IoT. In Proceedings of the 2021 IEEE International IOT, Electronics and Mechatronics Conference (IEMTRONICS), Toronto, ON, Canada, 21–24 April 2021. [Google Scholar]
  54. Sood, K.; Karmakar, K.K.; Varadharajan, V.; Tupakula, U.; Yu, S. Analysis of policy-based security management system in software-defined networks. IEEE Commun. Lett. 2019, 23, 612–615. [Google Scholar] [CrossRef]
  55. Trivedi, A.; Srinivasan, D.; Sanyal, K.; Ghosh, A. A survey of multiobjective evolutionary algorithms based on decomposition. IEEE Trans. Evol. Comput. 2017, 21, 440–462. [Google Scholar] [CrossRef]
  56. Li, K.W.; Song, H.; Zeng, F. Policy-based secure and trustworthy sensing for internet of things in smart cities. IEEE Internet Things J. 2017, 5, 716–723. [Google Scholar] [CrossRef]
  57. Hidalgo, C.; Vaca, M.; Nowak, M.P.; Frölich, P.; Reed, M.; Al-Naday, M.; Tzovaras, D. Detection, control and mitigation system for secure vehicular communication. Veh. Commun. 2021, 2021, 100425. [Google Scholar] [CrossRef]
Figure 1. The architecture of the proposed system along with the SDN layer and the IoT devices layer.
Electronics 11 00529 g001
Figure 2. Dataflow for the cross-layer anomaly detection module.
Electronics 11 00529 g002
Figure 3. (a) Modelling of the IoT network as a graph G(V, E) that enables the application of computational processes for anomaly detection, analytics, mitigation and visualization; (b) workflow between the components of the artificial intelligence layer, the fog substrate and the communication substrate (SDN).
Electronics 11 00529 g003
Figure 4. In subfigure (A), the graph neural network architecture is shown, comprising two multi-layer perceptrons, both for edge and node deep neural network implementation. Edge deep neural network takes the features of neighbouring nodes as inputs and updates the edge feature vector, whereas the node deep neural network is fed with the adjacent updated edge features, so as to update the feature vector of each particular node. In subfigure (B), the pointer network architecture is shown, comprising the encoder m, decoder and attention components that interact to reach a decision.
Electronics 11 00529 g004
Figure 5. The user interface provided by the visual analytics module, functioning as the dashboard of the entire system. It monitors the proposed system and displays real-time information about the IoT network security status.
Electronics 11 00529 g005
Figure 6. Detection efficiency against the denial-of-service attack with all devices online.
Electronics 11 00529 g006
Figure 7. Detection efficiency against the denial-of-service attack, with a number of devices unavailable while impacted by the attack.
Electronics 11 00529 g007
Table 1. Features used for the anomaly detection and the mitigation engine components.
Anomaly Detector Features
Time-related entitiesStart time, duration
Header-related entitiesFIN/SYN/RST/PSH/
ACK/URG/CWE/ECE flag counts, Fwd Header Len
Flow-related identifiersSrc IP, Dst IP, Dir, Label
Payload-related entitiesTot Fwd Pkts, Init Fwd Win Byts, Subflow Fwd Byts, Flow Pkts/s,
Flow Byts/s, TotLen Fwd Pkts, Fwd Pkts/s, Subflow Bwd Byts, Fwd IAT Tot
Mitigation Engine Features
CVSS ScoreCommon Vulnerability Scoring System (CVSS) is an open-industry standard for assessing the severity of a cyber security vulnerability [48]. A CVSS score of 10 for a single vulnerability represents the highest severity: CVSS Score = 10−mean(CVSSalldetectedvulnerabilities)
ROSI ScoreReturn on security investment score (ROSI) calculates an index to evaluate the trade-off between the efficiency and the cost of a mitigation plan [49]:
ROSI Score = A n n u a l E x p e c t e d L o s s - A n n u a l R e s p o n s e C o s t A n n u a l R e s p o n s e C o s t + F i x e d A n n u a l I n f r a s t r u c t u r e V a l u e
Coverage ScoreThe coverage score of a mitigation action is calculated as the percentage of the number of vulnerabilities it covers to the number of the total active vulnerabilities.
Deployment Cost ScoreThis KPI evaluates the deployment costs of mitigation actions by taking into account the mitigation deployment time and the importance of the device (as assessed by the network security operator): Deployment cost = Deployment Time * Device importance
Table 2. DoS attack evaluation results.
Anomaly Detection
All Devices OnlineOffline Devices
Detection MethodROC ScoreAccuracyROC ScoreAccuracy
GNN98.9099.0098.9099.00
SVM87.2687.2685.0285.02
Decision Tree97.7097.9796.2396.23
Random Forest96.9696.9694.0394.03
Table 3. Mitigation engine results.
Mitigation Engine
AlgorithmCVSS Score (MIN)Deployment
Cost (MIN)
Coverage
Score (MAX)
ROSI
Score (MAX)
Pointer Networks1.477.071002628
NSGA—II2.8612.0376.092092
MOEA/D2.6111.6592.393005
Table 4. Mitigation engine input.
DeviceVulnerability IDVulnerabilities
Covered by
Available Mitigations
ROSI Score
(Percent)
Mitigation
Deployment Cost
SDN Switch with OpenvswitchCVE-2017-9265 (CVSS 7.5),
CVE-2018-17205 (CVSS 5)
239Honeypot 25,
Block 10,
Blacklist 15,
Block Port 18
IP CameraCVE-2018-19081 (CVSS 4.3),
CVE-2018-19082 (CVSS 10),
CVE-2018-19083 (CVSS 7.5)
319Honeypot 12.5,
Block 5,
Blacklist 7.5,
Block Port 9
SDN Router with ONOSCVE-2018-1000615 (CVSS 5), CVE-2018-12691 (CVSSS 4.3)239Honeypot 37.5,
Block 15,
Blacklist 22.5,
Block Port 27
Windows PCCVE-2019-1368 (CVSS 2.1),
CVE-2019-1359 (CVSS 9.3)
259Honeypot 50,
Block 20,
Blacklist 30,
Block Port 36
Publisher’s Note: MDPI stays neutral with regard to jurisdictional claims in published maps and institutional affiliations.

