Abstract
Activity Recognition (AR) is a method to identify a certain activity from the set of actions. It is commonly used to recognize a set of Activities of Daily Living (ADLs), which are performed by the elderly in a smart home environment. AR can be beneficial for monitoring the elder’s health condition, where the information can be further shared with the family members, caretakers, or doctors. Due to the unpredictable behaviors of an elderly person, performance of ADLs can vary in day-to-day life. Each activity may perform differently, which can affect the sequence of the sensor’s raw data. Due to this issue, recognizing ADLs from the sensor’s raw data remains a challenge. In this paper, we proposed an Activity Recognition for the prediction of the Activities of Daily Living using Artificial Intelligence approach. Data acquisition techniques and modified Naive Bayes supervised learning algorithm are used to design the prediction model for ADL. Our experiment results establish that the proposed method can achieve high accuracy in comparison to other well-established supervised learning algorithms.
1. Introduction
According to the National Development Council, Taiwan has been becoming an aged society since 2018 and is projected to become super-aged in 2026, hosting a large elderly population, where the primary support people availability will fall from 5.0 in 2018 to 1.2 persons in 2026 [1]. Besides, the cost of all healthcare services for the elderly are mostly not affordable, where the need of healthcare services such as hospitals, clinics, and clinicians for the elderly are rapidly increasing. In 2010, the percentage of elderly who are living with their children in Taiwan is ± [2], which indicates that the elderly need continuous monitoring and assistance in critical situations. Due to various diseases such as malignant neoplasms, cardiovascular diseases, diabetes mellitus, etc., the elderly require extra care in the home. Therefore, automated monitoring to track the Activities of Daily Living (ADLs) of an elderly person is the primary focus of our proposed methods, which includes the data generated from a wide range of smart sensor devices.
Technologically advanced smart living is increasing with the utilization of smart devices termed as Internet of Things (IoT). These IoT devices are well-integrated into the day-to-day life of human activities. For instance, smart home appliances and wearable IoT devices such as wrist bands assist to monitor human movement, sleep activity, health condition, calories burned while doing multiple daily activities, and so on. However, it could be difficult for the elderly people to manually update and process the daily activities, and their occasional unwillingness to wear the smart bands leads to poor monitoring of daily activities. IoT sensors are embedded into smart devices that can automatically record events while human–machine interactions are performed. For instance, a light sensor gives a binary output stating the event as on or off. IoT-embedded smart devices can be integrated into a real-world environment with concurrent deployment, turning the conventional perspective of environments to smart eco-systems. For instance, a home embedded with multiple sensors can magnify the abilities of a simple home, which is termed as a smart home nowadays.
A smart home (SH) can assist and ensure robust monitoring in terms of energy efficiency, healthcare, elderly safety, and behavior tracking. For instance, the analysis and prediction of the on-event smart home appliances are developed as one of the non-intrusive types of load monitoring in energy consumption [3,4]. This type of monitoring is performed on a real-time basis, which can provide accurate information regarding the electricity bill and eventually control energy consumption. With a similar analogy to event, monitoring behavior of the elderly for healthcare purposes may vary from day-to-day Activities of Daily Living (ADLs). Activities such as cooking, sleeping, and eating are the most prevalent factors that assist to monitor health condition and anomalous behavior of an elderly person [5]. The ADL comprises of a set of activities that are listed based on the Roper–Logan–Tierney model [6] of nursing. Those activities include but are not limited to eating, drinking, washing, dressing, working, playing, and sleeping. Besides, the SH assists to monitor the resident’s safety. For instance, an event such as falling down for the elderly is a potentially dangerous action [7]. A wide range of IoT smart devices can be deployed in an SH, which play an important role in monitoring and detecting elderly behavior. Multiple types of sensors can be used to monitor elderly behavior, such as motion sensors, door sensors, light sensors, temperature sensors, etc. [8]. Eventually, massive raw sensor data can be generated continuously from the embedded sensors in an SH. Furthermore, the IoT-sensor-generated data are utilized to build and design a sophisticated Activity Recognition (AR) model. Nowadays, traditional data analysis methods cannot handle the massive growth of data in terms of variety and volume. Normally, various types of enormous data such as numerical, categorical, audio, image, and text are collected from different sources, which could be structured, unstructured, or semi-structured. These types of data are normally difficult to analyze using traditional data analysis tools, especially when the data grow over time, which can lead to difficulties in maintaining the database. Due to this reason, Artificial Intelligence (AI) techniques are needed to overcome the challenges of analyzing various data types in huge volumes.
AR is an application for recognizing the ADLs through a learning process using ML and DL techniques. AR has been broadly studied based on text and visual data including image and video. ML techniques are mostly applied for analyzing the text data collected by the sensors. Normally, supervised and unsupervised learning approaches are applied to analyze the text or image data. Both learning methods can be differentiated based on different tasks, algorithms, data types, and availability of data labels. Supervised learning is generally used for classification and regression tasks with labeled data, whereas unsupervised learning is used for clustering task with unlabeled data. Considering the supervised learning, a few algorithms [9] have been used for developing AR techniques such as Decision Tree (DT), Naive Bayes (NB), Support Vector Machine (SVM), Hidden Markov Model (HMM), Conditional Random Field (CRF), etc. The current research trend of AR focuses on a high percentage of accuracy by using different techniques to analyze the sensor’s raw data. As discussed in [10], different methodologies and effectiveness of the models are analyzed by using various types of AR techniques such as sensor windowing, time dependency, sensor dependency, dynamic window size, and time windows. Taking unsupervised learning, K-means and Principal Component Analysis (PCA) have been applied [11,12]. K-means has basically been applied to find the irregularity pattern of the elderly in performing ADLs [11], whereas PCA has been applied to determine the most influential features for predicting indoor and outdoor ADLs [12]. On the other hand, considering the visual-based data, DL is the most used technique. Currently, two types of DL techniques are commonly adopted, which are feed-forward- and recurrent-neural-network-based. According to each type of network, multiple DL algorithms have been applied. Involving multiple data sources, Convolutional Neural Network (CNN) and Long Short-Term Memory (LSTM) have been used to recognize the ADL [13]. Similarly, CNN has been also used for fall detection applications [14]. CNN and Deep Skip Connection Gated Recurrent Unit (DS-GRU) are used for recognizing the movement of activities and localization [15,16], respectively.
Based on an endeavor to provide the best healthcare applications for the elderly using SH applications, AR models are highly essential to recognize the set of ADLs. By knowing the set of ADLs on different days, the patterns of behavior can be predicted and the health condition of elders can be analyzed and forwarded to family members, caretakers, or clinicians. However, it is challenging to recognize the set of ADLs. Firstly, various ADLs are performed daily; secondly, each activity can be performed differently with variation of activity durations. Accordingly, the sensor raw data sequences could be varied. By considering all these challenges in AR, we propose here an Activity Recognition and prediction model for the Activities of Daily Living (ADLs) using Artificial Intelligence. Our proposed method is composed of data acquisition techniques, feature extraction methods, and an ADLs prediction model using machine learning algorithms. Naive Bayes supervised learning is adopted in the proposed method. The main contributions of this work can be summarized as follows:
- Design AR techniques that can precisely recognize the set of ADLs in common rooms and areas with common sensors for multiple activities performed by the elderly.
- The designed data acquisition techniques and feature extraction methods can process the sensor raw data for better analysis.
- The designed Activity Recognition model can work robustly in predicting the set of predefined ADLs.
- The ADLs prediction model can help monitoring an elder’s daily behaviors.
- The results of the designed prediction model can be forwarded remotely to the family members and caretakers, which can prevent fatal conditions and save the life of elderly people on time.
The rest of the paper is organized as follows. The related works are discussed in Section 2. Section 3 generalizes the system model including the predefined areas, sensor types, sensor IDs, and ADLs. Section 4 elucidates the Activity Recognition (AR) model, which is composed of three subsections: data acquisition, feature extraction, and ADLs prediction model using Naive Bayes. Section 5 presents the performance evaluation setup, dataset, metrics, and evaluation results. Concluding remarks and our future works are given in Section 6.
2. Related Works
Multiple sensors are embedded for capturing and monitoring ADLs performed by the elderly in smart home environment through the connection and integration of Internet of Things (IoTs). Applications of IoTs-based AR in a smart home can be categorized into sensor-based [12,17,18] and visual-based [13,14,19] recognition. To assist an elder who lives alone in a home, the authors of [17] proposed AR using two sensors such as an accelerometer and gyroscope. The time series data were collected through a smartphone and sensors, and segmented. The preprocessed data were further used for feature extraction and model training using DL approaches. The authors proposed five different networks, which are mainly based on CNN and LSTM architectures and optimized by Bayesian optimization. The proposed networks were designed to recognize six different activities such as walking (i.e., walking, upstairs walking, and downstairs walking), sitting, standing, and laying. Similarly, the authors in [12] proposed an AR model using sensors that can assist and monitor indoor and outdoor ADLs performed by the elderly. The collected sensor data were preprocessed using three techniques and input to the feature selection methods. PCA was used to select the important features. Authors built DL-based AR models by considering variants of DL architectures in [18]. The proposed model was applied to multi-modal sensor data collected from a single resident. The preprocessed features were selected using F-ANOVA, Autoencoder, and PCA. Finally, reduced features were used for training the models using Autoencoder and Recurrent Neural Networks (RNN).
Authors proposed Ambient Assisted Living (AAL) using visual-based sensors to assist elders who live independently in [19]. A stereo depth camera was used to recognize the activity of elders in absence of a nurse. To reduce the noise, authors applied a curtain removal method so that the person in the preprocessed image could be detected. Considering the appearance-based and distance-based features, the authors applied SVM as the classifier for recognizing the activities. For a similar purpose in designing the AAL, authors combined motion-based RGB video sensors, static wearable inertial sensors, and contextual information ambient sensors in [13] for developing AR. The developed AR was designed for recognizing nine ADLs based on CNN and LSTM. Authors used a dataset of RGB video for fall detection using video data in [14]. The proposed model consisted of two steps including pose estimation and Activity Recognition. In pose estimation, CNN is used to predict the 2D human joint coordinates. The resulting coordinates are standardized using min-max normalization and passed to the CNN architecture for predicting the ADLs per input frame.
Various machine learning algorithms have been proposed to solve the Activity Recognition (AR) in home care. The state-of-the-art AR techniques comprise two types of learning, which are supervised and unsupervised learning. Various AR methods have been developed to achieve multiple objectives. For movement activities and localization purposes in real-time, two works have been proposed [15,16]. For healthcare purposes, authors have proposed an AR framework to capture real-time movement using smartphone sensors. Considering the time series dataset, authors applied the Convolutional Neural Network (CNN) in [15]. On the other hand, for monitoring AR, authors have tried to localize an individual through video data. The pedestrian detection model using CNN, a sequence of frame data analysis, and pattern analysis models were proposed in [16] based on DS-GRU. Smartphone sensor data were used in [20,21,22] to recognize physical activities. In order to solve the challenge of recognizing activities using wearable devices, authors in [20] used Support Vector Machine (SVM) on a public dataset from real-life scenarios. Due to low accuracy performance in recognizing the activities using a smartphone, the authors [21] came up with an idea of only using readings of two axes from the smartphone accelerometer sensor. The generated sensor data were analyzed using Decision Tree (J48), LR, and Multi-Layer Perceptron (MLP). Authors tried to solve the problem of recognizing activities in [22]; they proposed Activity Recognition using DL instead of machine learning on real-time datasets. Authors in [23] correlated energy consumption for predicting AR using a Bayesian network algorithm. Furthermore, some authors [24,25,26] have proposed different ways to efficiently predict AR. In [24], authors used the transfer learning method for cross-environment AR. In [25], the spatiotemporal mining technique was used for detecting the behavioral pattern. SVM and K-nearest neighbor algorithms were adopted in [26] to recognize the activities. Slightly different from other AR methods, authors have identified the activity boundaries by applying SVM algorithms [27].
Although less investigations have been performed using unsupervised learning, a few works have been proposed to solve the Activity Recognition (AR) problems by considering different unsupervised learning algorithms. Due to less analysis on multiple residents, the authors in [28] proposed AR for two residents. Their proposed work comprised feature extraction, K-means clustering, and the AR mechanism. Different clustering algorithms including K-Nearest Neighbor (K-NN) and K-means were used in this work [11] for analyzing AR in clinical applications. As handcrafted feature extraction is a manual process and data labeling is an expensive and time-consuming process, authors designed AR techniques using similarity and distance calculation in [29], and Density-Based Spatial Clustering of Applications with Noise and Hierarchical Clustering in [30]. The aim of the proposed method in [29] is to detect the implicit irregularity patterns from the elder’s behaviors, whereas in [30], the purpose is to identify the elder’s behavior from the sensor data. Moreover, authors in [31] proposed two stages of AR using a skeleton sequence dataset combining supervised and unsupervised learning. The unsupervised learning such as K-means and Gaussian Mixture Models (GMM) were used to cluster the dataset. Then, Spatial–Temporal Graph Convolutional Network was used to classify the activity class. To tackle various datasets in AR, authors proposed Shift Generative Adversarial Networks, taking the accelerometers and binary sensors datasets, in [32].
As described above, many AR models have been proposed to monitor the activities using ML and DL. However, DL is still considered a complex technique to be applied in analyzing raw sensor data. As our proposed model is based on analysis of raw data collected by the sensors, ML is preferred to be adopted in our proposed method. Since it is challenging in recognizing the ADLs accurately, we aim to develop an AR model that can predict the ADLs only considering the embedded sensor data. We have developed the Activity Recognition method that can work robustly in complex scenarios where two types of sensors are installed for capturing multiple activities in multiple areas and rooms. Due to these challenges, an AR model is proposed using supervised learning Naive Bayes (NB) algorithms that can precisely recognize the set of ADLs. Table 1 shows the comparison of our work with some important related works.

Table 1.
Comparison of our work with related works.
3. System Model
In this section, the generalization of all smart home (SH) components including predefined areas, sensor types, sensor IDs, and predefined Daily Living Activities are described. Considering a smart home with a single resident, the set of predefined ADLs is performed by the resident in particular predefined areas throughout the day. Let us assume that a set of installed sensors associated with sensor IDs captures the movement of a resident and stores the data into a database. It is assumed that the space of a single home can be divided into certain areas and let be the set of those predefined areas. represents a set of predefined sensor types, where each sensor type can be installed in any area , where ; ; and are the number of divided areas and considered sensor types, respectively. Accordingly, let be the set of sensor IDs installed in the area , where . For instance, let , , , and . Then, the set of sensor IDs that are installed in a particular area can be denoted as , , where . Thus, for all embedded sensor IDs in all predefined areas can be denoted by . In a day , an elder can perform any activity from the set of predefined ADLs. Let be the set of predefined ADLs. Accordingly, for each denoted activity , the sensor data would be generated and stored into the database, where . The raw sensor data are stored in the form of a tuple , where and are sensor IDs, value, and , respectively. Sensor value is considered as a discrete value, as shown in Equation (1). Accordingly, Table 2 shows the example of the raw sensor data along with notations by considering , , and .

Table 2.
Example of the system model.
4. Proposed Method
This section presents the proposed Activity Recognition (AR) model for the Activities of Daily Living (ADLs) prediction using machine learning. In the initial phase, the collected raw sensor data are relabeled and the window and sub-window group mappings are designed. Furthermore, we applied the feature extraction procedure to extract important features from the mapped sensor data. Right after, we developed the AR model by training the extracted features using Naive Bayes machine learning algorithms. Figure 1 shows an overview of the proposed AR.

Figure 1.
The overview of the proposed work.
4.1. Data Relabeling
Initially, the collected raw sensor data are annotated [33]. The annotation is performed by remarking the starting point of the activity as “ActivityName() begin” and the finishing point as “ActivityName() end” in a particular record. Furthermore, the raw data are relabeled by assigning “ActivityName()” in each record within the range of these two points, i.e., the starting and finishing points. For more clarity of the relabeled process, let us consider , . Table 3 shows an example of the relabeled activity process within the start and end points.

Table 3.
System model examples.
4.2. Window and Sub-Window Group Mapping
Let, be the set of window groups generated within the fixed interval unit of times X, where is the unit of time in minutes. Each window group is associated with a set of sensor IDs S, where . Each sensor ID associated with a window group is associated with sub-window groups with fixed interval units of time Y, where is the unit of time in seconds. Let be the sensor value of sensor ID associated with a particular window group and sub-window group . For instance, let us consider Day 1 = 24 h, X = 10 min, and Y = 10 s. The total number of window groups could be calculated as 24 h × 60 min = 1440 min, which is min = 144 window groups. Similarly for sub-window groups, each window group = 10 min × 60 s = 600 s and the total number of sub-window groups can be defined as s = 60 sub-window groups. The complete formation of the window groups is shown in Table 4. After completing the mapping of window and sub-window groups, we reduced the total number of window and sub-window groups. If the sensor ID values of either window or sub-window groups are empty, the respective group is deleted.

Table 4.
Formation of window and sub-window groups.
4.3. Feature Extraction
The feature extraction procedure is carried out for each activity using the sliding window technique with a size of windows = 1. In each sliding window, five features are extracted based on the window and sub-window groups. Two features such as and are extracted by analyzing the sensor IDs associated with the respective window groups , , where represents the “Sensor type ()” and refers to “Sensor area ()”. Moreover, and features are derived from the sub-window groups duration division, where presents the starting time of the “ActivityName() begin” label when sensor ID in particular window and sub-window groups, whereas refers to “ActivityName() end” when . Based on the extracted “Sensor active ()” and “Sensor inactive ()” features, we calculated the “Sensor time elapsed ()”. The formal formula is derived in Equation (2). The formal description of our feature extraction is given in Algorithm 1.
| Algorithm 1 Feature extraction for each activity |
Input: A set of window groups W and a set of sub-window groups T Parameter: Sensor type , Sensor area , Sensor active , Sensor inactive , Sensor time elapsed , Window size = 1, Window start = , , Window finish = , Process: 1: For each instant do 2: Do 3: IF TRUE (label == “ActivityName() begin”) 4: Observe and sub-window group 5: Extract 6: Extract 7: IF TRUE (label == “ActivityName() End”) 8: Observe and sub-window group 9: Extract 10: Calculate Equation (2) 11: While (label != “ActivityName() End”) 12: End For |
4.4. Activity Recognition for Daily Living Prediction
Based on the extracted features, the training dataset is generated. Let be a training matrix, where M represents the instances of the recorded sensors, and , where is the total numbers of extracted features. Let and be the sets of instances and features, respectively. Given a set of data points , each instance i is associated with a particular ADL . The training matrix can be represented as follows:
Based on the training matrix , the Activity Recognition (AR) for ADLs prediction is designed by adopting the Naive Bayes (NB) supervised learning algorithm. NB is a probabilistic classifier based on Bayes theorems. NB can handle continuous and discrete data types. By using NB, all probabilities of ADLs occurrence can be calculated with respect to the set of feature f. Finally, the highest probability is considered as the predicted ADLs. There are three formal stages in NB, and the description of the prediction model is shown in Algorithm 2.
| Algorithm 2 Activity Recognition for Activities of Daily Living Prediction |
Input: A training matrix Parameter: A set of predefined ADLs class (B) An ADL class Feature (f) Total dataset (n), Data point () Process: 1: Calculate ADLs class probability: 2: Calculate ADLs class conditional probability: 3: Calculate ADLs class total probability: 4: Return 5: END |
4.5. Model Training and Testing
The derived dataset is split into training and testing sets. The training set is used for establishing the prediction model by using the Gaussian Naive Bayes (GNB) classifier from the Scikit-learn machine learning library. The experiment is conducted with different training and testing ratios; finally, 5-fold cross-validation is performed taking 80:20 ratio to train and validate the designed model. Out of 355 total sensor instances, 284 and 71 instances are used for training and testing sets, respectively. Considering 5-fold cross-validation, approximately 227 instances for training and 57 instances for validation out of 284 total training instances are used in each fold. This technique is adopted to prevent the over-fitting of our ADLs prediction model. In this training technique, one fold is assigned to a testing set in each round and the remaining subsets are assigned to the training sets. Upon completing the training in each round, we optimized our model by tuning the GNB hyper-parameters including “Variance smoothing” and “power transformation” using the grid search technique. In the next round, we re-trained our model, taking the tuned hyper-parameters. These procedures are carried out for k rounds, which finally produce the optimized ADL prediction model. Finally, we used the testing set to evaluate the performance of our final ADLs prediction model. Figure 2 shows the details of our model training and testing procedure.
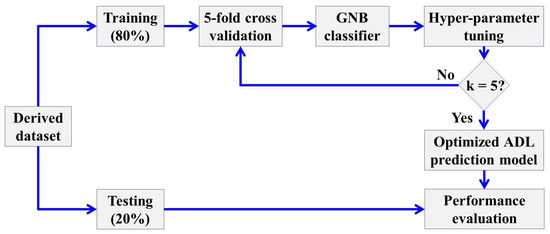
Figure 2.
Model training and testing procedure.
5. Performance Evaluation
In this section, we elucidate the evaluation setup comprising the used hardware and software specifications. Next, we describe the dataset for our implementation. We also explain the measurement metrics, and the evaluation results of the proposed method are presented as follows.
5.1. Evaluation Setup
We conducted the experiments on a GPU GeForce GTX 1070 Ti system running the Ubuntu 18.04.2 platform. Under this operating system, 418.56 NVDIA-SMI and 32 GB memory are used. Scikit-learn v0.23.2 library is used along with other supported libraries such as Numpy v1.16.5, Pandas v1.0.5, Matplotlib v2.2.3, etc., as the machine learning framework. The experiment is programmed in Python v3.6.7.
5.2. Evaluation Dataset
Our experimental dataset is based on CASAS benchmark datasets [33]. Among many available datasets in CASAS, ARUBA is chosen as it is an annotated dataset with predefined sensor types and ADLs for a single resident. Based on the collected ARUBA data that comprise 8 months of duration, we only considered a 1 week data sample that comprises 355 sensor data with a set of predefined rooms and areas {Kitchen, Bathroom, Office, Bedroom, Closet, Living, Dining, Garage, Front, Back}, a set of predefined sensor types {Motion sensor, Door closure sensor}, and a set of predefined ADLs {Sleeping, Bed to toilet, Meal Preparation, Relaxing, House Keeping, Eating, Work, Wash Dishes, Relax}. It is to be noted that 31 motion sensors (M001 to M031) and 4 door sensors (D001 to D004) have been considered in this proposed work for activity monitoring. The whole ARUBA environment is shown in Figure 3. The experiment is conducted by considering multiple training:testing ratios such as 60:40, 70:30, 75:25, 80:20, and 90:10. The proposed method is evaluated and compared with three ML algorithms, which are Support Vector Machine (SVM), Linear Regression (LR), and K-Nearest neighbors (K-NN). K-NN and SVM are selected as both algorithms have been used in [18,20].
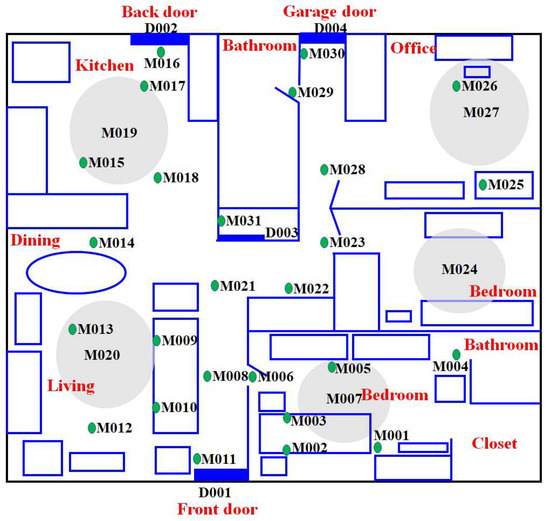
Figure 3.
Aruba system model.
5.3. Evaluation Metrics
Four parameters such as True Positive , False Positive , True Negative , and False Negative are calculated to evaluate the performance of our proposed model. Accordingly, few metrics are calculated to justify how well our proposed method can predict the ADLs. The metrics are , , /, and , as given in Equation (4), Equation (5), Equation (6) and Equation (7), respectively. These metrics can be calculated as follows:
5.4. Evaluation Results
Initially, it is evaluated whether the classifier is affected by adding more data into the training. Thus, we considered the most commonly used training:testing ratio as 80:20. As shown in Figure 4, it is observed that the score is gradually increasing when the total number of data > 200, although training score is reducing while adding more data, i.e., approximately 160. Based on this finding, more experiments have been conducted by considering multiple training:testing ratios such as 60:40, 70:30, 75:25, 80:20, and 90:10.
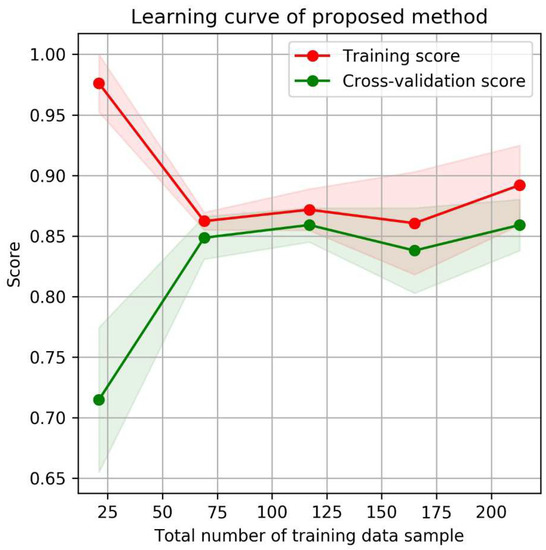
Figure 4.
Learning curve of the proposed method.
Based on each ratio, we evaluated the Accuracy, Recall, Precision, and F1-score of our proposed GNB method. Table 5 shows the evaluation results of each ratio. Taking the 80:20 ratio, it is observed that our model performs well in terms of Accuracy = 0.87, Recall = 0.96, Precision = 0.92, and F1-score = 0.91. The stability of our model performance can be supported by an average of all performance metric values considering different ratios. The proposed method can classify all 9 classes of ADLs with average Accuracy of 0.84, Recall = 0.92, Precision = 0.9, and F1-score = 0.88. In depth, Figure 5 shows the relationship between the precision and recall performance from different ratios. It is implicated that our model can predict more corrected classes with precision and recall > 0.8.

Table 5.
Evaluation metrics with different dataset ratio.
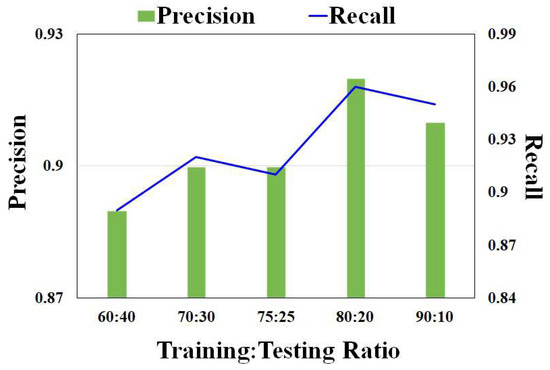
Figure 5.
Precision recall with different ratios.
Moreover, with the help of the GNB classifier, the loss is calculated using cross entropy from the testing set, ground truth and predicted value. As shown in Figure 6, our proposed method has an average loss of 0.461, with maximum loss 0.684 and minimum loss 0.34 using the ratios of 90:10 and 70:30, respectively.
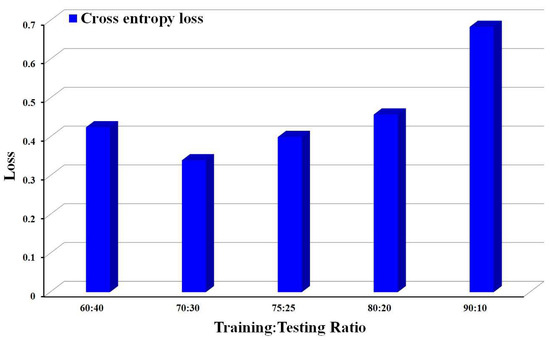
Figure 6.
Loss value for different ratios.
Taking the 80:20 ratio, the Receiver Operating Characteristic (ROC) curve is derived for each ADL class, as shown in Figure 7. The ROC curve shows an Area Under the Curve (AUC) for all classes > 0.8 with an average of 0.97.
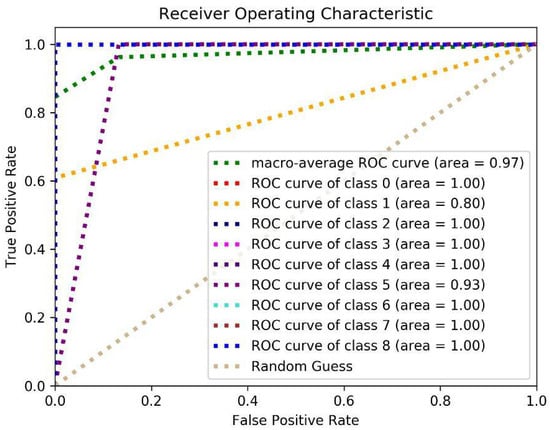
Figure 7.
ROC of the proposed model.
To justify the robustness of our model using GNB, we compared the performance with the three well-established classifiers SVM, K-NN, and LR, which are used in [18,20]. The comparison is performed by measuring and comparing the Accuracy, Recall, Precision, and F1-Score considering the Training:Testing ratio of 80:20. We performed the experiment using 5-fold cross-validation. It is observed that our proposed model can classify the predefined ADLs accurately with an average of 0.853 and standard deviation of from all metrics, as shown in Table 6. Although it has been reported that SVM is the most applied algorithm for AR [20] and has a very low computation time [18], the overall performance of SVM can only achieve an average of 0.58 (). This implies that our model outperforms SVM in recognizing multiple ADLs. Similarly, K-NN [18] has the lowest accuracy, with an average of 0.492 (), compared with SVM and our model in recognizing the overlapped ADLs performed by the elderly. In addition, LR has the lowest overall performance with an average of 0.39 (). Furthermore, we have investigated the loss classifier for different algorithms considering all Training:Testing ratios. As shown in Figure 8, the loss of all classifiers and our proposed model are compared ratio-wise. Based on the average, our proposed model has the lowest loss = 0.461 ± 0.131 compared with SVM (0.53 ± 0.033), LR (1.09 ± 0.04), and K-NN (3.865 ± 1.226). It is also observed that our proposed model has the lowest overall minimum loss = 0.34 at the 70:30 ratio for overall maximum and minimum loss, whereas LR and K-NN have the highest loss for either the maximum or minimum loss category compared with our model and SVM; although, SVM has the lowest overall maximum loss = 0.567 at the 60:10 ratio.

Table 6.
Evaluation metrics for comparing with different algorithms.
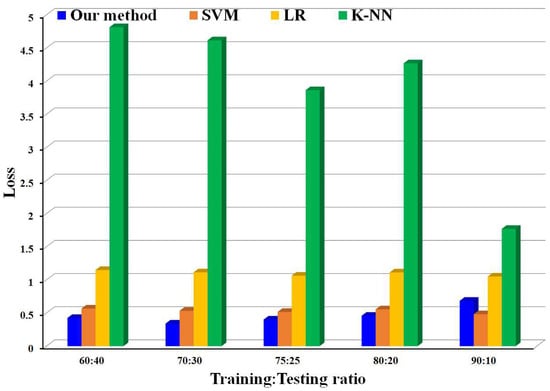
Figure 8.
Comparison of loss with different training and testing ratios.
6. Conclusions
The Activity Recognition for Activities of Daily Living prediction using Artificial Intelligence is proposed in this paper. The data acquisition techniques and feature extraction mechanisms are also designed for the proposed model. Further, the proposed prediction model is developed using supervised learning and Gaussian Naive Bayes (GNB) is adopted as the classifier. Based on the experimental results, our proposed model can efficiently and accurately recognize the set of ADLs from the collected raw sensor data. Moreover, the evaluation results show that our proposed model has higher average value of overall performance metrics of 0.885 and lower average loss value 0.461 by considering five different Training:Testing ratios. This work could be extended for more complex scenarios including more number of residents, areas, sensor types and ADLs for our future work.
Author Contributions
D.D.O. and P.K.S. conceptualized the idea and designed the model, algorithms, and experiments. D.D.O. analyzed the data and prepared the manuscript. P.K.S. supervised the work and edited the manuscript. All authors have read and agreed to the published version of the manuscript.
Funding
This research was funded by Ministry of Science and Technology, Taiwan grant number 110-2221-E-182-008-MY3.
Data Availability Statement
The ARUBA data used in this study were obtained from publicly available CASAS dataset and can be downloaded at https://casas.wsu.edu/datasets/ (accessed on 12 November 2022).
Conflicts of Interest
The authors declare no conflict of interest.
References
- National Development Council. Population Projections for R.O.C. (Taiwan): 2016 2060. Available online: https://www.ndc.gov.tw/en/cp.aspx?n=2E5DCB04C64512CC (accessed on 10 June 2020).
- National Statistics Republic of China (Taiwan). Population and Housing Census. Available online: https://eng.stat.gov.tw/public/data/dgbas04/bc6/census029e(final).html (accessed on 10 June 2020).
- Athanasiadis, C.L.; Papadopoulos, T.A.; Doukas, D.I. Real-time non-intrusive load monitoring: A light-weight and scalable approach. Energy Build. 2021, 253, 111523. [Google Scholar] [CrossRef]
- Athanasiadis, C.; Doukas, D.; Papadopoulos, T.; Chrysopoulos, A. A scalable real-time non-intrusive load monitoring system for the estimation of household appliance power consumption. Energies 2021, 14, 767. [Google Scholar] [CrossRef]
- Fahad, L.G.; Tahir, S.F. Activity recognition and anomaly detection in smart homes. Neurocomputing 2021, 423, 362–372. [Google Scholar] [CrossRef]
- Holland, K.; Jenkins, J. (Eds.) Applying the Roper-Logan-Tierney Model in Practice-E-Book; Elsevier Health Sciences: Amsterdam, The Netherlands, 2019. [Google Scholar]
- Bleda, A.L.; Fernández-Luque, F.J.; Rosa, A.; Zapata, J.; Maestre, R. Smart sensory furniture based on WSN for ambient assisted living. IEEE Sens. J. 2017, 17, 5626–5636. [Google Scholar] [CrossRef]
- Lohan, V.; Singh, R.P. Home Automation using Internet of Things. In Advances in Data and Information Sciences; Springer: Singapore, 2019; pp. 293–301. [Google Scholar]
- Wan, J.; O’grady, M.J.; O’Hare, G.M. Dynamic sensor event segmentation for real-time activity recognition in a smart home context. Pers. Ubiquitous Comput. 2015, 19, 287–301. [Google Scholar] [CrossRef]
- Krishnan, N.C.; Cook, D.J. Activity recognition on streaming sensor data. Pervasive Mob. Comput. 2014, 10, 138–154. [Google Scholar] [CrossRef]
- Ariza Colpas, P.; Vicario, E.; De-La-Hoz-Franco, E.; Pineres-Melo, M.; Oviedo-Carrascal, A.; Patara, F. Unsupervised Human Activity Recognition Using the Clustering Approach: A Review. Sensors 2020, 20, 2702. [Google Scholar] [CrossRef]
- Mihoub, A. A deep learning-based framework for human activity recognition in smart homes. Mob. Inf. Syst. 2021. [Google Scholar] [CrossRef]
- Ranieri, C.M.; MacLeod, S.; Dragone, M.; Vargas, P.A.; Romero, R.A.F. Activity recognition for ambient assisted living with videos, inertial units and ambient sensors. Sensors 2021, 21, 768. [Google Scholar] [CrossRef]
- Yadav, S.K.; Luthra, A.; Tiwari, K.; Pandey, H.M.; Akbar, S.A. ARFDNet: An efficient activity recognition & fall detection system using latent feature pooling. Knowl. Based Syst. 2022, 239, 107948. [Google Scholar]
- Alemayoh, T.T.; Lee, J.H.; Okamoto, S. New sensor data structuring for deeper feature extraction in human activity recognition. Sensors 2021, 21, 2814. [Google Scholar] [CrossRef]
- Ullah, A.; Muhammad, K.; Ding, W.; Palade, V.; Haq, I.U.; Baik, S.W. Efficient activity recognition using lightweight CNN and DS-GRU network for surveillance applications. Appl. Soft Comput. 2021, 103, 107102. [Google Scholar] [CrossRef]
- Mekruksavanich, S.; Jitpattanakul, A. Lstm networks using smartphone data for sensor-based human activity recognition in smart homes. Sensors 2021, 21, 1636. [Google Scholar] [CrossRef] [PubMed]
- Hayat, A.; Morgado-Dias, F.; Bhuyan, B.P.; Tomar, R. Human Activity Recognition for Elderly People Using Machine and Deep Learning Approaches. Information 2022, 13, 275. [Google Scholar] [CrossRef]
- Zin, T.T.; Htet, Y.; Akagi, Y.; Tamura, H.; Kondo, K.; Araki, S.; Chosa, E. Real-time action recognition system for elderly people using stereo depth camera. Sensors 2021, 21, 5895. [Google Scholar] [CrossRef]
- Garcia-Gonzalez, D.; Rivero, D.; Fernandez-Blanco, E.; Luaces, M.R. A Public Domain Dataset for Real-Life Human Activity Recognition Using Smartphone Sensors. Sensors 2020, 20, 2200. [Google Scholar] [CrossRef]
- Javed, A.R.; Sarwar, M.U.; Khan, S.; Iwendi, C.; Mittal, M.; Kumar, N. Analyzing the Effectiveness and Contribution of Each Axis of Tri-Axial Accelerometer Sensor for Accurate Activity Recognition. Sensors 2020, 20, 2216. [Google Scholar] [CrossRef] [PubMed]
- Ye, J.; Li, X.; Zhang, X.; Zhang, Q.; Chen, W. Deep learning-based human activity real-time recognition for pedestrian navigation. Sensors 2020, 20, 2574. [Google Scholar] [CrossRef]
- Yassine, A.; Singh, S.; Alamri, A. Mining human activity patterns from smart home big data for health care applications. IEEE Access 2017, 5, 13131–13141. [Google Scholar] [CrossRef]
- Chiang, Y.T.; Lu, C.H.; Hsu, J.Y.J. A feature-based knowledge transfer framework for cross-environment activity recognition toward smart home applications. IEEE Trans. Hum. Mach. Syst. 2017, 47, 310–322. [Google Scholar] [CrossRef]
- Samarah, S.; Al Zamil, M.G.; Aleroud, A.F.; Rawashdeh, M.; Alhamid, M.F.; Alamri, A. An efficient activity recognition framework: Toward privacy-sensitive health data sensing. IEEE Access 2017, 5, 3848–3859. [Google Scholar] [CrossRef]
- Fullerton, E.; Heller, B.; Munoz-Organero, M. Recognizing human activity in free-living using multiple body-worn accelerometers. IEEE Sensors J. 2017, 17, 5290–5297. [Google Scholar] [CrossRef]
- Wang, Y.; Fan, Z.; Bandara, A. Identifying activity boundaries for activity recognition in smart environments. In Proceedings of the 2016 IEEE International Conference on Communications (ICC), Kuala Lumpur, Malaysia, 23–27 May 2016; pp. 1–6. [Google Scholar]
- Guo, J.; Li, Y.; Hou, M.; Han, S.; Ren, J. Recognition of Daily Activities of Two Residents in a Smart Home Based on Time Clustering. Sensors 2020, 20, 1457. [Google Scholar] [CrossRef] [PubMed]
- Shang, C.; Chang, C.; Chen, G.; Zhao, S.; Lin, J. Implicit Irregularity Detection Using Unsupervised Learning on Daily Behaviors. IEEE J. Biomed. Health Inform. 2020, 24, 131–143. [Google Scholar] [CrossRef] [PubMed]
- Shang, C.; Chang, C.; Chen, G.; Zhao, S.; Chen, H. BIA: Behavior Identification Algorithm Using Unsupervised Learning Based on Sensor Data for Home Elderly. IEEE J. Biomed. Health Inform. 2020, 24, 1589–1600. [Google Scholar] [CrossRef]
- Budisteanu, E.A.; Mocanu, I.G. Combining Supervised and Unsupervised Learning Algorithms for Human Activity Recognition. Sensors 2021, 21, 6309. [Google Scholar] [CrossRef]
- Sanabria, A.R.; Zambonelli, F.; Ye, J. Unsupervised domain adaptation in activity recognition: A GAN-based approach. IEEE Access 2021, 22, 19421–19438. [Google Scholar] [CrossRef]
- Shang, C.; Chang, C.; Chen, G.; Zhao, S.; Chen, H. Learning setting-generalized activity models for smart spaces. IEEE Intell. Syst. 2010, 2010, 1. [Google Scholar]
Publisher’s Note: MDPI stays neutral with regard to jurisdictional claims in published maps and institutional affiliations. |
© 2022 by the authors. Licensee MDPI, Basel, Switzerland. This article is an open access article distributed under the terms and conditions of the Creative Commons Attribution (CC BY) license (https://creativecommons.org/licenses/by/4.0/).