1. Introduction
Scientific papers are based on previous research extension, confirmation, or refutation. By reviewing the existing literature, an insight into the current state of the art and potential new research areas that need additional research can be gained. A systematic literature review is a key part of scientific research because it summarizes available literature for a given hypothesis and confirms or refutes it based on the existing body of research.
Clarity and transparency are important when summarizing literature and existing results. To this end, several methods for performing literature reviews have been defined. One popular method is the PRISMA method (Preferred Reporting Items for Systematic reviews and Meta-Analyses) [
1], which defines 27 steps of the systematic literature review process in an effort to standardize and increase the transparency of scientific research based on literature review.
The problem with conducting a systematic literature review is that it requires a lot of resources. It is intensive in terms of time required, number of people required, or both, because it consists of manually finding, selecting, and processing a large number of manuscripts. Moreover, if too few people are tasked with the review, they can easily become tired, potentially leading to even more errors and, therefore, increased cost or degraded quality of the overall results.
To simplify the overall process of literature review, it is opportune to automate as much work as possible. Using natural language processing (NLP), it is possible to convert text into a format understandable to a computer that is not only statistics of letters or words but represents the meaning of the text itself. Methods of machine learning can be applied to such a format to solve common problems that usually require many examples.
If the literature review is split into several smaller processes, NLP can be useful for selecting papers relevant to the stated hypothesis. If paper selection is considered as a classification problem, machine learning methods could be used to filter out papers dealing with the topic of research. For this to be achieved, the papers need to be prepared using natural language processing methods.
The topic of this paper is an application that helps researchers in the overall process of literature review, from the initial research idea to the printing of the results. The system is designed as a web application that allows defining a topic, defining search terms, automatically searching several well-known sources of scientific papers, and manually loading papers. The papers are then filtered, labeled as relevant, automatically processed using natural language processing methods and machine learning models and, finally, the results are displayed.
Two literature datasets classified by hand were used to validate the system operation. Datasets were used to search for optimal parameters of a literature review model to obtain the desired results, to test the idea of a combined machine learning model, and to test the behavior of the application in a real use scenario. The parameters were compared by running training and testing on the machine learning models that were selected for the application. Furthermore, to determine the potential for generalized use of the model, the generated model was cross-tested with a dataset for which it was not trained.
In this paper, the authors argue that a system for conducting automatized or semi-automatized literature review represents an important tool, since literature review papers are a common and frequently used type of research publication. Furthermore, this type of research publication is used by non-research, governmental, and other bodies to scan the body of research on a topic depending on the current and emergent needs. Therefore, designing an efficient and (semi-)automatized system could represent a great asset for research teams by both increasing the speed of the review process and providing a tool for assessing the suitability of different queries as inputs into the review process.
The rest of this paper is organized as follows:
Section 2 briefly describes the literature review process and the improvements made by automation using natural language processing, while also presenting related works.
Section 3 describes a machine learning model and the parameters used for the automated literature review. This section also presents the results of applying the described models to training and testing examples. A web system developed based on the presented solution is described in
Section 4. In addition, the presented solution for the literature review and the results are discussed in
Section 5.
2. Results
The theoretical background chapter presents the theoretical underpinnings of the paper in order to introduce readers to the process of conducting the literature review in general and to the methods and tools used as part of the proposed enhancement of that process—natural language processing (NLP), and unbalanced datasets. The chapter also discusses the research in the context of related and similar works conducted by other authors
2.1. Literature Review
A systematic review of literature puts forward a hypothesis by researching the existing scientific literature on the subject and tries to confirm or refute the hypothesis [
2]. By conducting exhaustive research of the existing literature, detailed insights into the current state and potential shortcomings of a research area can be obtained, and it is possible to test a hypothesis, develop a new theory, and/or check the accuracy of existing studies [
3].
Scientific papers used in literature reviews are most often obtained by searching scientific publication sources using search engines based on keywords. Therefore, it is important to define the search query well to identify as many papers as possible related to the literature review’s hypothesis.
The number of papers found is often in the order of several thousand, so it is unrealistic to review them all manually, as this would require an extreme amount of time or many people. For this reason, the papers are initially deduplicated using a simple algorithm when multiple sources have been used. Then, an effort is made to reduce the number of fully reviewed papers from which the results are extracted. The selection of papers to be included in the final results is narrowed down in several steps. The well-known and frequently used PRISMA method describes the steps for conducting a literature review in detail. According to the PRISMA method, it is necessary to indicate and explain the screening protocol, list all of the criteria used to exclude the papers from the initial selection, give a reason for using each criterion, and indicate the sources from which the papers were obtained [
1].
The PRISMA method also states that it is necessary to specify all search parameters for at least one paper source to replicate the search results. It is also necessary to specify the process used to extract specific data from the reviewed papers and synthesize the results from the obtained data.
The PRISMA method also offers a template for graphical representation of the number of processed and excluded papers in different phases of the process. The graphical template is shown in
Figure 1.
2.2. Natural Language Processing
Language is a complex structure that people use to communicate. Although there are patterns and rules in language, it is impossible to strictly distinguish the correct language structures from the incorrect ones because people are constantly using language in new ways to communicate more efficiently or easily [
4]. In addition to speech, text is the most widespread way to use language. Text is a set of words consisting of characters. To a computer, characters have no meaning because no mathematical operations are defined on them. For that reason, text used in mathematical models requires vectorization, i.e., conversion into a vector of numbers that can be processed mathematically. To vectorize the text while retaining its meaning, natural language processing (NLP) methods are used. Machine learning is the programming of computers to optimize a measured criterion based on test data or previous experience [
5]. NLP methods rely heavily on statistics and often vectorize the text at the level of words or sets of words.
To convert text into numbers, it is first divided into smaller units. The process of dividing text into smaller units is called tokenization, and the result is a set of tokens. A token does not necessarily have to be a word; it can also be a sentence, a set of words (e.g., a noun with its associated adjectives), or even just a set of characters. Before statistical text processing, several methods are often applied to it that reduce the scope of words. One such method is the removal of frequently repeated words, which are necessary due to language structure but do not contribute to the meaning or theme of the set of words or sentences. These are so-called “stop words”, which can be easily removed from the processed text to reduce its scope without changing the text’s topic and meaning. Another method often applied before statistical text processing is stemming. Despite the name, the conversion result for each word does not necessarily have to be its stem, but it is important that the words that have the same stem are converted into the same word [
6]. This way, instead of several words with the same stem, one word is extracted that is repeated several times, which is important for statistical methods. Some of the most frequently used statistical methods of natural language processing include the following:
Bag of words: a simple method that creates a vector from the entire dictionary and determines the number of times each word appears in the text;
N-gram: a method that combines N words into wholes (bigrams and trigrams are often used);
Bag of N-grams: the same approach as the bag of words method but, instead of using words, a vector with all possible N-grams is used;
TF-IDF: a method that determines how often each word appears in one document (TF component—so-called “term frequency”) and how rarely it occurs in all documents (IDF component—inverse document frequency)
If the text is vectorized, machine learning methods can be applied to solve problems. For example, determining whether a given text belongs to a topic or hypothesis is a binary classification problem [
7]. This problem can also be solved using regression, but the continuous input must be discretized into two classes [
8]. The choice of a machine learning model depends on the problem and the properties of the vectorized text.
Certain models have proven to be more effective than others for text analysis. Neural networks, k-nearest neighbors, decision trees, naïve Bayes, and support-vector machine (SVM) are most commonly used today [
9].
2.3. Unbalanced Datasets
In any literature review, many reviewed papers are rejected based on predefined criteria, which means that when training a machine learning model, we must consider that there are significantly more examples of the class indicating that the result does not belong to the searched topic, i.e., negative examples. Examples of the class that indicates a match with the topic of the literature review—i.e., positive examples—are significantly less common.
In certain machine learning models, an unbalanced input dataset significantly impacts the model itself, i.e., the results are biased by an excessive number of examples of one class. An example of such a model is the naïve Bayesian model commonly used in text processing [
10]. Even models that can handle minor imbalances have problems when the number of examples of different classes differs significantly. Therefore, inputs must be prepared before training the model by considering that the same or similar preparations need to be made for the search results used in the application. There are several methods to solve this problem, and the most frequently used methods are subsampling the majority class and oversampling the minority [
11,
12]. Although class imbalance is expected in the final model because many papers will be rejected, the model is trained on a small number of samples marked by users of the application. Here, an approximate class balance can be requested from the user side.
2.4. Existing Systems
There are software solutions on the market that automate part of the literature review process. However, they are often limited to only a specific part of the process. In addition, their source code is not publicly available, and their use is charged. An example of such a software solution is Synthesis by Synthesis Research Inc. (Calgary, Canada,
https://synthesis.info/index.html, accessed on 9 December 2022.). This program automates the searching of certain databases of scientific papers (e.g., PubMed, IEEE, arXiv.org), the import of references, and the construction of a library of papers. However, it is more like an aid because the program itself performs no part of the literature review, as it only facilitates the overall process for the user with the help of a graphical interface.
Another example is DistillerSR by Evidence Partners (Ottawa, Canada,
https://www.evidencepartners.com/products/distillersr-systematic-review-software, accessed on 9 December 2022.). DistillerSR offers similar functionality to Synthesis, with the addition of automatic generation of a standard report and extraction of figures from papers through text analysis with a machine learning model. However, information about the machine learning model and the text processing method is not publicly available—it is only mentioned that it exists. Sorting of papers by relevance for the literature review is also offered, but there is also no publicly available information on how the sorting is performed.
2.5. Related Work
There are quite a few studies in this area, but few address the automation of the entire literature review process from start to finish. Ref. [
13] provided a literature review using natural language processing methods and text classification methods. Although the review was useful and the methods described were used in automating the literature review, automation was not the topic of the paper. Ref. [
14] investigated whether automation of literature review is possible and whether reasonably good results can be achieved with it. No general model was proposed, but the results of a manual literature review were used to train the model, on which they were then validated. The authors concluded that automation is possible and leads to relatively good results, but the literature review process was not automated. Ref. [
15] provided an overview of the current state of the art in automating literature review. The authors stated that no tool with unlimited access has been found that allows full automation, and that the best results have been obtained with semi-automated experiments where part of the work was done by a human and part by a computer. They also stated that interest in automating literature reviews has increased greatly in recent years, and that the most frequently used machine learning models for this purpose are support-vector machines (SVMs), neural networks, and naïve Bayes, which address the automation problem by automatically structuring and sorting papers. They developed a system that searches EbscoHost and ScienceDirect sources, downloads the papers, vectorizes them, extracts keywords, and groups them hierarchically based on those keywords. The results are displayed visually to show the topics of the literature groups. In this case, creating a literature review is still a manual process, but finding the initial set of papers is easier because the system organizes them. Ref. [
16] followed this idea by creating a system framework for structuring and analyzing the literature rather than a tool that can be used to conduct a literature review. The system provides the useful feature of displaying statistics on a research topic, making the overall decision-making easier, but the system does not help with decision-making, i.e., which papers belong to the literature review and which do not. Ref. [
17] addressed the automatic retrieval of papers, their parsing, and natural language processing, but only at the level of metadata and keywords. The authors’ main focus was on a single literature review on cloud manufacturing, with no generalization attempted and results in the form of statistics of the review. Ref. [
18] only addressed the conceptual elaboration of the necessary processes and systems that would enable automation of the literature review. The authors defined the term “assisted literature review” and specified the methods to perform it. Results were given only in the form of average accuracies of the model compared to manually conducting the literature review, and there were no details about the specific performance of the model, which was described at a high level. Ref. [
16] presented a framework for building models to classify papers in a literature review. In addition to dealing only with a narrow part of the literature review, the models were tested on a relatively small set of papers (500), while a much larger volume is expected in common literature reviews. In addition, the papers were compared only based on features of the cited literature and the titles. The abstract and the full text of the papers were not considered in this work.
3. Machine Learning Model for Automatized Literature Review
3.1. Input Data
Two datasets—Mental Health (MH) and Explainable Artificial Intelligence (EXAI)—were obtained from the results of manual literature reviews to train machine learning models, validate them, and search for optimal hyperparameters.
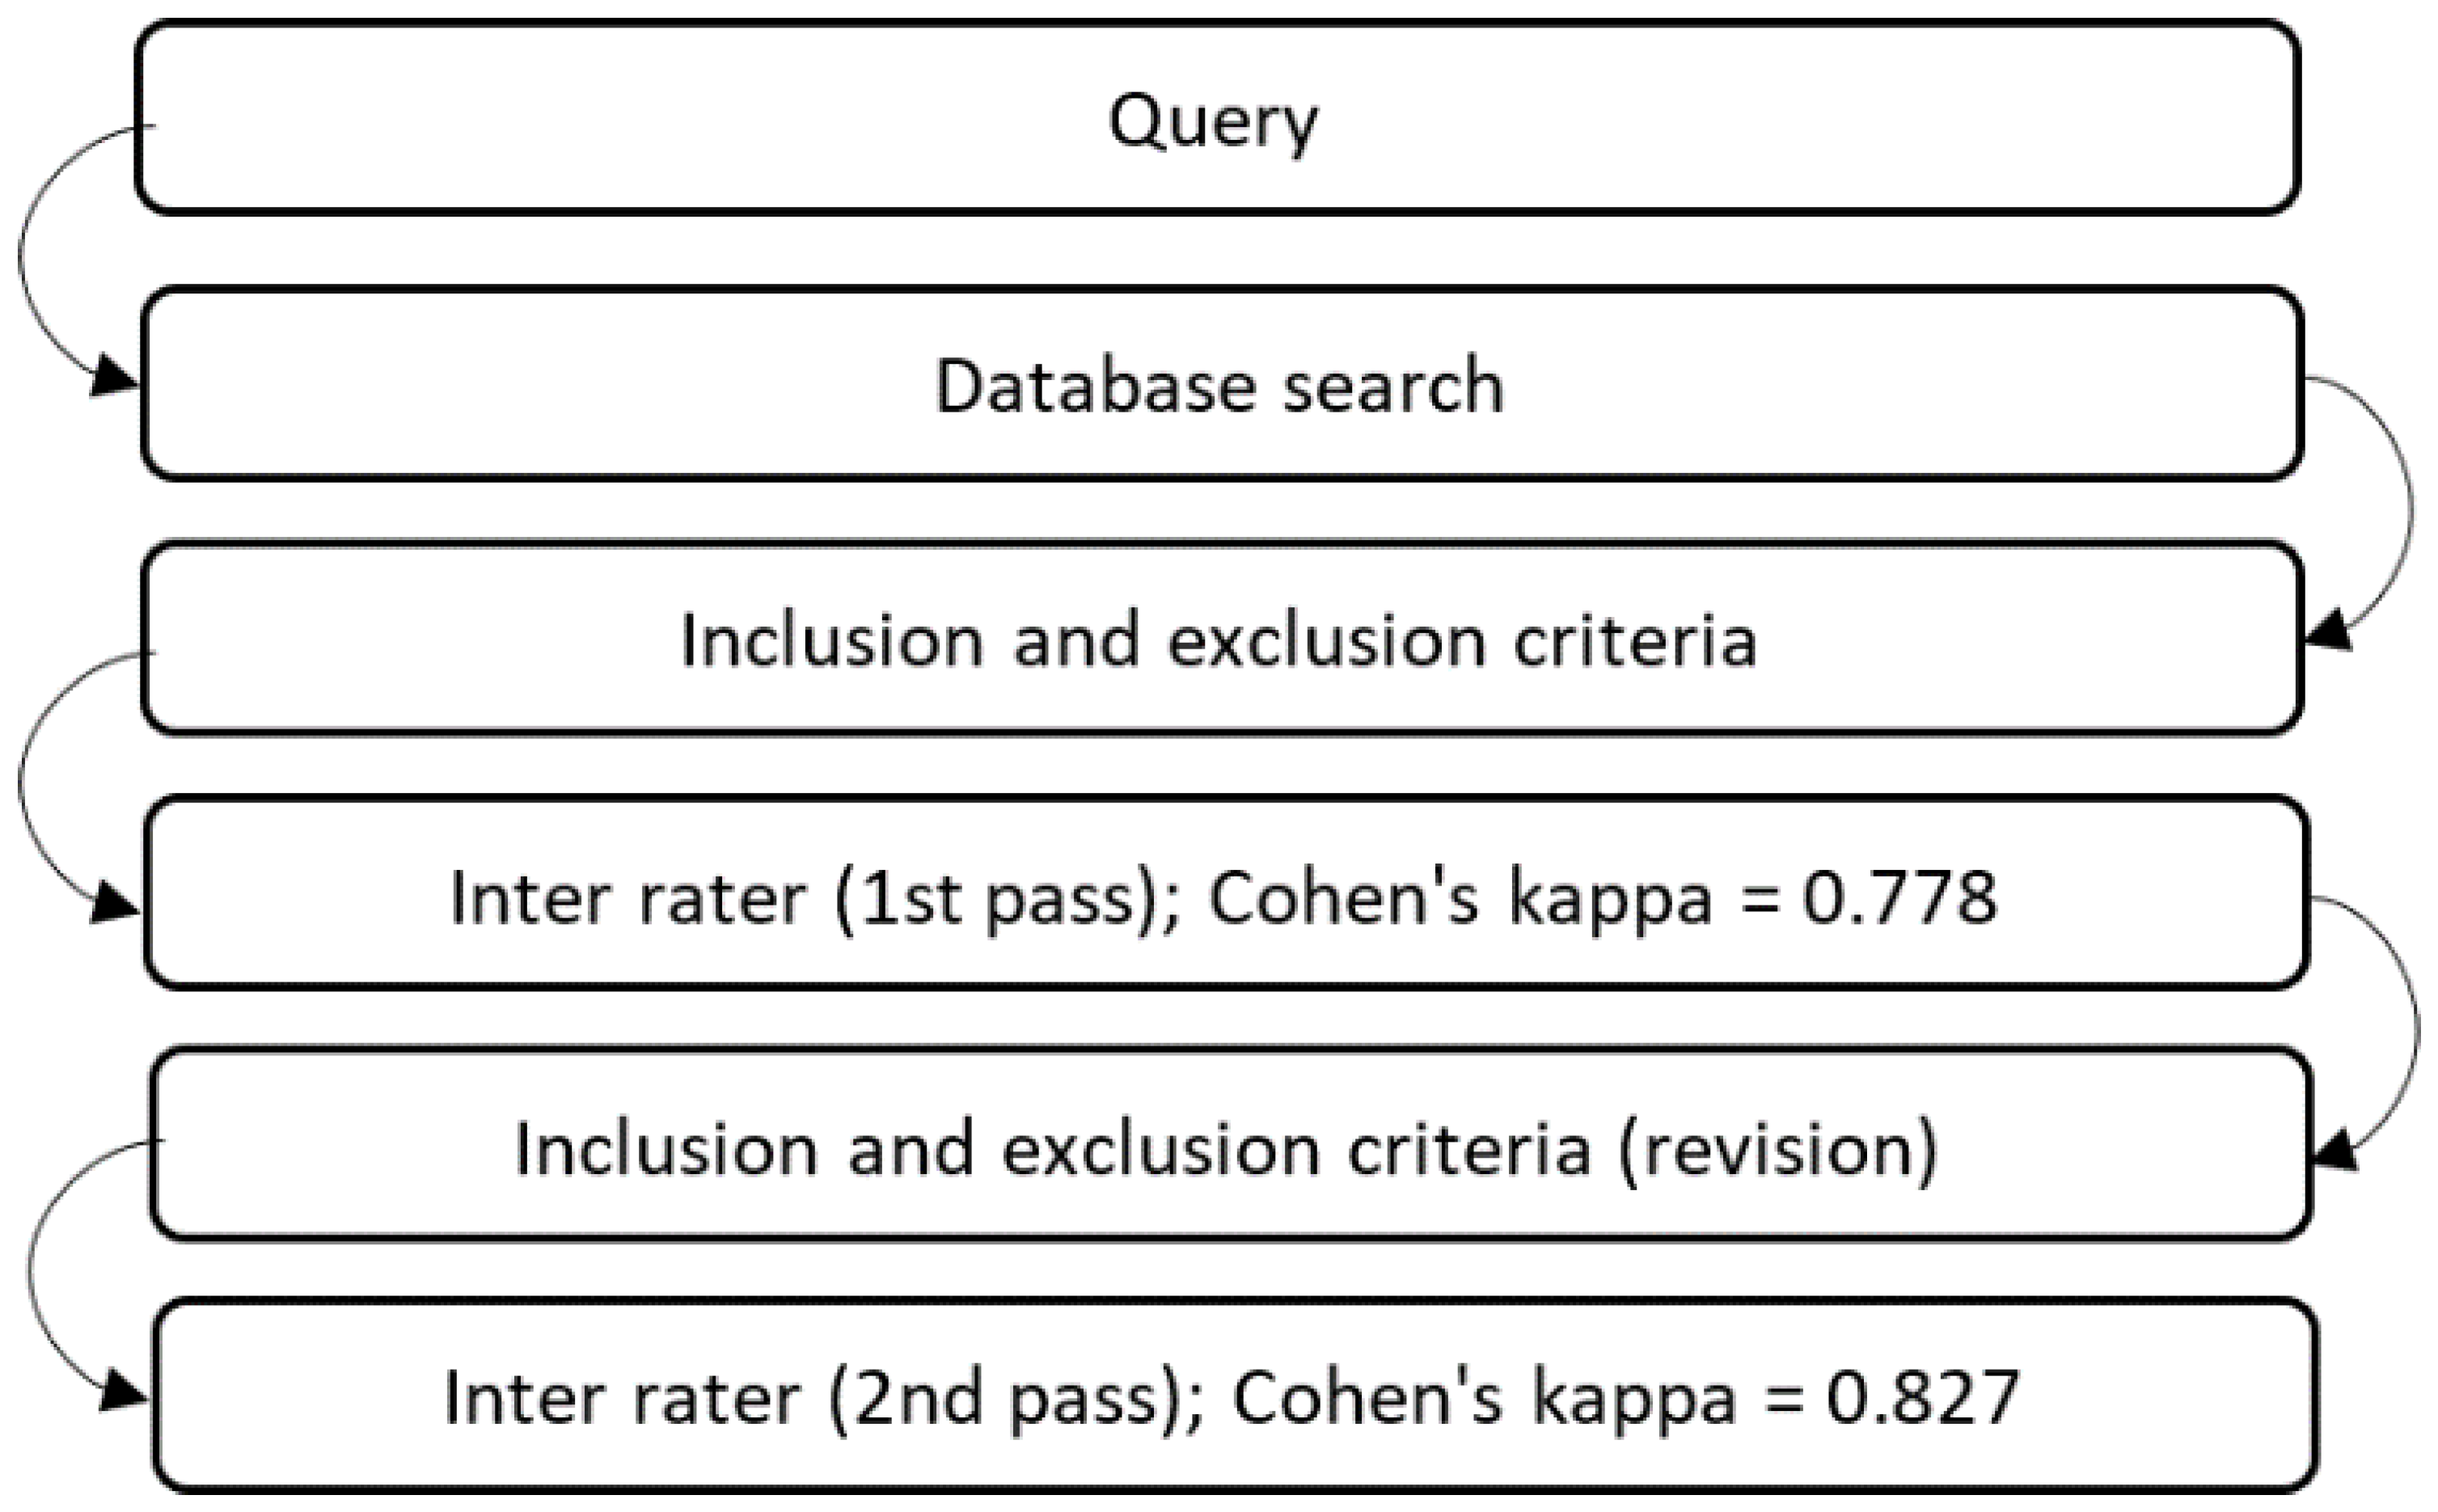
The aim of the MH literature review was to provide an overview and sense of the range of technologies used in the treatment of mental illness. The focus was on games and the impact they have on patients. Papers that do not focus on the treatment of mental illnesses with the help of modern technology or deal with stigmatization and critical mental illnesses were excluded. The Web of Science, Scopus, and PubMed sources were searched using a customized query (“mental health” OR “emotional” OR “psychology” OR “psychiatry” OR “psychiatric” OR “depression” OR “ocd” OR “ptsd” OR “anxiety” OR “mental” OR “disorder” OR “panic” OR “obsessive compulsive” OR “post-traumatic” OR “phobia” OR “phobias” OR “mental illness” OR “mental-illness”) AND(“application” OR “applications” OR “app” OR “apps” OR “mobile” OR “android” OR “ios” OR “internet” OR “web” OR “digital” OR “computer” OR “phone” OR “phones” OR “smartphone” OR “smartphones” OR “vr” OR “virtual reality” OR “ar” OR “augmented reality” OR “robot” OR “chatbot” OR “interactive” OR “interactivity”) AND (“game” OR “games” OR “gaming” OR “gamification” OR “gamifying” OR “video game” OR “video games” ) AND (“therapy” OR “treatment” OR “treating” OR “wellbeing” OR “wellbeing” OR “exposure therapy” OR “cbt” OR “cognitive behavioral therapy” OR “cognitive behavioural therapy” OR “intervention” OR “interventions” OR “assistance” OR “assisted” OR “nursing” OR “support” OR “coping” OR “care” OR “self-care” OR “managing” OR “self-help” OR “rehabilitation” OR “self-guided” OR “recovery” OR “psychotherapy” OR “therapeutic”) NOT (“diagnostic” OR “botanical” OR “classification” OR “medicinal” OR “derived” OR “ethnobotanical” OR “muscular” OR “neuromuscular” OR “motor” OR “drug” OR “addiction” OR “predicting”). The query returned a total of 11,067 papers (Web of Science: 1483, Scopus: 5569, PubMed: 4015). Only papers between 2010 and 2022 were selected and then filtered by titles and abstracts. The first 100 results from each source were used to calculate inter-rater agreement—a common part of many literature reviews that includes multiple raters reaching agreement when classifying the papers, thereby clearing any existing methodological issues. Consistency was measured using Cohen’s kappa coefficient [
19]. Two independent reviewers classified each paper as relevant or not relevant based on inclusion and exclusion criteria. After the first round of the rating process, the Kappa coefficient already showed high agreement, but the criteria were discussed and improved, thereby achieving a higher agreement. The process is shown in
Figure 2.
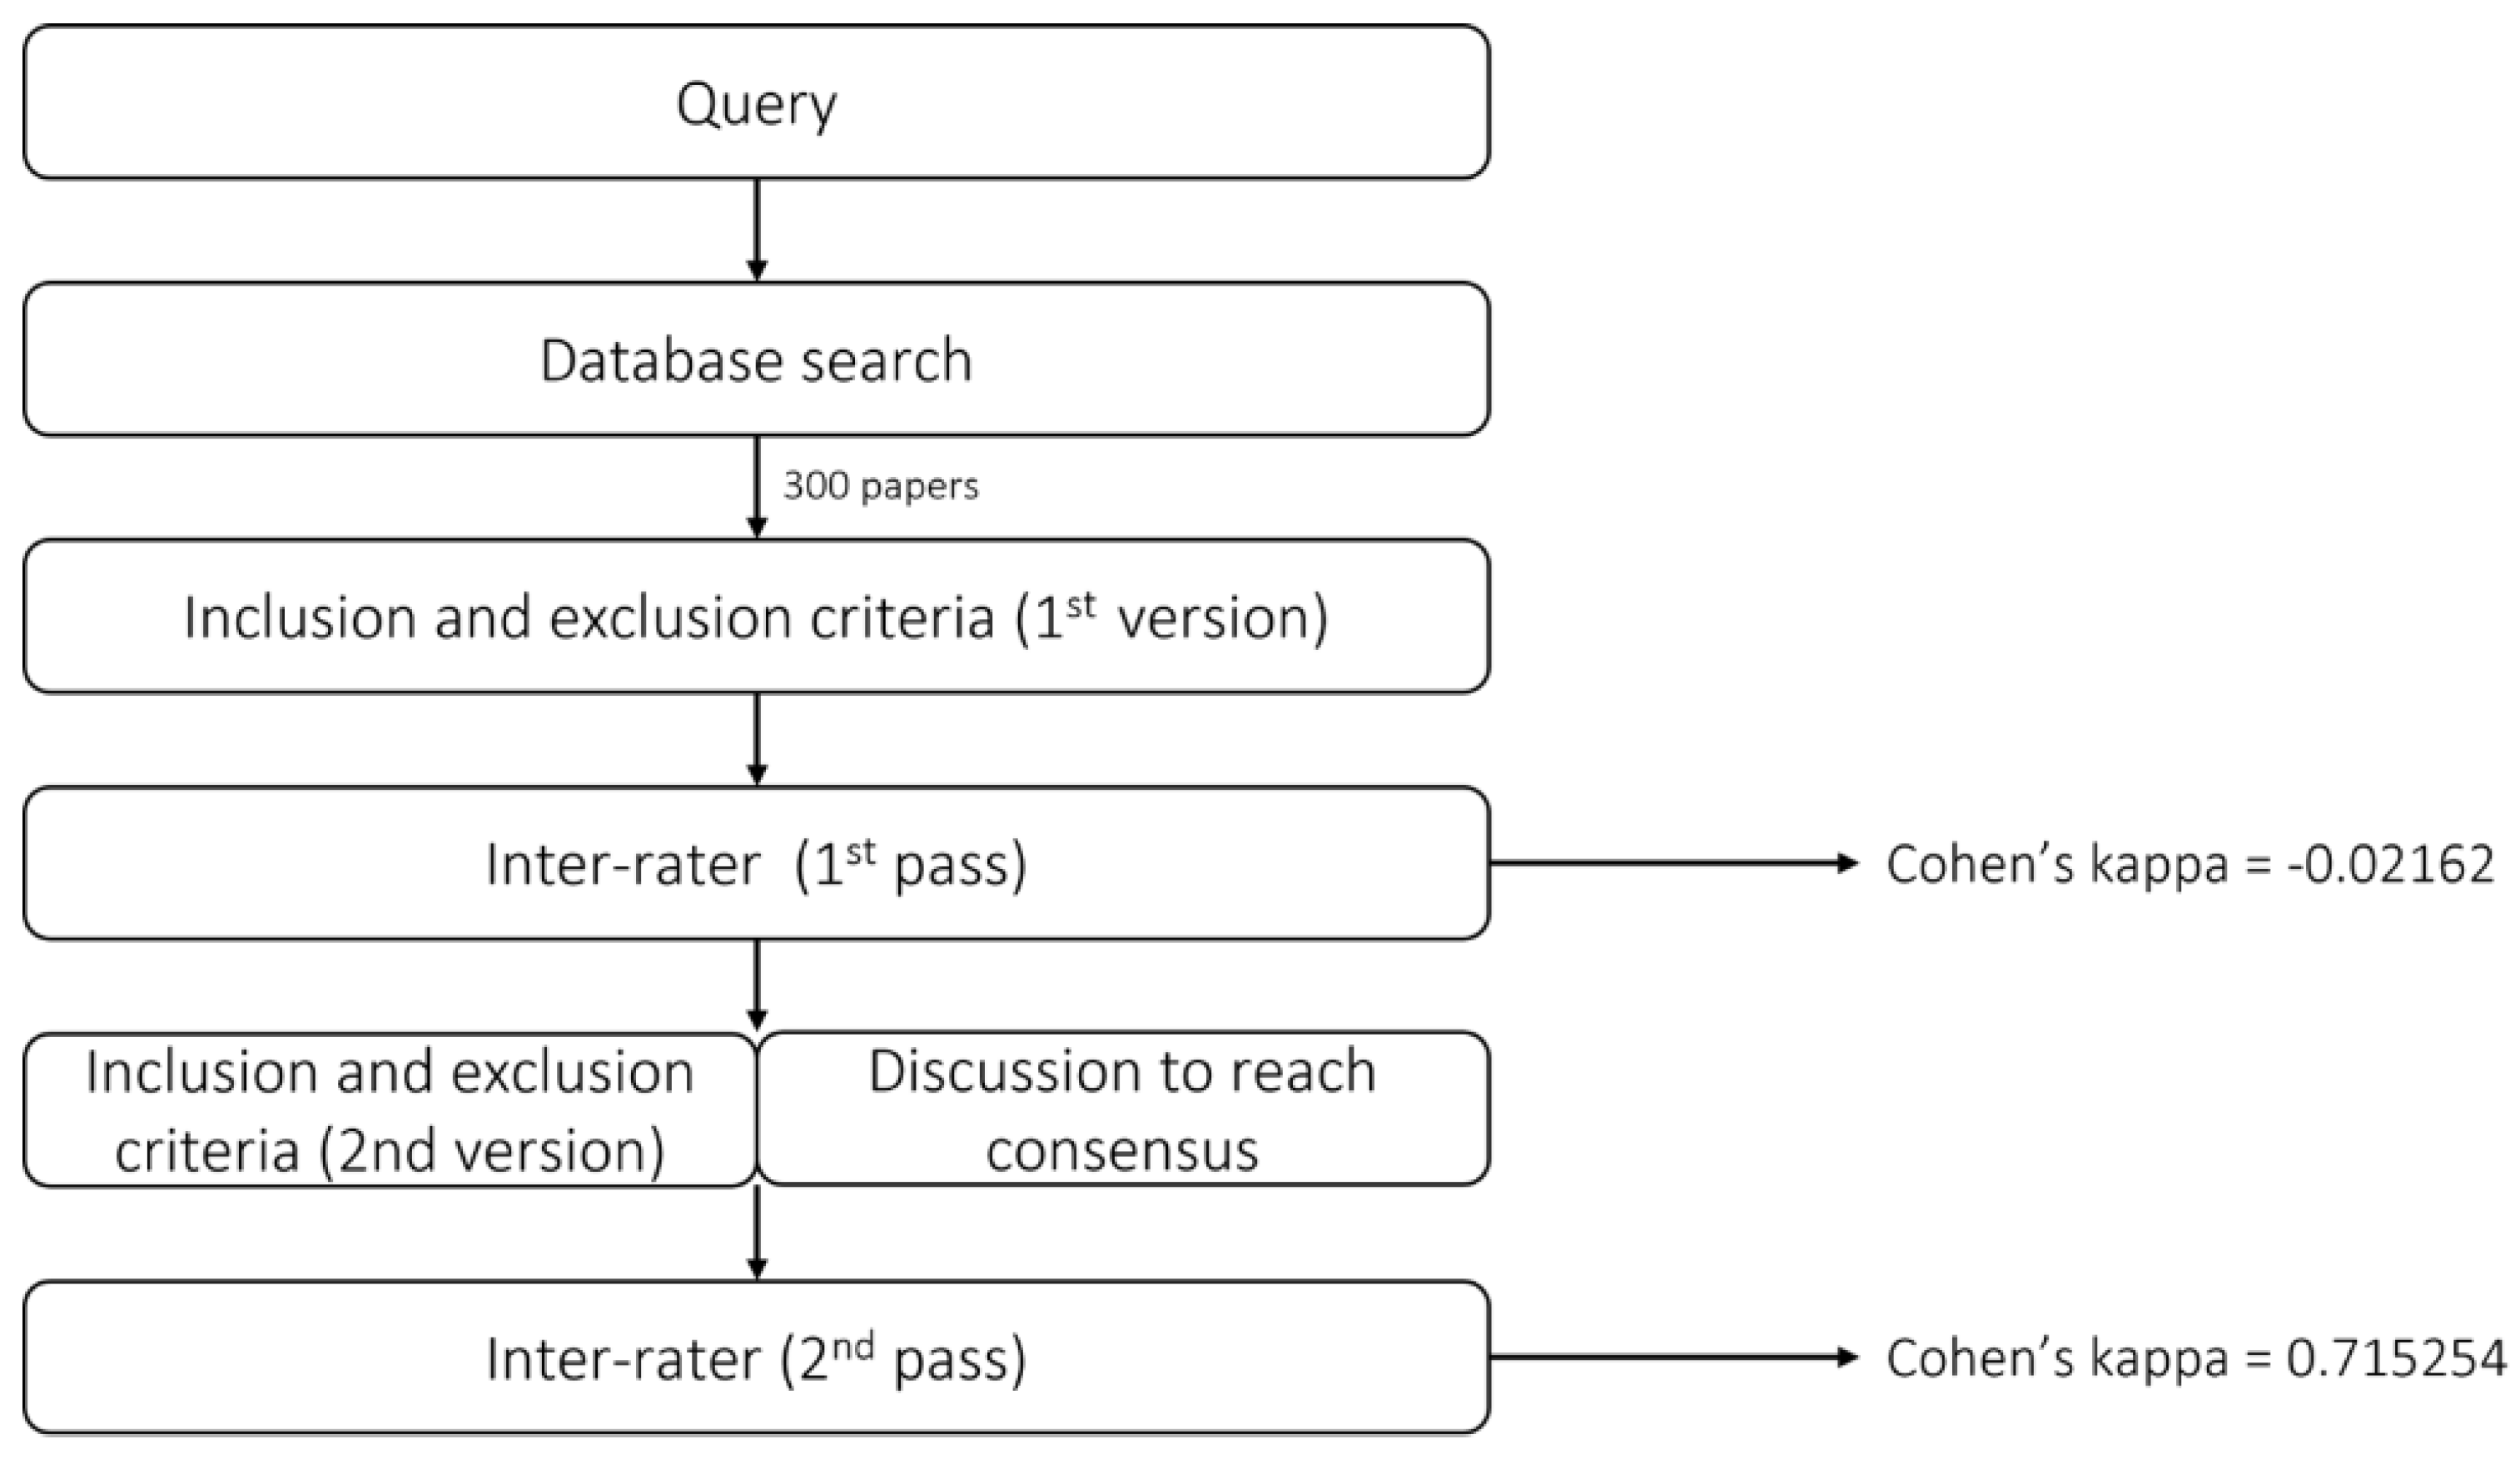
Given that explainable artificial intelligence is a relatively new term in applicable machine and deep learning methods, the goal of the second literature review examined in this study was to gain insight into the state of explainable artificial intelligence, i.e., to see whether explainable artificial intelligence models are used, and to what extent. Only the papers describing model validations on real users and in real scenarios were included. Specifically, for the areas of medicine and healthcare, it was requested that experts were involved in some way—either for model design or validation. Web of Science and Scopus were searched using a specifically designed query (2((XAI OR “explainable”) AND (“AI” OR “machine learning” OR “deep learning”))). A total of 1511 papers were obtained (Web of Science: 989, Scopus: 522). Papers were classified by two independent reviewers based on inclusion and exclusion criteria. To calculate agreement using Cohen’s kappa coefficient, the first 300 papers from the Web of Science database were used. After the first round of the paper selection process, the Kappa coefficient indicated that there was no agreement, so the criteria were changed and disagreements were discussed. The second round of paper selection resulted in good agreement. The diagram of the process is shown in
Figure 3.
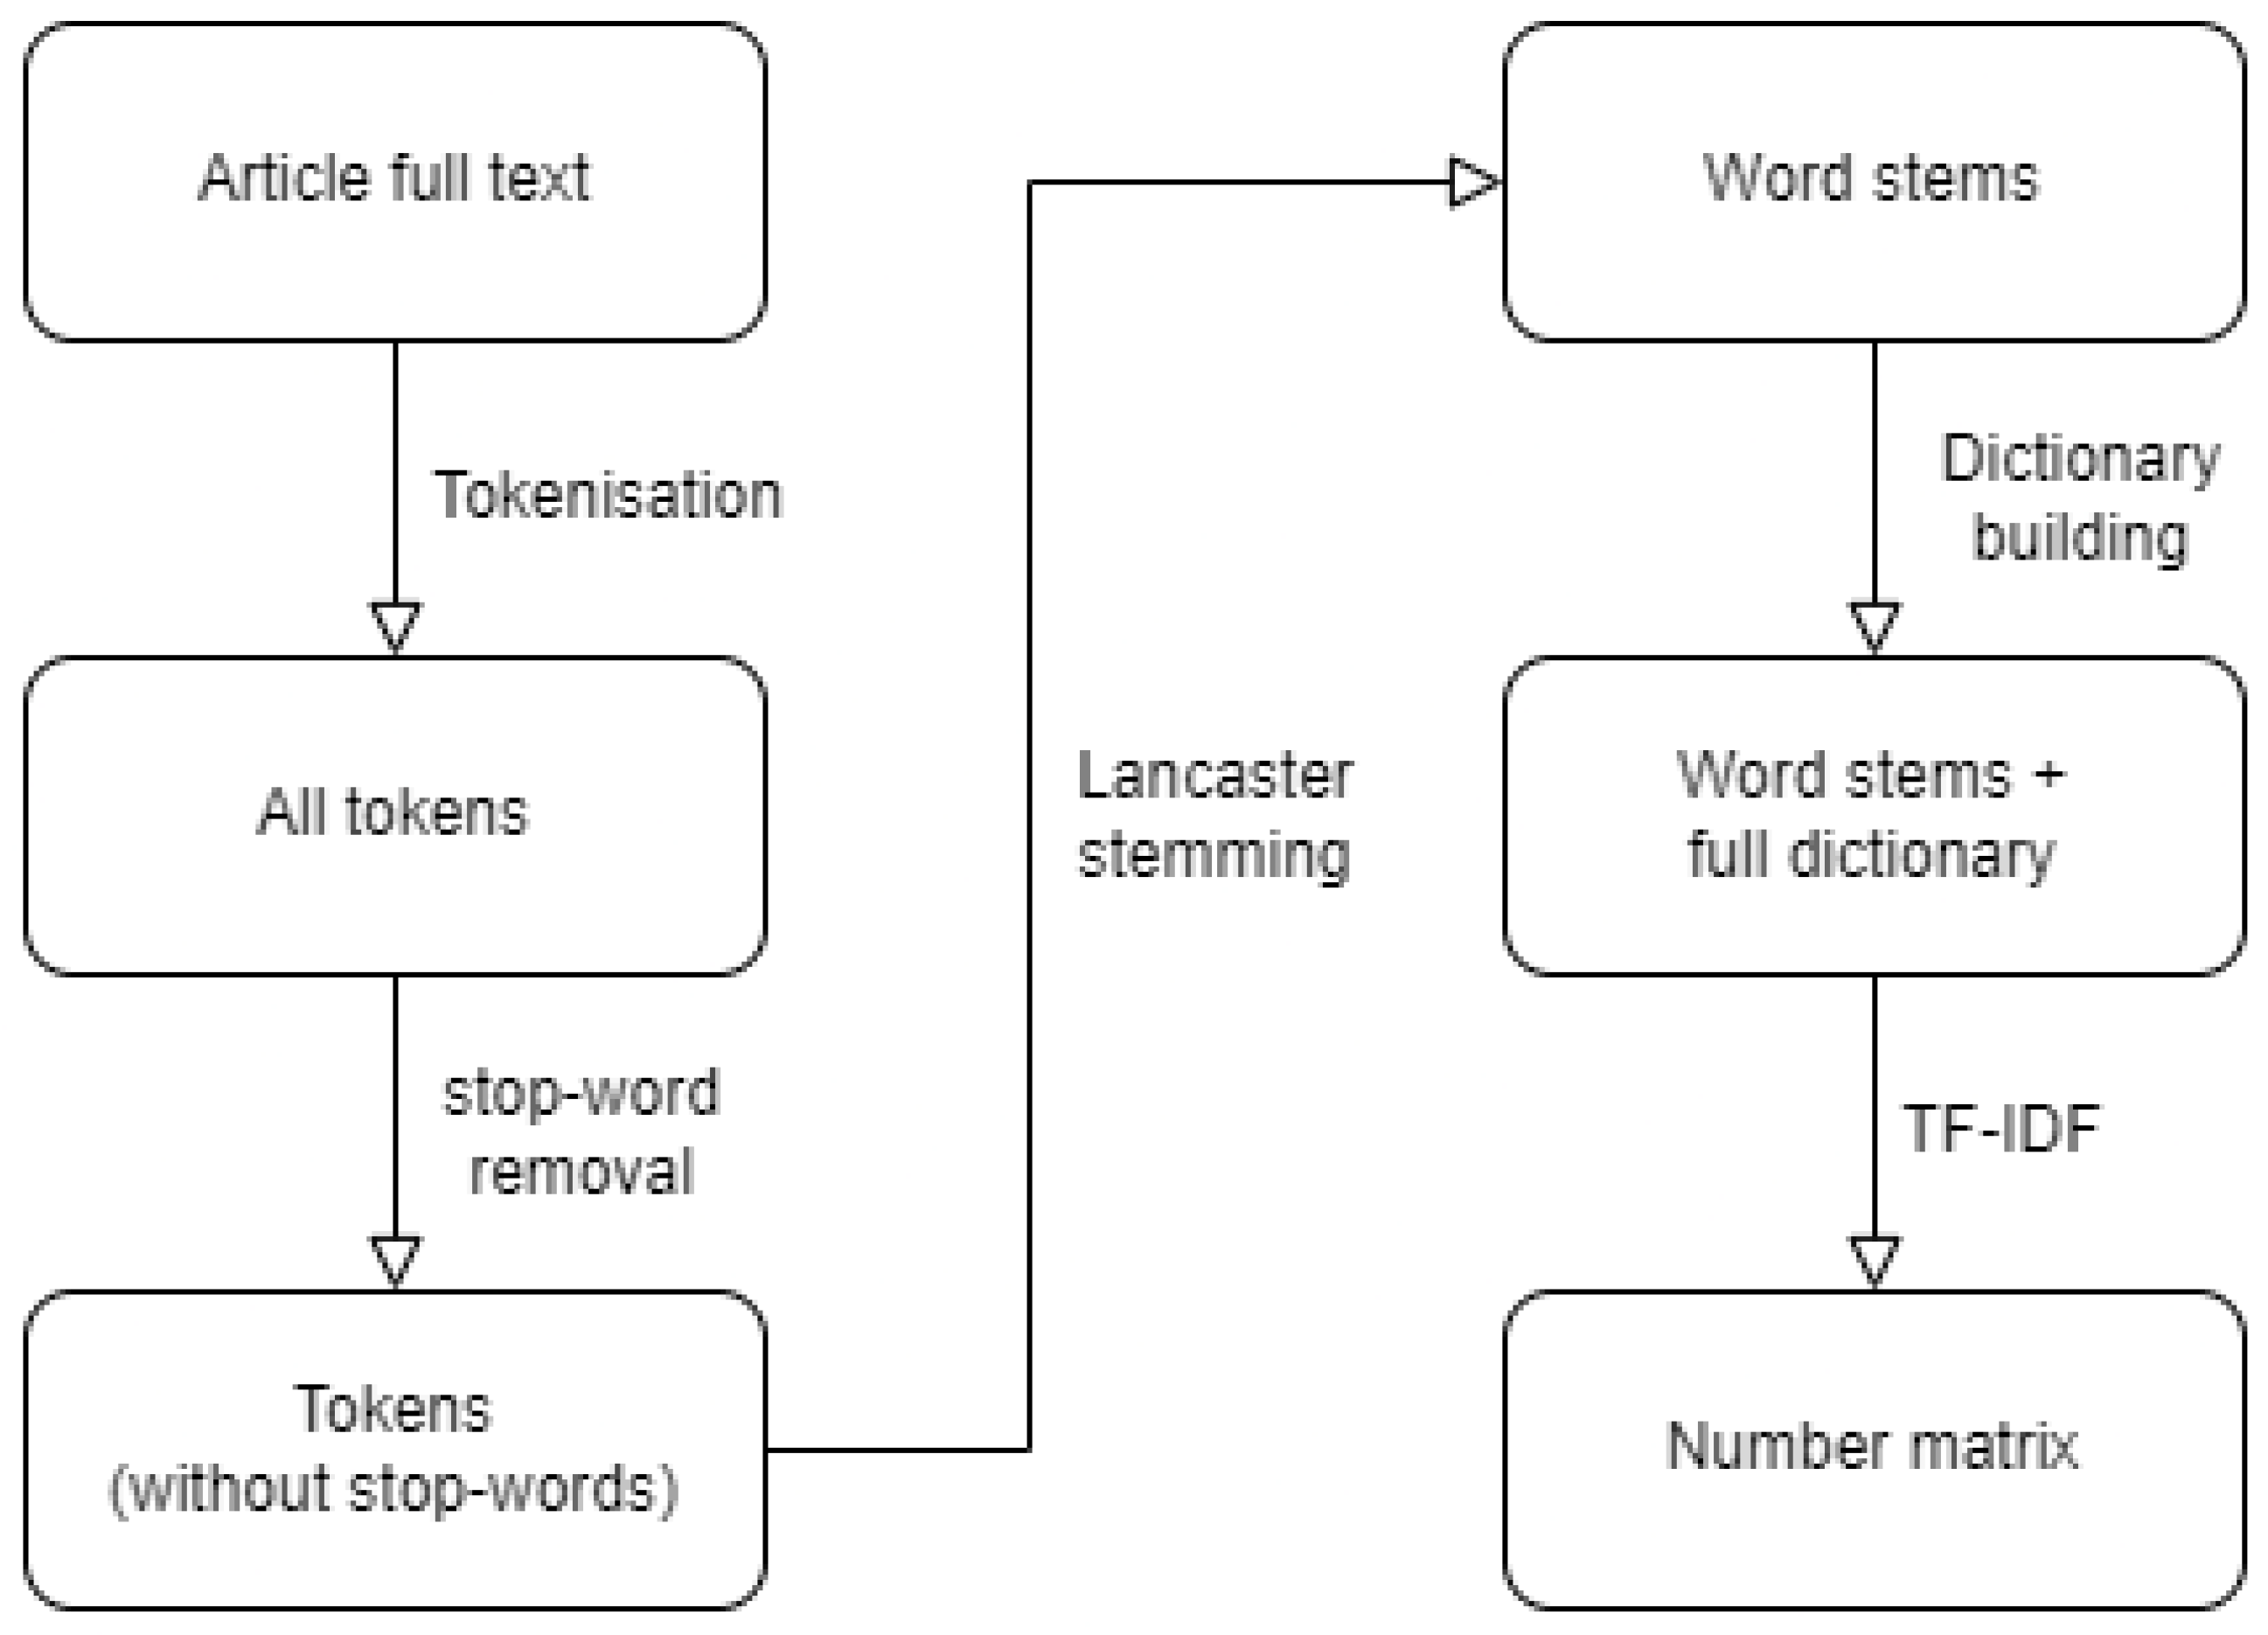
The two datasets were processed separately. First, for each dataset, all articles were tokenized (i.e., divided into words); then, stop words were removed, and all remaining words were reduced to their stems using the Lancaster algorithm [
6]; finally, a dictionary was built from all of the words of all articles. Then, based on that dictionary, a vector was built for each article containing the TF-IDF factor values for each word (each position of the vector corresponds to the same word in all examples). The data were then saved in the form of a matrix (where each row is one article, and each column is a specific word of the total dictionary) in a JSON file and further used in model training and validation. The same process was utilized in the application presented further in the study, namely, the npm libraries stopword for removing stop words and natural for tokenization, word stemming, and TF-IDF factor calculation (
Figure 4).
3.2. Dealing with Unbalanced Datasets
All positive examples and an equal number of negative examples obtained by subsampling were used for training in both datasets. In the process of subsampling of a representative subset of the data, negative examples were selected in such a way that they were sorted in a descending order according to the maximum features at any position, to choose as many top negative examples as there were positive ones. High numbers in the vector obtained by the TF-IDF algorithm represent words that appear frequently in that paper (i.e., high TF factor) and/or rarely in other papers (i.e., high IDF factor). The feature vector that has the highest factor represents the most significant word for that paper in relation to other papers. If two or more papers have the same feature as the highest, it is still lower than it would have been if there was only one paper, precisely because of the IDF component that reduces the total factor the more the word appears in other papers. This is why, by sorting the maximum features of the vector in descending order, representative examples are at the top, corresponding to papers with very pronounced characteristics that are not present in other papers. Papers that are represented by vectors with a low maximum feature are papers that are similar to many other papers because every feature is low, which means that each word appears a small number of times or occurs frequently in other papers.
3.3. Used Machine Learning Models
Linear models: Ridge, Logistic Regression (LogisticRegression), Bayesian Ridge (BayesianRidge), Perceptron, Stochastic Gradient Descent Regressor (SGDRegressor), Stochastic Gradient Descent Classifier (SGDClassifier)
Support-vector machine: Linear Support-Vector Regressor (LinearSVR), Linear Support-Vector Classifier (LinearSVC), Support-Vector Regressor (SVR), Support-Vector Classifier (SVC)
K-nearest neighbors: K-Nearest Neighbors Regressor (KNeighborsRegressor), K-Nearest Neighbors Classifier (KNeighborsClassifier)
Gaussian processes: Gaussian Process Regressor (GaussianProcessRegressor), Gaussian Process Classifier (GaussianProcessClassifier)
Naïve Bayes: Gaussian Naïve Bayes (GaussianNB), Multinomial Naïve Bayes (MultinomialNB), Complement Naïve Bayes (ComplementNB), Bernoulli Naïve Bayes (BernoulliNB)
Decision trees: Decision Tree Regressor (DecisionTreeRegressor), Decision Tree Classifier (DecisionTreeClassifier), Extra Tree Classifier (ExtraTreeClassifier), Extra Tree Regressor (ExtraTreeRegressor)
Neural networks: Multi-Layer Perceptron Classifier (MLPClassifier), Multi-Layer Perceptron Regressor (MLPRegressor)
The idea of introducing a combined machine learning model was based on work by [
20]. The assumption is that the combined model remains more resistant to the weaknesses of individual models, and that the models that correctly classify an example outvote those that do not. Models that do not perform well on some examples when other, more accurate models outvote them may also contribute to the correct classification of a particular example. Two combined models were created as part of this study: (1) a combined model in which all individual models have equal weights, and (2) a combined model in which individual models have different weights (
Table 1), set according to the model accuracy during hyperparameter optimization. The weight 0.0 (last row) represents models that do not affect the result, which are excluded from the combined model. Note that the weights are normalized before being used in the combined model, so they sum to 1.
The full results obtained during model training and testing are attached in
Appendix A.
3.3.1. Loss Function
Loss functions are generally used to compute the difference between the desired output and the model output [
21]. In this study, loss functions were used to model how well the model performed and whether it was able to correctly classify whether a research paper belonged to the final set of chosen review papers or not. When conducting a literature review, it is much more important to accurately classify positive examples and to avoid classifying papers that should be selected as negative. Therefore, in model validation, an adjusted loss function was used, which rewards a true positive example more compared to a true negative but also penalizes a false negative example more than a false positive.
The loss function is a function whose parameters are the correct label of the example and the label of the example obtained by the model, and the value is the error detected on that example. The most frequently used loss function in classification is zero-one loss. This function can be adjusted to give more control over the accuracy of the model for a particular class. This is necessary when correctly/incorrectly classified examples do not have the same importance in all classes.
The error matrix is a method used in classifier validation. The matrix has as many rows and columns as the set has classes. It specifies how many examples from one class are classified into a certain class by the model. In binary classification, there are only four (4) options: a true positive example (TP)—a positive example correctly classified as positive; a true negative example (TN)—a negative example correctly classified as negative; a false negative example (FN)—a positive example that is incorrectly classified as negative; and a false positive example (FP)—a negative example that is incorrectly classified as positive.
Tests were run with loss functions that reward/penalize class accuracy at ratios of 1:1, 1:2, 1:3, and 1:5. Specific penalty/reward values for each ratio are shown in
Table 2. Negative values represent penalization, while positive values represent reward. The assumption is that with a 1:1 ratio, the model works normally and has roughly the same chance of correctly classifying both negative and positive classes. At higher ratios, the model is expected to classify the positive class more accurately, with higher accuracy for higher ratios.
3.3.2. Hyperparameter Adjustment
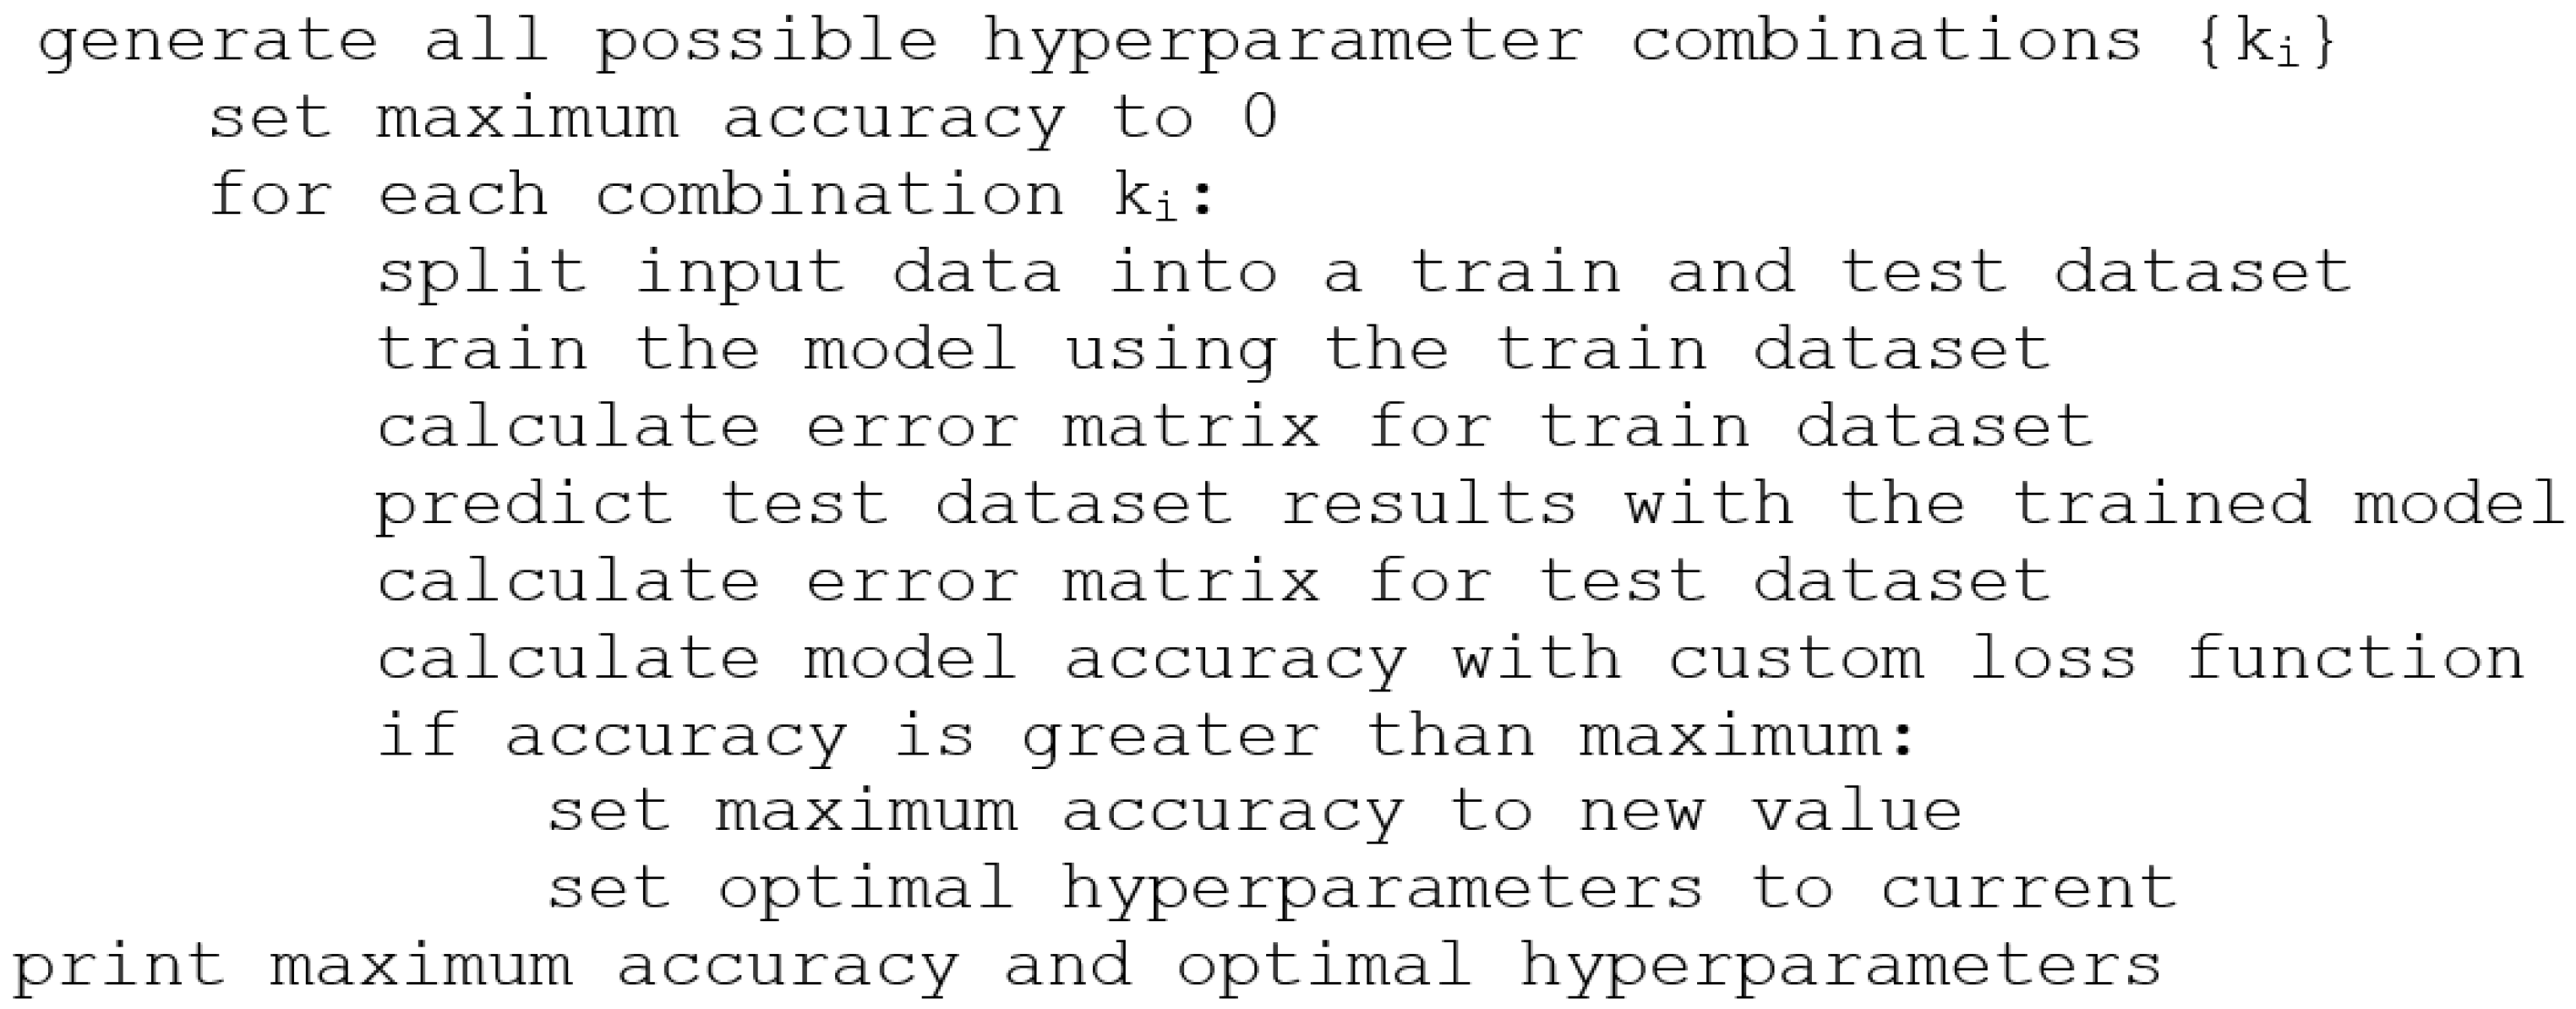
The parameters of a model that describe its complexity, or the functions used, are called hyperparameters. Hyperparameters are typically set before the learning process, before applying machine learning algorithms to the dataset. The choice of hyperparameters is important since it determines the accuracy/error of a machine learning model applied to a specific dataset. Therefore, in this study, the procedure of determining the choice of optimal hyperparameters was performed, which should lead to better accuracy/lowest error of the review paper choice (
Figure 5).
Several of the most important hyperparameters were checked for each model, and several options were defined for each of the hyperparameters. The hyperparameters were then searched with a complete search algorithm (grid search) in order to perform the full model hyperparameter search for optimal hyperparameters. For each hyperparameter, a discrete range of values was defined. Then, every possible combination of default values of hyperparameters of the model was generated. For each combination, the model was trained using the training data and then tested using the test data. The accuracy/error of the model for that combination of hyperparameter values was then calculated, recorded, and the process is repeated for all other possible combinations. The result was the optimal hyperparameter values—that is, the combination of values that gives the highest accuracy/lowest error.
Grid search is the slowest optimization method, but it gives the most accurate results. Since the input datasets in this study were relatively small, the total duration of the search for one dataset took only a few hours. All hyperparameters that could be set in the models of the scikit-learn package were examined. For discrete hyperparameters, all available values were tested (solver, loss function, etc.), and for continuous hyperparameters, several values were tested.
Table 3 shows all of the examined parameters and the ranges of values that were tested.
3.4. Setting up the Machine Learning Model
Using the optimal hyperparameters obtained from the full search, all models were run again with a larger number of training examples to check whether the performance of the model would improve significantly. When testing hyperparameters and different loss functions, the input data were divided into training data and test data at a 50:50% ratio. The obtained hyperparameters were then used to try the ratios 70:30% and 80:20% for training and testing, and the error matrices for these tests were printed. Different ratios were tested to see whether a small increase in the number of training examples would significantly affect the accuracy of the model. The assumption was that with a larger number of examples for training, the precision of the model would increase, but not significantly. Optimal results in terms of the accuracy of the model were achieved for a loss function with a 1:3 ratio and a 50%:50% ratio of the number of training and testing examples (
Table 4).
3.5. Results
Appendix A provides complete results for all loss functions tested and the ratios of the number of training and testing examples. The full results are presented as error matrices for the training and test examples, while the results in this section are summarized in the form of calculated averages for all models, considering only the test sets.
The complete results (
Table A1 and
Table A2) show that the classifiers give better results than the regressors in all cases, which was expected considering that a classification problem was investigated. It should also be noted that the Gaussian models perform extremely poorly in the test dataset, even for positive examples. The models of logistic regression, naïve Bayes, and support-vector machine proved to perform extremely well for the presented problem, which is largely consistent with standard text classification models.
The results of the tests with optimal hyperparameters are reported using the average values for sensitivity, specificity, and accuracy of all models. Sensitivity (Sn. (%)) is the proportion of correctly classified examples of the positive class, specificity (Sp. (%)) is the proportion of correctly classified examples of the negative class, and accuracy (Acc. (%)) is the total proportion of correctly classified examples.
Table 5 shows the average results for different loss functions. With the increase in reward/penalty in the loss function, the sensitivity of the model increases, i.e., positive examples are classified more accurately. Thereby, a decrease in model specificity is also observed, i.e., negative examples are classified less well. However, the overall accuracy of the model does not change significantly. This result is consistent with expectations because, as the reward for positive examples increases, negative examples become less important, so the model does not pay as much attention to them as to positive examples. Since it is more important for the literature review to have as many true positive and as few false negative examples as possible, while maintaining the accurate classification of negative examples, the 1:3 ratio was chosen as acceptable due to its high sensitivity and sufficiently good specificity.
The model’s accuracy improved with a higher ratio of training examples (
Table 6). This was also consistent with expectations, but the increase was small and did not significantly improve the model.
The results of the combined model are shown in
Table 7. The combined model proved to be better than each individual model, but it still did not work entirely correctly. The second combined model (with manually adjusted weights) was slightly better at classifying positive examples but much worse at classifying negative examples. Choosing different weights reduced the accuracy of the overall model.
To test the power of generalization, the model trained on MH data was tested on EXAI data and, conversely, the model trained on EXAI data was tested on MH data.
Table 8 shows the results for the combined model for such cross-testing, where the results follow the notion of the original combined model, with the total accuracy being superior for the model with equal weights. For the combined model with cross-testing, the sensitivity decreased slightly while the specificity remained very high.
4. Litre Assistant: A Web-Based System for Automated Literature Review Based on Machine Learning
4.1. Setting up Parameters and Abstract Screening
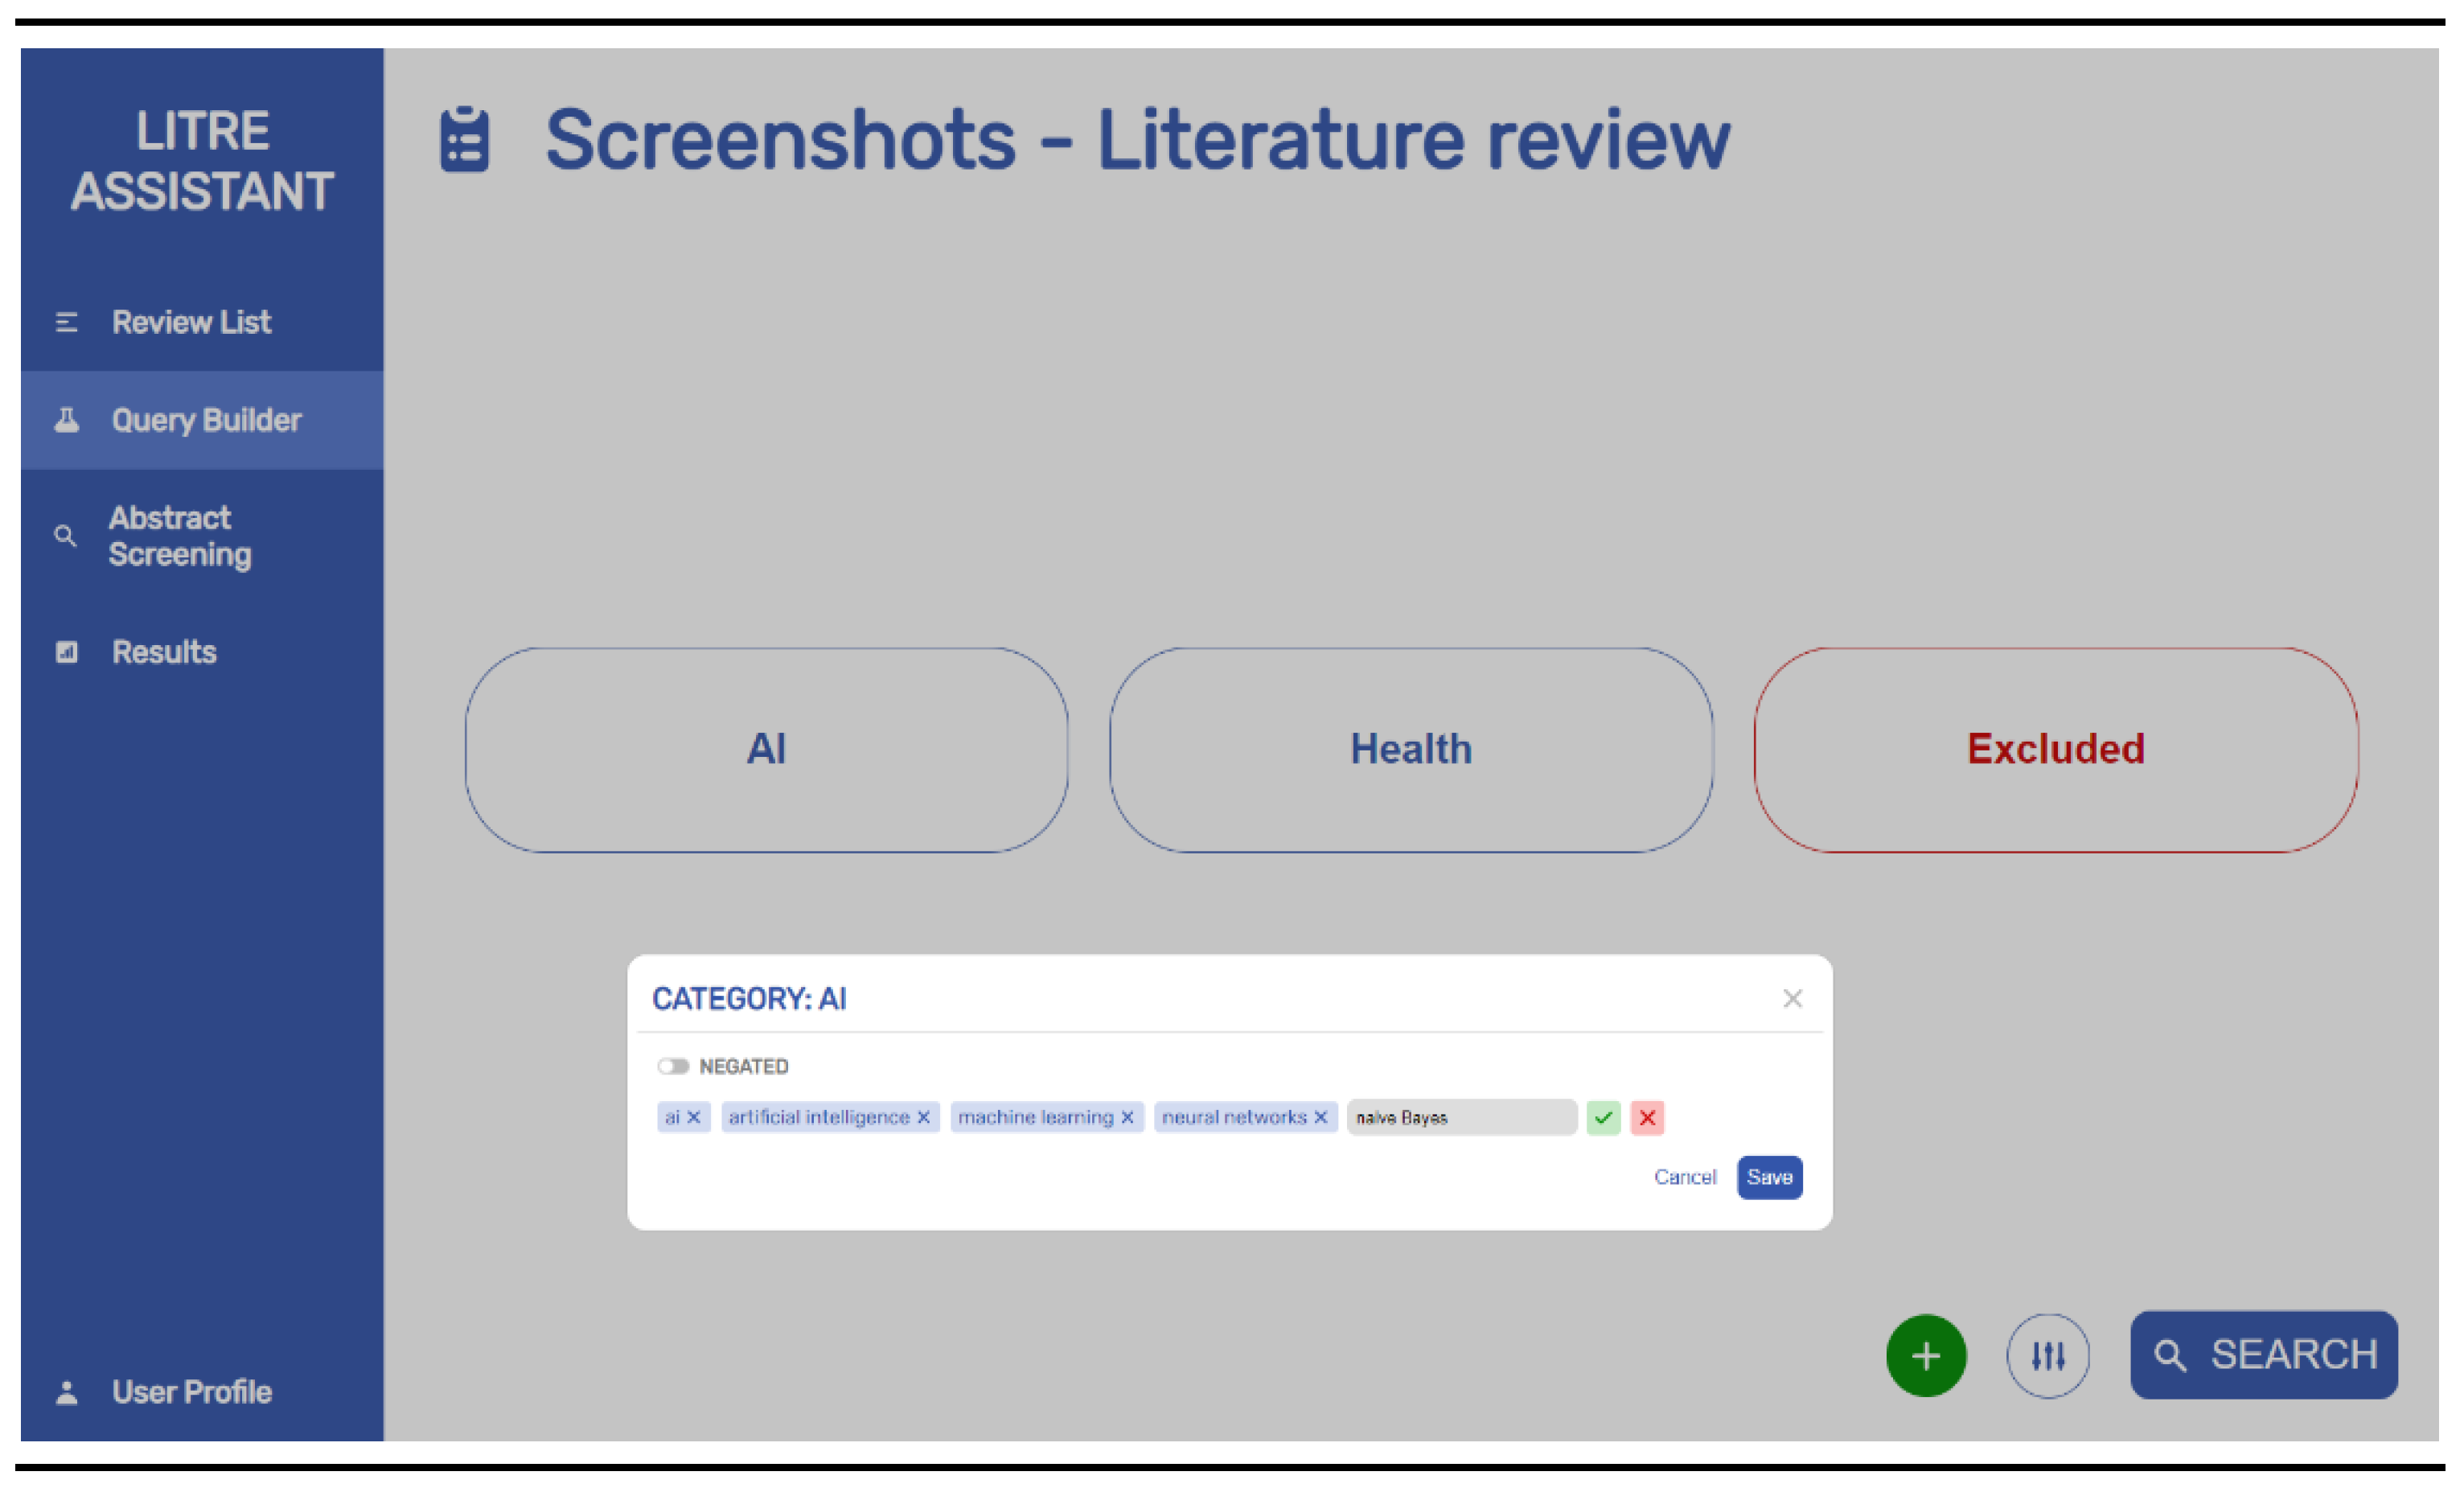
A web system name Litre Assistant was developed for engaging in the steps of a new literature review (
Figure 6). The interface for building queries allows for visually adding new query categories and subcategories.
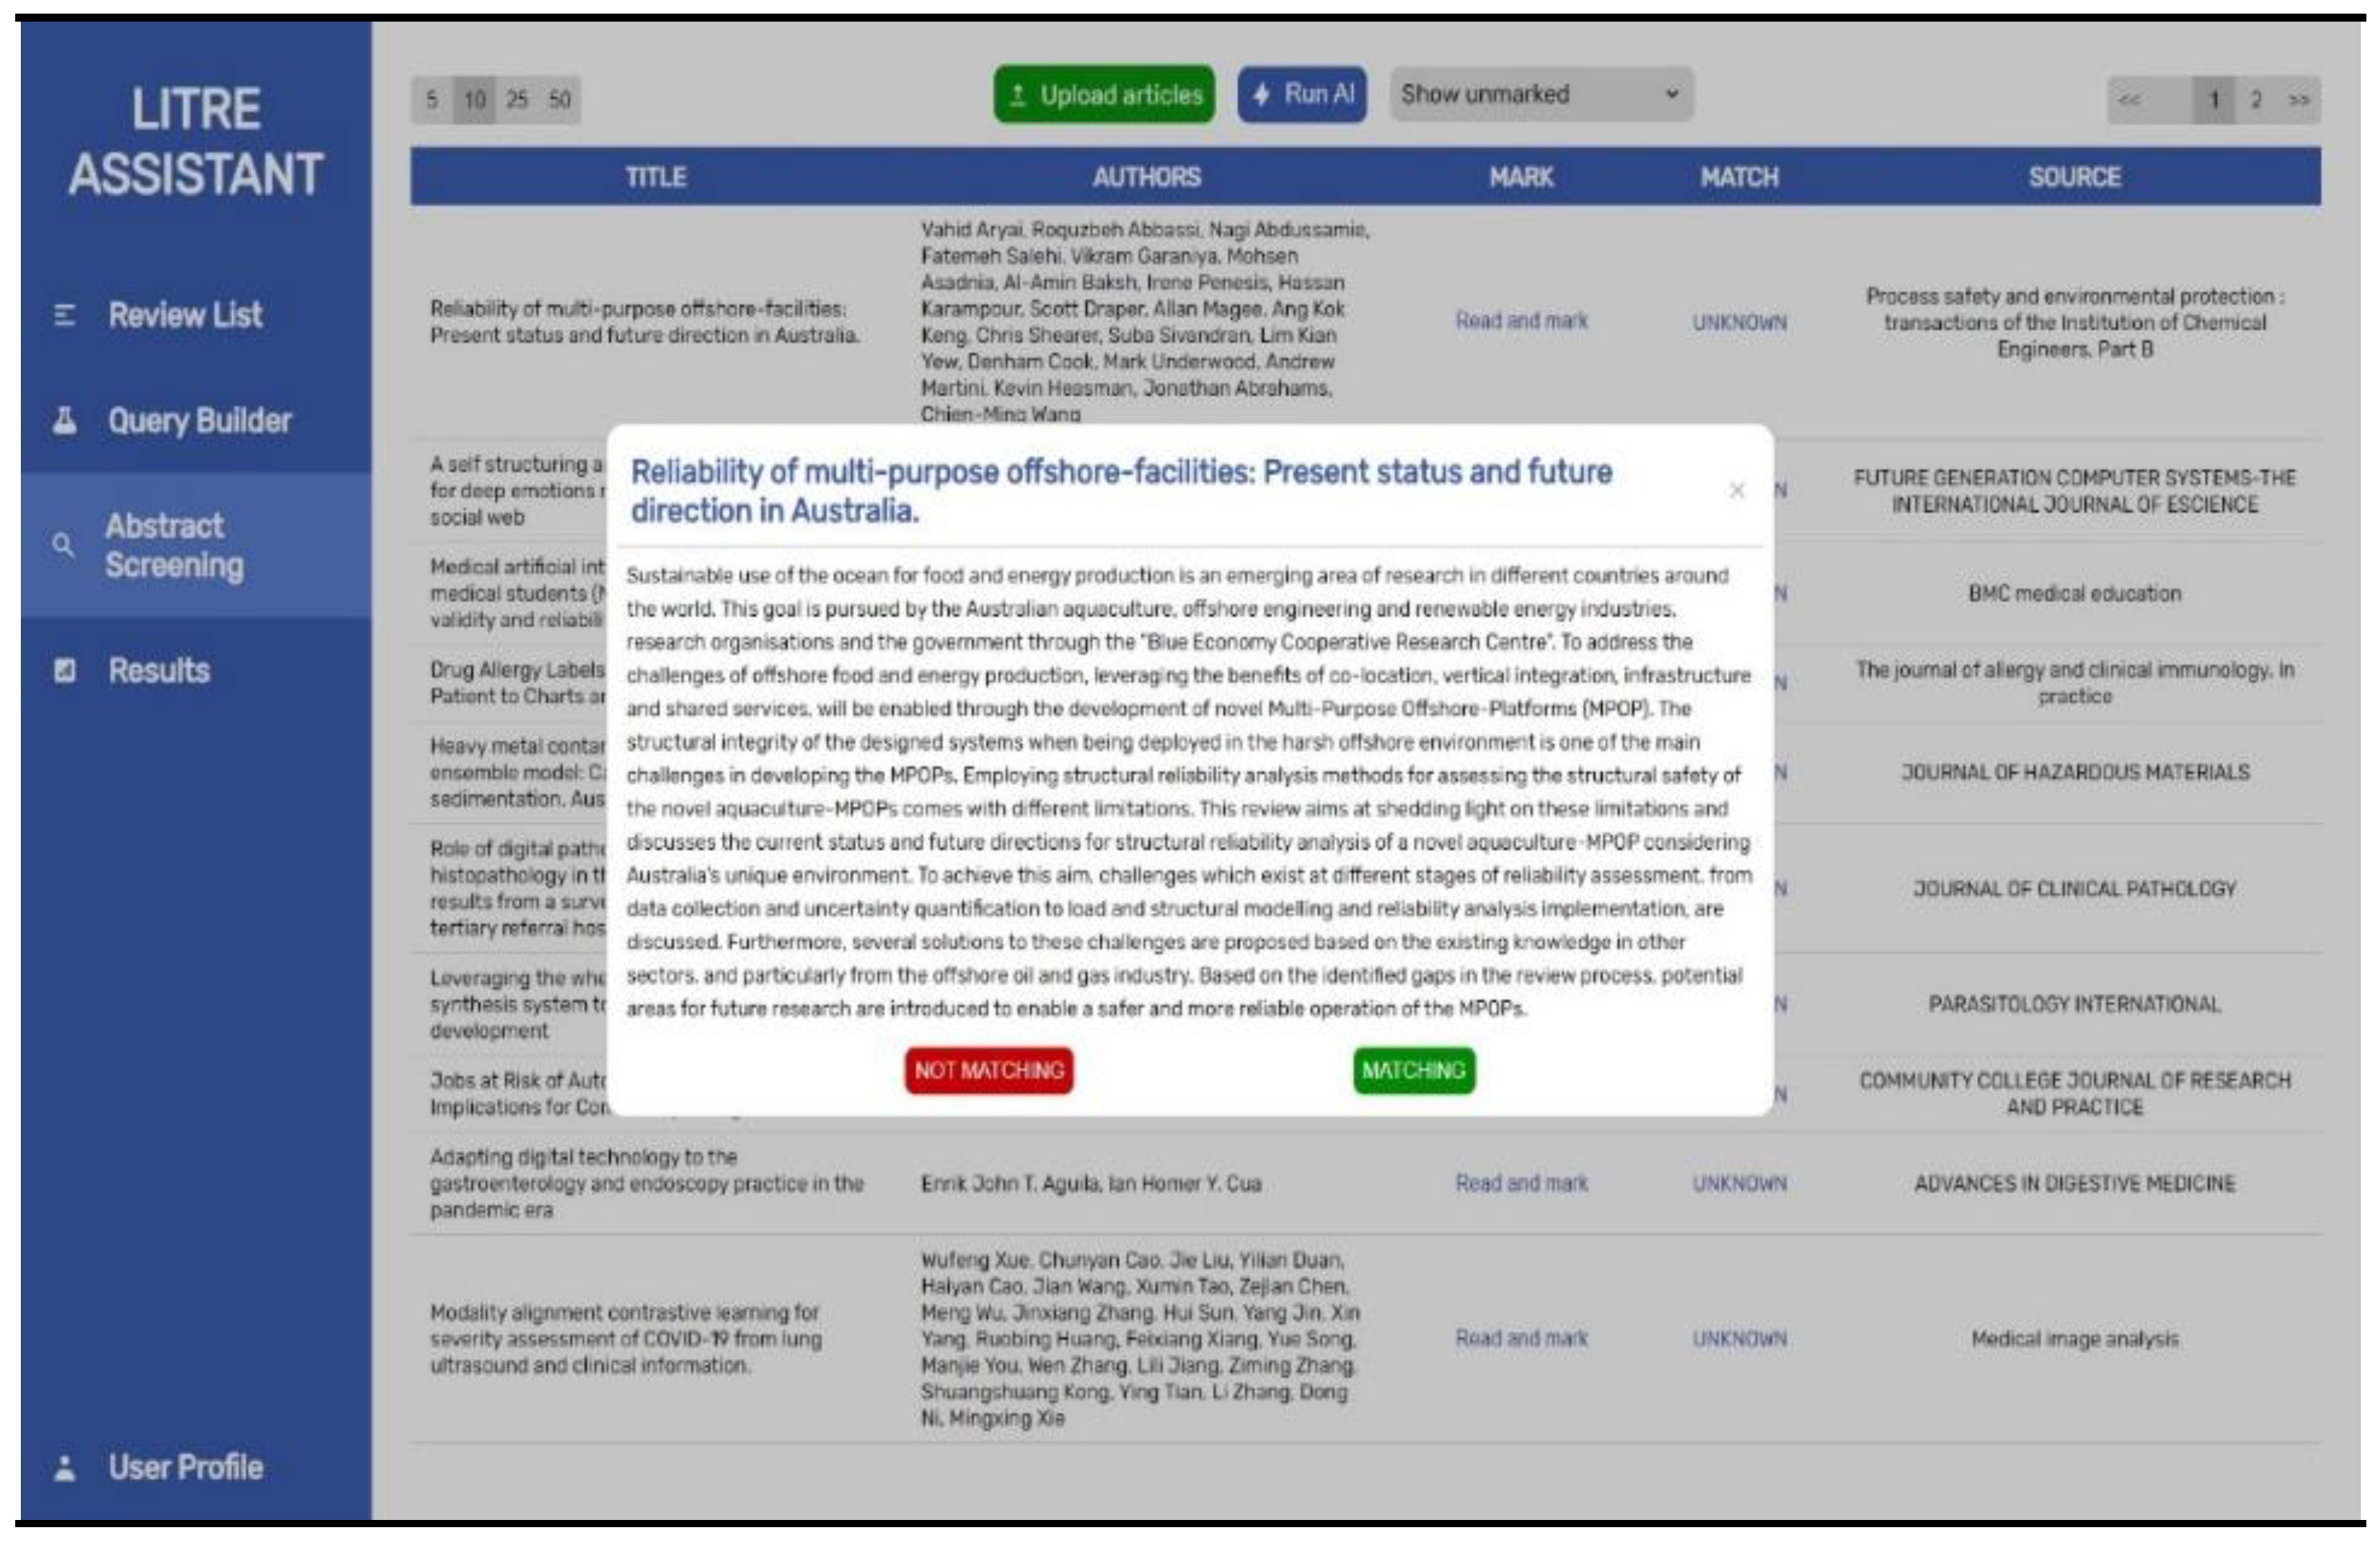
After building a query, the papers are sourced from the specified databases or can be uploaded manually as a textual file with saved papers if users prefer to conduct their search externally. Users can choose between displaying unmarked papers, already manually marked papers, papers marked by the application, or all available papers. Each paper can be examined in detail and marked as negative or positive. The Run AI button is used to start the automatic processing of papers (
Figure 7).
4.2. Selecting Papers
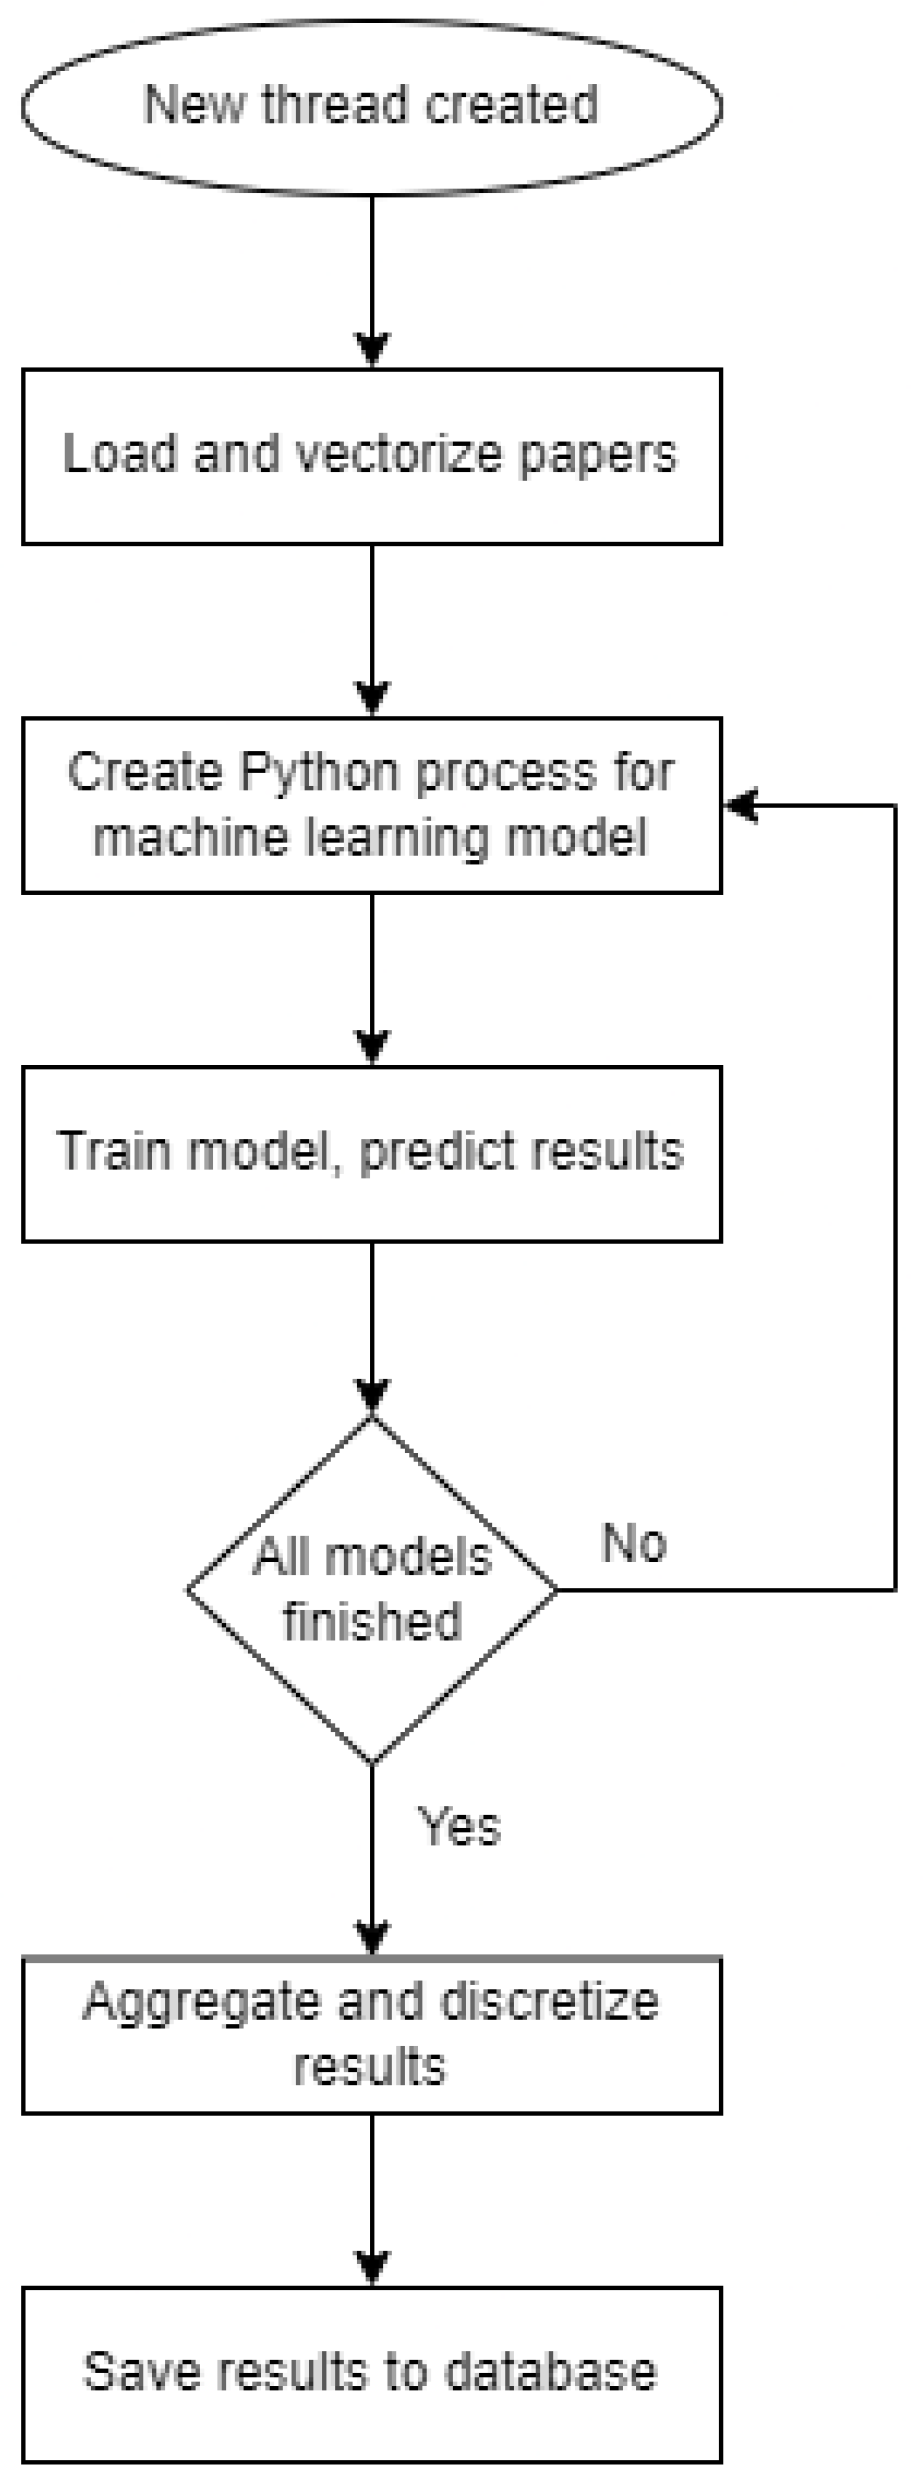
When requesting the processing of papers from the user side, the request is queued to be processed sequentially to avoid resource overload, since a computationally intensive action has been requested. For each request, a new thread is created, and the necessary parameters are supplied. The thread initially loads all of the papers for the requested literature review and vectorizes them, creates the model, and trains it with the input learning data. Then, the thread discretizes the processing results and marks all papers with a positive or negative class. The tags assigned to papers by the machine learning model differ from those assigned by the user. The diagram of the procedure performed by the thread is depicted in
Figure 8. It should be noted that, in this process, users can set an arbitrary limit between 0.0 and 1.0 for the discretization of the results, with the default value being 0.5. A lower value will result in a larger number of positive papers (i.e., the criterion is lowered), while a higher value will result in a smaller number of positive papers (i.e., a stricter criterion).
4.3. Literature Review Results
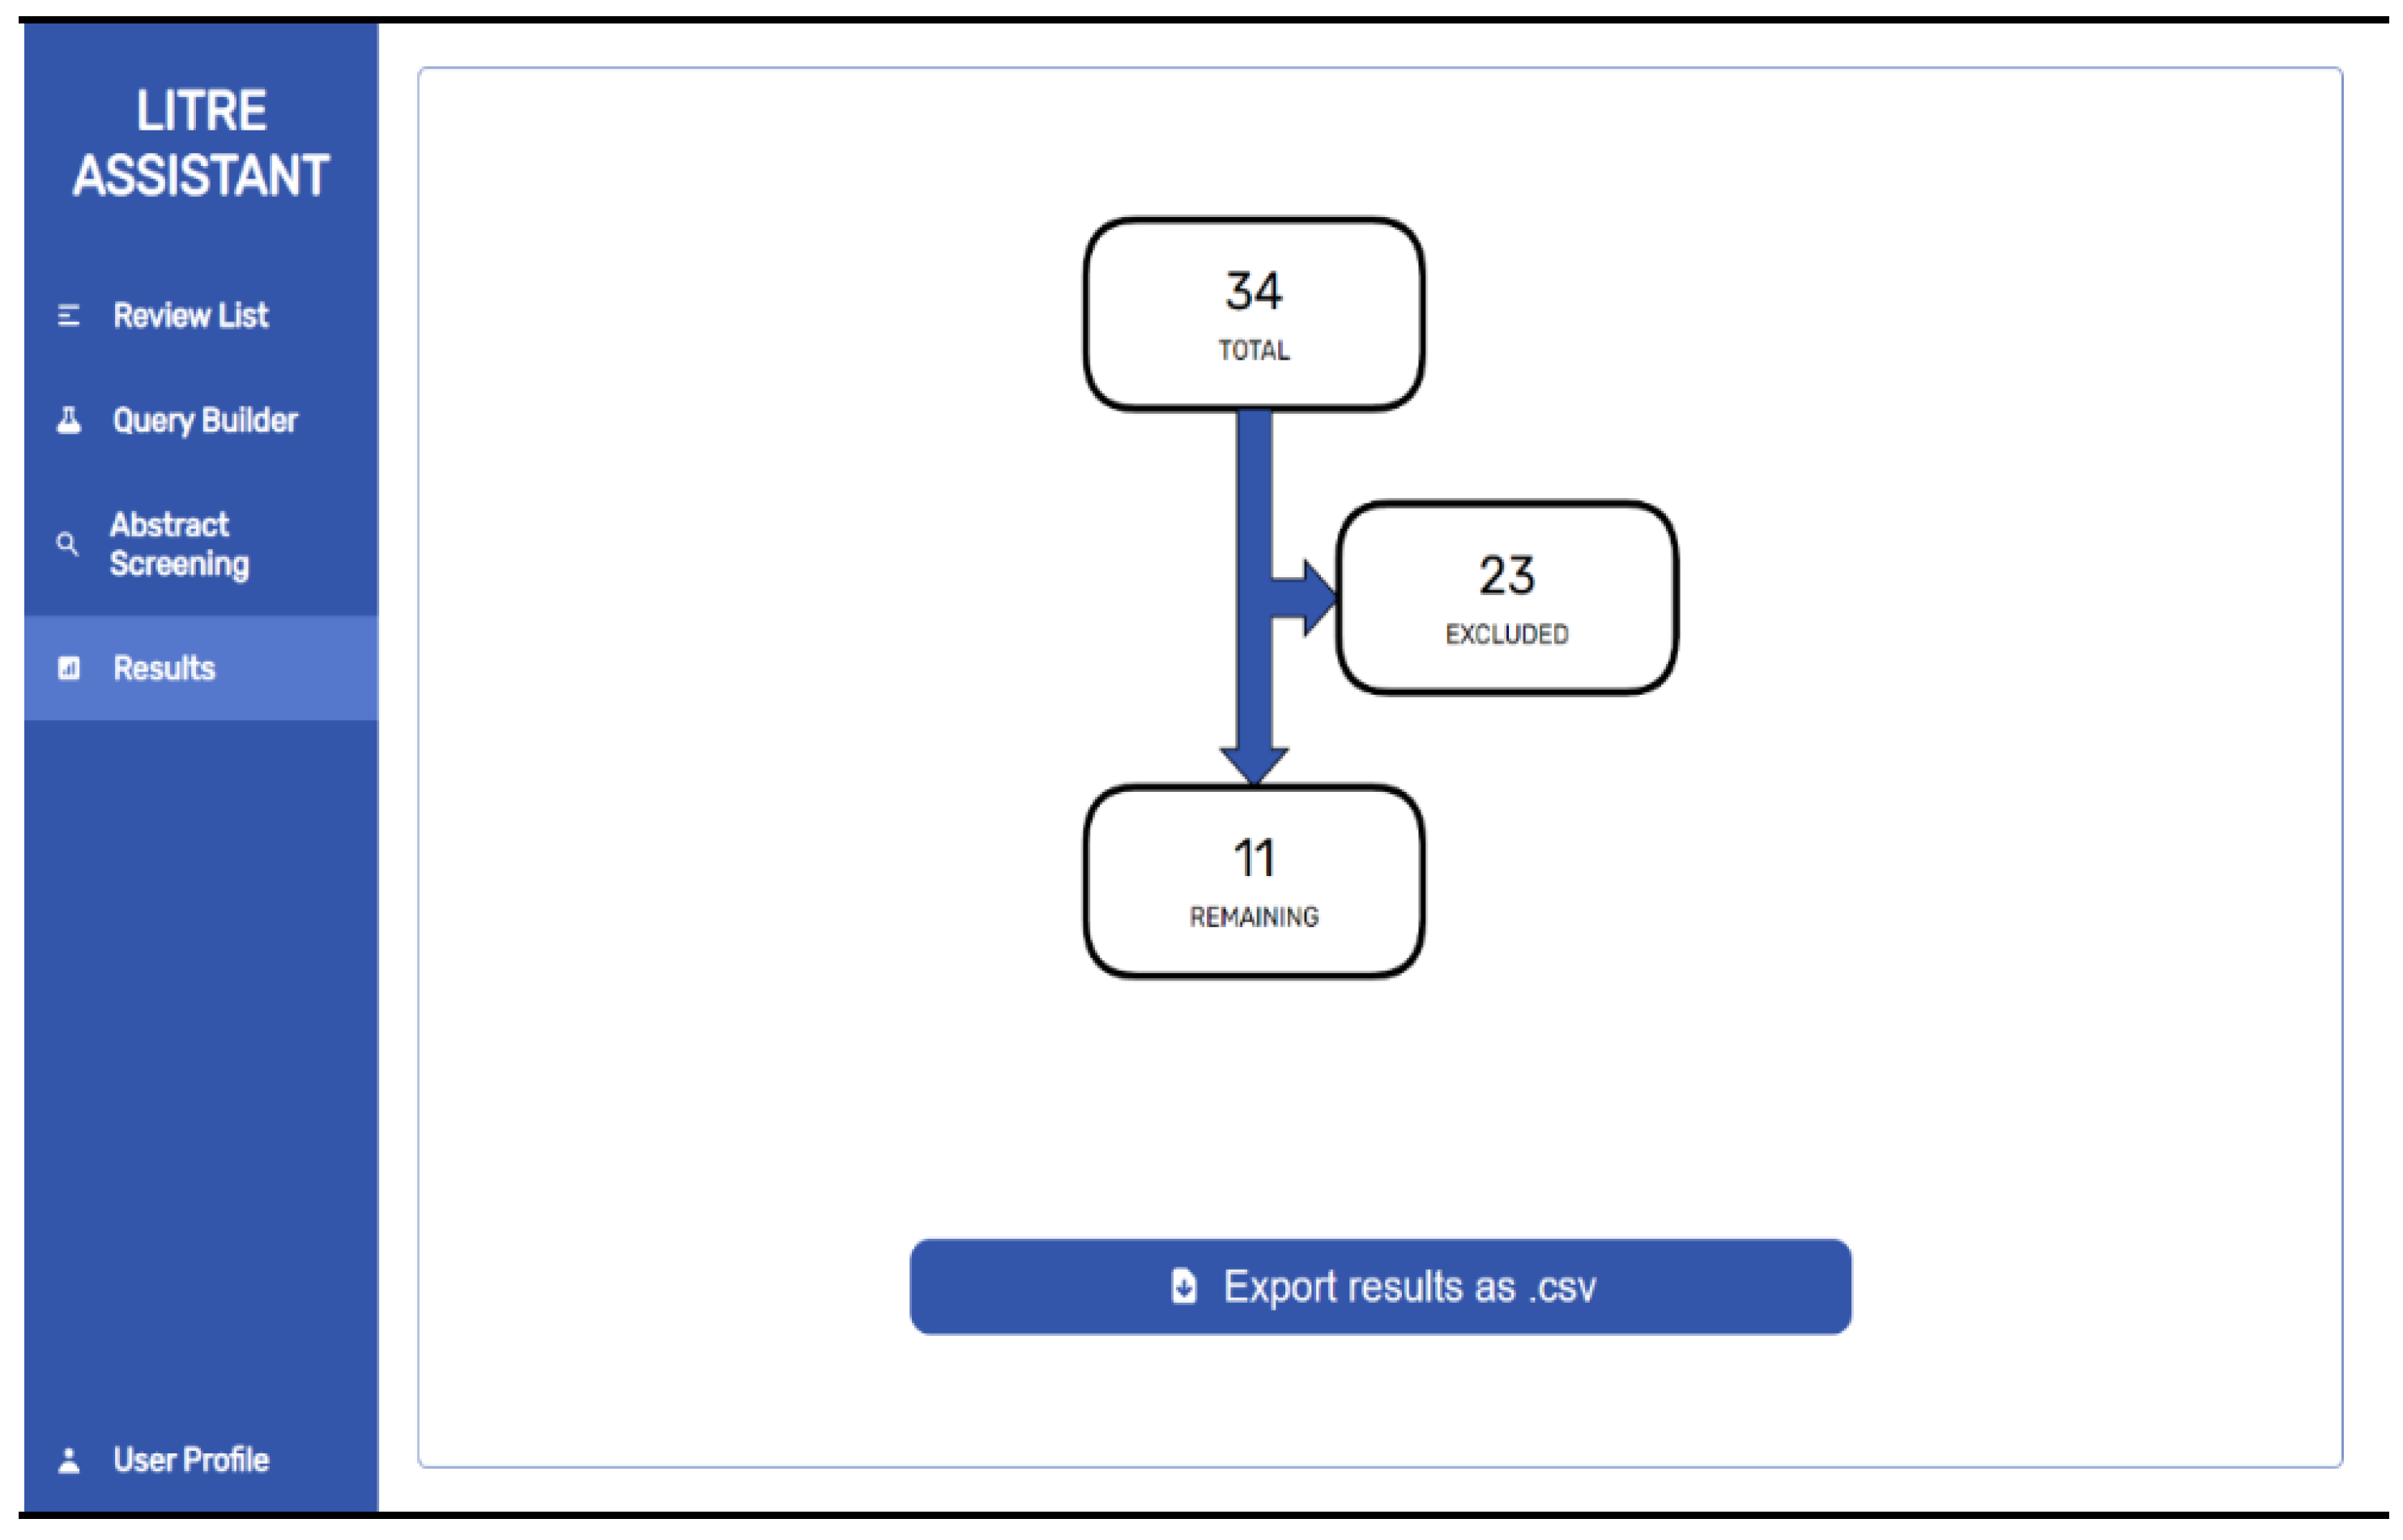
Once the papers are selected, the literature review graph is automatically generated using the actual output review data. The graph can be exported for further perusal, as can the list of all positively marked papers (either by the user or the application). The user can rerun any of the demonstrated literature review steps and regenerate the review results if required (
Figure 9).
5. Discussion
In this study, a machine learning approach for automating a large part of the process of conducting a systematic literature review was presented. In the process, user involvement was not completely excluded and, as part of the proposed Litre Assistant system, users still need to build queries for the review and mark a small number of papers as input into the machine learning training phase. The visually built query is automatically translated into proper formats for each scientific source—namely, Scopus, Web of Science, IEEE, and PubMed—followed by the automatic search and download of the retrieved sources.
The core of the Litre Assistant system is a set of machine learning algorithms used to classify papers as positive or negative. In terms of specific machine learning models, models such as naïve Bayes, SVM, and Ridge showed significantly better results than the other models, largely corresponding to the state of the art in text classification. Standard machine learning algorithms need to be fine-tuned for the specific area of automated paper classification by adjusting the models’ hyperparameters. Positively classified papers, even if sometimes classified incorrectly as positive instead of negative, are preferred, since not many positive papers are expected as the result of the process in general. Such papers would be excluded in the subsequent manual phases of the process, which need to be employed by the researchers to complete the literature review. Users are free to set the threshold that the system applies when discretizing the results retrieved from regression algorithms (this has no effect on the classification algorithms). The default value of 0.5 is chosen because the outputs are normalized to values between 0.0 and 1.0. Should users lower the threshold, more papers would be classified as positive, while a higher threshold would mean more negative papers (i.e., a stricter criterion).
Hyperparameters were chosen based on the results of a grid search optimization, and they differed slightly between the two training datasets (MH and EXAI). It was observed that they were either very similar and could be used interchangeably in both models, or they fundamentally differed (e.g., different solvers or kernels) for each individual literature review. The hyperparameters that match for both datasets are as follows:
Ridge regression: solver (auto);
Linear support-vector machine regressor: loss (epsilon insensitive);
Linear support-vector machine classifier: C (1 × 10⁻⁴), loss (hinge);
Support-vector machine regressor: C (1), kernel (rbf);
Support-vector machine classifier: C (very close, 1 and 1 x 101), kernel (rbf);
K neighbors regressor and classifier: N neighbors (3), weights (distance);
Gaussian process regressor: alpha (1 × 10⁻¹²), optimizer (fmin_l_bfgs_b);
Gaussian process classifier: optimizer (fmin_l_bfgs_b);
Gaussian naïve Bayes: var smoothing (1 × 10⁻¹²);
Multinomial and complement naïve Bayes: alpha (very close, 1 × 100 and 1 × 101);
Bernoulli naïve Bayes: alpha (1);
Decision tree regressor: criterion (friedman_mse);
Extra tree classifier: criterion (gini), splitter (best);
Multi-layer perceptron regressor: activation (logistic), hidden layer sizes (200, 100, 50), solver (adam);
Multi-layer perceptron classifier: alpha (1 × 10⁻⁴), hidden layer sizes (200), solver (lbfgs).
These hyperparameters may be assumed to perform well in general cases, meaning that they would show good results in these two and potentially other literature reviews, while other models with significantly different hyperparameters might not perform well in general cases. This presents an opportunity for future work on the options and potential for generalizing the approach presented in this paper.
The combined machine learning model was tested separately with optimal hyperparameters for the MH and EXAI datasets, meaning that optimal hyperparameters for the MH dataset were used for testing with the MH dataset, while the optimal hyperparameters for the EXAI dataset were used for testing with the EXAI dataset. In both cases, the combined model had test precision of over 80%. The data were randomly split into training and testing data in multiple iterations. The machine learning model is also dependent on the input of the user, meaning that if the user marks the papers inadequately, the automated marking will be inadequate as well.
To check the generalizing ability of the combined machine learning model, optimal hyperparameters of each dataset were tested with data from the alternative dataset. Both achieved lower sensitivity than with the original models, but the sensitivity remained quite high (84.0% and 90.1%), while the model trained on EXAI data showed better overall specificity and, therefore, overall accuracy (89.8%) than the model trained on MH data (77.6%). Such promising results—especially with the sensitivity, which remained high even with the alternative set of hyperparameters—indicate that generalization of the machine learning literature review component is achievable.
By experimenting with the machine learning process operation, it was observed that even marking five papers as positive and five papers as negative was enough to achieve reasonably high accuracy when training the models. The user is encouraged to mark even more papers to try to improve the accuracy of the model. Once machine learning has learned from these markings and performs its paper classification, the results are exported for further perusal and processing, as needed in the literature review process conducted by the user. The system supplies the user with a typical flowchart as advised by the PRISMA literature review method to be used for further reference or in their own publications.
In terms of limitations, the system is limited to working solely with abstracts of scientific papers. This design decision was made because most available scientific sources do not offer the option to download the full texts of papers free of charge. As a result, the system has not been tested with larger texts, which would result in larger vectors and, therefore, higher dimensionality of the input data. This could significantly slow down some models that are dependent on the number of features of the input data. The Litre Assistant system could potentially be extended to allow for multiple users working on one review, and a new step of reaching agreement (such as an inter-rater reliability check) could be introduced prior to moving to the automated machine learning phase of paper classification. The work on model generalization via cross-testing showed promising results but was limited to only two literature reviews and needs further elaboration through multiple datasets.
The AI model presented in the paper is trained on a single source of truth for the article marking. This means that if the input data themselves are noisy and/or incorrectly marked, the model will be very inaccurate. There is no calculation of agreement factors for datasets and there are no options for handling multiple users marking articles in a different way. Cohen’s kappa coefficients were given only for the training datasets based on the research from which they were obtained—not obtained from the developed model.
Low specificity of the models appeared as a side effect of trying to increase their sensitivity. Since most queries will often result in a small number of positive articles, it is much more acceptable to lose a positive article than to include a negative one. The user can still manually mark articles after the AI model has completed its work, so it is easier to eliminate some negative papers from a smaller set of positive papers than to eliminate a small number of positive papers from a large set of negative papers. Due to these reasons, the sensitivity of the models received greater importance compared to specificity.
6. Conclusions
The topic of this paper is the design of a system for automating a systematic literature review—a form of scientific research that is based on confirming or refuting a hypothesis by reviewing a large volume of literature for the researched topic. The identified problem is that a high-quality and performant literature review requires a lot of human and time resources, since the number of scientific papers is typically in the order of several thousand. A large part of this process can be automated with the help of computers.
A system was created that helps with the entire literature review. First, the search terms need to be defined, followed by the automated search of the most popular paper sources: Scopus, Web of Science, IEEE, and PubMed. Once the search is complete based on the custom-designed query, papers are marked manually, and the process of automatic marking of papers can be started, with all of the work being done by the computer.
The textual content of all papers is processed using natural language processing methods. The text of each paper is tokenized at the level of words, stop words are removed, the stem is extracted from all words using the Lancaster algorithm and, finally, a vector of TF-IDF factors is calculated for each paper using the dictionary of all papers. The matrix built from the vector of all marked papers is used to train the machine learning model, while the matrix built from the vector of all unmarked papers is used to predict the results.
A combined machine learning model was designed, and the total result for every individual paper was obtained by combining the results of all models (using pre-specified weights). The model’s hyperparameters were set in such a way that the sensitivity (i.e., correct classification of the positive class) was prioritized, which exceeded 90%, while specificity (i.e., correct classification of the negative class examples) of over 70% was maintained. As a result, the overall accuracy of the model exceeded 80%. These numbers remained stable and high even when the machine learning models were tested on the second dataset, showing promising work in generalizing the literature review process to support other datasets.
Once the automatic marking process is complete, the user can examine all of the papers and their assigned marks. It is also possible to make changes and restart the automatic marking process. In addition, the system supports users with a diagram feature, as it is often used in literature reviews and allows data export.

