Abstract
Numerous imaging applications and analyses demand human perception, and color space transformation of device-dependent tri-band color interpretation (RGB) to device-independent CIE color space standards needs human intervention. The imaging acquisition environment, theoretical conversion errors, viewing geometry, well-defined illumination uniformity, and calibration protocols limit their precision and applicability. It is unfortunate that in most image processing applications, the spectral data are either unavailable or immeasurable. This study is based on developing a novel integrating sphere imaging system and experimentation with textiles’ controlled variation of texture and color. It proposes a simple calibration technique and describes how unique digital color signatures can be derived from calibrated RGB derivatives to extract the best features for color and texture. Additionally, an alter-ego of reflectance function, missing in the imaging domain, is suggested that could be helpful for visualization, identification, and application for qualitative and quantitative color-texture analysis. Our further investigation revealed promising colorimetric results while validating color characterization and different color combinations over three textures.
1. Introduction
Materials and their surface textures show unique light absorption and reflection spectra characteristics. These reflectance spectra over a wide range of wavelengths of light are the fingerprints that tell their story and identify them and their families.
Over the last few decades, advancements in imaging systems have made significant inroads in photogrammetry, remote sensing, real-time response, and ease of communication at an affordable cost. It is rightly said that a picture is worth a thousand words. An image contains details about texture, pattern, and appearance in addition to color information. Multi-sample imaging is simple for imaging systems to perform, store, and communicate in a real-time application. Although spectral reflectance is the distinctive fingerprint of a material in spectroscopy and measurements are widely standardized, CIE color space cannot convey the same information about texture or appearance as an image.
Spectrophotometers are being used extensively in surface color application and measurement industries such as paints, textiles, dyestuffs, forensics, pharmaceuticals, agriculture, ceramics, foodstuffs, and so on [1,2]. They are popular for well-defined standardization of illumination, viewing, monochromator, photodetector, and calibration protocols to provide robust readings day in and day out [2].
The fundamental idea of light reflection serves as the foundation for both the imaging and spectral domains. Imaging triplets (device-dependent color systems) do not see aswe do, but reflectance spectra that span the entire visible wavelength range are device-independent, and color systems are minutely designed to imitate human vision. Additionally, their standard working mode is compressed-gamut color. In fact, a different spectrophotometer with illumination and observation geometry is recommended for measuring actual color and effects [1]. They differ significantly regarding CIE measurement principles [2], and experimental results vary with visual assessment [1,2,3]. Spectral measurements enjoy their domain of absolute and precise measurement of material surface reflections, whereas the digital imaging domain, though device-dependent, has its bright future in the path of development. It is becoming indispensable for faster performance, ample data storage, media communication, displays, real-time visualization, and so on.
In fact, as of today, imaging is delving into various potential and amazing applications in science and engineering, including artificial intelligence [4,5,6,7,8]. The advancement journey most likely actively began in the past3–4 decades, namely, medical imaging [9,10,11,12], forensics [13,14], soil science and ecology [15,16,17,18,19,20], food science [21], detection of skin and facial recognition [22,23], textiles [3,24], fire propagation [25], and so on. We can foresee their profound application in real-time or near-real-time results, improved performance, and added features with gradually falling costs.
An up-to-date review of the challenge of spectral reconstruction from RGB images, in other words, the recovery of whole-scene hyperspectral (HS) information from a three-channel RGB image, is reported by Boaz Arad et al. (2022).No doubt, hyperspectral imaging evolved for spectral proximity only and is too expensive, just as their processing algorithms are [26,27,28,29,30,31,32].
An article (Jingang Zhang etal.) published online on 13 July 2022 titled “A survey on computational spectral reconstruction methods from RGB to hyperspectral imaging” in the journal Nature Scientific Reports [31] stated in the abstract “We have identified current challenges faced by those methods (e.g., Information loss, spectral accuracy, data generalization) and summarized a few trends for future work. ”A keyword search in Google Scholarfor“ spectral reconstruction from RGB images impossible” resulted in about 22,200 results (0.04 s) [ISD 20:17pm, 27th Oct]. The fundamental causes had already been investigated, and it can be concluded that imaging systems were and are being developed for pleasant images, not for colorimetric accuracy [32]. However, digital imaging is only a component of an imaging system. Its development pipeline was designed to reproduce a visually pleasing photograph rather than a reasonably accurate colorimetric image that needs to be characterized and/or color profiled [27,28,29,30,31,32].
2. Related Work
The published research on the color measurement of surfaces in natural scenes (grass, soil, foliage, etc.) by Hendley and Hecht [33], photographic colorimetry by Burton and Moorhead [34], and color statistics clearly show that there are an infinite number of different colors present in nature across the spectrum of light. The existence of a superfluity gamut of surface colors in nature was inferred by spatial-frequency content with extensive chromatic diversity (Nascimento et al. [35]), consequences of various adaption processes (Webster and Mollon [36]; Juricevic and Webster [37]), etc. [38]. Foster et al. [39,40] stated that “the ability to perceptually identify distinct surfaces in natural scenes by virtue of their color depends not only on the relative frequency of surface colors but also on the probabilistic nature of observer judgments; not only do natural scenes contain color gamut very different from those of typical laboratory stimuli, but also they contain very different spectral and spatial structures. ”Mäenpää and Pietikäinen [1], of the machine vision group, stated that color and texture are separate phenomena that should be treated individually. Surface texture and color analysis have numerous fundamental and derived applications. Sharma and Eduardo (2012) urged that fundamental new research is required to overcome the lesser-known and poorly-appreciated limitations of the dark side of CIELAB. They demanded further development of uniform and new color appearance spaces, which should be revisited afresh following future, more modern devices and applications [41].
The way digital color sensors sense color has four major concerns: white balance, metameric samples, non-visible IRlight, and different color spaces [42,43,44]. One of the major concerns is that it is irrelevant to profile surface spectral reflectance under spatially varying illumination and viewing geometry. It is unclear what sets an observer’s white point, even at its initial RAW image processing stage [42,45]. Other significant challenges are the hardware for uniform illumination, well-defined geometry of viewing, inner coating, and data acquisition in color-compressed gamut like sRGBs without a proper calibration module [11,42,43,45].In the last few decades, many devices, calibrations, and color characterization methods have been proposed to engineer the perfect original spectrum from its reduced counterpart of color triplets; to recover the specific surface reflectance properties of surfaces from digital imaging; and to reconstruct the exact spectrum of illuminating light; but these could not be accomplished [46,47]. Until now, these real-world imaging strategies provide only mediocre colorimetric accuracy, limiting their use for high-precision color measurement devices on par with spectrophotometers.
Suppose image acquisition were standardized and characterized, ensuring calorimetric accuracy. In that case, it could potentially be the most economic and flexible system for non-invasive testing and color appearance analysis. Alternatively, we could opt for an alter-ego of reflectance with a calibration protocol that safely verifies its usefulness by preserving its imaging domain knowledge without color transformation error. It could be fairly expensive regarding colorimetric accuracy. Even utilizing complex models like polynomial regression and neural networks [45,46,48,49,50,51,52,53,54,55,56,57], some recent research has reported mediocre color accuracy [26,27,28,29,30]. In particular, a recent thesis by Yao in 2022 disclosed the typical color difference mistakes for various textile materials [58]. Complex models using spiking neural network-based models [59] and probabilistic neural network-based classifiers [60] reported reasonable spectral accuracy.
3. Background of the Study
This study applied a methodical approach for improving colorimetric accuracy by creating a unique system with a highly diffused coating on an integrating sphere, with controlled illumination, viewing, and calibration for image acquisition. Additionally, it empirically confirms and proposes a new system and methodology that could ensure the qualitative and quantitative analysis of color and texture inside its digital domain by eradicating the aforementioned difficulties. The encouraging results in color spectral visualization using RGB could prevent theoretical conversion mistakes from device-dependent systems to device-independent color spaces. To extract the best features for color and texture, we suggest a straightforward calibration technique and explain how distinctive digital color signatures can be created from calibrated RGB derivatives. Additionally, a substitute for the reflectance function that is absent from the imaging domain was proposed. This function may be applied to both qualitative and quantitative color-texture analysis and be useful for visualization and identification. Our continued research, which included color characterization, color combinations over three textures, and validation in several color spaces, yielded promising colorimetric results.
Integrating spheres with highly diffused coating have been extensively and explicitly engineered to measure the color of materials. Figure 1 depicts the outline of our experimental integrated sphere imaging system with remote shooting and illumination control protocol. Its primary function, and the beauty of atheoretical integrating sphere, is that the fractional energy leaving a unit area and arriving is independent of the viewing angle and the distance between the regions [42].
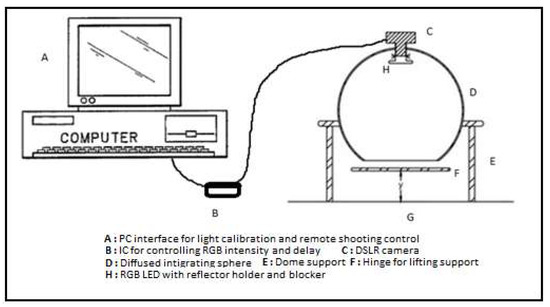
Figure 1.
Integrated sphere imaging system with Illumination control.
4. Theoretical Treatment
A virtual light source is created by reflection when light falls on a highly diffused wall coating or surface. The amount of radiance, i.e., the flux density per unit solid angle ( for input flux (), available for the optical system to be collected by viewing or sensing the illuminated surface, is directly related to both surface reflection and subsurface scattering at (n) no. of reflections.
Here pf = the port fraction of the integrating sphere out of total area As.
In general, the reflectance phenomena of real-world surfaces comprise three significant components: diffused lobe, specular lobe, and specular spikes. The diffused portion is caused by incident light repeatedly reflected and refracted at surface boundaries in multiple directions. The specular lobe is caused by light being reflected at the interface. In contrast, the specular spikes are realized in a narrow range only in exceptional cases for mirror-like surfaces. Most rough surfaces in the real world rarely exhibit specular spikes. The Lambertian model, though simpler, assumes that all the refracted lights are evenly distributed in all directions, which is often contradictory to real-world surface reflections [43,44,45]. It suffers from more inaccuracies at lower magnifications of rough surfaces, randomly distributed across them.
Furthermore, phenomena like shadowing, masking, and inter-reflection are prevalent when incident light and the predominant viewer angle increase. This fact has been explained by Oren and Nayar [43,44]. The diffused reflection component has shown that in surfaces with high macroscopic roughness, the diffuse reflection becomes view-dependent [43,45]. Improper viewing and illumination cause masking, shadowing, and inter-reflection complexities that create noise in an image [43,44,45].
This could lead to errors in estimating color and texture. In simple terms, for complete vision, a viewer and a source direction should be in proximity, and the variation in image magnification ensures changes in perceived surface reflectance characteristics [44,45].There are two main advantages ofd/0 viewing geometry [2,61]:(i) flux density Φi is significantly higher due to the integrating sphere’s light collection, and (ii) polychromatic irradiation stimulates photon-induced radiance, which often needs to be quantified in color and appearance measurements. The only concerning part is that the heating may produce thermo-chromic effects. Hence, the system should be calibrated and frequently crosschecked to ensure robustness and accuracy of the surface reflectance measurement.
Case I: For single reflection, the radiance of the sphere wall with a calibrated plate:
Radiance of sphere wall with material:
Here the material reflectance is directly proportional to the radiant flux available for collection by the sensor.
Case II: For infinite reflection [44,61].
It is highly likely that light will undergo multiple reflections in an integrating sphere, expanding to an infinite reflection, say, r(1 − f) < 1:
Concerning imaging reflectance [43,44]:
where = diffused component color vector;
= specular component color vector;
F = Fresnel’s coefficient;
G = geometrical attenuation factor;
θi = angle between the illumination direction and the normal surface;
θr = angle between the viewing direction and the normal surface;
α = angle between the normal surface and the bisector of the viewing direction and the light source direction; and σ = represents the surface roughness.
In our experimental geometry (Figure 2), θi, θr, and α are almost tending to zero, and F and G are constant for surfaces with the same roughness factor for a single type of material surface. Here, the sphere is calibrated with an RGB histogram response and fine-tuned with the image reading of a white calibrated plate. The sphere surface is constructed with the same coating formulation used for the integrating sphere to ensure R (λ) w+c is constant, and it gave a nearly flat reflectance response of 94% over visible wavelengths. The reflectance factor henceforth could be related linearly to the complex reflectance function of the material under uniform illumination:
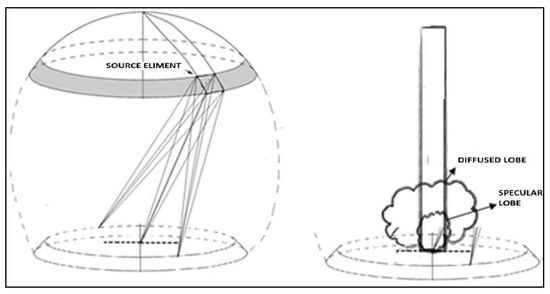
Figure 2.
Diffused and specular reflection in the integrated sphere with concentric illumination.
Thus, the color imaging vectors for reflection components described by Lambert and Torrance–Sparrow may be roughly assumed to be linear additions when these following conditions are met [44,61]. Additionally, the diffused and specular components are perceived simultaneously by imaging sensors in this system. Their entity interpretation is complicated, as the total reflection by a spherical wall and the material may be interdependent. Hence theoretically, the terms or may uniquely represent each material’s response and require rigorous empirical models to explain. In the case of real substitution spheres, the diffused and specular components from image color vectors would be more cumbersome to derive and treat separately than to explain theoretically and verify experimentally [43,44,45,61].
In our experiment, we proposed an ideal integrating sphere geometry with concentric illumination (Figure 2) and calibration protocol, which has been experimentally verified for unique digital signatures in much simpler terms of ratios of RGB polynomials concerning calibrated plate RGBs.
Spectrophotometers with an optical configuration of “Diffuse/8°” (illumination/measurement) are recommended to measure and analyze color and visual appearance with reasonable accuracy. This motivated us to design an imaging system based on these fundamental principles for diffused lighting environments. In addition, as the color-mixing rule suggests that almost all of the color gamut can be produced by mixing primary shades of red, green, and blue, we tried to explain the imaging digital color signature in terms of their mixed response to the RGB triplets, such as r, g, b, rg, gb, rb, and rgb.
5. Materials and Methods
The same cotton fibers can be spun into yarn and then wovenin the pilot weaving machine to create twenty different textures. They are similar in terms of weave, linear yarn density (count), spacing (ends and picks per cm), and effects of texture variation. Swatches of plain-weave cloth weighing 1 g each were dyed with red, blue, yellow, and cyan dyes at various concentrations (0.25%, 0.5%, 0.75%, 1%, 1.5%, 2%, 3%, 4%, 5%, and 6%) to study the effects of color variation. The commercial names of the reactive vinyl sulphone-based dyes utilized are listed in Table 1. The dyeing procedure was followed in accordance with the manufacturer’s instructions; Dystar China Ltd. Figure 3 shows a representation of the workflow.

Table 1.
Dyes used for samples.
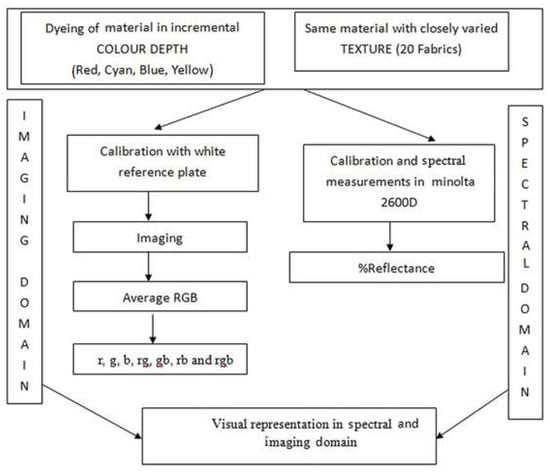
Figure 3.
Workflow.
A white reference plate with a highly diffused coating applied in the integrating sphere was prepared and used for calibration to ensure RGBs for a flat response; their values are consistent with a tolerance of ±0.5% at any region. A light-calibration protocol is depicted below (Figure 4) in real-time, showing that equal responses of red, green, and blue components are usually fine-tuned by the image reading of the calibration plate using image processing in MATLAB.
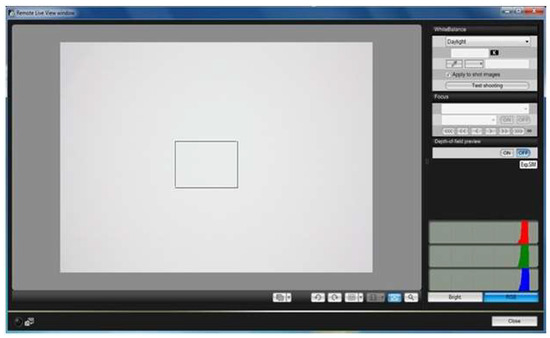
Figure 4.
Light-calibration protocol.
The specular component, including reflectance, was measured by aMinolta 2600D spectrophotometer over 360 to 740 nm wavelength with a 10 nm gap. The average RGB values of the images were acquired and computed in MATLAB once the diffused imaging system had been calibrated, and the r, g, and b values represent the scaled values obtained by dividing with the white calibration plate RGBs.
6. Results and Discussion
6.1. Same Material with Close Texture Variations
The spectral readings spreading over the wavelength of light (400–700 nm at 10 nm gap) and the scaled digital readings of calibrated r, g, b, rg, gb, rb, and rgb (described as rgb polynomials) are shown in Figure 5. These twenty cotton fabric samples were produced using proximity design parameters from the same cotton fibers (Table 2), and are difficult to precisely judge visually and in the digital imaging domain to differentiate colors. However, the spectral reflectance is unique and can easily be distinguished in spectroscopy. 20 samples were displayed by with varied default colors in both domains.
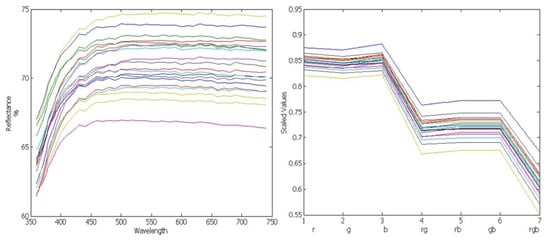
Figure 5.
SCE (specular component exclusive) reflectance and r, g, b, rg, rb, gb, and rgb responses of 20 fabrics.
Table 2.
20 Fabric specifications produced from the same cotton fibers.
6.2. Same Texture with Incremental Color Variations
The incremental variance of color experiment was further analyzed in both domains. It has been found that representation in the digital field can be treated as an alter ego of reflectance in the spectral domain; the family of curves of red, cyan, blue, and yellow can be qualitatively judged easily in both domains (Figure 6). The experimental RGB and the spectral data are presented in a Supplementary Materials.
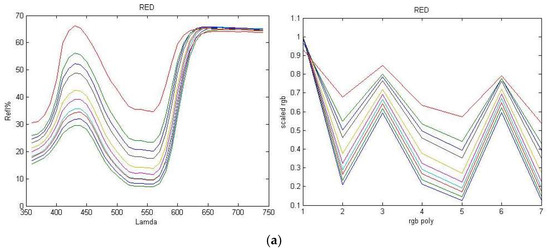
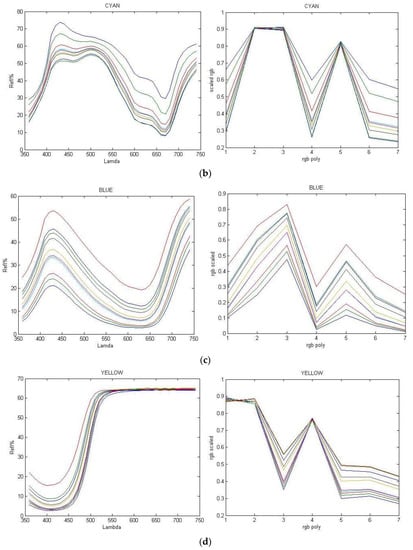
Figure 6.
(a) r, g, b, rg, rb, gb, and rgb readings and SCE reflectance reading of red; (b) r, g, b, rg, rb, gb, and rgb readings and SCE reflectance reading of cyan; (c) r, g, b, rg, rb, gb, and rgb readings and SCE reflectance reading of blue; (d) r, g, b, rg, rb, gb, and rgb readings and SCE reflectance reading of yellow.
The image details, along with spectral and digital RGB polynomial data, of 20 kinds of fabric from the same cotton fibers (texture was only slightly varied by spinning the yarn and weaving the fabric) are given in the Supplementary Materials. The aim was to verify the unique presence of colors with respect to their spectra in visible wavelengths, which could further lead to ensuring the quantitative and qualitative analysis of color. The experimental findings shown in Figure 5 and Figure 6 confirm that the unique identity of color and texture variation was observed in both spectral and calibrated integrated sphere imaging domains. It is the texture variance that is responsible for shifts in their family of spectral and digital color space (Figure 5). Interestingly, the intensity of an image ((R+G+B)/3) at such proximity follows a trend with the increase in color concentration; it is evident that a decrease in reflectance was observed with the rise in color concentration. The family of curves so obtained signifies a unique signature in the digital domain and could potentially be used for qualitative and quantitative analysis of color. These experimental results confirm that every texture or colorant has a distinct characteristic of reflection, absorption, surface scattering, etc., and that these characteristics can be recognized in the spectral and calibrated digital domains.
The proposed integrating sphere and optical geometry with a concentric lighting calibration system ensure diffused and specular response almost uniformly over the sample. These experimental analyses and validation with the proximity of dyes and texture combinations show their unique signatures in the imaging domain, and they can be strongly related to the spectral domain. The calibrated r, g, b, rg, rb, gb, and rgb polynomial expansion can be treated as an alter-ego of spectral responses. These are unique and can respond to variations in texture and color concentration. Qualitative and quantitative evaluation is possible in the digital domain by seeing the sensible variation trends, such as spectral ones, for color and textural variations due to proximity.
7. Conclusions
These experimental findings demonstrated that digital RGB polynomial data with a calibrated imaging sphere could be used in the same manner as spectral data for qualitative analysis of color and texture. Thus, a new visualization in the calibrated imaging domain is proposed here. In addition, this leads us to investigate further to improve quantitative analysis of color and texture.
Firstly, it is important to take into account the underlying factors once more because many studies have already looked into imaging systems and their performance for colorimetric accuracy. It may be said that imaging technologies were initially built for pleasing images rather than for colorimetric accuracy. Currently, the multispectral imaging domain is struggling with complex algorithms and mediocre domain knowledge on established human color perception.
Secondly, it is still debatable how strictly we can distinguish and represent a unique color and up to what precision we can do so in a tone-compressed gamut like sRGB, or the hyper-spectral domain as measured by a spectrophotometer, since a natural surface color under spatially varied illumination exhibits a considerable range.
Thirdly, as a prerequisite for best practices, we encourage researchers to validate their limitations on digital RGB responses, imaging metric performances, and theoretical and computational assumptions. In addition, the robustness of the calibration with a white reference standard under an illuminant and its repeatability could surely reduce errors and ensure investigation accuracy. It may be quite possible that they can work in their own color-compressed domain and avoid substantial theoretical errors in computing adapted illuminants and observers or through empirical modeling. It is safe to choose a broader color gamut where distinctions are demanded at the cost of ample data storage. However, domain knowledge is an absolute necessity before pre- and post-processing of color images in compressed digital color space, as is the know-how for mapping specific RGBs to one particular spectrophotometer or colorimetric reading under a specific illuminant and observer. Interpretations of general color references should not be used in experimentation, computation, rendering, characterization, or profiling for real-world surface spectral properties, where absolute and relative measurements are crucial.
We attempted to develop this fundamental concept incrementally through experimental validation. The proposed system is scalable, and the techniques are much simpler. They can be used as a tool for visualization, identification, and extraction of the best features for color and texture patterns from a calibrated imaging system.
Our further investigations were based on experimentation and validation of these fundamental concepts with varied textures and the same incremental color depth, color combinations, and color space transformations, which are frequently used for image processing and computation without prior knowledge. The fundamental color-mixing principles and their representation in various device-dependent color spaces were investigated further to verify this concept and will be discussed next.
8. Patents
IN 202031018601, MULTI-RESOLUTION SPHERE IMAGING SYSTEM AND METHOD FOR SPECTRAL CHARACTERIZATION, 30/04/2020.
Supplementary Materials
The following supporting information can be downloaded at: https://www.mdpi.com/article/10.3390/electronics11233887/s1; The images of the sample are provided in the Supplementary File, captured by the said calibrated imaging system. They are titled Figure S1. Proximity textures: 20 kinds of fabric from the same cotton fibers(texture was only slightly varied by spinning the yarn and weaving the fabric); Figure S2: red, cyan, blue, yellow samples; Figure S3. System set-up and calibrationThe corresponding experimental readings in the spectral and imaging systems were provided as follows: Table S1. Calibrated RGB readings of 20 fabric samples; Table S2. %R reflectance and CIE XYZ, L*a*,b* readings of 20 fabric samples; Table S3. Calibrated RGB readings of red, cyan, blue, and yellow fabric samples; Table S4. %R reflectance readings of red, cyan, blue, and yellow samples.
Author Contributions
N.R. and A.K. conceptualized the current investigation, conducted the experiments, analyzed data with manuscript preparation under the supervision of P.P., K.N. and G.B. P.P., K.N. and G.B. helped in experimental feedback and reviewed the manuscript. All authors have read and agreed to the published version of the manuscript.
Funding
This research received no external funding.
Acknowledgments
We are also grateful to Manas Sarkar, ITC, HKPU for providing cotton samples with varied textures and Dystar, Hong Kong, for generously providing us with dye samples. We are thankful to for the experimental support from new fiber science and IoT Lab, OUTR sponsored by TEQIP-3 seed money and MODROB (/9-34/RIFDMO DPOLICY-1/2018-19).
Conflicts of Interest
The authors declare no conflict of interest. The funders had no role in the design of the study; in the collection, analyses, or interpretation of data; in the writing of the manuscript; or in the decision to publish the results.
References
- Mäenpää, T.; Pietikäinen, M. Classification with color and texture: Jointly or separately? Pattern Recognit. 2004, 37, 1629–1640. [Google Scholar] [CrossRef]
- Gupte, V.C. Color Technology: Tools, Techniques and Applications; Woodhead Publishing: Sawston, UK, 2008. [Google Scholar]
- Kandi, S.G. The Effect of Spectrophotometer Geometry on the Measured Colors for Textile Samples with Different Textures. J. Eng. Fibers Fabr. 2011, 6, 70–78. [Google Scholar] [CrossRef]
- Barragán-Montero, A.; Javaid, U.; Valdés, G.; Nguyen, D.; Desbordes, P.; Macq, B.; Lee, J.A. Artificial intelligence and machine learning for medical imaging: A technology review. Phys. Med. 2021, 83, 242–256. [Google Scholar] [CrossRef]
- Liu, J.; Kuang, W.; Liu, J.; Gao, Z.; Rohani, S.; Gong, J. In-situ Multi-phase Flow Imaging for Particle Dynamic Tracking and Characterization: Advances and Applications. Chem. Eng. J. 2022, 438, 135554. [Google Scholar] [CrossRef]
- Rabha, D.; Rather, M.A.; Mandal, M.; Nath, P. Programmable illumination smartphone microscopy (PISM): A multimodal imaging platform for biomedical applications. Opt. Lasers Eng. 2022, 151, 106931. [Google Scholar] [CrossRef]
- Dong, L.; Zhang, W.; Xu, W. Underwater image enhancement via integrated RGB and LAB color models. Signal Processing: Image Commun. 2022, 104, 116684. [Google Scholar] [CrossRef]
- Thomas, N.; Pommerol, A.; Almeida, M.; Read, M.; Cremonese, G.; Simioni, E.; Weigel, T. Absolute calibration of the color and stereo surface imaging system (CaSSIS). Planet. Space Sci. 2022, 211, 105394. [Google Scholar] [CrossRef]
- Patricoski, C.; Stewart, F.A.; Brudzinski, J.; Spargo, G. Selecting the right digital camera for telemedicine--choice for 2009. Garret Telemed. e-Health 2010, 16, 201–208. [Google Scholar] [CrossRef]
- Crane, N.J.; Gillern, S.M.; Tajkarimi, K.; Levin, I.W.; Pinto, P.A.; Elster, E.A. Visual enhancement of laparoscopic partial nephrectomy with 3-charge-coupled device camera: Assessing intraoperative tissue perfusion and vascular anatomy by visible haemoglobin spectral response. J. Urol. 2010, 84, 1279–1285. [Google Scholar] [CrossRef]
- Bourne, R. Fundamentals of Digital Imaging in Medicine; Springer: London, UK, 2010. [Google Scholar] [CrossRef]
- Luo, M.R. A color management framework for medical imaging applications. Comput. Med. Imaging Graph. 2006, 30, 357–361. [Google Scholar] [CrossRef] [PubMed]
- Brooks, E.; Comber, B.; McNaught, I.; Robertson, J. Digital imaging and image analysis applied to numerical applications in forensic hair examination. Sci. Justice 2011, 51, 28–37. [Google Scholar] [CrossRef] [PubMed]
- Yajima, Y.; Nata, M.; Funayama, M. Spectrophotometric and tristimulus analysis of the colors of subcutaneous bleeding in living persons. Forensic Sci. Int. 2006, 156, 131–137. [Google Scholar]
- Simpson, N. Color and contemporary digital botanical illustration. Niki Opt. Laser Technol. 2011, 43, 330–336. [Google Scholar] [CrossRef]
- Viscarra, R.A.; Minasny, B.; Roudier, P.; McBratney, A.B. Color space models for soil science. Geoderma 2006, 133, 320–337. [Google Scholar] [CrossRef]
- O’Donnella, T.K.; Goynea, K.W.; Milesa, R.J.; Baffautb, C.; Andersona, S.H.; Sudduthb, K.A. Determination of representative elementary areas for soil redoximorphic features identified by digital image processing. Geoderma 2011, 163, 138–146. [Google Scholar] [CrossRef]
- Eric, A.; Lam Yeung, Y.; Eric, M. Forest understory soil temperatures and heat flux calculated using a Fourier model and scaled using a digital camera Graham. Agric. For. Meteorol. 2010, 150, 640–649. [Google Scholar]
- Migliavaccaa, M.; Galvagnob, M.; Cremonesec, E.; Rossinib, M.; Meronib, M.; Sonnentage, O. Using digital repeat photography and eddy covariance data to model grassland phenology and photosynthetic CO2 uptake. Agric. For. Meteorol. 2011, 151, 1325–1337. [Google Scholar] [CrossRef]
- Lapresta-Fernandez, A.; Capitan-Vallvey, L.F. Environmental monitoring using a conventional photographic digital camera for multianalyte disposable optical sensors. Analyticachimicaacta 2011, 706, 328–337. [Google Scholar] [CrossRef]
- Teusdea, C.A.; Mintas, O.; Bals, C. Automatic content assessment of fresh pork meat using color image analysis. Val. Stelian Ann. DAAAM Proc. 2010, 2, 427. [Google Scholar]
- Daniel, R.E.; Whitehead, R.D.; Xiao, D.; Perrett, D.; Suzuki, I. Satoru, Oxygenated-Blood Color Change Thresholds for Perceived Facial Redness, Health, and Attractiveness. PLoS ONE 2011, 6, e17859. [Google Scholar]
- Chang, H.; Koschan, A.; Abidi, B.; Abidi, M. Fusing continuous spectral images for face recognition under indoor and outdoor illuminants. Mach. Vis. Appl. 2010, 21, 201–215. [Google Scholar] [CrossRef]
- Haran, T. Short-Wave Infrared Diffuse Reflectance of Textile Materials: Physics &Astronomy. Master Thesis, Georgia State University, Atlanta, GA, USA, 2008. [Google Scholar]
- Huang, H.W.; Zhang, Y. Analysis of the ignition process using a digital image and color processing technique. Meas. Sci. Technol. 2011, 22, 075401. [Google Scholar] [CrossRef]
- Murayama, Y.; Sugiyama, T.; Ogino, Y.; Furuta, H.; Kambara, T.; Abe, T.; Sakamoto, M. Quantitative evaluation of color difference between actual specimens and whole-slide imaging-scanned images calibrated with commercial color charts. In Proceedings of the Medical Imaging 2022: Digital and Computational Pathology, Virtual, 21–27 March 2022; Volume 12039, pp. 285–290. [Google Scholar]
- Liu, T.; Siegel, E.; Shen, D. Deep Learning and Medical Image Analysis for COVID-19 Diagnosis and Prediction. Annu. Rev. Biomed. Eng. 2022, 24, 179–201. [Google Scholar] [CrossRef] [PubMed]
- Gomez-Gonzalez, E.; Barriga-Rivera, A.; Fernandez-Muñoz, B.; Navas-Garcia, J.M.; Fernandez-Lizaranzu, I.; Munoz-Gonzalez, F.J.; Parrilla-Giraldez, R.; Requena-Lancharro, D.; Gil-Gamboa, P.; Rosell-Valle, C.; et al. Optical imaging spectroscopy for rapid, primary screening of SARS-CoV-2: A proof of concept. Sci. Rep. 2022, 12, 1–18. [Google Scholar]
- Nguyen, K.; Proença, H.; Alonso-Fernandez, F. Deep Learning for Iris Recognition: A Survey. arXiv 2022, arXiv:2210.05866. [Google Scholar]
- Zhao, J.; Kumar, A.; Banoth, B.N.; Marathi, B.; Rajalakshmi, P.; Rewald, B.; Ninomiya, S.; Guo, W. Deep-Learning-Based Multispectral Image Reconstruction from Single Natural Color RGB Image—Enhancing UAV-Based Phenotyping. Remote Sens. 2022, 14, 1272. [Google Scholar] [CrossRef]
- Zhang, J.; Su, R.; Fu, Q.; Ren, W.; Heide, F.; Nie, Y. A survey on computational spectral reconstruction methods from RGB to hyperspectral imaging. Sci. Rep. 2022, 12, 1–17. [Google Scholar]
- Ershov, E.; Savchik, A.; Shepelev, D.; Banić, N.; Brown, M.S.; Timofte, R.; Mudenagudi, U. NTIRE 2022 challenge on night photography rendering. In Proceedings of the IEEE/CVF Conference on Computer Vision and Pattern Recognition, New Orleans, LA, USA, 18–24 June 2022; pp. 1287–1300. [Google Scholar]
- Hendley, C.M.; Hecht, S. The colors of natural objects and terrains, and their relation to visual color deficiency. J. Opt. Soc. Am. 1949, 39, 870–873. [Google Scholar] [CrossRef]
- Burton, G.J.; Moorhead, I.R. Color and spatial structure in natural scenes. Appl. Opt. 1987, 26, 157–170. [Google Scholar] [CrossRef]
- Nascimento, S.M.C.; Ferreira, F.P.; Foster, D.H. Statistics of spatial cone-excitation ratios in natural scenes. J. Opt. Soc. Am. A—Opt. Image Sci. Vis. 2002, 19, 1484–1490. [Google Scholar] [CrossRef]
- Webster, M.A.; Mollon, J.D. Adaptation and the color statistics of natural images. Vis. Res. 1997, 37, 3283–3298. [Google Scholar] [CrossRef] [PubMed]
- Juricevic, I.; Webster, M.A. Variations in normal color vision, simulations of adaptation to natural color environments. Vis. Neurosci. 2009, 26, 133–145. [Google Scholar] [CrossRef] [PubMed]
- Foster, D.H.; Marín-Franch, I.; Amano, K.; Nascimento, S.M.C. Approaching ideal observer efficiency in using color to retrieve information from natural scenes. J. Opt. Soc. Am. A—Opt. Image Sci. Vis. 2009, 26, B14–B24. [Google Scholar] [CrossRef] [PubMed]
- Marín- Franch, I.; Foster, D.H. Number of perceptually distinct surface colors in natural scenes. J. Vis. 2010, 10, 91–97. [Google Scholar] [CrossRef] [PubMed]
- Foster, D.H. Color constancy. Vis. Res. 2011, 5, 674–700. [Google Scholar] [CrossRef] [PubMed]
- Sharma, G.; Eduardo, C. The Dark Side of CIELAB. In Proceedings of the Color Imaging XVII: Displaying, Processing, Hardcopy, and Applications, 82920D, IS&T/SPIE Electronic Imaging, Burlingame, CA, USA, 22–26 January 2012; Volume 8292. [Google Scholar]
- Verdu, F.; Pujol, J.; Capilla, P. Calculation of the color Matching Functions of Digital Cameras from Their Complete Spectral Sensitivities. J. Img. Sc. Tech. 2002, 46, 15–25. [Google Scholar]
- Oren, M.; Nayar, S.K. Generalization of Lambert’s Reflection Model; Proc. of ACM SIGGRAPH: Orlando, FL, USA, 1994. [Google Scholar]
- Nayar, S.K.; Oren, M. Generalization of the Lambertian Model and Implications for Machine Vision. Int. J. Comput. Vis. 1995, 14, 227–251. [Google Scholar]
- Khandual, A.; Baciu, G.; Rout, N. Colorimetric processing of digital color image! Int. J. Adv. Res. Comput. Sci. Softw. Eng. 2013, 3, 103–107. [Google Scholar]
- Khandual, A.; Baciu, G.; Hu, J.; Zeng, E. Color Characterization for Scanners: Dpi and Color Co-Ordinate Issues. Int. J. Adv. Res. Comput. Sci. Softw. Eng. 2012, 2, 354–365. [Google Scholar]
- Cheung, V.; Westland, S.; Connah, D.; Ripamonti, C. A comparative study of the characterisation of color cameras by means of neural networks and polynomial transforms. Color. Technol. 2004, 120, 19–25. [Google Scholar] [CrossRef]
- Shen, H.L.; Mou, T.S.; Xin, J.H. Colorimetric characterization of scanner by measures of perceptual color error. J. Electron. Imaging 2006, 15, 1–5. [Google Scholar]
- Ran, J.; Liu, H.; Luo, J. The color matching design based on polynomial regression. Text. Res. J. 2022, 92, 1235–1245. [Google Scholar] [CrossRef]
- Hong, G.W.; Luo, M.R.; Rhodes, P.A. A study of digital camera colorimetric characterization based on polynomial modeling. Color Res. Appl. 2001, 26, 76–84. [Google Scholar]
- Chou, Y.F.; Luo, M.R.; Li, C.; Cheung, V.; Lee, S.L. Methods for designing characterisation targets for digital cameras. Color. Technol. 2013, 129, 203–213. [Google Scholar] [CrossRef]
- Liu, L.; Xie, X.; Zhang, Y.; Cao, F.; Liang, J.; Liao, N. Colorimetric characterization of color imaging systems using a multi-input PSO-BP neural network. Color Res. Appl. 2022, 47, 855–865. [Google Scholar] [CrossRef]
- Wang, H.; Yang, J.; Xue, B.; Yan, X.; Tao, J. A novel color calibration method of multi-spectral camera based on normalized RGB color model. Results Phys. 2020, 19, 103498. [Google Scholar] [CrossRef]
- Bondi, L.; Baroffio, L.; Güera, D.; Bestagini, P.; Delp, E.J.; Tubaro, S. First steps toward camera model identification with convolutional neural networks. IEEE Signal Process. Lett. 2016, 24, 259–263. [Google Scholar] [CrossRef]
- Lukac, R. (Ed.) Single-Sensor Imaging: Methods and Applications for Digital Cameras; CRC Press: Boca Raton, FL, USA, 2018. [Google Scholar]
- Nayak, S.; Khandual, A.; Mishra, J. Ground truth study on fractal dimension of color images of similar texture. J. Text. Inst. 2018, 109, 1159–1167. [Google Scholar] [CrossRef]
- Menna, F.; Nocerino, E.; Remondino, F. Flat versus hemispherical dome ports in underwater photogrammetry. The International Archives of Photogrammetry. Remote Sens. Spat. Inf. Sci. 2017, 42, 481. [Google Scholar]
- Yao, P. Advanced textile image analysis based on multispectral color reproduction. Ph.D. Dissertation, HKPolyU, Hung Hom, Hong Kong, 2022. [Google Scholar]
- Sciuto, G.L.; Susi, G.; Cammarata, G.; Capizzi, G. A spiking neural network-based model for anaerobic digestion process. In Proceedings of the 2016 International Symposium on Power Electronics, Electrical Drives, Automation and Motion (SPEEDAM), Capri, Italy, 22–24 June 2016; IEEE: Piscataway, NJ, USA; pp. 996–1003.
- Tuccitto, N.; Bombace, A.; Torrisi, A.; Licciardello, A.; Sciuto, G.L.; Capizzi, G.; Woźniak, M. Probabilistic neural network-based classifier of ToF-SIMS single-pixel spectra. Chemom. Intell. Lab. Syst. 2019, 191, 138–142. [Google Scholar] [CrossRef]
- Technical Guide: Integrating Sphere Theory and applications, LabShpere. Available online: https://mmrc.caltech.edu/Cary%20UV-Vis%20Int.Sphere/Literature/labsphere%20Theory%20and%20App.pdf (accessed on 1 September 2022).
Publisher’s Note: MDPI stays neutral with regard to jurisdictional claims in published maps and institutional affiliations. |
© 2022 by the authors. Licensee MDPI, Basel, Switzerland. This article is an open access article distributed under the terms and conditions of the Creative Commons Attribution (CC BY) license (https://creativecommons.org/licenses/by/4.0/).