Abstract
The coronavirus disease pandemic (COVID-19) is a contemporary disease. It first appeared in 2019 and has sparked a lot of attention in the public media and recent studies due to its rapid spread around the world in recent years and the fact that it has infected millions of individuals. Many people have died in such a short time. In recent years, several studies in artificial intelligence and machine learning have been published to aid clinicians in diagnosing and detecting viruses before they spread throughout the body, recovery monitoring, disease prediction, surveillance, tracking, and a variety of other applications. This paper aims to use chest X-ray images to diagnose and detect COVID-19 disease. The dataset used in this work is the COVID-19 RADIOGRAPHY DATABASE, which was released in 2020 and consisted of four classes. The work is conducted on two classes of interest: the normal class, which indicates that the person is not infected with the coronavirus, and the infected class, which suggests that the person is infected with the coronavirus. The COVID-19 classification indicates that the person has been infected with the coronavirus. Because of the large number of unbalanced images in both classes (more than 10,000 in the normal class and less than 4000 in the COVID-19 class), as well as the difficulties in obtaining or gathering more medical images, we took advantage of the generative network in this project to produce fresh samples that appear real to balance the quantity of photographs in each class. This paper used a conditional generative adversarial network (cGAN) to solve the problem. In the Data Preparation Section of the paper, the architecture of the employed cGAN will be explored in detail. As a classification model, we employed the VGG16. The Materials and Methods Section contains detailed information on the planning and hyperparameters. We put our improved model to the test on a test set of 20% of the total data. We achieved 99.76 percent correctness for both the GAN and the VGG16 models with a variety of preprocessing processes and hyperparameter settings.
1. Introduction
Coronavirus is a novel disease that emerged in 2019. The COVID-19 disease initially appeared in Wuhan, China. After that, it spread worldwide. In just over a year, the number of individuals infected with COVID-19 had topped 450 million, with more than six million deaths reported in more than 200 countries. Moreover, the World Health Organization [1] recognizes this number of cases, but in reality, the number of individuals diseased with the coronavirus is perhaps much more complex than what is mentioned. Infection caused by COVID-19 can result in many complications, such as acute respiratory distress syndrome (ARDS), pneumonia, septic shock, multi-organ failure, lung injury, acute liver injury, etc. Moreover, besides the damages, symptoms, and effects caused by COVID-19, it has caused global economic damage worldwide due to business closures and reduced productivity. There have been many tests that have been used [2] to test for positivity or negativity against COVID-19, such as molecular tests, which take a sample from the throat, the nose, or both using a cotton swab, and the PCR test, which is the most common test used among other tests. It also works by taking a sample from the patient to detect infection with COVID-19 or not. Rapid diagnostic tests (RDT) see the presence of viral proteins. Moreover, the virus can be detected through chest X-rays, C.T. scans, and many other ways. Artificial intelligence and machine learning have shown much progress in many applications, such as patient diagnosis and recovery from the COVID-19 pandemic. Many research papers have been released in the past two years to address the COVID-19 pandemic by helping and assisting doctors and replacing the manual process of detecting, diagnosing, and tracking patients through effective automatic ways.
Modern artificial intelligence (A.I.) uses machine-learning algorithms to find patterns and relationships in data, as opposed to knowledge-based A.I. from previous generations, which relied on professionals’ prior medical knowledge and formulation-based rules [3,4,5]. Deep learning, which uses a large, labeled dataset to train an artificial neural network, has a significant impact on A.I.’s recent comeback [3,4,5]. A sophisticated deep-learning network typically contains numerous hidden layers [6]. Because of the recent response of A.I., many people are now wondering whether robot doctors will take the place of human doctors shortly. In the meantime, experts think that AI-driven intelligent systems may considerably assist doctors in making better judgments (e.g., radiography) and even eliminate the need for human decisions [7]. The recent success of A.I. in healthcare may be attributed to increased healthcare data due to the more significant usage of digital technologies and big data analytics. Because of the widespread use of mobile devices, it is now much simpler to gather and obtain these data using mobile apps [8]. Even though A.I. research in healthcare is on the rise, most studies focus on cancer, neurology, and cardiovascular disease. With evidence-based A.I., medical data may be mined for insights that can be utilized for decision making and forecasting [9,10,11]. Researchers believe that artificial intelligence (A.I.) might be valuable in the battle against COVID-19, given its success in healthcare. Artificial Intelligence (A.I.) has revolutionized healthcare by predicting pandemics and creating antiviral compounds. According to recent studies, A.I. can detect COVID-19 infection and infected populations, as well as future breakout, attack patterns, and even treatment [12,13,14]. In the last few years, A.I. [15], such as biological data mining and machine-learning (ML) techniques [16], has been used to help with detection, diagnosis, classification, and vaccine development for COVID-19 [17].
The new coronavirus infection may be diagnosed using artificial intelligence tactics such as case-based reasoning (CBR) [18], latent semantic transformation (LSTM) [19], and sentiment analysis [20]. On the other hand, the CNN model’s techniques are more successful and promising. Since a significant deal of research has been conducted on using CNN to recognize and categorize COVID-19 in digital images, the deep-learning model has appeared as one of the most often used and successful ways, as indicated by the results of recent studies on the topic [21,22,23,24,25,26,27,28,29]. COVID-19 may be diagnosed with clinical pictures, C.T. scans of the chest, and X-rays of the chest. Because of the system’s capacity to automatically learn qualities from digital photos, it has been shown to be very successful. Deep machine-learning algorithms have a lot of advantages, and it would be beneficial to examine how they may be improved for even greater efficiency. When building CNNs and other image-processing algorithms, past research did not pay enough attention to selecting hyperparameters.
We focused on recognizing X-rays using convolution neural networks (CNNs) and the generation of chest X-ray images in this work due to the limited number of photos available, mainly medical photographs, which are difficult to gather manually. The generative adversarial network (GAN), one of the most influential and innovative methods for creating realistic images, is used to generate chest X-ray images. Using GAN, working with little datasets and rendering images is also highly powerful and successful. As a result, GAN improves classification accuracy by increasing and balancing the number of images in the dataset.
The significant contributions of the work can be summarized as follows:
- Using a CGAN model to create COVID -19 images ensures that the classes in the dataset are distributed evenly.
- Development of a modified VGG16 model to maximize the learning ability to classify chest X-rays. The suggested deep-learning model is based on a pre-trained model. To detect COVID-19 patients using CXR pictures, the created model uses the VGG16 CNN with frozen feature extraction layers. Compared to the majority of earlier efforts, the upgraded version of our design performs substantially better.
- A comparison also shows how the data generation with cGAN contributes to the model’s accuracy. The VGG16 with cGAN surpassed the same VGG16 architecture developed on an imbalanced dataset.
- Proven the utility of the developed model in hospitals and medical centers for early diagnosis of COVID-19.
The Abstract summarizes the main aspects of the paper and the obtained results. The Section 1 is the Introduction, followed by the Section 2, the Literature Review, which shows the current state-of-the-art works. Then, Section 3 is Materials and Methods, which has a Dataset subsection (Section 3.1) with its description and the number of images in detail. The Section 3.4 discusses the proposed methodologies used too. The Section 3.5 discusses the results obtained after using the GAN and modified VGG16 architecture. Then, the Section 4 is dedicated to the discussion, which includes comparative analysis. The Section 5 is the conclusion, which states what we have reached.
2. Literature Review
The coronavirus illness (COVID-19) has become one of the world’s most well-known and challenging problems in the last two years. The coronavirus has affected more than 200 countries. It has infected millions of people, and many others have died from the virus [30]. To fight against COVID-19, many other types of research have been published that introduce innovative solutions and techniques for COVID-19, especially in early detection and diagnosis, drug discovery, and many other areas. Section 2 will emphasize our investigation on the research directing COVID-19 analysis and detection from chest X-ray images.
In [1], CovidGAN sought to produce synthetic chest X-ray images using the GAN classification technique. This network obtained 95% accuracy, 90% sensitivity, and 97% specificity using the combination of three databases (COVID-19 Radiography Database, COVID-19 Chest X-ray Dataset Initiative, and IEEE8023/Covid Chest X-Ray Dataset) with roughly 80% training and 20% testing data. All three of the fine-tuned CNNs achieved accuracy > 99%, sensitivity from 98% (AlexNet) to 100% (GoogLeNet and SqueezeNet), and specificity > 99% using the same database.
In [31], the X-ray images are classified into three classes—normal, bacterial pneumonia, and COVID-19. With roughly 89% (3697 pictures) training, validation (462 images), and testing data and 11% (459 images) testing data, Bayes-SqueezeNet employed the COVID-19 Radiography Database (Kaggle) and IEEE8023/Covid Chest X-Ray Dataset. Data augmentation was used for the network training. The accuracy, specificity, and F1 scores were 98%, 99%, and 0.98, respectively.
The authors of [21] used the IEEE8023/Covid Chest X-Ray Dataset and Chestx-ray8 Database [27] to perform 3-class classification and 2-class classification (COVID-19 and no-findings) (COVID-19, no-findings, and pneumonia). For the 2-class classification, DarkCovidNet achieved accuracy = 98%, sensitivity = 95%, specificity = 95%, precision = 98%, and F1 score = 0.97 using fivefold cross-validation (80% training and 20% testing).
Moreover, in [23], VGG-19, MobileNet-v2, Inception, Xception, and Inception ResNet-v2 were implemented for the classification of COVID-19. The networks were trained and tested using the IEEE8023/Covid Chest X-Ray Dataset and other chest X-rays collected on the internet. The best 10 cross-validation (90% training and 10% testing) results obtained from the VGG-19 were accuracy = 98.75% for the 2-class classification and 93.48% for the 3-class classification, using the COVID-19 Radiography Database. Some of the studies conducted on features are [32,33].
CNN was used by Polsinelli et al. [34] to identify the virus that causes a bacterial infection—COVID-19. A pre-trained CNN encoder and machine-learning algorithms were used to extract feature representations from the data. The suggested technique has been found to improve COVID-19 detection accuracy by 95.6%. For COVID-19 diagnosis, Shorfuzzaman and Hossain [35] recommended using VGG-16 fast regions with CNNs (R-VGG-16). In X-ray pictures, R-VGG-16 was utilized to distinguish COVID-19. R-VGG-16 has a 97.36 percent accuracy rate in identifying COVID-19 patients. A CNN ResNet version created by Karthik et al. [36] was utilized to determine the new COVID-19 virus in C.T. scans. With the help of ResNet, researchers could accurately notice COVID-19 from C.T. scan images with a correctness rate of 95.09%.
Similarly, [37] used the grey wolf optimization approach to identify COVID-19 patients in a CNN architecture. Accordingly, grey wolf optimization was employed in this work to optimize CNN hyperparameters and create an archetype for COVID-19 recognition. Utilizing X-ray pictures as input, the updated CNN could correctly spot COVID-19 with a correctness value of 97.78 percent. Using a mixture of 3D and 2D CNNs, another work [38] recognized COVID-19 in X-ray pictures [39]. This model’s training and merging method employed a CNN, a depth-wise separable convolution layer, and a spatial pyramid pooling module. COVID-19 can be detected 96.71 percent of the time using the suggested method, according to the findings. Bayoudh and coworkers [39] used a transfer-learning-based CNN to identify COVID-19 in X-ray pictures. The YOLO predictor was employed to construct a computer-aided diagnostic tool for the simultaneous recognition and diagnosis of COVID-19 lung sickness from entire chest X-ray pictures, according to Al-antari et al. [40]. They used two different X-ray scans of the chest to evaluate their model. Evidence showed that it performed well in the fivefold tests for multiclass prediction problems. The CAD analyst attained a recognition and classification correctness of more than 90% after the experimental findings, demonstrating its ability to identify and classify COVID-19-contaminated locations accurately. Seven of the twelve current CNN designs were worse than SqueezeNet and DenseNetv2, and two were better; AlexNet and GoogleNet were superior to the proposed CNN architecture. In contrast, VGG16 and VGG19 were found to be inferior to them. For Majeed et al. [41], they created an online attention module that employed a 3D CNN to diagnose COVID-19 from C.T. scan images accurately, and their results have been published in Nature Communications.
Based on the above-conducted literature review, it is evident that the accuracy achieved so far is not that promising; moreover, there were so many challenges for computational complexity. So, we designed the below methodology to overcome all these shortcomings.
3. Materials and Methods
3.1. Dataset
COVID-19 RADIOGRAPHY DATABASE is the dataset used. A team of investigators from Qatar University released this dataset in 2020 [42] in collaboration with the University of Dhaka. This COVID-19 RADIOGRAPHY DATABASE consists of 4 classes, which are COVID-19 positive cases, normal cases, non-COVID-19 lung infection, and the last one is viral pneumonia class. The dataset consists of about 21,200 images. The images are distributed among the classes in the following way. First, the number of images in the COVID-19 class is 3616, while the number of images in the normal class is 10,192. Next, the number of images in the non-COVID-19 lung infection class is 6012; finally, the number of images in the last class, the viral pneumonia class, is 1345 [43,44].
In this research, we will solely look at the classes that can help us determine whether or not a patient has COVID-19 by looking at the chest X-ray images in this dataset. Therefore, only the COVID-19 and normal classes with 3616 and 10,192 images were examined. Figure 1 shows random samples of the two classes in the dataset, and Figure 2 shows the data distribution (number of images) of the two classes in the dataset.
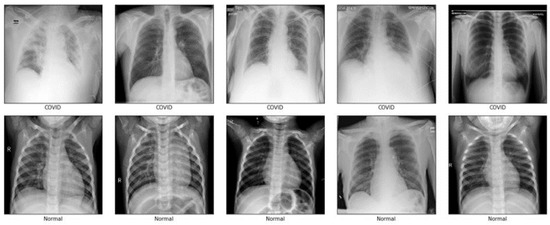
Figure 1.
Random samples of the two classes (COVID-19 class and normal class).
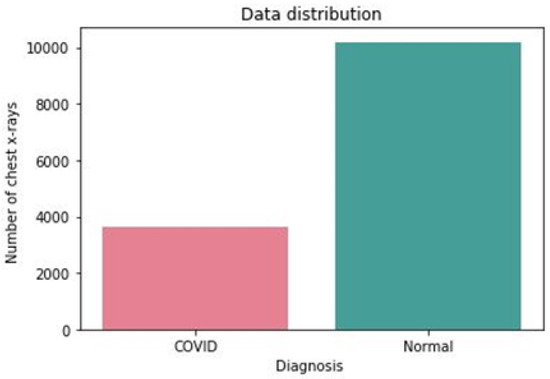
Figure 2.
Distribution of the two classes in the dataset.
As shown in Figure 2, the number of images of both classes is imbalanced as the COVID-19 class contains less than 4000 images, while the normal class contains above 10,000 images.
3.2. Data PreparationData Augmentation Using Conditional Gan
Data Augmentation Using Conditional Gan
Generative modeling is a branch of unsupervised learning widely used in machine learning and deep learning. The generative models try to learn the structure and distributions of the data to generate new ones that look like real data. GANs are applied in generating images, video generation, audio, text generation, image super-resolution, translation from one image mode to another, etc. The GAN architecture was introduced in 2014 by Goodfellow et al. [45].
GANs have been used widely in data generation and augmentation to deal with the unbalanced classes problem and small datasets problem. GANs have also been used widely in data augmentation in the medical field. In addition, GANs have been widely used in image generation in the medical field to improve classification accuracy, since manual data collection in the medical field is not easy to obtain [46].
We trained the discriminator using real images, for it to know which images are real. The discriminator decides if an image may look real. So, you tell it whether it is real or that it is fake. This way, you can obtain a discriminator that can differentiate between a poor-quality X-ray generated by the generator in the first epochs and the real ones in the dataset. This is performed until the generator generates perfect fake X-ray samples, which can fool the discriminator. So, with the help of the discriminator, the generator will know in which direction to go and will improve more and more by looking at the scores assigned by the discriminator.
So, the primary purpose of the generator and the discriminator networks is that the Generator tries to learn how to generate good fakes that look real so that the discriminator cannot decide whether an image is fake. So, the generator forges the fake images to look as realistic as possible, hoping to deceive the discriminator. The discriminator learns to differentiate between the real samples from the dataset and the fake ones generated by the generator network.
To make augmentations, we have used conditional GAN (cGAN) to address the problem of the unbalanced number of images in each class. As shown in Figure 3, our cGAN model was used for training both the generator and discriminator networks
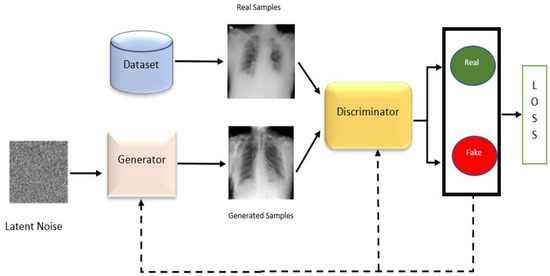
Figure 3.
GAN training for both generator and discriminator networks.
3.3. Data Preprocessing
Data preprocessing is an initial step to transforming our data into a proper structure before feeding them to the model. Many data preprocessing techniques were used to improve the accuracy of our model results.
- Formatting Images
We resized our images to a fixed size of 224 × 224 to be companionable with applying transfer learning with some models, such as the model used in this paper, which is VGG16.
- Eliminating the noise and flattening the images
Median filtering is applied to flatten the images and further decrease the noise. It is an effective technique which has dual ability to reduce the noise and also preserve the borders of the image.
- Data augmentation
Concerning the medical images which are applied in this study, image augmentation technique is applied to zoom, flip, and control the image brightness.
- Data balancing and filtration
Since our two classes were unbalanced, the normal class had more than 10,000 images, while the COVID-19 class had around 3500 images. As we mentioned, we used GANs for data generation for the COVID-19 class, and we applied random filtration for the normal-class images, achieving almost balanced classes: 6200 images in the COVID-19 class and about 7500 images in the normal class, which made our model much more generic on the test set.
- Splitting Dataset for Training and Testing
The dataset is split with the ratio of 80% training to 20% testing, where the raised model was trained on about 11,000 images and tested on about 2700 images. From the data allotted for training, 20% was separately kept for validation.
3.4. Proposed Methodology
The generator network was trained with the following procedure:
- First, the latent random noise is fed to the generator.
- Secondly, the generator produces an output image based on the given latent noise vector.
- The generated output image is fed to the discriminator network and is marked as an accurate sample trying to deceive and fool the discriminator.
- The binary cross-entropy loss function is calculated based on the probability of the output sigmoid layer in the discriminator network.
- Then, the gradients are calculated in the backpropagation step to update the generator weights only while the discriminator weights are not changed during the generator learning process.
The discriminator network is trained with the following procedure:
- The data from the dataset is fed to the discriminator network and marked as real samples, while the fakes samples from the generator network are marked as fake samples.
- The discriminator network is punished in the case of misclassifying the real samples coming from the dataset as fake. The discriminator network is penalized in the case of classifying the fake samples coming from the generator as real.
- The binary cross-entropy loss function is calculated based on the probability of the output sigmoid layer in the discriminator network.
- Then, the gradients are calculated in the backpropagation step to update the discriminator weights.
The training of the generator and discriminator networks (G and D) are performed simultaneously [47], where the goal of the generator is to update the parameters to minimize log(1—D(G(z)); on the other hand, the discriminator goal is to update the parameters to reduce logD(X). G is the parameters for generator, and D is the parameters for discriminator. x∼p_{data}, where x is the real data. By definition of G, G(z) is fake generated data. D(x) is the output of the discriminator for a real input x, and D(G(z)) is the output of the discriminator for fake generated data G(z).
We have used a modified architecture for the generator and discriminator that fits our input images’ shape and the best hyperparameters for our data. Figure 4 shows the generator and discriminator networks. The convolution layers in our discriminator network had strides equal to 2 to down-sample the feature map with half the size each time. The last layer used sigmoid activation to assign a probability to the given input image (this probability represents if the image given to the discriminator is real or fake). The transpose convolution layers were used in the generator network to up-sample the feature map with double the size each time. The activation function that is used in the final layer in the generator network is tanh. Leaky ReLU was used with alpha = 0.2 in both discriminator and generator to add non-linearity to our network. Our conditional GAN model was trained for 1200 epochs, and the optimizer used in both networks was Adam, with a learning rate of 0.0002.
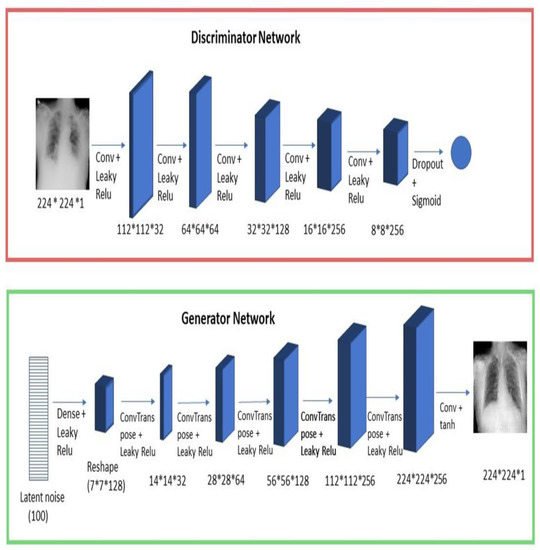
Figure 4.
Discriminator and generator networks.
The generator network in GANs at the early epochs almost produces noisy images, as shown in Figure 5. It took many epochs for the generator to begin learning the underlying structure of the data and be able to produce good fakes that look realistic and fool the discriminator. We can see in Figure 5 some of the random samples generated by the generator during the learning process at different epochs. We can see that the model continues to create more images that look real as the epochs increase. By the advantage of using cGAN, we have generated about 2600 images for the COVID-19 class to reach a total number of images of about 6200 images for the COVID-19 class. First, we trained the proposed conditional GAN model (cGAN) with the X-ray images in our COVID-19 category in the dataset to make the generator learn to produce new X-ray images belonging to the COVID-19 class to increase the images. In that class, the unbalanced problem of the two classes is solved. After the augmentation step, all the images in both classes are resized into 224 × 224.
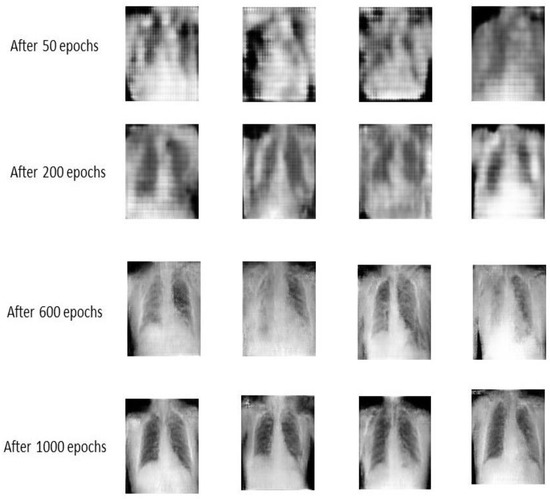
Figure 5.
Generator learning process.
3.5. VGG16 Architecture
VGG16 is a simple and widely used convolutional neural network (CNN) architecture that consists of 16 layers, with 13 layers convolutional layers used for feature extraction and 3 dense (fully connected) layers. VGG16 is used widely in many classification problems due to its simplicity and performance [48]. The VGG16 model is also pretrained on Google ImageNet dataset [49], so it can fine-tune the model rather than train the weights from scratch. The general VGG16 architecture is shown in Figure 6. The input to the network is a colored RGB image of size 224 × 224. The image is fed to a set of convolutional layers with filters, each of size 3 × 3. Those convolution layers are responsible for extracting features, and the number of filters applied on the produced feature maps increases as the network goes deeper to remove high-level features in the latest layers of the network. ReLu activation function is used on the feature map after each convolutional layer to add non-linearity to the network. The convolution layers output a feature map with the exact spatial resolution by setting the padding to 1 and the stride to 1. VGG16 network also consists of 5 MaxPooling layers with a window size 2 × 2 and a stride of 2, which are added after some convolutional layers. They are responsible for reducing the feature map by half the size each time so the input, which is 224 × 224, is reduced five times with half the size by each MaxPooling layer to reach a size of 7 × 7, as shown in Figure 6.
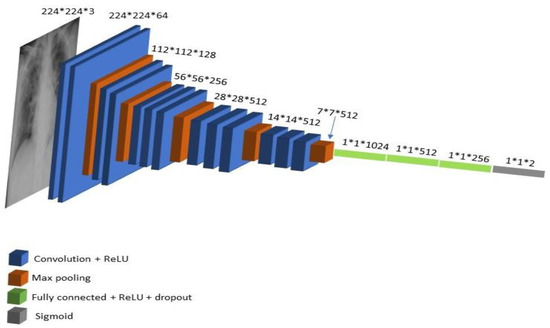
Figure 6.
VGG16 architecture.
The last feature map is flattened to a 1-d vector of size 7 × 7 × 512 and is passed through fully connected layers, and the final layer in the network is the softmax layer, which distributes probabilities among the classes. Altered VGG16 architecture layers, hyperparameters, optimizer, and so forth are shown in Table 1.

Table 1.
Summary of the modified VGG16 model.
3.6. Performance Evaluation
Precision: it is also named the positive predictive value. Precision is the portion of positive predictions separated by the entire number of positive class value forecasts. Equation (2) is used to calculate precision.
Recall is also recognized as sensitivity. It is the portion of positive predictions alienated by the quantity of positive class values. Equation (3) is used to calculate recall.
F1 score is also named the F-score or F-measure. It carries the equilibrium amid precision and recall. It associates precision and recall to guarantee that our model has high precision and has high recall. The worth of the F1 score becomes big only if the standards of precision and recall together are high. F1-score values fall in the interlude [0, 1] and the maximum the value, the improved the classification accuracy [50]. F1 score is calculated by Equation (4).
4. Results
The model performance was evaluated on the testing set by splitting the dataset into training and testing sets with 80 and 20%, respectively. We first made many preprocessing techniques, as we mentioned in the preprocessing section (Section 3.3), and then we used our modified VGG16 model to differentiate between normal and COVID-19 classes.
The model performed better on the normal-class images due to the difference in the number of images for each class, where the normal class has much more images than the COVID-19 class, as we mentioned in the Dataset subsection (Section 3.1).
Figure 7 displays the correctness of the training versus the correctness of the validation over 27 epochs on the altered VGG-16 model, while Figure 8 shows the losses of training and validation across 27 epochs on the altered VGG-16 model, whereas Figure 9 and Figure 10 show the accuracy and loss among 27 epochs for our modified VGG-16 model, but after using our cGAN model for generating images for the COVID-19 class.
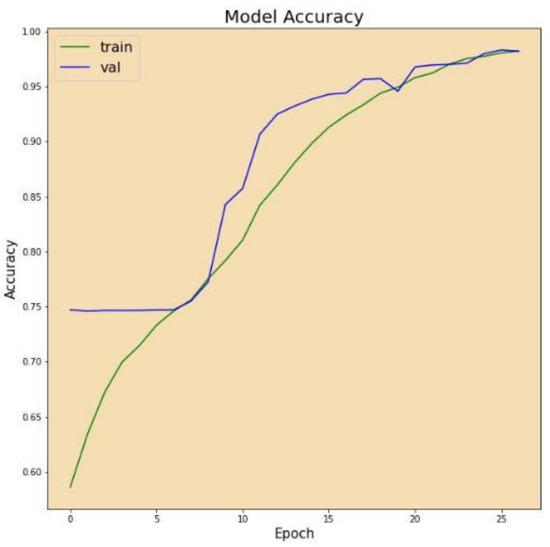
Figure 7.
Model accuracy before using cGAN.
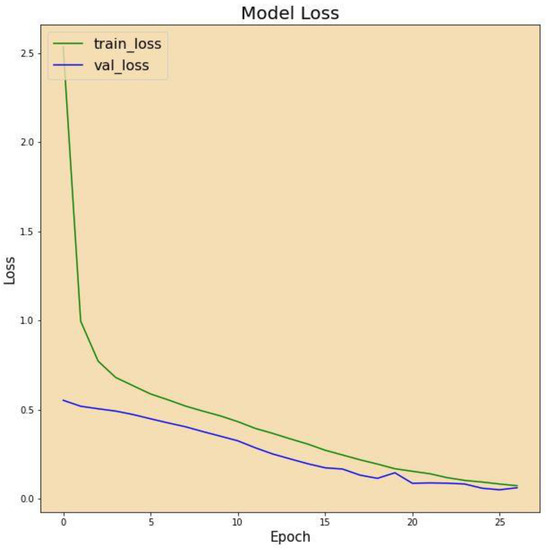
Figure 8.
Model loss before using cGAN.
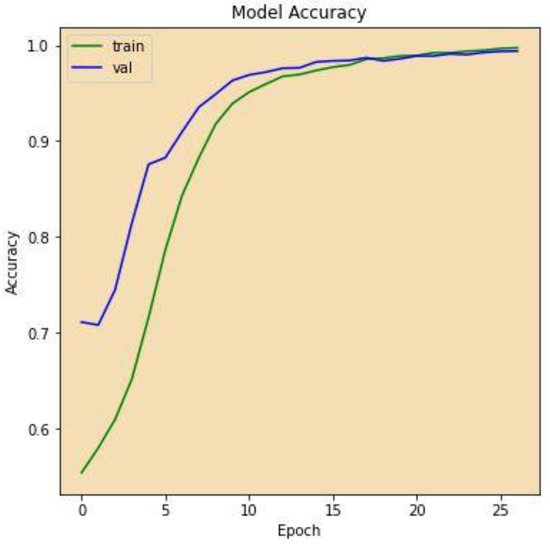
Figure 9.
Model accuracy after using cGAN.
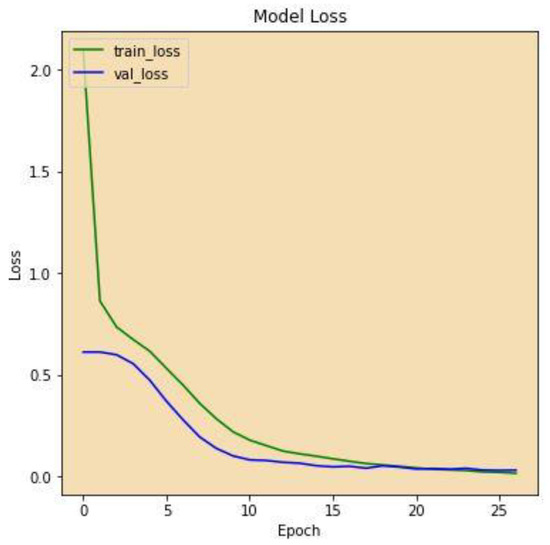
Figure 10.
Model Loss after using cGAN.
We can conclude from the figures that the model, when using cGAN, seems to be more stable and achieves higher accuracy and lower loss on the testing set.
We also evaluated our model based on parameters such as confusion matrix, precision, recall, F1 score, and ROC.
The confusion matrix tells us how our model performs with each class individually. The model is evaluated using these metrics to ensure that the model performs well in each class independently. The main difference is the accuracy metric, which measures the performance on the whole test set, which may be biased to one of the classes more than others. Figure 11 and Figure 12 show the confusion matrix of our VGG-16 model with and without using cGAN, respectively. The confusion matrix is an N*N matrix where N is the number of classes (two in our case).
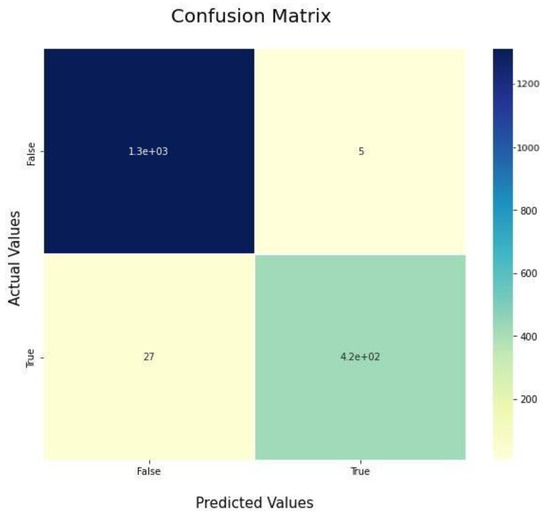
Figure 11.
Confusion matrix before using cGAN.
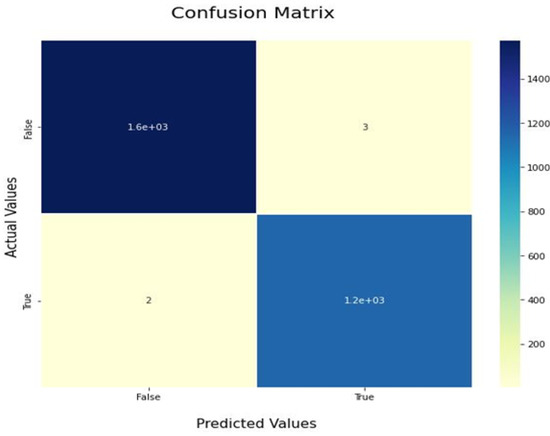
Figure 12.
Confusion matrix after using cGAN.
The confusion matrices show that the model performs much better for the COVID-19 class when using cGAN, as in Figure 11. We can see that out of the COVID-19 testing images, 27 of them were misclassified as being normal. In contrast, actually, they were cases of COVID-19. This refers to a type-II error and is treated as a crisis in the medical world, since if someone is diagnosed as normal and actually has COVID-19, he will be left without treatment, which may lead to further side effects or even death. After using the cGAN model and plotting our confusion matrix again, as shown in Figure 12, it can be seen that the number of patients misclassified as normal, while actually having COVID-19, is decreased from twenty-seven samples to only two samples, while also considering that the testing set after applying GANs is much larger for the COVID-19 class. In Figure 11, there are 27 cases misclassified as normal out of 420 total COVID-19 images. In Figure 12, there are 2 misclassified cases as normal out of 1200 total COVID-19 images. So, the misclassification ratio decreased from 0.065 to 0.0015 after applying our GAN model for data generation purposes.
In addition, we employed other assessment metrics such as precision and recall and F1 score to assess the proposed model separately concerning class independently for our two classes, normal and COVID-19.
As shown in Table 2 and Table 3, we can see that the model’s performance in terms of precision and recall and F1 score has improved slightly after using cGAN.

Table 2.
Model evaluation on different metrices before using cGAN.

Table 3.
Model evaluation on different metrices after using cGAN.
Another used metric for evaluation is the area under the curve (AUC), which measures a classifier’s ability to distinguish between classes by constructing a graph showing the model’s performance at different classification thresholds, where the AUC metric value represents the area under the graph. The more complex the AUC, the more improved the model’s efficiency at differentiating between the positive and negative classes. When AUC approaches one, the classifier can perfectly distinguish between the two classes.
The achieved AUC score on our classification model before using cGAN is 0.968. The achieved AUC score on our classification model after using cGAN is 0.99877. The summary of our results is shown in Table 4.

Table 4.
Overview of our obtained final results.
As shown in Table 5, our modified VGG16 has achieved an accuracy of about 98.6%, and when using conditional GAN to solve the unbalanced classes problem by performing data generation for the COVID-19 class to address and solve this problem, the accuracy has been improved to reach 99.76%.

Table 5.
Displays some of these investigations.
Comparative Analysis
We analyzed numerous recent papers that are closely connected to our findings.
One disadvantage of the present work is that, because the research involves medical images, we must understand the degree of error involved with each prediction. CNN has a default error since it is unable to provide the amount of inaccuracy associated with each prognosis. It is limited to expressing the probability of each class at the final softmax layer. This can be addressed in subsequent work. Additionally, there should be more focus on additional categories, such as viral pneumonia, bacterial pneumonia, and other lung illnesses, so that the model may be applied in practice.
5. Conclusions
The primary objective of the research was to construct a classification model capable of determining whether or not COVID-19 was present in the chest X-rays collected. The study used data from the COVID-19 RADIOGRAPHY DATABASE for training and testing. The study concentrated on two distinct groups of interest: normal and COVID-19. To address the issue of unbalanced classes, we used a variety of preprocessing strategies, including data generation using conditional GANs, to increase the number of images in the COVID-19 class. All images were resized to a fixed width and height of 224 × 224. A median filter of size 3 × 3 was used to smooth the image and remove noise. The acquired chest X-ray images were also enhanced using zooming, flipping, image brightness, and contrast. The training dataset contains approximately 11,000 images. The VGG16 model was pre-trained using Google ImageNet data. The model weights were fine-tuned using transfer learning rather than training our model from scratch. The model was validated on over 2700 images and achieved 99.78% accuracy. Additionally, we examined the model performance using metrics such as the confusion matrix, precision, recall, F1 score, and area under the curve (AUC) to confirm that our model performs well across all classes.
Author Contributions
M.H. did the implementation and so; M.A. worked on the problem statement and implementation idea and results visualization; A.K. started data searching, preprocessing, and implementation; H.E. started the manuscript drafting and designing; A.I.A.A. proofread and formatted the paper. All authors have read and agreed to the published version of the manuscript.
Funding
This research was funded by Princess Nourah bint Abdulrahman University researchers supporting project number (PNURSP2022R125), Princess Nourah bint Abdulrahman University, Riyadh, Saudi Arabia.
Data Availability Statement
The dataset used in this study is publicly available at https://www.kaggle.com/datasets/tawsifurrahman/covid19-radiography-database (accessed on 24 October 2022).
Conflicts of Interest
The authors declare no conflict of interest.
References
- Waheed, A.; Goyal, M.; Gupta, D.; Khanna, A.; Al-Turjman, F.; Pinheiro, P.R. Covidgan: Data augmentation using auxiliary classifier gan for improved COVID-19 detection. IEEE Access 2020, 8, 91916–91923. [Google Scholar] [CrossRef] [PubMed]
- Singh, B.; Datta, B.; Ashish, A.; Dutta, G. A comprehensive review on current COVID-19 detection methods: From lab care to point of care diagnosis. Sens. Int. 2021, 2, 100119. [Google Scholar] [CrossRef]
- Deo, R.C. Machine learning in medicine. Circulation 2015, 132, 1920–1930. [Google Scholar] [CrossRef]
- Sarker, I.H.; Kayes, A.S.M.; Watters, P. Effectiveness analysis of machine learning classification models for predicting personalized context-aware smartphone usage. J. Big Data 2019, 6, 57. [Google Scholar] [CrossRef]
- Sarker, I.H.; Kayes, A.S.M. ABC-RuleMiner: User behavioral rule-based machine learning method for context-aware intelligent services. J. Netw. Comput. Appl. 2020, 168, 102762. [Google Scholar] [CrossRef]
- Yu, K.-H.; Beam, A.L.; Kohane, I.S. Artificial intelligence in healthcare. Nat. Biomed. Eng. 2018, 2, 719–731. [Google Scholar] [CrossRef] [PubMed]
- Jiang, F.; Jiang, Y.; Zhi, H.; Dong, Y.; Li, H.; Ma, S.; Wang, Y.; Dong, Q.; Shen, H.; Wang, Y. Artificial intelligence in healthcare: Past, present and future. Stroke Vasc. Neurol. 2017, 2, 230–243. [Google Scholar] [CrossRef]
- Islam, M.N.; Islam, I.; Munim, K.M.; Islam, A.K.M.N. A review on the mobile applications developed for COVID-19: An exploratory analysis. IEEE Access 2020, 8, 145601–145610. [Google Scholar] [CrossRef]
- Murdoch, T.B.; Detsky, A.S. The inevitable application of big data to health care. JAMA 2013, 309, 1351–1352. [Google Scholar] [CrossRef]
- Kolker, E.; Özdemir, V.; Kolker, E. How healthcare can refocus on its super-customers (patients, n= 1) and customers (doctors and nurses) by leveraging lessons from Amazon, Uber, and Watson. Omics A J. Integr. Biol. 2016, 20, 329–333. [Google Scholar] [CrossRef] [PubMed]
- Dilsizian, S.E.; Siegel, E.L. Artificial intelligence in medicine and cardiac imaging: Harnessing big data and advanced computing to provide personalized medical diagnosis and treatment. Curr. Cardiol. Rep. 2014, 16, 441. [Google Scholar] [CrossRef]
- Hu, Z.; Ge, Q.; Li, S.; Jin, L.; Xiong, M. Artificial intelligence forecasting of COVID-19 in china. arXiv 2020, arXiv:2002.07112. [Google Scholar] [CrossRef]
- Wang, S.; Kang, B.; Ma, J.; Zeng, X.; Xiao, M.; Guo, J.; Cai, M.; Yang, J.; Li, Y.; Meng, X.; et al. A deep learning algorithm using C.T. images to screen for Corona Virus Disease (COVID-19). Eur. Radiol. 2021, 31, 6096–6104. [Google Scholar] [CrossRef]
- Rao, A.S.R.S.; Vazquez, J.A. Identification of COVID-19 can be quicker through artificial intelligence framework using a mobile phone--based survey when cities and towns are under quarantine. Infect. Control Hosp. Epidemiol. 2020, 41, 826–830. [Google Scholar]
- Albahri, O.S.; Zaidan, A.A.; Albahri, A.S.; Zaidan, B.B.; Abdulkareem, K.H.; Al-Qaysi, Z.T.; Alamoodi, A.H.; Aleesa, A.M.; Chyad, M.A.; Alesa, R.M.; et al. Systematic review of artificial intelligence techniques in the detection and classification of COVID-19 medical images in terms of evaluation and benchmarking: Taxonomy analysis, challenges, future solutions and methodological aspects. J. Infect. Public Health 2020, 13, 1381–1396. [Google Scholar] [CrossRef]
- Albahri, A.S.; Hamid, R.A.; Al-qays, Z.T.; Zaidan, A.A.; Zaidan, B.B.; Albahri, A.O.; AlAmoodi, A.H.; Khlaf, J.M.; Almahdi, E.M.; Thabet, E.; et al. Role of biological data mining and machine learning techniques in detecting and diagnosing the novel Coronavirus (COVID-19): A systematic review. J. Med. Syst. 2020, 44, 122. [Google Scholar] [CrossRef] [PubMed]
- Kannan, S.; Subbaram, K.; Ali, S.; Kannan, H. The role of artificial intelligence and machine learning techniques: Race for COVID-19 vaccine. Arch. Clin. Infect. Dis. 2020, 15, e103232. [Google Scholar] [CrossRef]
- Oyelade, O.N.; Ezugwu, A.E. A case-based reasoning framework for early detection and diagnosis of novel Coronavirus. Inform. Med. Unlocked 2020, 20, 100395. [Google Scholar] [CrossRef] [PubMed]
- Obaid, O.I.; Mohammed, M.A.; Mostafa, S.A. Long Short-Term Memory Approach for Coronavirus Disease Predicti. J. Inf. Technol. Manag. 2020, 12, 11–21. [Google Scholar]
- Albahli, A.S.; Algsham, A.; Aeraj, S.; Alsaeed, M.; Alrashed, M.; Rauf, H.T.; Arif, M.; Mohammed, M.A. COVID-19 public sentiment insights: A text mining approach to the Gulf countries. Cmc-Comput. Mater. Contin. 2021, 67, 1613–1627. [Google Scholar] [CrossRef]
- Ozturk, T.; Talo, M.; Yildirim, E.A.; Baloglu, U.B.; Yildirim, O.; Acharya, U.R. Automated detection of COVID-19 cases using deep neural networks with X-ray images. Comput. Biol. Med. 2020, 121, 103792. [Google Scholar] [CrossRef] [PubMed]
- Wang, L.; Lin, Z.Q.; Wong, A. COVID-net: A tailored deep convolutional neural network design for detection of COVID-19 cases from chest x-ray images. Sci. Rep. 2020, 10, 19549. [Google Scholar] [CrossRef] [PubMed]
- Apostolopoulos, I.D.; Mpesiana, T.A. COVID-19: Automatic detection from x-ray images utilizing transfer learning with convolutional neural networks. Phys. Eng. Sci. Med. 2020, 43, 635–640. [Google Scholar] [CrossRef] [PubMed]
- Khan, A.I.; Shah, J.L.; Bhat, M.M. CoroNet: A deep neural network for detection and diagnosis of COVID-19 from chest x-ray images. Comput. Methods Programs Biomed. 2020, 196, 105581. [Google Scholar] [CrossRef] [PubMed]
- Tartaglione, E.; Barbano, C.A.; Berzovini, C.; Calandri, M.; Grangetto, M. Unveiling COVID-19 from chest X-ray with deep learning: A hurdles race with small data. Int. J. Environ. Res. Public Health 2020, 17, 6933. [Google Scholar] [CrossRef]
- Abbas, A.; Abdelsamea, M.M.; Gaber, M.M. Classification of COVID-19 in chest X-ray images using DeTraC deep convolutional neural network. Appl. Intell. 2021, 51, 854–864. [Google Scholar] [CrossRef]
- Ezugwu, A.E.; Hashem, I.A.; Al-Garadi, M.A.; Abdullahi, I.N.; Otegbeye, O.; Shukla, A.K.; Chiroma, H.; Oyelade, O.N.; Almutari, M. A machine learning solution framework for combatting COVID-19 in smart cities from multiple dimensions. MedRxiv 2020. [Google Scholar] [CrossRef]
- Mohammed, M.A.; Abdulkareem, K.H.; Al-Waisy, A.S.; Mostafa, S.A.; Al-Fahdawi, S.; Dinar, A.M.; Alhakami, W.; Abdullah, B.A.; Al-Mhiqani, M.N.; Alhakami, H.; et al. Benchmarking methodology for selection of optimal COVID-19 diagnostic model based on entropy and TOPSIS methods. IEEE Access 2020, 8, 99115–99131. [Google Scholar] [CrossRef]
- Abed, M.; Mohammed, K.H.; Abdulkareem, G.Z.; Begonya, M.; Salama, A.; Maashi, M.S.; Al-Waisy, A.S.; Ahmed, M.; Subhi, A.A.; Mutlag, L. A comprehensive investigation of machine learning feature extraction and classification methods for automated diagnosis of COVID-19 based on X-ray images. Comput. Mater. Contin. 2021, 66, 3289–3310. [Google Scholar]
- Wang, L.; Zhang, Y.; Wang, D.; Tong, X.; Liu, T.; Zhang, S.; Huang, J.; Zhang, L.; Chen, L.; Fan, H.; et al. Artificial intelligence for COVID-19: A systematic review. Front. Med. 2021, 8, 1457. [Google Scholar] [CrossRef]
- Ucar, F.; Korkmaz, D. COVIDiagnosis-Net: Deep Bayes-SqueezeNet based diagnosis of the coronavirus disease 2019 (COVID-19) from X-ray images. Med. Hypotheses 2020, 140, 109761. [Google Scholar] [CrossRef] [PubMed]
- Sakkari, M.; Hamdi, M.; Elmannai, H.; AlGarni, A.; Zaied, M. Feature Extraction-Based Deep Self-Organizing Map. Circuits Syst. Signal Processing 2022, 41, 2802–2824. [Google Scholar] [CrossRef]
- Elmannai, H.; Hamdi, M.; AlGarni, A. Deep learning models combining for breast cancer histopathology image classification. Int. J. Comput. Intell. Syst. 2021, 14, 1003. [Google Scholar] [CrossRef]
- Polsinelli, M.; Cinque, L.; Placidi, G. A light CNN for detecting COVID-19 from C.T. scans of the chest. Pattern Recognit. Lett. 2020, 140, 95–100. [Google Scholar] [CrossRef] [PubMed]
- Shorfuzzaman, M.; Hossain, M.S. MetaCOVID: A Siamese neural network framework with contrastive loss for n-shot diagnosis of COVID-19 patients. Pattern Recognit. 2021, 113, 107700. [Google Scholar] [CrossRef] [PubMed]
- Karthik, R.; Menaka, R.; Hariharan, M. Learning distinctive filters for COVID-19 detection from chest X-ray using shuffled residual CNN. Appl. Soft Comput. 2021, 99, 106744. [Google Scholar] [CrossRef] [PubMed]
- Raajan, N.R.; Lakshmi, V.S.; Prabaharan, N. Non-invasive technique-based novel corona (COVID-19) virus detection using CNN. Natl. Acad. Sci. Lett. 2021, 44, 347–350. [Google Scholar] [CrossRef]
- Hira, S.; Bai, A.; Hira, S. An automatic approach based on CNN architecture to detect COVID-19 disease from chest X-ray images. Appl. Intell. 2021, 51, 2864–2889. [Google Scholar] [CrossRef]
- Bayoudh, K.; Hamdaoui, F.; Mtibaa, A. Hybrid-COVID: A novel hybrid 2D/3D CNN based on cross-domain adaptation approach for COVID-19 screening from chest X-ray images. Phys. Eng. Sci. Med. 2020, 43, 1415–1431. [Google Scholar] [CrossRef]
- Al-Antari, M.A.; Hua, C.-H.; Bang, J.; Lee, S. Fast deep learning computer-aided diagnosis of COVID-19 based on digital chest x-ray images. Appl. Intell. 2021, 51, 2890–2907. [Google Scholar] [CrossRef] [PubMed]
- Majeed, T.; Rashid, R.; Ali, D.; Asaad, A. Issues associated with deploying CNN transfer learning to detect COVID-19 from chest X-rays. Phys. Eng. Sci. Med. 2020, 43, 1289–1303. [Google Scholar] [CrossRef] [PubMed]
- COVID-19 Radiography Database. Available online: https://www.kaggle.com/datasets/tawsifurrahman/covid19-radiography-database (accessed on 24 October 2022).
- Chowdhury, M.E.; Rahman, T.; Khandakar, A.; Mazhar, R.; Kadir, M.A.; Mahbub, Z.B.; Islam, K.R.; Khan, M.S.; Iqbal, A.; Al Emadi, N.; et al. Can A.I. help in screening viral and COVID-19 pneumonia? IEEE Access 2020, 8, 132665–132676. [Google Scholar] [CrossRef]
- Rahman, T.; Khandakar, A.; Qiblawey, Y.; Tahir, A.; Kiranyaz, S.; Kashem, S.B.; Islam, M.T.; Al Maadeed, S.; Zughaier, S.M.; Khan, M.S.; et al. Exploring the effect of image enhancement techniques on COVID-19 detection using chest X-ray images. Comput. Biol. Med. 2021, 132, 104319. [Google Scholar] [CrossRef]
- Goodfellow, I.; Pouget-Abadie, J.; Mirza, M.; Xu, B.; Warde-Farley, D.; Ozair, S.; Courville, A.; Bengio, Y. Generative adversarial nets. Adv. Neural Inf. Process. Syst. 2014, 27, 139–144. [Google Scholar]
- Wickramaratne, S.D.; Mahmud, M.S. Conditional-GAN Based Data Augmentation for Deep Learning Task Classifier Improvement Using fNIRS Data. Front. Big Data 2021, 4, 659146. [Google Scholar] [CrossRef]
- Mirza, M.; Osindero, S. Conditional generative adversarial nets. arXiv 2014, arXiv:1411.1784. [Google Scholar]
- Simonyan, K.; Zisserman, A. Very deep convolutional networks for large-scale image recognition. arXiv 2014, arXiv:1409.1556. [Google Scholar]
- Deng, J.; Dong, W.; Socher, R.; Li, L.-J.; Li, K.; Fei-Fei, L. Imagenet: A large-scale hierarchical image database. In Proceedings of the 2009 IEEE Conference on Computer Vision and Pattern Recognition, Miami, FL, USA, 20–25 June 2009; pp. 248–255. [Google Scholar]
- Sokolova, M.; Japkowicz, N.; Szpakowicz, S. Beyond accuracy, F-score and ROC: A family of discriminant measures for performance evaluation. In Australasian Joint Conference on Artificial Intelligence; Springer: Berlin/Heidelberg, Germany, 2006; pp. 1015–1021. [Google Scholar]
Publisher’s Note: MDPI stays neutral with regard to jurisdictional claims in published maps and institutional affiliations. |
© 2022 by the authors. Licensee MDPI, Basel, Switzerland. This article is an open access article distributed under the terms and conditions of the Creative Commons Attribution (CC BY) license (https://creativecommons.org/licenses/by/4.0/).