Article

Building Security Awareness of Interdependent Services, Business Processes, and Systems in Cyberspace

NASK —National Research Institute, 01-045 Warsaw, Poland
*
Author to whom correspondence should be addressed.
Electronics 2022, 11(22), 3835; https://doi.org/10.3390/electronics11223835
Submission received: 30 September 2022 / Revised: 14 November 2022 / Accepted: 18 November 2022 / Published: 21 November 2022
(This article belongs to the Special Issue Cybersecurity and Data Science, Volume II)

Abstract

:
Protection against a growing number of increasingly sophisticated and complex cyberattacks requires the real-time acquisition of up-to-date information on identified threats and their potential impact on an enterprise’s operation. However, the complexity and variety of IT/OT infrastructure interdependencies and the business processes and services it supports significantly complicate this task. Hence, we propose a novel solution here that provides security awareness of critical infrastructure entities. Appropriate measures and methods for comprehensively managing cyberspace security and resilience in an enterprise are provided, and these take into account the aspects of confidentiality, availability, and integrity of the essential services offered across the underlying business processes and IT infrastructure. The abstraction of these entities as business objects is proposed to uniformly address them and their interdependencies. In this paper, the concept of modeling the cyberspace of interdependent services, business processes, and systems and the procedures for assessing and predicting their attributes and dynamic states are depicted. The enterprise can build a model of its operation with the proposed formalism, which takes it to the first level of security awareness. Through dedicated simulation procedures, the enterprise can anticipate the evolution of actual or hypothetical threats and related risks, which is the second level of awareness. Finally, simulation-driven analyses can serve in guiding operations toward improvement with respect to resilience and threat protection, bringing the enterprise to the third level of awareness. The solution is also applied in the case study of an essential service provider.

1. Introduction

Protection against an increasing number of sophisticated and complex cyberattacks requires the achievement of security awareness, i.e., the ability to perceive threat events in time and space, understand their significance, and anticipate their consequences. To achieve this, it is crucial to gather real-time information on identified threats and their scope and scale to allow assessing the security impact of software and hardware infrastructure vulnerabilities on the business objectives. However, strong interdependencies between infrastructures and related business processes and services result in challenges to the process of security management. As noted in several works, e.g., [1], these interdependencies are diverse and complex by their very nature. Furthermore, infrastructures do not exist in isolation—the disruption of a single component can have a cascading effect leading to wide-scale outages with significant economic consequences for a single entity, industry sector, or even an entire country. The precise identification of such influences is essential for the effective analysis of threats and assessment of their impact on security at local (e.g., single process or service) and global (e.g., company, industry sector or country) scales. Many authors, such as [2,3], have indicated that uncovering such relations leads to accurate assessment of the criticality of a single infrastructure element or even an entire process or system. By identifying the most critical components, adequate security mechanisms can be applied to ensure that such interdependencies are taken into account in mitigation and recovery processes.
The effective response to cyberthreats requires close cooperation between the different security management teams responsible for all interdependent entities as presented, for instance, by [4,5,6]. It is worth noting that the scope and depth of information sharing on cyberthreats between different bodies are limited in practice. This is most often due to the lack of effective mechanisms to protect the sensitive data shared and the risks, often significant, associated with the possibility of their unwanted dissemination. Encouraging these entities to more closely cooperate requires effective solutions to protect their vital interests. Moreover, solutions should support systems in acquiring, processing, and disseminating verified information about cyberthreats and enabling the building of security awareness on local and global scales.
There have been a number of recent policy-level initiatives to solve this issue, with measures of the European Parliament and the Council of the European Union Directive for ensuring a high level of security for network and information systems in the territory of the Union [7], to name one example, followed by its national implementation (https://www.digitaleurope.org/resources/nis-implementation-tracker/, accessed on 29 September 2022). Several concepts and technical solutions to build common cybersecurity awareness of critical infrastructure entities have also been proposed. For example, in [5], aggregation and analysis of data extracted from security management systems and their correlation are used to create a picture of cybersecurity that also allows—due to the interconnections of the infrastructure elements— prediction of threat propagation. The European Union’s PROACTIVE project (https://cordis.europa.eu/project/id/700071, accessed on 29 September 2022) proposes solutions to improve an entity’s security awareness by enhancing security alert correlation and prioritization, linking the relevance of an organization’s assets to its business. In [8], a prototype of an integrated system for continuously monitoring, detecting, and warning cyberthreats is introduced. It supports the safe sharing of information on security events and risks related to services provided by critical infrastructure entities, enabling global cyberawareness at the state level. It is worth noting that the system architecture does not cover the business processes and IT/OT infrastructure of key service operators and does not support them in assessing cyberthreats to their business. The system, called S46/Powered by NPC, was operationally deployed in Poland in 2020.
The abovementioned procedural and technical solutions do not equip critical infrastructure entities with effective tools to build local security awareness of cyberspace, particularly to conduct analysis of online cyberthreats and risks that are dedicated to a particular entity’s services and business processes.
In this paper, we present a solution that fills this gap that is based on our experience and lessons learned from implementing the S46/Powered by NPC system. We aim to identify and depict the complexity of the essential services operator’s (ESO) cyberspace composed of interdependent services, business processes, systems, and IT infrastructure components. The focus is on modeling the cyberspace in all its complexity, with the goal of identifying its most critical elements, predicting the likelihood and nature of threat proliferation within interconnected services, business processes, software, and hardware infrastructure and assessing the impact of threats on the accomplishment of core strategic objectives.
The main contributions of this paper are as follows.
  • The methodology of cyberspace modeling that enables:
    -
    Assessing the impact of degradation on interdependent business processes, services, and IT/OT infrastructure elements in achieving the entity’s strategic objectives;
    -
    Evaluating the actual state of cybersecurity and anticipating the proliferation of threats across the entity’s cyberspace;
    -
    Conducting “what-if” analysis to identify structural or procedural solutions that can increase the cybersecurity of the entity.
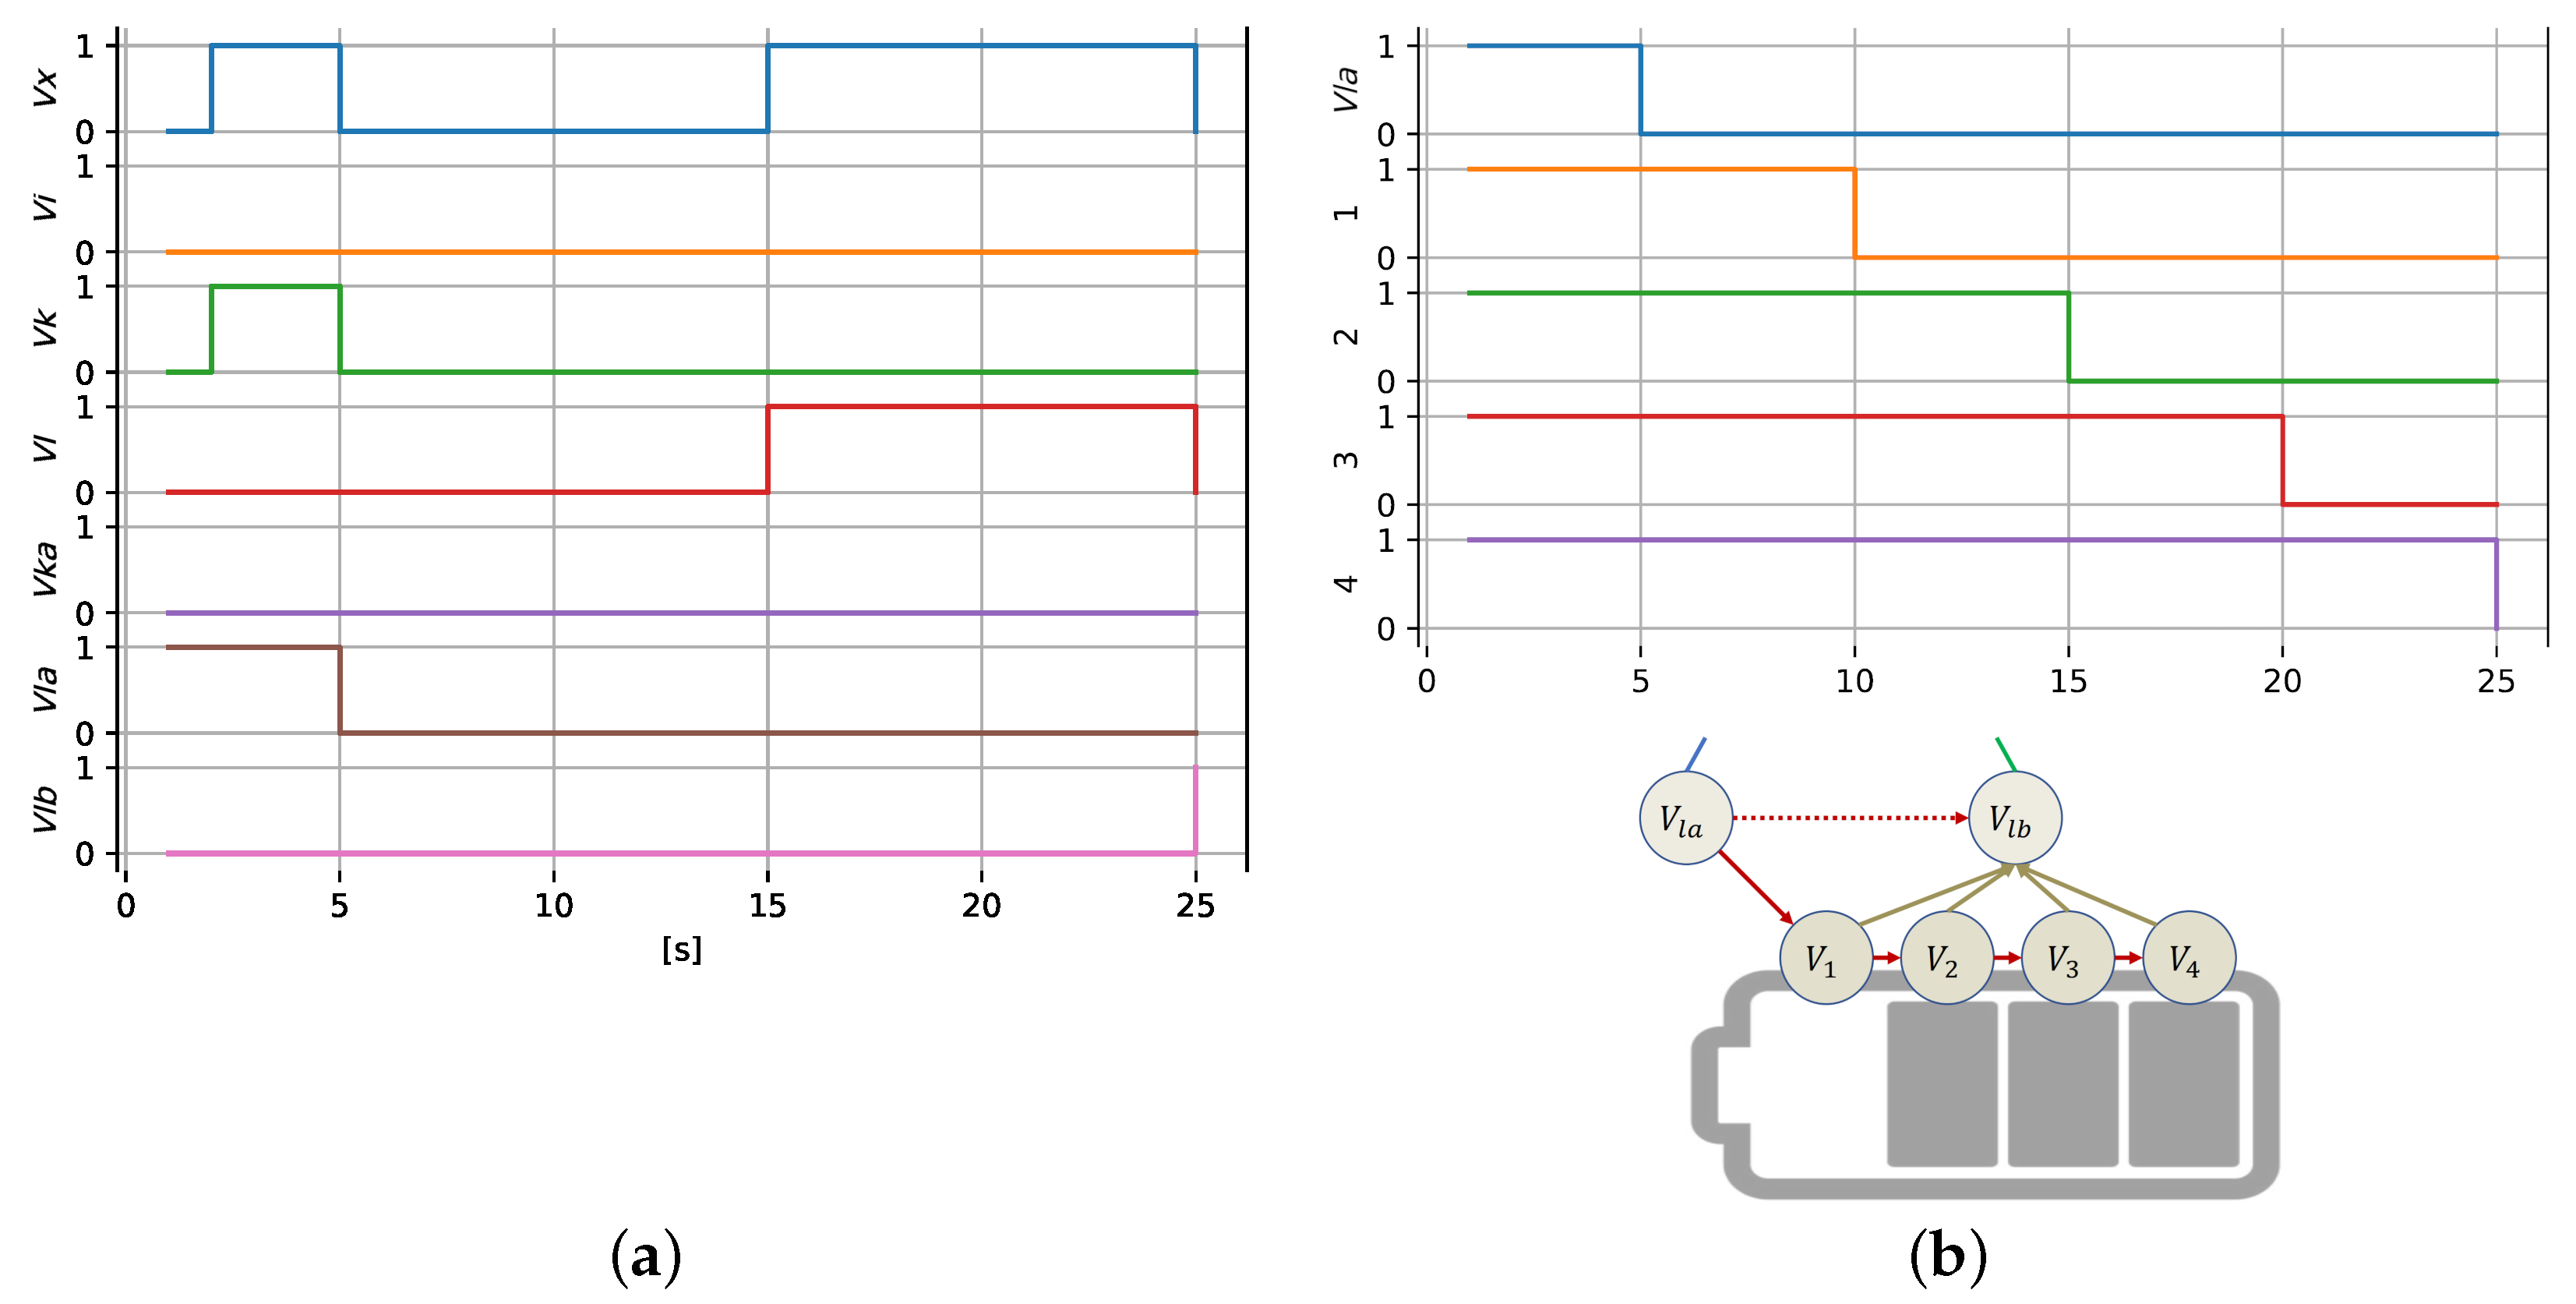
  • The concept of modeling cold or hot reserve objects considering the depletion of resources necessary for their operation.
  • A case study of the proposed approach supporting an operator of essential services in achieving cybersecurity awareness. We anonymized the object data for privacy while preserving the basic features.
The remainder of the paper is organized as follows. Section 2 provides a brief overview of interdependent object modeling approaches and the object performance metrics used in terms of their suitability in building ESO security awareness. Our concept of modeling the cyberspace of interdependent services, business processes, and systems as well as procedures for evaluating and predicting their security metrics and dynamic states are described in Section 3. As a result of the joint efforts with one Polish ESO, a model of the operator’s cyberspace was built and used to demonstrate the methodology. A description of the case and the results of analyses are presented in Section 4. The paper concludes by discussing the results of the case study and outlining steps for the operator to fully implement solutions for cybersecurity awareness management.

2. Related Work

The current state of knowledge and tools for modeling the interdependence of IT/OT are raised on foundations that are centuries old and date back to L. Euler’s graph theory and J. Muir’s observations in biology. The interplay of infrastructure and processes is still represented in the form of a network, which constitutes the common ground for further development and refinement of models. The diversity of modeling approaches comes from the assumed set of attributes one decides to assign to graph nodes and the way this information is further processed. As stated earlier, the key components of the security awareness concept are event, time, space, and the overall impact. Their relationship to a graph is subject to individual approach and is straightforward with respect to space and time: collocated objects are linked in the graph, and the time-variant property is represented as the state of a node (or, collectively, the graph state). The impact is the network output, not in a topological but in an informational sense, as it comprehensively represents the network state in the most useful way. Events are pieces of information that drive the change of network state, affecting either network attributes or the network structure itself.
Node state is commonly used to describe the performance of an entity modeled by the node. As far as physical facilities are concerned, the performance ranges from complete to none. It can be calculated using simple aggregation formulae for node inputs, or it can be sophisticated, as in [9], with a ratio of node supply vs. demand, where a node represents a city transit infrastructure item. When one moves from physical to cyber domains, such continuous performance models become inapt, and the node states are expressed as binary variables.
Identifying interdependencies between the physical and cyber states of nodes using a uniform model is not easy. Formally, this can be elegantly achieved using tensor notation, as proposed in [10]. The authors propose using a 4D tensor A j β i α with inter-node (j to i) and inter-aspect ( β to α ) impact in the graphs. The term ‘aspect’ can plainly refer to availability, confidentiality, and integrity as well as to less obvious dimensions. The approach makes it further possible to use general algebra for graph analysis—yet linearity turns out useless on closer examination of inter-node relationship nature. One has to decide if the scalar value should directly model the probability of failure propagation, the degree of malfunction propagation, or some other type of relationship. In any case, modeling aggregated impact using the matrix product is plainly insufficient, which results in adaptations for the specific approach. For example, [11] model risk propagation between systems, where a subset of nodes represents a system, by applying logical AND operation for incoming intra-system links vs. logical OR operation for inter-system links.
Another popular approach in risk analysis is to apply the susceptible-infected-recovered (SIR) model, known in epidemiology, where the odds of risk propagation are impacted by the number of infected neighbors on incoming links and the assumed probabilistic model. Such reasoning, with minor modifications, has successfully been applied in the modeling of a logistics chain [12], urban rail transit [13], and smart grids [14].
The SIR model brings on the temporal aspect of node interdependence. Whether in risk or malfunction impact modeling, the dynamics of phenomena propagation in the graph are of deep interest. One of the richest models of propagation dynamics can be found in [2]; the authors consider that malfunction affects neighboring nodes entirely only after an assumed time, reaching the target value either linearly, asymptotically, or exponentially. To cope with the complexity of simulating such a versatile model on varying timescales, fuzzy logic is employed to help in avoiding exact calculations of the abovementioned transfer functions. The authors argue that using fuzzy logic is appropriate and sufficient, as it also accounts for the inherent assessment errors of impact values by the user of the modeling tool.
Whatever class of model is used, the very process of building the graph structure and setting its values appropriately brings the enterprise to the first level of security awareness. At this stage, we shall call the model descriptive since it depicts the environment in which scenarios will develop. The next phase of modeling is to define scenarios of threats and use the model to forecast its results. This stage brings the enterprise to the second level of awareness, and the model in the working is considered the predictive one.
However, to elevate awareness to the third level, i.e., to turn the model into a prescriptive one useful in decision support, we need to compress the simulated network state history into a synthetic performance index or indices, which are eventually subject to an optimization process. In other words, we need to define appropriate network output. An interesting study of typical performance metrics for the whole graph of critical infrastructure elements is provided in [15]. The authors consider, in particular, the degree of user demand for service satisfaction, the deterioration of graph structure in terms of average shortest path increase, and the maximum network flow. Similar metrics focusing on the total utility of offered services for customers are found in [9,16,17]. With the goal functions defined, the enterprise is just a step away from having the capability to perform computer-assisted network improvements. An example of such a process is provided in [18] (a work that follows on from [2]), where the graph actually models states of system components in different stages of a cyberattack. The dedicated procedure groups most vulnerable nodes, thus providing the most destructive attack scenarios explicitly computed for that company.
The complete overview and classification of modeling approaches in the field can be found, for example, in [19]. Apart from routinely considered model properties, such as the ability to handle cumulative and cascading effects, we recommend focusing on two others: service redundancy and restoration. Redundancy, i.e., the ability of a node to substitute another node in the case of failure, can be indirectly addressed: Ref. [9] model demand shifts toward other unaffected nodes. In contrast, Ref. [11] connects redundant nodes in parallel and marks them as a special configuration. Furthermore, in [16], which is a follow-up work of [9], the authors introduce ‘tolerance time’, i.e., the lag in demand shift. However, those two modeling approaches do not address the cold-reserve situation, where node failure spreads until a standby redundant node takes over.
Redundant nodes are a particular case of a system’s structurally defined service restoration capabilities. The modeling of such capabilities as inherent attributes of individual nodes has received attention in recent work—e.g., in the already referenced work of [16] and, particularly, in [15]. The authors of the latter study observe that resources other than time are usually required for node restoration, and that those resources can be constrained. For instance, electricity grid failures can be fixed by one technical team only in sequence, and that sequence matters. Consequently, the authors postulate coordination of restoration activities based on their overall impact on the system—most such as ‘coordinated’, i.e., cascading failures are analyzed and mitigated.

3. Methodology

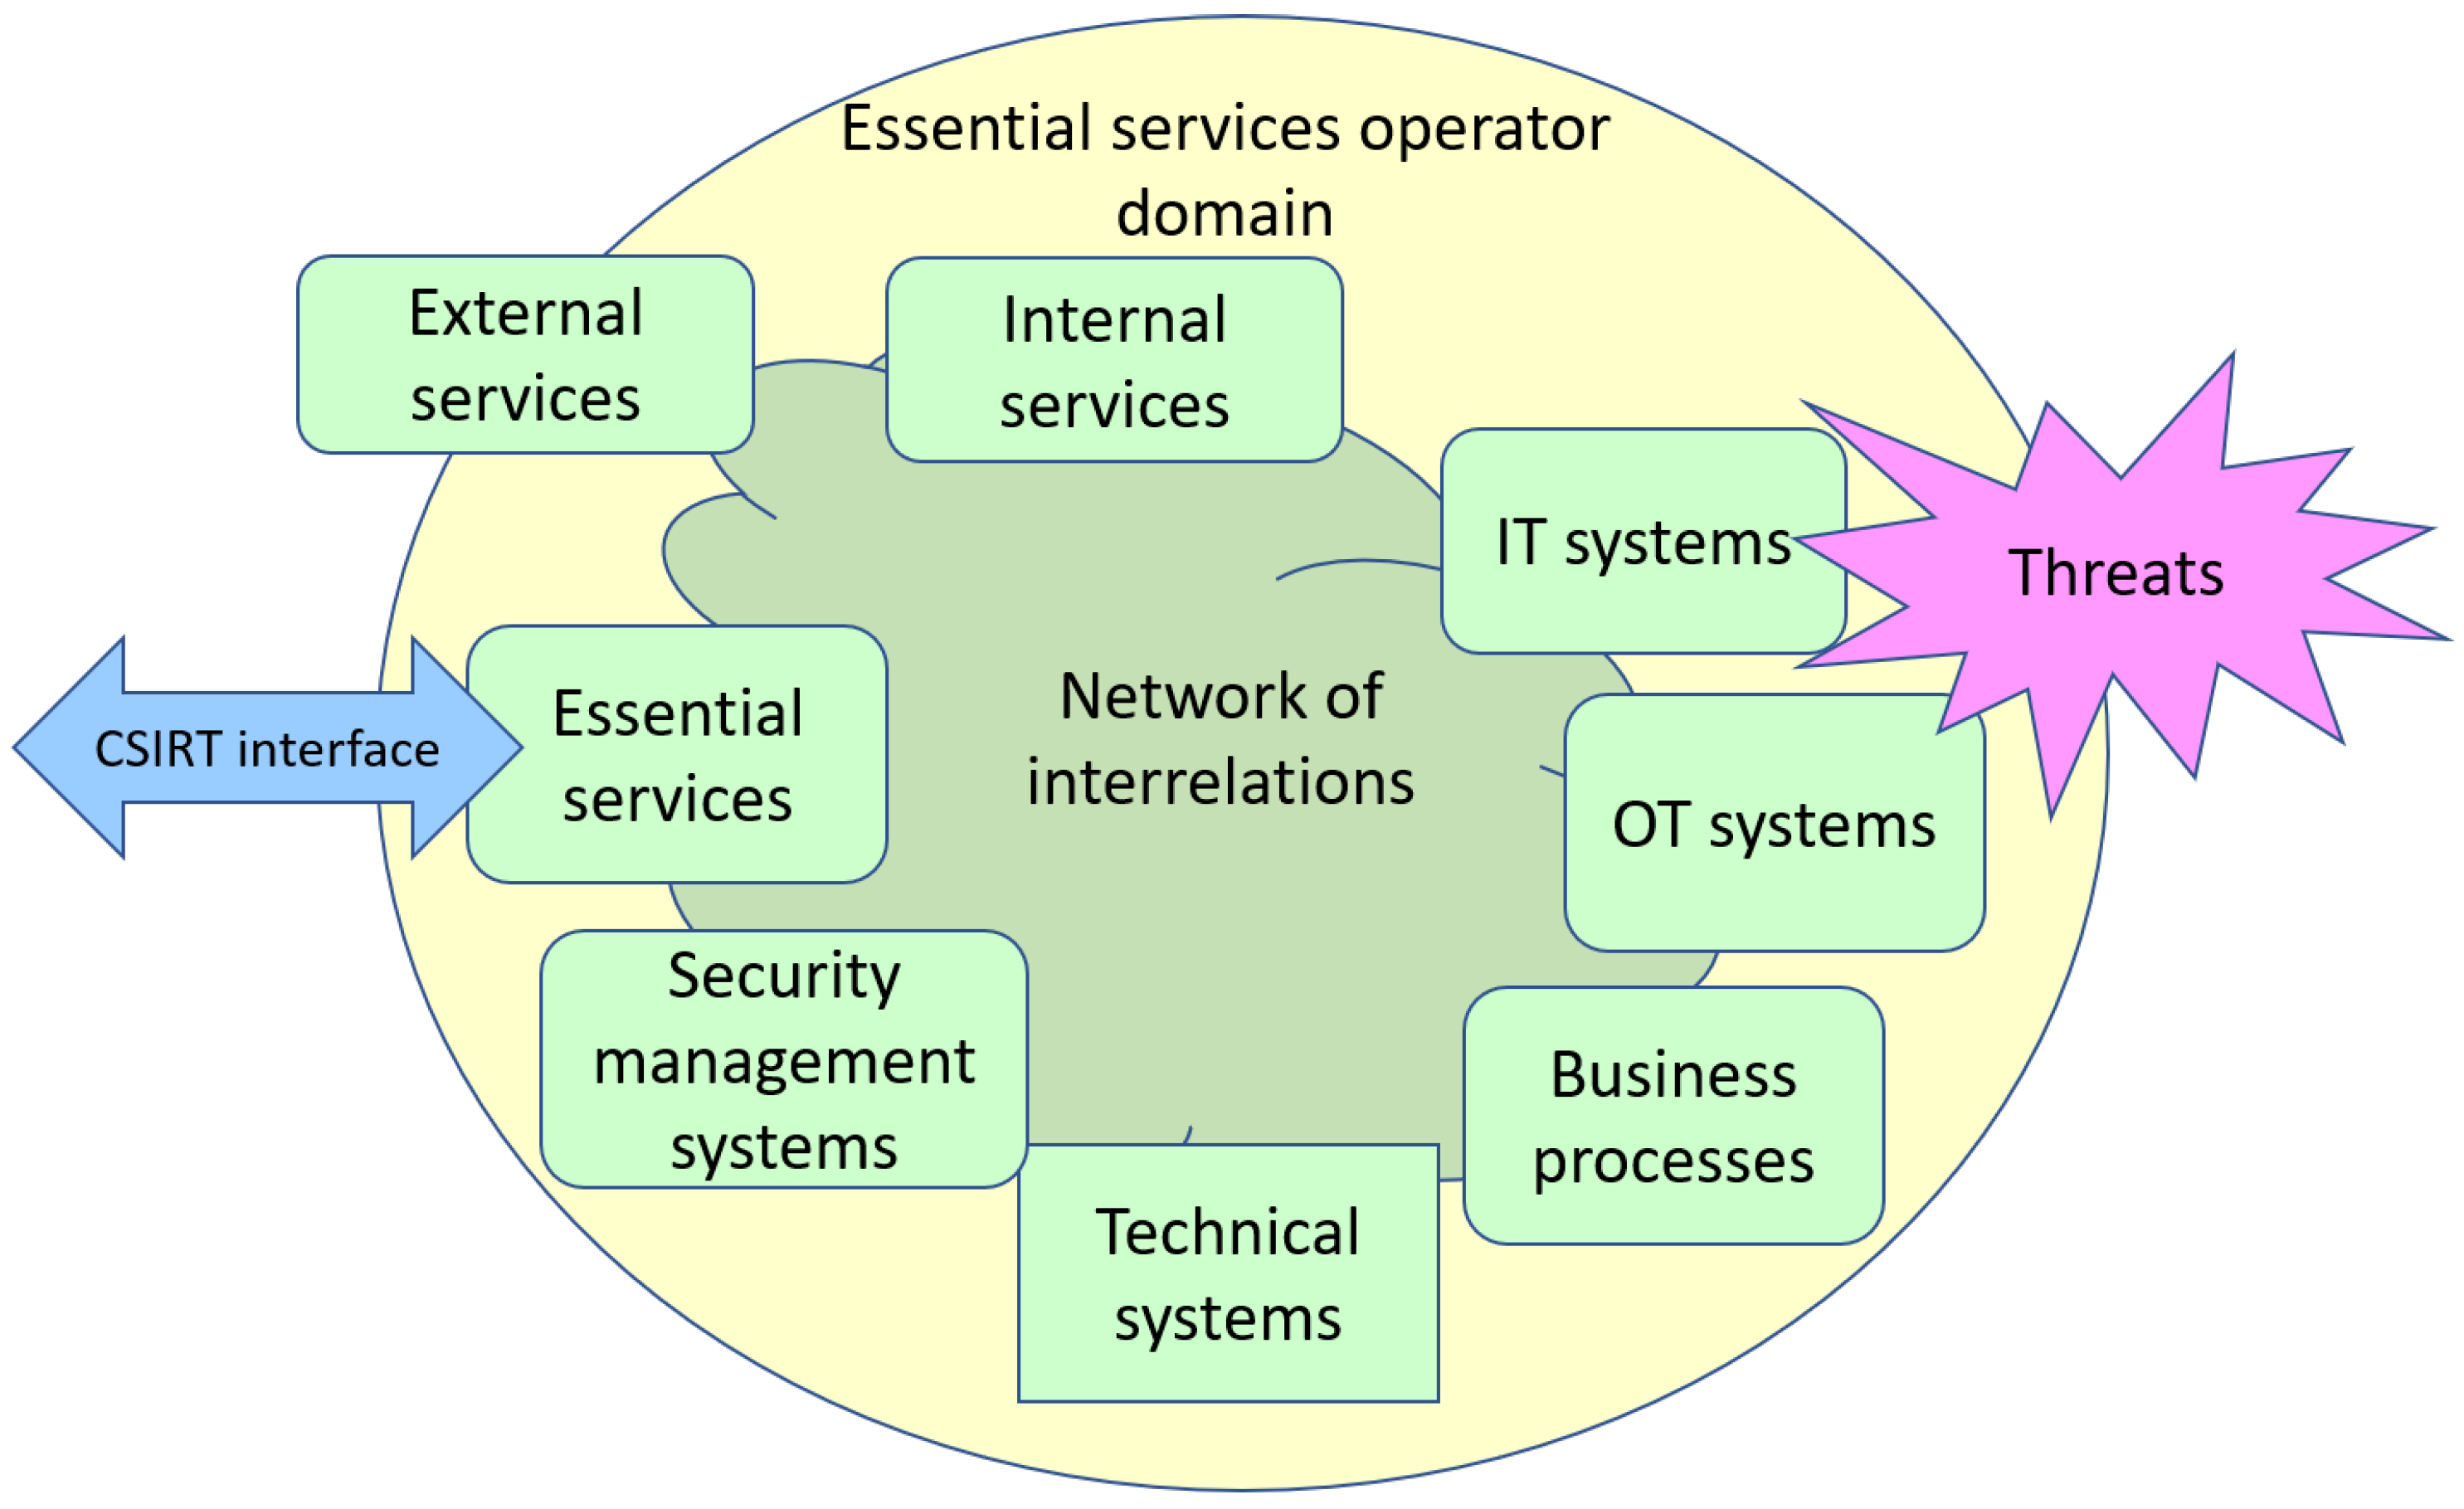
3.1. Cyberspace Modeling

Essential services (services that are crucial to maintaining critical social or economic activity) operators are an important component of the country’s critical infrastructure. Following the national implementation of the Directive of the European Parliament and the Council of the European Union on measures for a high level of network and information systems security [20], they have several obligations related, in particular, to reporting to the relevant CSRITs of data, enabling the creation of security awareness at the state level. Specifically, this refers to reporting the most serious incidents affecting the provided services and conducting a systematic risk assessment of the incidents. Complete and reliable evaluation of the service threats requires precisely identifying and describing all relevant elements of the operator’s cyberspace and their interconnections. The difficulty of this task arises not only from the complexity of elements’ dependencies but also from the complicated and often entangled functional relationships. As noted by Setola [21], such dependencies can have a very different nature, e.g., due to physical impact, degradation of processed data, geographical co-location, human error, etc. As a result of cyberthreat propagation, even a minor change in the state of a single element can result in significant security risk to an operator’s services or critical business processes. A prerequisite for achieving security awareness in cyberspace is to have a complete and reliable picture of the network of related services, business processes, and underlying systems and to implement procedures for assessing the impact of security events on the elements of this space, including the propagation of identified threats. Awareness of these dependencies allows the operator to detect entire chains of internal dependencies, identify the most critical elements, and implement effective mechanisms to improve security.
We assume that the main elements of the cyberspace of essential services operator are the following (Figure 1):
  • Services provided to other entities, in particular, essential services, for instance, power generation, oil storage, transportation, etc.;
  • Services provided to the operator by other parties (so-called external services), which are necessary for the operator to achieve its business objectives;
  • Internal services provided by the operator’s various departments to support its operations, e.g., local transport, accounting, etc.;
  • Business processes that determine the achievement of the operator’s business objectives, e.g., resource management, customer assistance, etc.;
  • Information technology (IT) and operation technology (OT) systems as well as other technical systems supporting service provision and execution of business processes;
  • Security systems that monitor cyberspace and provide threat information and support protection and mitigation activities;
  • The network of internal linkages of cyberspace elements with the nature and scope of their interactions;
  • An interface to the national-level CSIRT system enabling the reporting of identified incidents and the results of the dynamic risk assessment by the operator as well as reverse data acquisition for events in the state’s cyberspace and security recommendations for inclusion in the entity’s security management process.
A single element of cyberspace will, from now on, be referred to by the more general term business object (abbreviated as object or interchangeably as node), which represents, depending on the context considered, a service, a process, and a system or its element. A directed graph represents a network of interdependent objects with attributes described on its arcs and vertices. The functions defined on the arcs represent the impact of threats resulting from violations of the security attributes of the related objects, i.e., confidentiality (c), integrity (i), availability (a), and the time of threat propagation. The functions described on the vertices characterize, among other things, the type of object, location in cyberspace, business role/importance, the current state of security, and object criticality (criticality represents the impact of object degradation on achieving the operator’s business objectives).
In cyberspace modeling, it is necessary to consider additional factors related to the applied solutions aimed at increasing the resilience of the operator against cyberthreats. For example, some objects may form redundant groups consisting of alternative items. In any such case, it is necessary to define the internal organization of the group and the rules for activating objects. In addition, it is possible to establish their business relevance for specific objects, hereafter referred to as masters, which determines their importance from the operator’s point of view expressed in terms of profit made, the loss incurred, or any other measure defined by the operator.
Let us assume the following notations for the nodes of the network of interdependent objects:
V n —network node representing the n- t h business object, where n = 1 , 2 , , N , and N is the number of objects;
V b g —network node representing the b- t h master business object (for distinction, master objects are additionally marked with g), where b = 1 , 2 , , B , and B is the number of master objects;
I b g —the significance of the b- t h master business object, i.e., importance of V b g object in terms of the business conducted by the operator;
V n g m y —network node representing the n- t h business object that is an element of the m- t h group of redundant objects, and y is the number of the object impacted by the objects of the group where g m y is the m- t h group of objects impacting object y.
The network building process consists of two tasks, i.e., identifying business objects and their hierarchy. The process is based on the A n a l y t i c H i e r a r c h y P r o c e s s ( A H P ) method proposed in [22] and assumes the analyzed business is split into three levels, i.e.:
  • High-level organizational objectives related to the performance of core tasks, particularly provisioning of essential services that are a source of revenue;
  • Services rendered by the operator’s departments (so-called internal services) and critical business processes that condition the provision of essential services and are necessary for the accomplishment of the business objectives,
  • Infrastructure, which includes IT, OT, and technical systems with their components.
The identification aims to create a database of objects and their attributes, including but not limited to their location, organizational units responsible for their maintenance, and the conditions of their functioning in case of events impacting their security, particularly existing vulnerabilities. The hierarchy aims to establish objects’ interdependence (impact) with their characteristics and relevance regarding the consequences of a breach of their security.
Considering the position of the objects in the operator’s cyberspace determined by their dependencies and the type and degree of interactions, they will be characterized by at least two metrics, i.e.:
  • The significance of the impact on dependent objects, referred to hereafter as relative criticality;
  • The significance of the impact on the accomplishment of the operator’s business objectives, referred to hereafter as business criticality.
The IT/OT infrastructure elements will be further represented by their exposure to cyberattacks.
Moreover, each object is characterized by its dynamic features, which reflect the current state of cyberspace security, i.e.:
  • The current security state of the object in terms of confidentiality, integrity, and availability;
  • The object’s security risks concerning confidentiality, integrity, and availability.
As groups of redundant objects may exist in the operator’s cyberspace, we adopted a generic model for their internal organization and rules for activating reserve items, presented in Figure 2.
The model incorporates additional abstract nodes marked in colors in Figure 2. The abstract node V x represents the resultant impact of the redundant group on object V j . Nodes k a l a and k b , l b enable control of the activation and deactivation of the alternative objects, respectively, and are written here as subscripts to the physical nodes (i.e., k and l). By default, object V i is the default service mode, whereas V k and V l can represent either hot or cold reserve.
If the object V i is compromised, then with delay t i , k a and t i , l a , the abstract nodes V k a and V l a are activated. By default, t i k = t i l = 0, although other values are possible. Similarly, when object V k is compromised, an attempt is made to activate node V l a , which succeeds as long as object V i is still unavailable, as symbolically indicated by the loop in Figure 2. When abstract node V k a is activated, V k starts with delay τ k a , k . In the hot reserve case, τ k a = 0.
The reserve object can operate with a time constraint enforced by the availability of the required resources. In such a case, node V k b , activated with a delay t k a , k b , sets the time ρ k b , k , after which the resources will run out, and the object V k will be out of operation. Time t k a , k b = 0 means that resource consumption starts even if V k has not yet started.

3.2. Object Criticality

The impact of a breach of any security attribute of the object V n on the security attributes of its related object V j is determined by the values of the X n j dependency matrix of these objects shown in Table 1.
If the object dependency is to be determined concerning all security attributes, it will be calculated using Equation (1):
s n j = max ( k , l ) x n j k l ; k ( a , i , c ) , l ( a , i , c )
When the object dependency is to be determined solely due to a single security attribute (a, i, or c), the degree of impact is calculated using Equations (2), (3), or (4):
s n j a = max k x n j k a ; k ( a , i , c )
s n j i = max k x n j k i ; k ( a , i , c )
s n j c = max k x n j k c ; k ( a , i , c )
The relative criticality w n j of a nonredundant object V n that takes into account the impact of all P objects interdependent with object V j is calculated from Equation (5), if all security attributes are taken into account, or Equation (6), if only the object availability is considered.
w n j = s n j x = 1 P s x j
w n j a = s n j a x = 1 P s x j a
For an object V n g m j belonging to the g m j group of redundant objects, the relative criticality r n j of its impact on object V j is calculated from Equation (7) or from Equation (8) depending on how many security attributes are considered, i.e., all or only one (in this case integrity), respectively. The metric takes into account the influence on V j of all M redundant and Y nonredundant objects. The principle of calculating the criticality of redundant objects is illustrated in Figure 3. Objects V n and V m form a group of g 3 j objects. The abstract node V g 3 j represents the resultant impact of these objects on object V j . The relative criticality of object V n is denoted in Figure 3 as w n g 3 j .
r n j = s n g m j x = 1 M s x g m j s g m j j s g m j j + y = 1 Y s y j
r n j i = s n g m j i x = 1 M s x g m j i s g m j j i s g m j j i + y = 1 Y s y j i
The business criticality υ n that represents the impact of object V n on achieving the operator’s business objectives is calculated from Equation (9) or from (10) if all or only one security attribute (in this case, confidentiality) is considered, respectively.
υ n = z = 1 Z s n z υ z
υ n c = z = 1 Z s n z c υ z c
where Z is the number of objects impacted by the object V n .
Knowing the object criticality allows the operator to elaborate and include prevention measures, among other things, in the business continuity plans to reduce the impact of threats on its core strategic objectives. It also enables the operator to conduct what-if analyses to seek technical and procedural solutions that can mitigate business risks arising from the propagation of threats within its cyberspace. Criticality metrics are also used for risk propagation modeling in cyberspace of interdependent objects, as presented, for instance, in [23].

3.3. Object Exposure to Cyberthreats

Let the infrastructure elements’ exposure to cyberattacks be a function of the value of the CVSS metric [24] of their vulnerabilities. The CVSS metric outlines the values of the features of a given vulnerability, i.e.: attack vector (AV), attack complexity (AC), privileges required (PR), user interaction (UI), scope (S), confidentiality (C), integrity (I), and availability (A). Our approach uses the values of AV, PR, C, I, and A to assess the object’s potential exposure to a cyberattack. As the CVSS values are qualitatively expressed, their use in assessing an object’s exposure requires translation into quantitative values as shown, for example, in Table 2.
The relative potential exposure of the object V n to attack associated with the identified vulnerabilities (for instance, extracted from the vulnerabilities database or found by the scanner) E V n can therefore be determined from Equation (11) proposed in [25].
E ( V n ) = I C ( c , i , a ) ( V n ) × ( 10 y ) × M I ( c , i , a ) ( V n ) w M I × M V ( c , i , a ) ( V n ) w M V × A C A ( V n ) w A C A + + A T T ( c , i , a ) ( V n , x , y )
The following notations are used in Equation (11):
  • I C ( c , i , a ) ( V n ) is an Initial Compromise level that takes the value of the minimum of 1 or the sum of the individual vulnerability assessments (impact on confidentiality, integrity, and availability) following the Formula (12):
    I C ( c , i , a ) ( V n ) = m i n ( 1 , ψ ψ ( c , i . a ) ) , ψ Ψ
    where ψ ( c , i , a ) are the numerical scores of (C), (I), and (A) features of a single vulnerability within a set of Ψ .
  • M I ( c , i , a ) ( V n ) depicts the maximum impact of detected vulnerabilities in terms of confidentiality, integrity, and availability (13). It sets an upper limit on the number of vulnerabilities needed to completely compromise an infrastructure element:
    M I ( c , i , a ) ( V n ) = m a x ( ψ ( c , i . a ) ) , ψ Ψ
  • M V ( c , i , a ) ( V n ) indicates which vulnerability represents the greatest threat to the object V n (14). Its value is normalized to one, where one means that the vulnerability considered can completely affect the object’s confidentiality, integrity, and availability:
    M V ( c , i , a ) ( V n ) = m a x 1 3 ( ( ψ c ) 2 + ( ψ i ) 2 + ( ψ a ) 2 ) , ψ Ψ
    where ψ c , ψ i , and ψ a are the numerical scores of (C), (I), and (A) features, respectively, of a single vulnerability within a set of Ψ .
  • A C A ( V n ) is a combined parameter of maximum access and access complexity (15). It can be represented as a vector or a normalized value:
    A C A ( V n ) = 1 2 ( m a x ( ψ a c c ) 2 + a v g ( ψ c o m p ) 2 ) , ψ Ψ
    where ψ a c c and ψ c o m p are the numerical scores of (AV) and (PR) features, respectively, of a single vulnerability within a set of Ψ .
  • A T T ( c , i , a ) ( V n , x , y ) depicts the attack surface, which is a function of the number of vulnerabilities concerning the object V n and the threat that they present. The value of this parameter is expressed on a logarithmic scale (16), where x is the base for the logarithmic function, and y is its maximum value (limit):
    A T T ( c , i , a ) ( V n , x , y ) = m a x ( log x ( a v g ( ψ ψ ( c , i . a ) ) ) , y ) ψ Ψ
  • W M I is the weight of the maximum input;
  • W M V is the weight of the maximum vulnerability;
  • W A C A is the weight of the combined access vector, access complexity, and authentication vector.
As the final score of an infrastructure element V n , exposure to attacks should be within the range [0, 10], a normalizing factor ( 10 y ) was applied in Equation (11), where y is the maximum of Function (16).
It is worth noting that metric E ( V n ) , considering the probability of a successful attack and the potential damage it could cause, enables determining the risk of a possible attack on an IT/OT infrastructure element [25]. Knowing the value of risks for infrastructure elements, the risks of all other cyberspace objects can be determined similarly to their relative criticality.

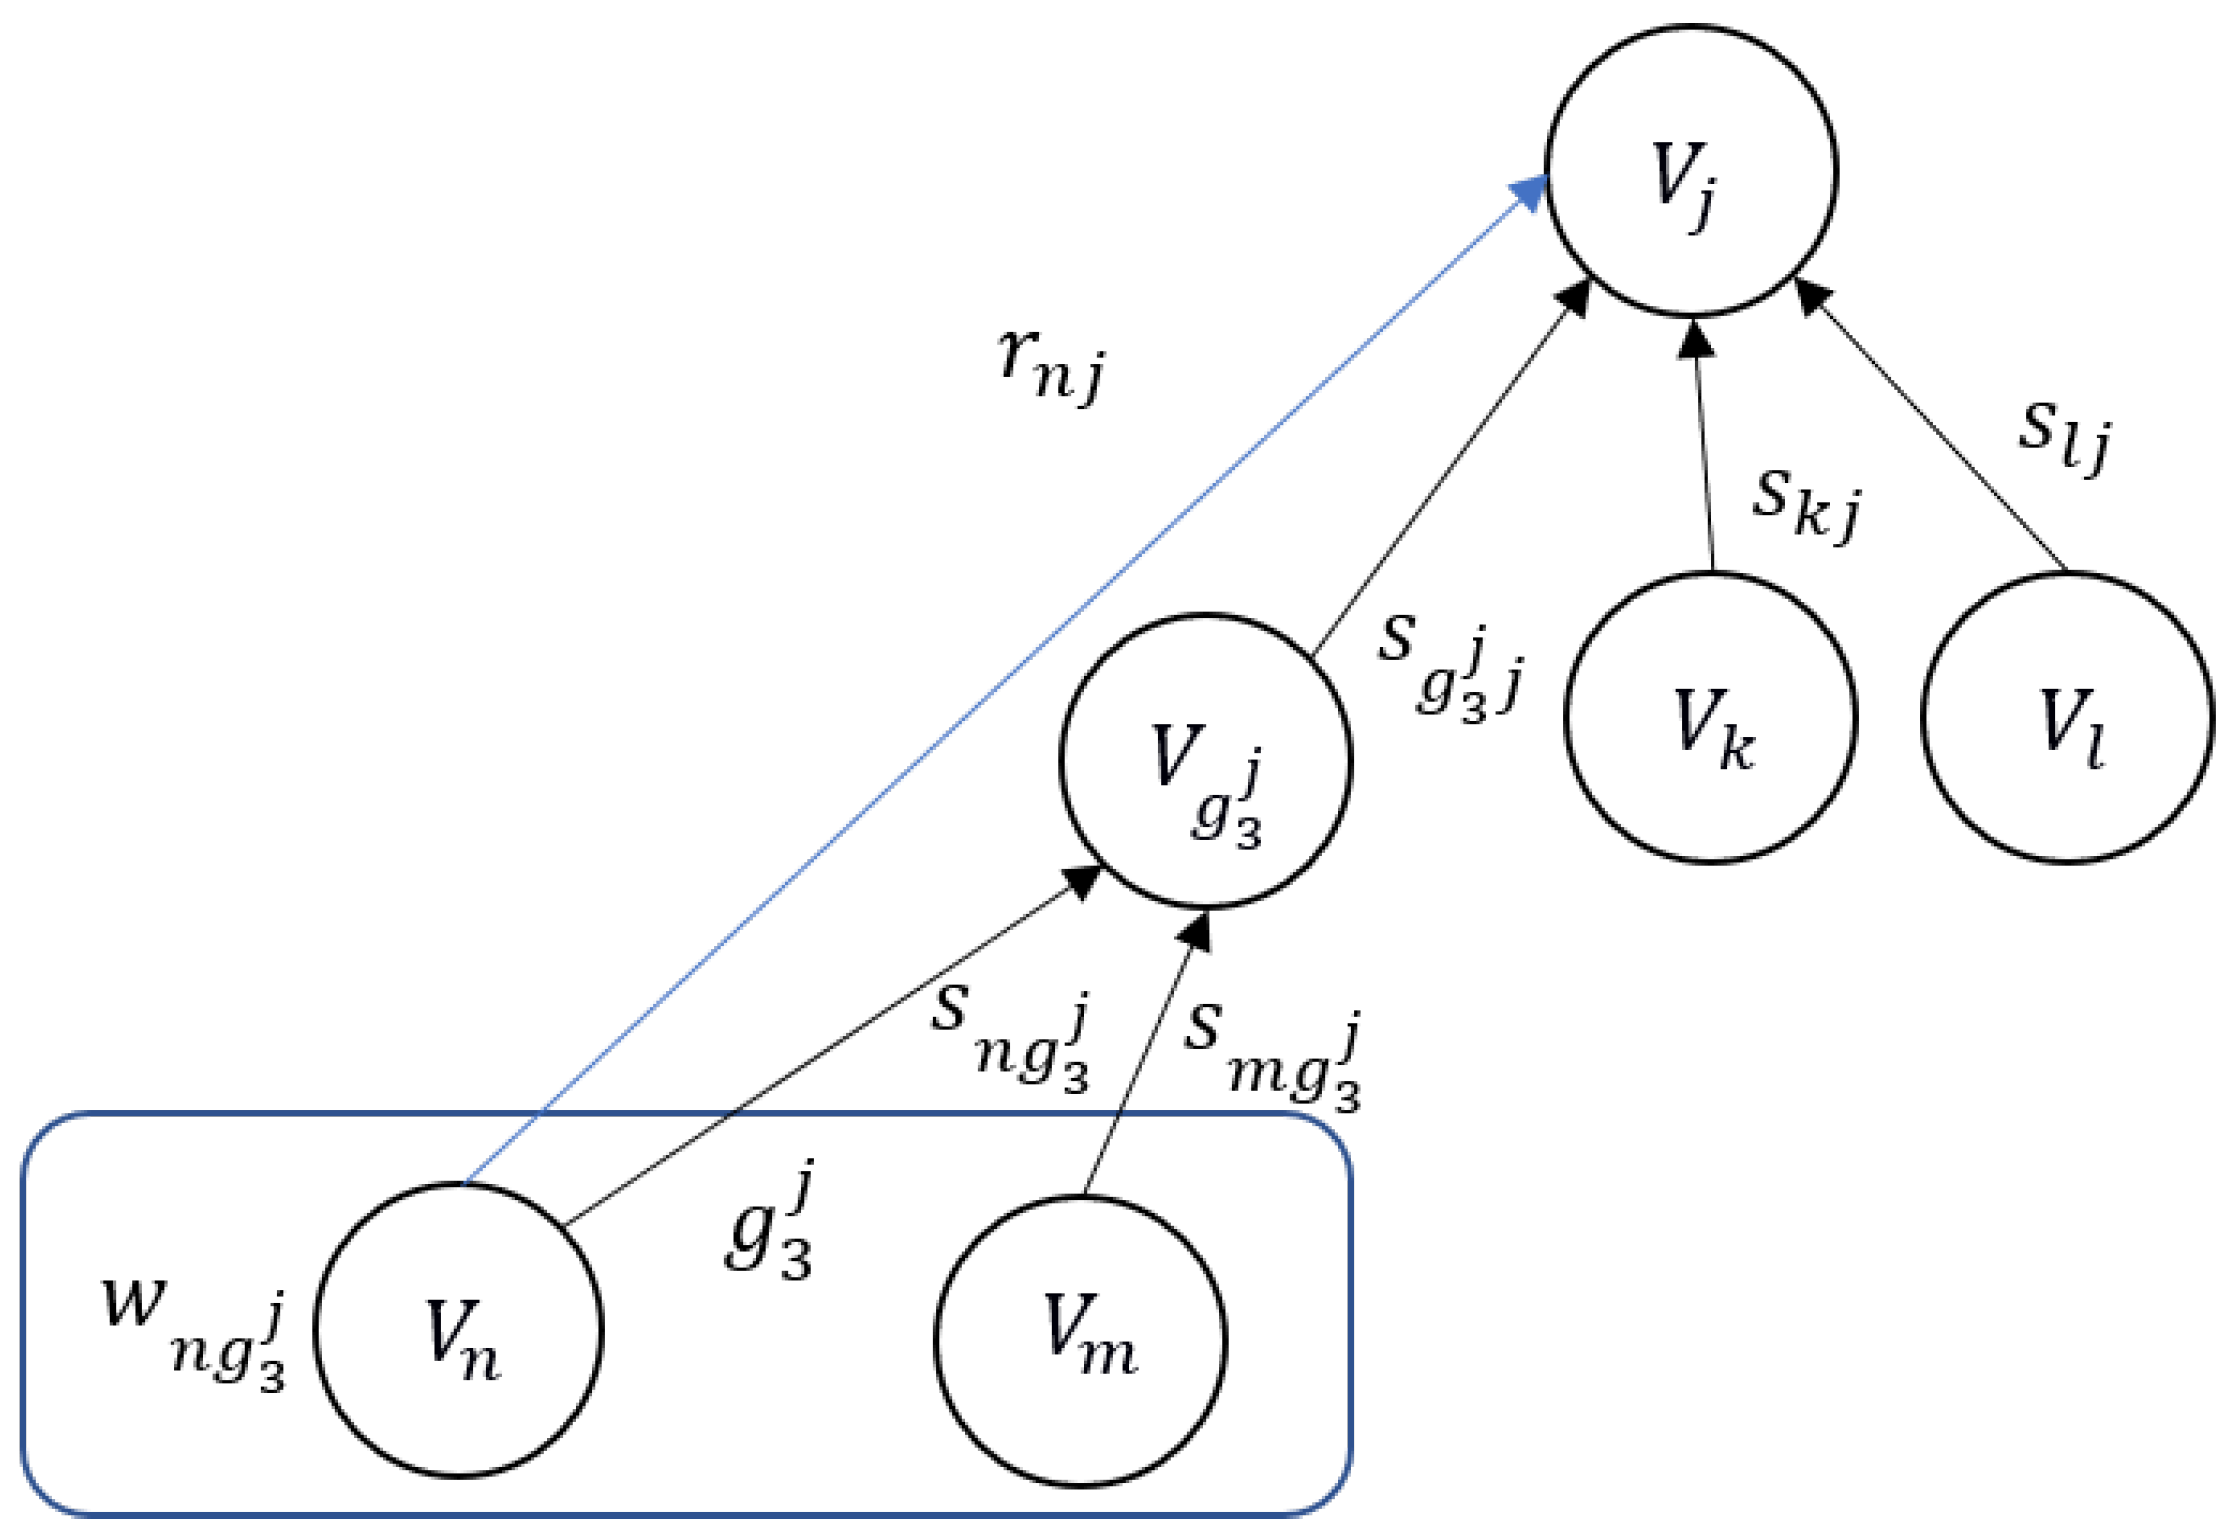
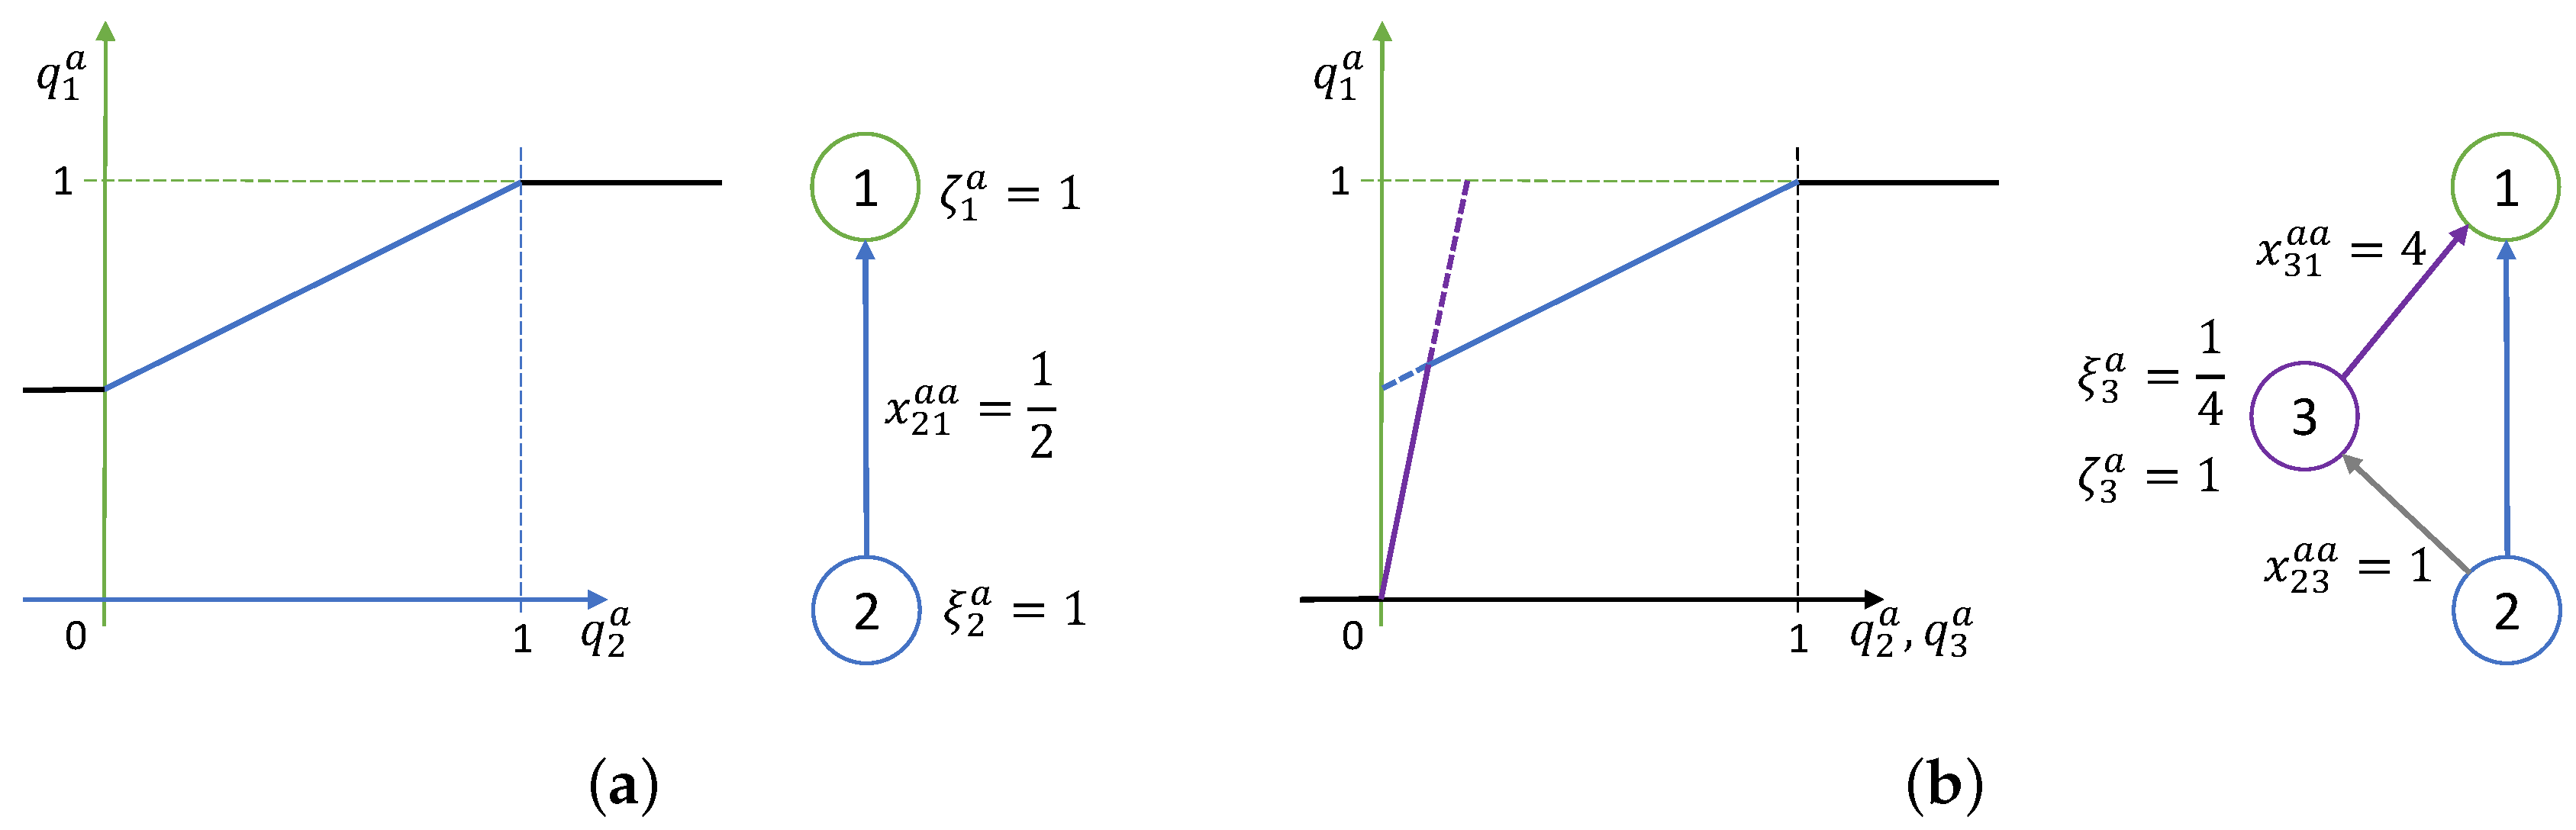
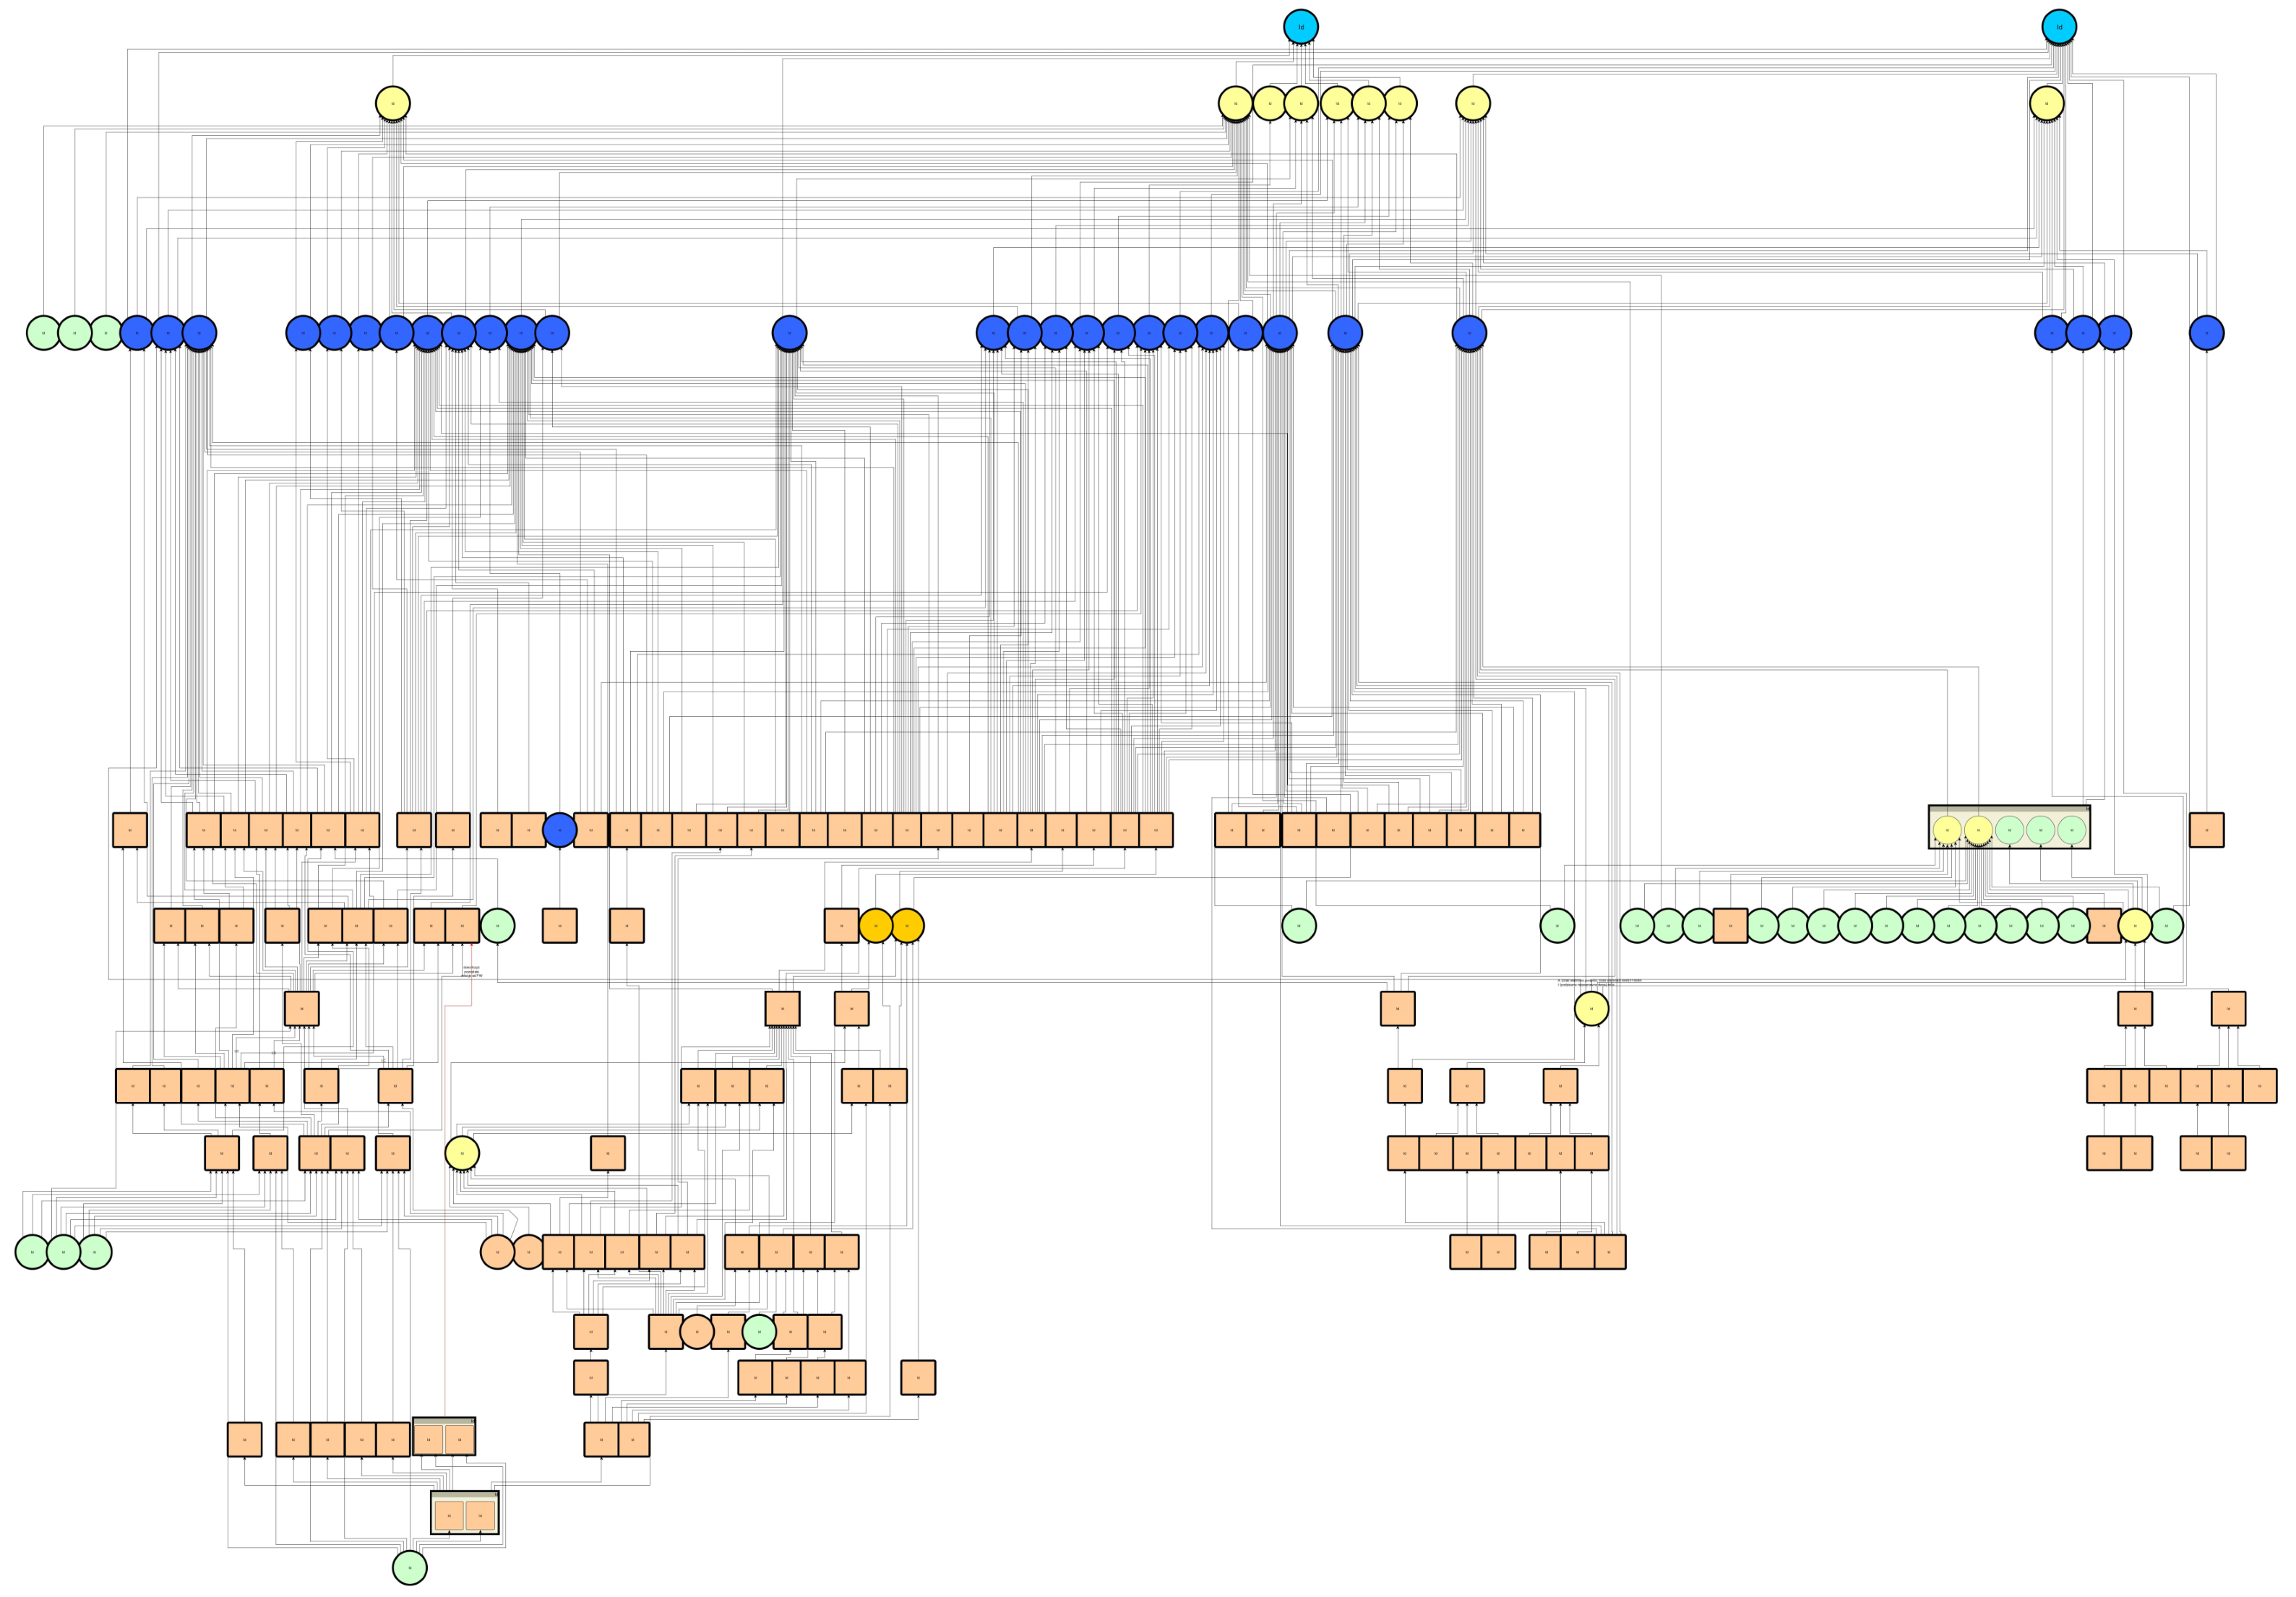
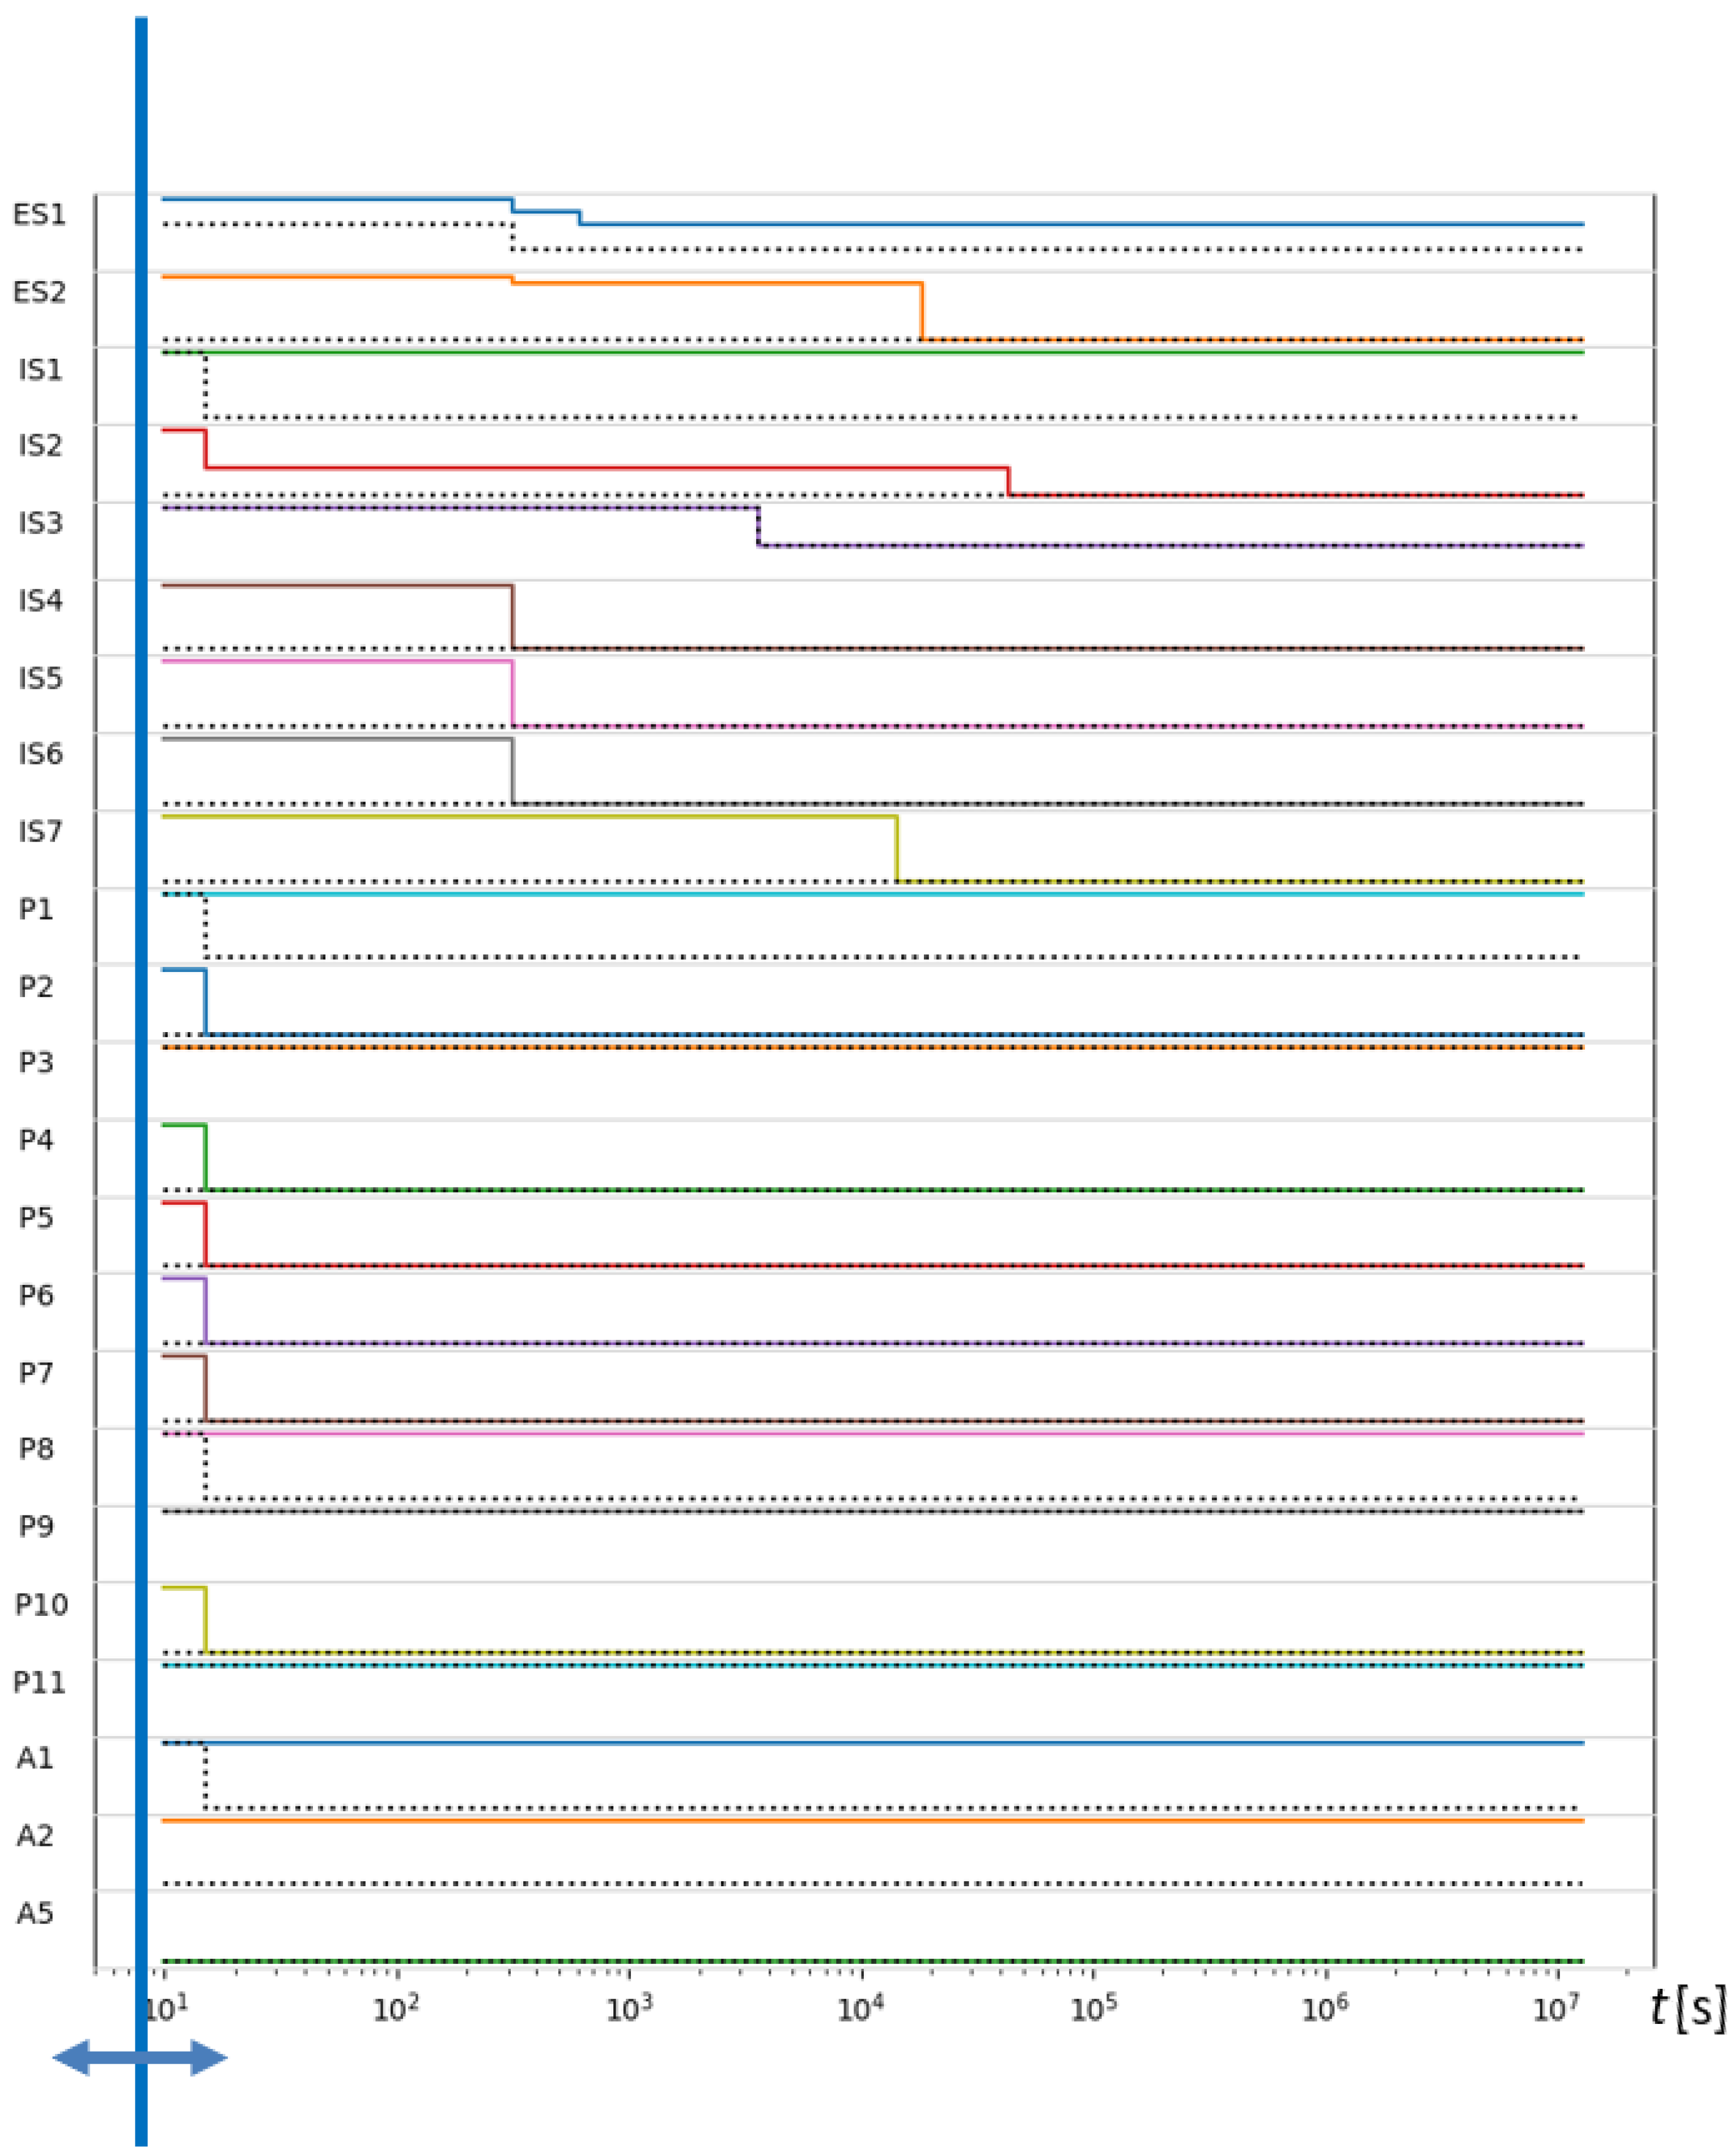
3.4. Simulation of Dynamic States of Cyberspace

The following postulates have been used in determining the architecture of our simulation network:
  • Capability to model networks of unlimited size and with the inter-aspect impact of nodes;
  • Support for a different timescale of node interactions and different character of node response to neighbor failures;
  • Viability in the case of limited or uncertain node parameters provided by the model user.
Since these requirements are, to some extent, contradictory, we decided to handle them in providing a highly modular, general-purpose, discrete event-driven simulation architecture. Each business object is basically represented by one network node, which is described by a small set of easily understood parameters. If the business object expresses more complex behavior, such as the already described redundancy rules, it is complemented in the graph, with extra nodes standing for any extra functionality required. For instance, V l a in Figure 2 represents the logical condition ‘any of V i and V k are operational’, and V l b in ‘idle’ state would mean ‘resource for operation of V l will run out in time ρ l b , l ’. Extra nodes can be added as soon as the model user can define the extra behavior rules and quantitatively describe them. We present more relevant examples of such gradual graph augmentation below.
The central modeling concept is the observed state [ q j a , q j c , q j i ] consisting of three scalars that determine the node’s actual performance regarding availability, confidentiality, and integrity, respectively. We assume each state element to be in the range [ 0 , 1 ] , where the value of one means that the node V j is fully operational in that aspect. States other than availability are usually considered binary; our model also supports this case by setting appropriate parameters.
The value of observed state component q j k in any aspect, i.e., k ( a , i , c ) , is a sum of its internal state ζ j k and aggregated impact of states of neighboring nodes that impact V j through inbound links:
q j k = max ( 0 , min ( 1 , ζ j k + Φ j k ) ) .
The internal state ζ j k [ 0 , 1 ] denotes the node’s ability to work properly. This value can be finally impaired by the dysfunction of its neighbors. The role of function Φ j k is, precisely, to combine the relevant dysfunctions, in any aspect, into a single signal affecting the overall operation of V j . A dysfunction of some other node V n in aspect l is simply the difference between the observed and set-point state values:
δ n l = q n l ξ n l , l ( a , i , c ) .
The set-point value ξ n l describes the desired node V n state value in ordinary conditions, i.e., constitutes the desired mode of whole system operation. Usually, we desire all system objects to be fully functional, ξ n l : = 1 for all n and l. However, extra nodes for extra functionalities, e.g., redundancy, may and usually do have different set-point values.
Aggregation of those dysfunctions is conducted in a weighted way, with weights taken from dependency matrices (Table 1) on incoming links. For summation aggregation type,
Φ j k = n E ( j ) x n j l k δ n l ,
where E ( j ) is an index set for nodes affecting V j . Alternatively, the minimum and maximum can be used instead of summation, depending on needs, where E ( j ) is an index set for nodes affecting V j . The choice of appropriate aggregation method depends on particular needs; in general:
  • Summation means that dysfunction at each supporting node adds up to observed dysfunction of V j ;
  • Maximization takes into account only the failure that influences V j most, which means that supporting nodes can be used alternatively, exactly as in the case of redundancy modeling;
  • Minimization seeks out the bottleneck supporting node, effectively implementing conjunction of the supporting nodes needed for the operation of V j .
By combining more such simple, linear relationships, one can model more complex phenomena. Let us start with the simplest case of node V 2 availability moderately influencing the availability of V 1 , as shown in Figure 4a. The set-point ξ 2 a = 1 means that any availability deficiency in V 2 will negatively affect the observed state q 1 a . Since the impact ratio x 21 a a is 0.5 and internal state ζ 1 a = 1 , the complete failure of V 2 will decrease q 1 by 0.5, as shown in the graph. Extreme values in the model are determined by initial parameters and state range constraints for each node. Note that the model user must provide only the impact ratio (internal state and set-point values are set to 1 by default).
Should the user wish to model a more sophisticated character of V 1 condition based on V 2 performance, they may do so by adding artificial nodes. A case of nonlinear dependence of availability is depicted in Figure 4b, representing a situation when depletion of V 2 availability below a certain level will acutely affect V 1 operation. The desired new feature is drawn with a purple line and effectuated by node V 3 , fed directly by the state of V 2 . Node V 3 set-point is 1 4 ; once q 2 a drops below this level, V 3 kicks in, providing additional negative input to V 1 with slope x 31 a a = 4 . Inputs to V 1 are aggregated by choosing the one with the minimum value, thus creating the desired nonlinear dependence represented by the solid blue-and-purple line in Figure 4b.
Similarly, different, more complicated piecewise linear dependence functions that eventually refer to the other utility of services can be defined, including typical convex and concave functions. The openness and simplicity of the proposed model resemble that of the classical neural network, with the exception that differentiability is not required as the model is not subject to automated training. Nonsmoothness of the model is also negligible with respect to the typical accuracy of the model parameters provided by the user, as they are usually the outcome of the fairly rough self-assessment process.
Model capability to handle temporal aspects of failure propagation is essential. Such transitory processes often define the operator’s overall condition, and their identification is vital especially if parts of the business are not included in the model. We propose applying discrete event simulation to strike the right balance between simulation model complexity and accuracy. An event denotes the start of some dynamic change, i.e., the first observable symptoms of deficiency in some aspect. Additionally, we know the final degree of a failure, e.g., from 1.0 to 0.8—but we do not define how or the timescale in which such a deficiency will eventually be reached. Therefore, propagated events offer a rather pessimistic forecast: the earliest one sees a failure and the eventual future depletion. Looking for such a worst-case scenario is a common approach, especially in the IT domain, where failures occur in a rather abrupt, stepwise manner.
The simulation model uses two types of events:
  • A change in internal state ζ j k , defined by a user as an element of attack scenario;
  • A change in observed state q j k , resulting from a change in internal state or any observed state of the node predecessors.
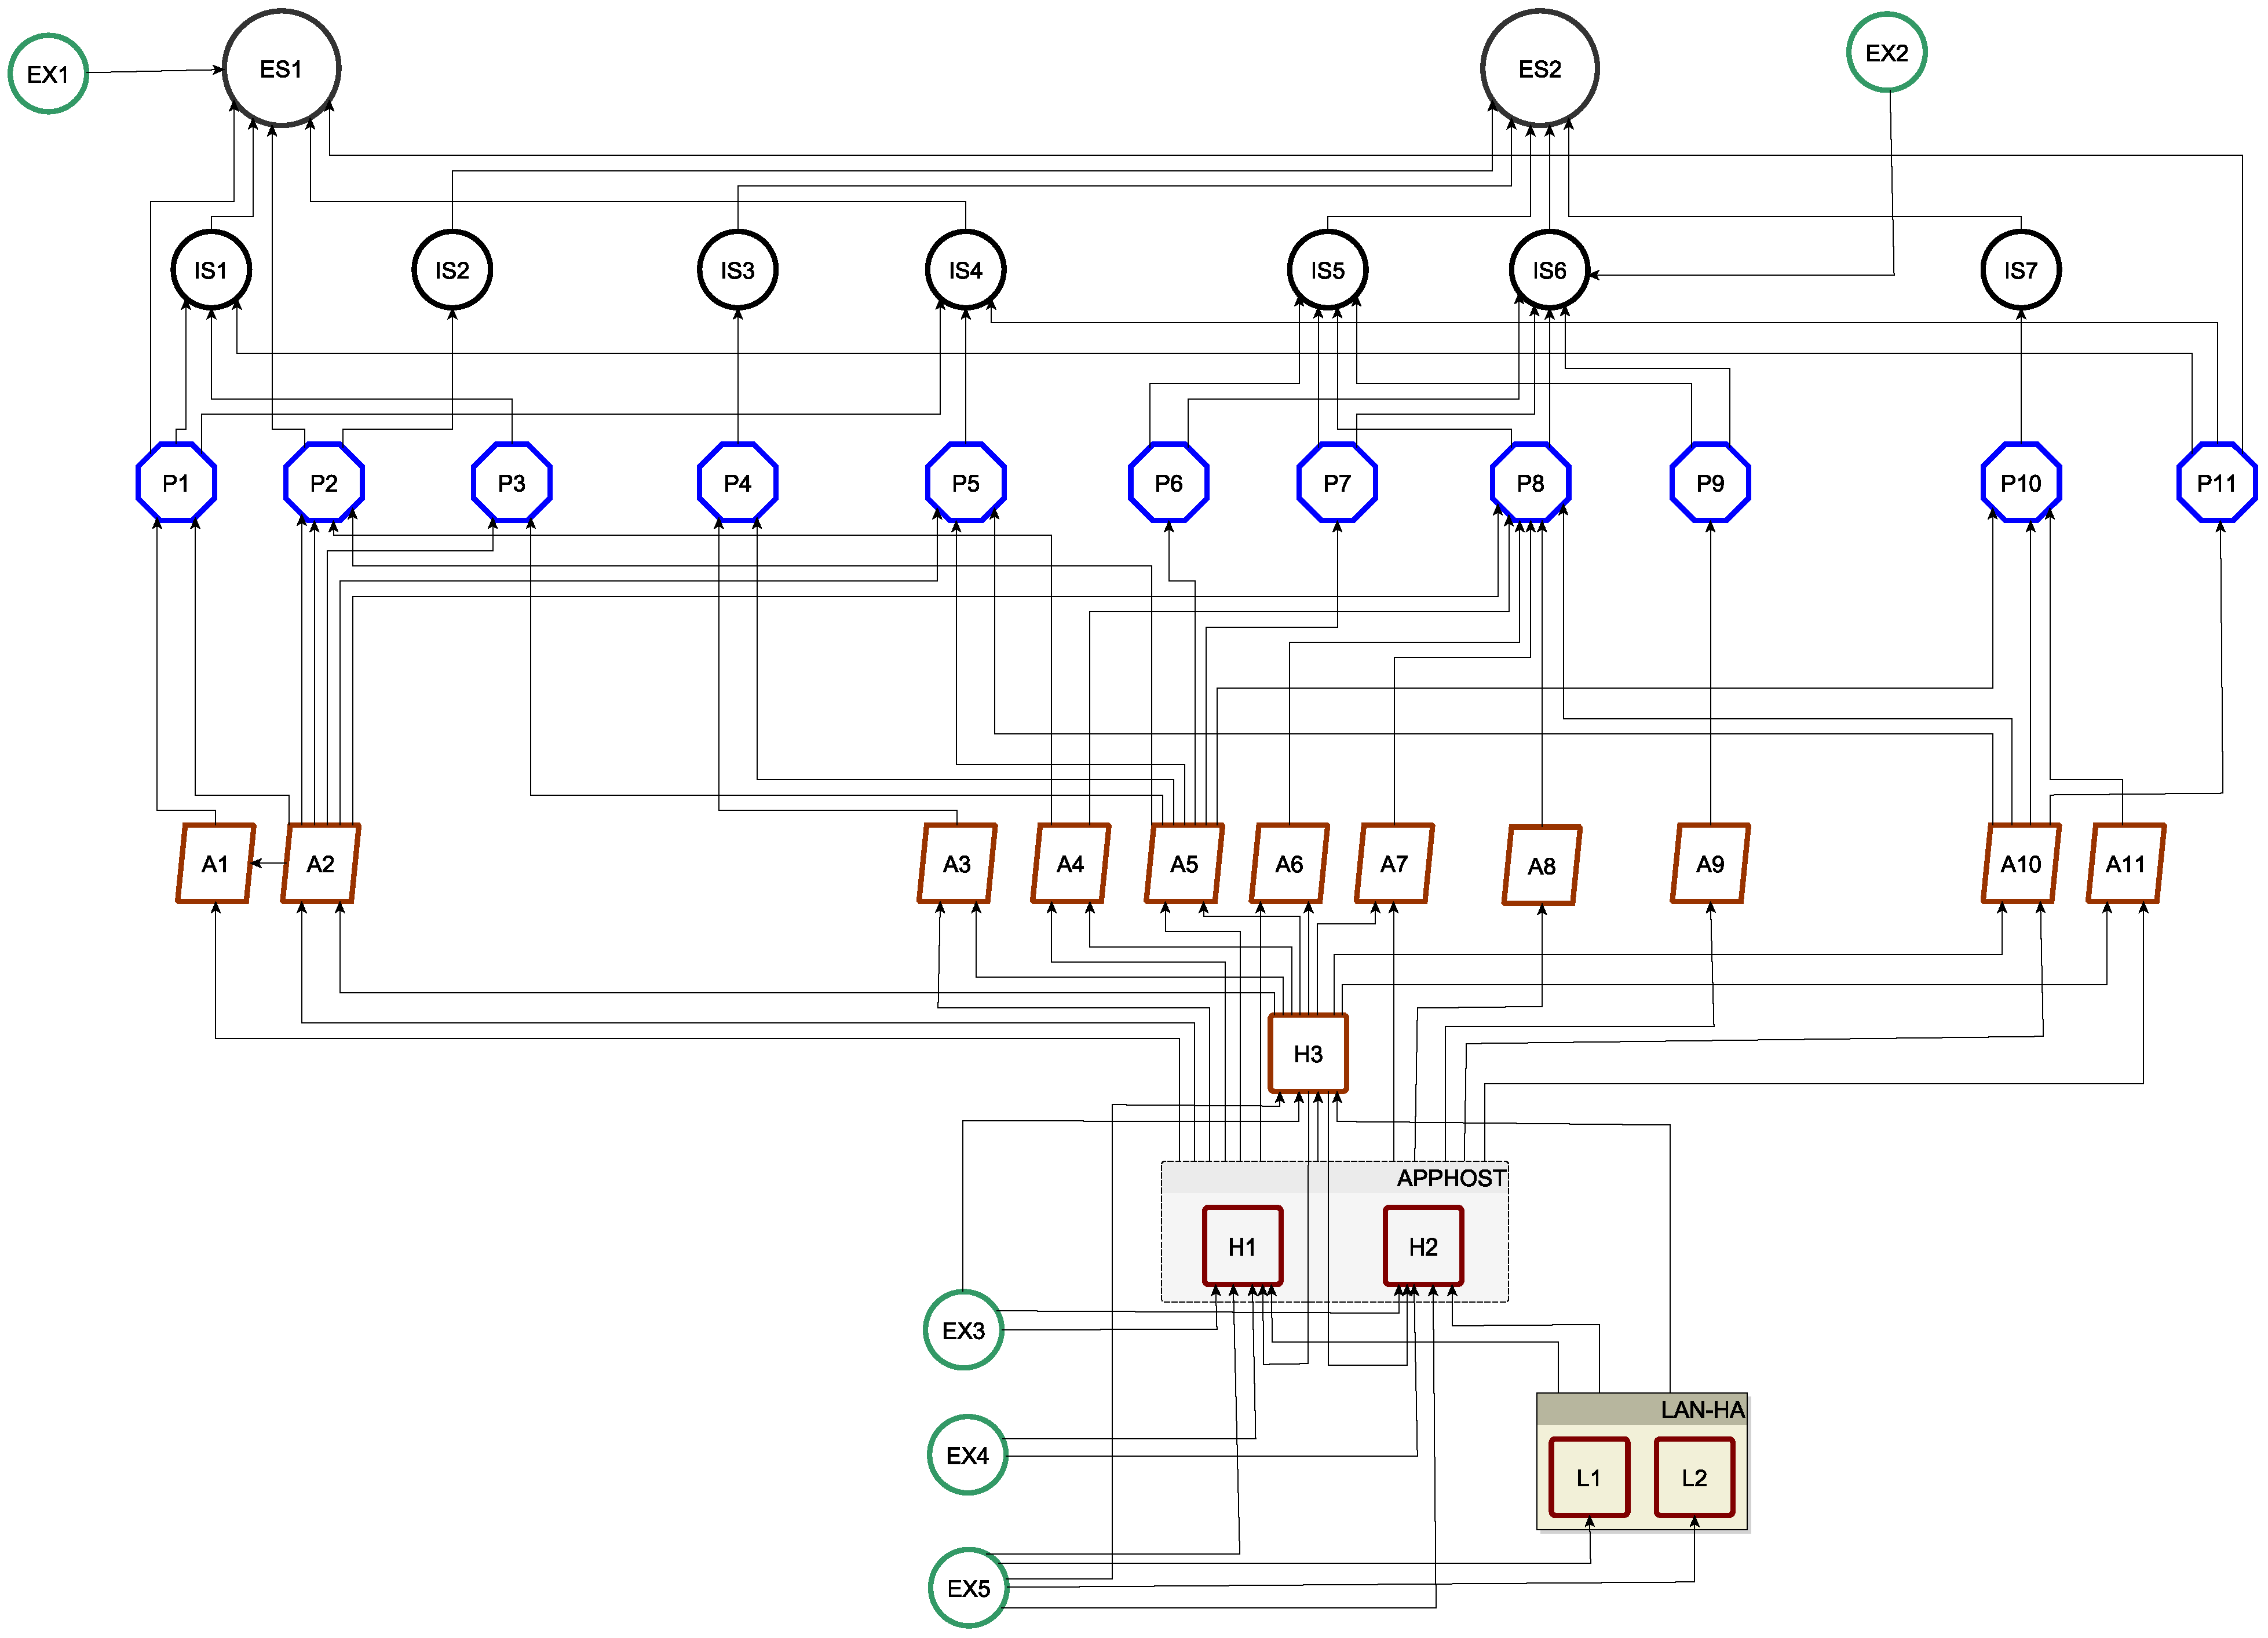
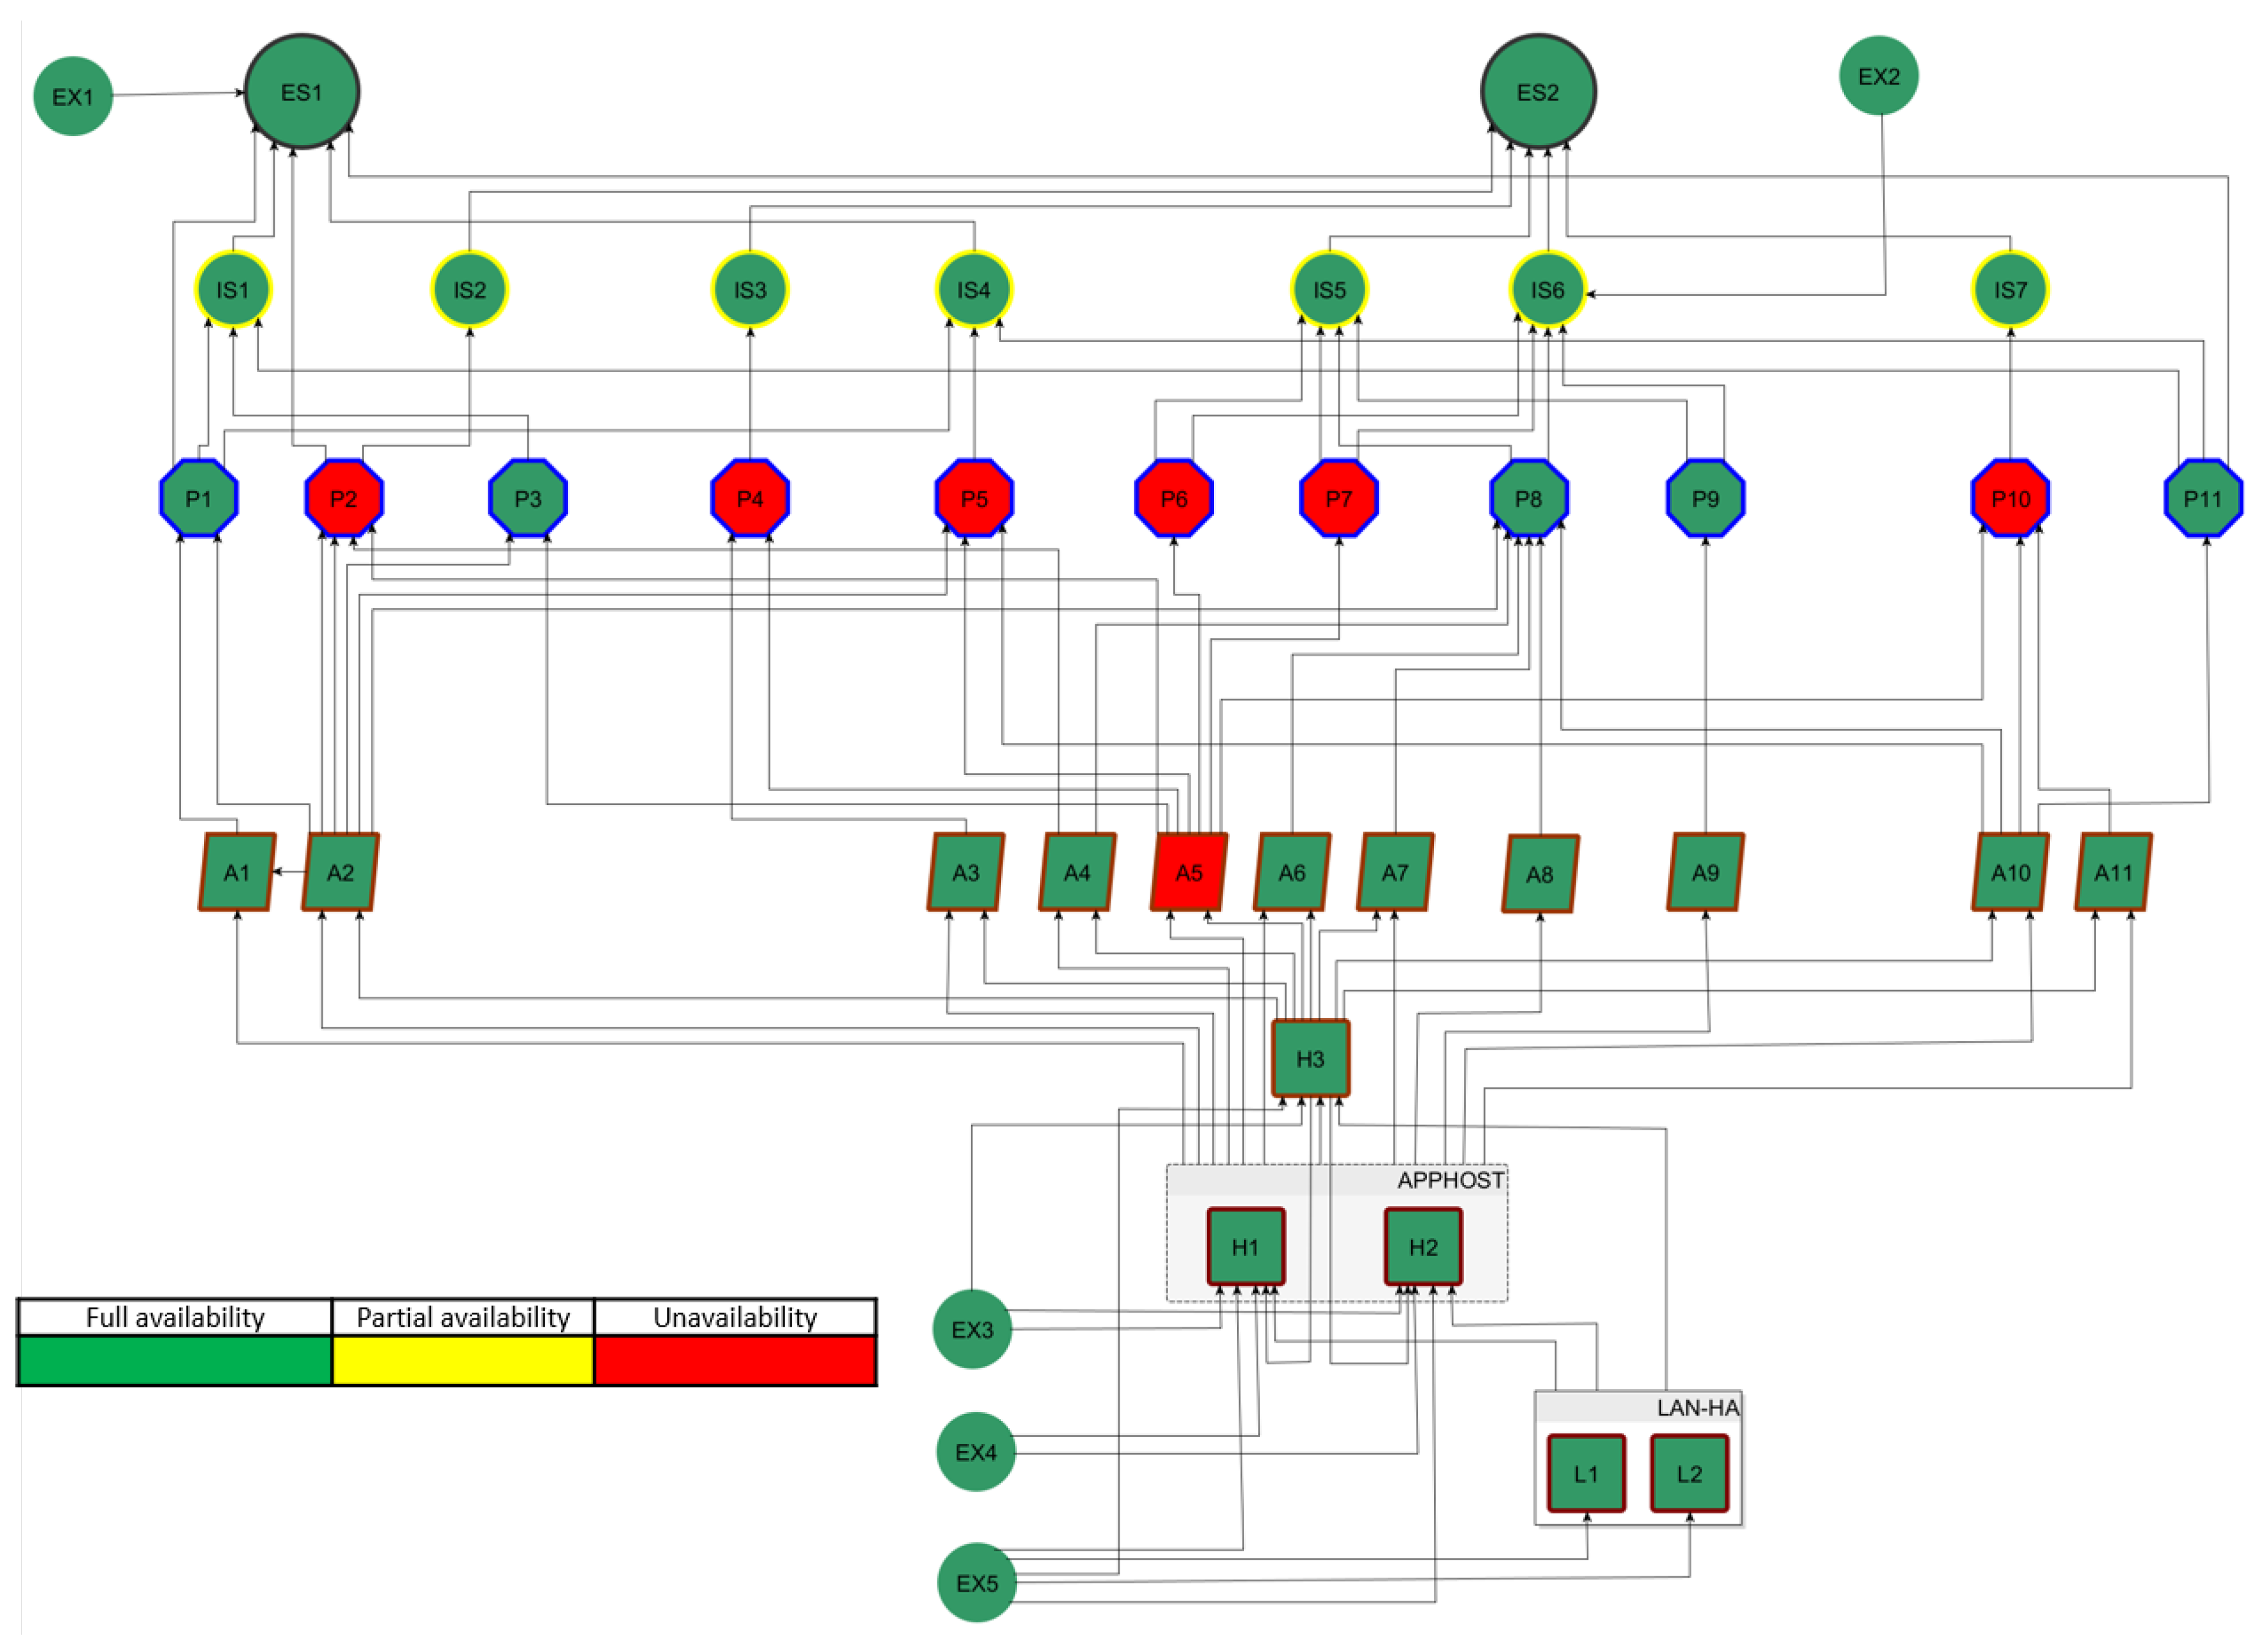
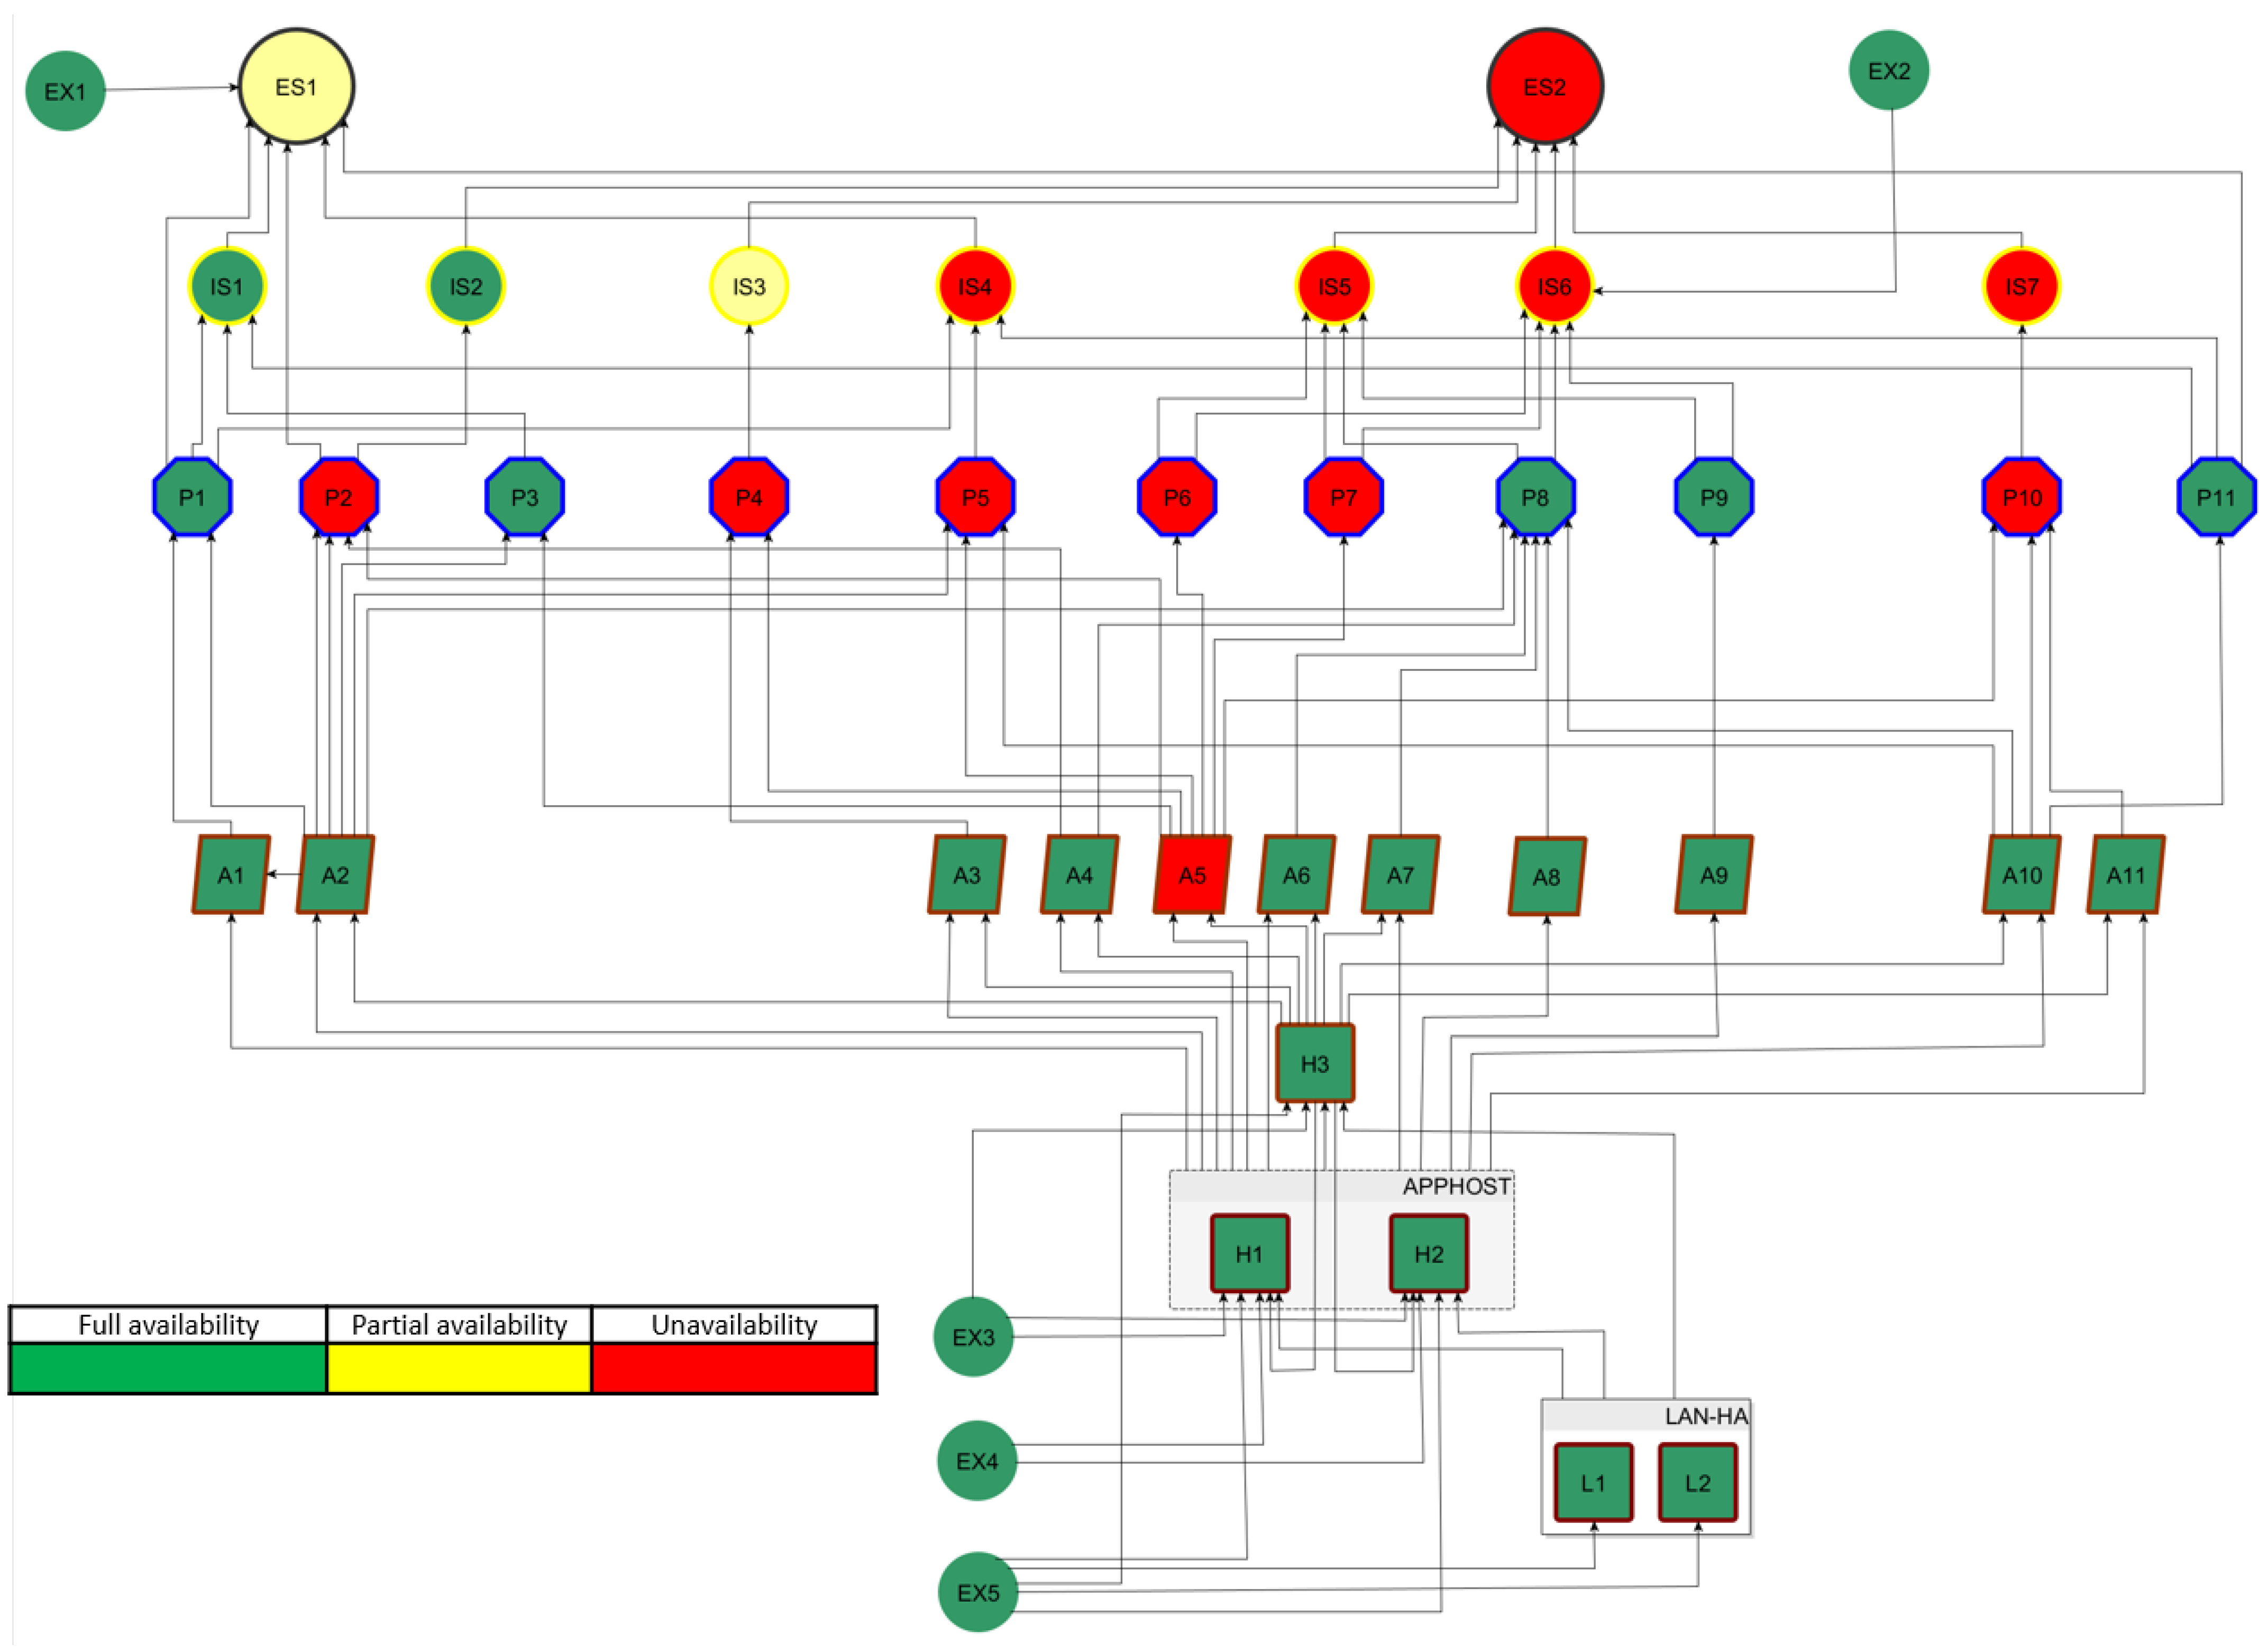
Changes in the observed state are scheduled on the event list to be propagated with delays defined by a user as edge attributes. The model supports asymmetric delays in state decrease and increases to reflect a reality where, e.g., supporting service V i degradation has an immediate adversarial effect on V j . Yet, restoration of V i will take time to positively affect V j .
The simulation engine handles changes that propagate in zero time before proceeding to the next relevant time instant. Graph cycles are supported, provided they converge to a stable solution in a reasonable number of iterations. Earlier events override events scheduled for an edge for a later time — should they appear in the course of simulation — to ensure model integrity.
To demonstrate how our model can handle temporal modeling complexities, let us consider the network shown in Figure 2 in a scenario where the availability of V i completely breaks down at time t = 1 s. Time series for the availability of all relevant nodes are shown in stacked layout for this case in Figure 5a, starting at t = 1 s, immediately after that event. Both V k and V l are of cold reserve type, and it takes 1 s to bring up V k . Consequently, we see V k (as well as the whole group, V x ) to be operational at t = 2 s.
Such a state would remain stable had it not been for another event in the scenario: V k breaks down at t = 5 s, which triggers V l a because both V i and V k are down this time. Since this condition has been detected, V l is starting up, but it will take as much as 10 s in our model. Finally, at t = 15 s, the whole group is on again. However, V l runs on limited resources in our model and, once it is activated, may run only for 20 s. Running out of resources is modeled by V l b : it is triggered at t = 25 s, which eventually blocks the operation of V l and of the whole group.
The model structure can be expanded to account for fine-grain phenomena of resource consumption if need be. In Figure 5b, the resource capacity is split into four quarters by adding four extra nodes, named simply V 1 to V 4 . Consequently, resource availability is jointly modeled by resource availability in any of the four compartments. The resource is sequentially discharged, as shown in the graph in Figure 5b (20 s of V l operation split into four equal periods). With such an approach, one can also differentiate discharging and charging dynamics as well as add extra conditions to these processes.

4. Case Study

To assess the practical suitability of the methodology, we established close cooperation with one Polish essential services operator. As a result of the joint efforts, a model of the operator’s entire cyberspace was determined (Figure 6). It contains multiple objects representing essential services (marked in light blue), internal services (marked in yellow), services provided by external entities (marked in green), business processes (marked in blue), IT infrastructure components (marked in light brown), and their interdependencies.
Due to its visual complexity, only a fraction of the operator cyberspace was used in the case study to demonstrate the methodology, as shown in Figure 7.
The considered model of the operator cyberspace contains all types of objects with their security dependencies, i.e.:
  • Essential services (ES1, ES2);
  • External services provided by outside organizations (EX1–EX5);
  • Internal services (IS1–IS7);
  • Business processes (P1–P11);
  • IT system comprising applications (A1–A11) exploited by various services and processes, database server (H3), and application servers (H1, H2) running in cold reserve mode;
  • LAN switches (L1, L2) operating in high availability (HA) mode.
The operator determined the significance of the essential services ES1 and ES2 for accomplishing its objectives to be 1000 and 800 units, respectively. The expected recovery times of objects after degradation, defined for each site in collaboration with the operator, are shown in Table 3. In the case of a redundant group, the order and time attributes of reserve object activation were also defined.
The operator also specified the values of object dependencies for all security attributes (ref. Table 1) and the threat propagation delay time, which ranged from single seconds (host impact on applications) to hours (business process impact on internal services).
The N I S P I (Network of Interdependent Services, Processes, and IT/OT systems) application prototype developed in-house by NASK was used to demonstrate the cyberspace modeling methodology described in Section 3. The application provides the operator with a series of forms allowing them to enter data about business objects (services, processes, and infrastructure items) and their interdependencies. The specification includes objects’ identification data and attribute values described in Section 3.1. The application allows network management by adding/removing objects and changing their relationships and respective attribute values. Based on this data, the application provides visualization of the network’s topology and results of several numerical analyses performed based on formulas presented in Section 3.2, Section 3.3 and Section 3.4. It delivers an interface for entering data on events affecting the objects’ security regarding confidentiality, integrity, and availability, enabling visualization of their impact on the current security state of the network. The application also allows the operator to conduct in-depth analyses, such as prediction of the impact of an incident on the network over time or conducting “what-if” experiments using the simulation procedures described in Section 3.4.
The results of business criticality calculations (Equation (9)) are presented in Table 4 and illustrated in Figure 8.
The obtained results indicate that the business criticality of objects varies considerably. Particular attention should be paid to objects of relatively high criticality, marked in yellow, pink, and red in Figure 8. This is especially true concerning the need to reduce the negative impact of database server degradation on the operator’s business objectives.
To illustrate modeling of the dynamic states of cyberspace shown in Figure 7, we assumed that all objects are fully available at the initial moment ( t = 0 ). As a result of exploiting the vulnerability of object A 5 , at t = 10 s , its availability drops to zero. Its unavailability affects the dependent objects, causing their degradation at t = 15 s , as illustrated in Figure 9.
As a consequence of propagation of the object unavailability, after t = 5 min, the next five objects become downgraded (Figure 10). Then, after t = 4 h, the E S 2 becomes unavailable (Figure 11), drastically affecting the operator’s business objectives.
The N I S P I application for managing the network of interconnected objects in the operator’s cyberspace also allows presenting the results of threat propagation prediction in the form of a diagram, shown in Figure 12, which has the same layout as presented in Figure 5.
By moving the bar to the selected time, the operator can view the object status, allowing them to conduct a detailed analysis of events. In particular, they can determine the time needed to take appropriate actions to stop the propagation of the threat or to limit its effects.
The presented solution also allows for in-depth analyses of the cyberspace security’s actual and predicted states, including of the what-if type. This makes it possible to examine the effects of planned changes in the operator’s cyberspace resulting, for example, from modifying the scale and number of interdependent objects, adding new or redundant objects, or changing their attributes.

5. Discussion

As shown in Figure 8, the operator using the proposed solution obtains complete information about the relevance of all the objects of its cyberspace for the essential services provided. These may include procedural changes to reduce their impact on related items or the implementation of backup elements. The simulation procedures described in Section 3.4 allow the operator to conduct an in-depth cybersecurity analysis based on current and hypothetical threats. For example, Figure 9, Figure 10, Figure 11 and Figure 12 show the effect of using a simulation procedure to predict the extent and consequences of violating the availability of object A5. With data on the extent and propagation time of the effects of the threat, the operator can take mitigating actions in advance, reducing the extent and magnitude of the negative impact of a security incident. The data can also be used to update the business continuity plan. It is also worth noting that the proposed procedure for modeling cyberspace, particularly regarding identifying business objects and their impact on the security of related items, is essential to building an operator’s cybersecurity awareness. Following the proposed procedures allows the operator to discover new, including non-obvious, security interactions between objects and use them in internal security management processes. The operator has already used conclusions from the case study to take appropriate action in developing an updated version of the business continuity plan ( B C P ) and incorporate it into the business impact assessment process ( B I A ).
Results of the case study can also be used for profound analyses aimed at seeking structural and procedural changes in the organization, including IT infrastructure reorganization and enhancing processes and services to increase the resilience of the operator’s cyberspace.
We show that the proposed approach to modeling an essential service operator’s cyberspace makes it possible to obtain reliable on the state of security of its elements in near-real time. It also provides necessary information enabling response in advance to threats, including taking early action to limit their propagation.
The results of the study confirm that the critical infrastructure entity can achieve the first level of security awareness by using the proposed formalism for building a model of interconnected business processes, services, and IT infrastructure. They also confirm that the operator can predict the evolution of real threats and related risks by using elaborated simulation procedures, which ensures reaching the second level of awareness. Moreover, more detailed simulation analyses can guide the enterprise toward improving its operations in terms of resilience concerning protection against threats that support achieving the third level of security awareness.
The solutions presented in this paper, confirmed by the case study outcomes, give rise to new opportunities for managing the cybersecurity of essential services operators. The proposed methodology of cyberspace modeling enables:
  • Improving the acquisition of reliable data required by S46/Powered by NPC system;
  • Assessing the impact of degradation in interdependent business processes, services, and IT/OT infrastructure elements on achieving the entity’s strategic objectives;
  • Visualization of the actual security status of objects in the operator’s cyberspace;
  • Anticipating the proliferation of threats across the entity’s cyberspace;
  • Conducting a what-if analysis to identify structural or procedural solutions for strengthening the cybersecurity resilience of the entity.
We have proposed a promising solution to support an essential service operator’s security awareness that increases its resilience to cyberattacks. The results of the case study discussed above, the new opportunities its use brings to cybersecurity management, and the lessons learned from collaboration with potential users confirm its usefulness. However, we realize that additional efforts are required to enable its full deployment by operators.
Our ongoing works focus on incorporating the lessons learned from the pilot implementation of the methodology in the operator’s infrastructure and the continued development of the NISPI application. This work includes, among other aspects, the implementation of dynamic risk assessment procedures, risk propagation across cyberspace, and customization of the user interface to meet operator expectations.
In our approach so far, we assumed that a redundant group consisted of strictly alternative items, i.e., identically affecting a particular object or group of objects. However, we identified more complex scenarios when conducting the case study. For example, two identical applications form a redundant group, each supporting different business processes. If the security of one of them is compromised, some of the processes will be degraded. Nevertheless, the administrator can reconfigure the system such that the remaining active application supports all processes. The approach to modeling redundant groups that considers the diversity and complexity of objects’ interdependencies is the subject of our further work.
Further work also includes the development of interfaces to the operator’s internal systems used for the management of systems security and the vulnerabilities of its elements. This will enable the automation of processes for obtaining data on existing vulnerabilities of infrastructure elements and detected security incidents as well as the exchange of data supporting achieving cybersecurity awareness on the actual and predicted state of cyberspace.
The final phase will be the deployment of an interface to the S46/Powered by NPC system, enabling the operator to submit reliable data on the security of its cyberspace to the relevant national-level CSIRT and acquire data on global cyberspace threats that may affect the operator.

Author Contributions

Conceptualization, M.A.; methodology, M.A. and M.K.; formal analysis, M.A. and M.K.; experimentation, M.K.; data analysis, M.A.; writing—original draft preparation, M.A. and M.K.; writing—review and editing, M.K.; visualization, M.A.; supervision, M.A. All authors have read and agreed to the published version of the manuscript.

Funding

This research received no external funding.

Institutional Review Board Statement

Not applicable.

Informed Consent Statement

Not applicable.

Data Availability Statement

Not applicable.

Acknowledgments

The authors would like to thank the software team from NASK—National Research Institute, led by Włodzimierz Waligórski, for their efforts in developing the NISPI application, which made it possible to use it for the case study. We also thank Krzysztof Olesik, Marek Janiszewski, and Piotr Lewandowski for sharing their studies, exciting discussions, and valuable suggestions that helped structure this work.

Conflicts of Interest

The authors declare no conflict of interest.

References

  1. Petit, F.; Lewis, L. Incorporating Logical Dependencies and Interdependencies into Infrastructure Analyses; George Mason University: Fairfax, VA, USA, 2016. [Google Scholar]
  2. Stergiopoulos, G.; Kotzanikolaou, P.; Theocharidou, M.; Lykou, G.; Gritzalis, D. Time-based critical infrastructure dependency analysis for large-scale and cross-sectoral failures. Int. J. Crit. Infrastruct. Prot. 2016, 12, 46–60. [Google Scholar] [CrossRef]
  3. Han, C.H.; Park, S.T.; Lee, S.J. The enhanced security control model for critical infrastructures with the blocking prioritisation process to cyber threats in power system. Int. J. Crit. Infrastruct. Prot. 2019, 26, 100312. [Google Scholar] [CrossRef]
  4. Settanni, G.; Skopik, F.; Shovgenya, Y.; Fiedler, R.; Carolan, M.; Conroy, D.; Boettinger, K.; Gall, M.; Brost, G.; Ponchel, C.; et al. A collaborative cyber incident management system for European interconnected critical infrastructures. J. Inf. Secur. Appl. 2017, 34, 166–182. [Google Scholar] [CrossRef]
  5. Puuska, S.; Rummukainen, L.; Timonen, J.; Lääperi, L.; Klemetti, M.; Oksama, L.; Vankka, J. Nationwide critical infrastructure monitoring using a common operating picture framework. Int. J. Crit. Infrastruct. Prot. 2018, 20, 28–47. [Google Scholar] [CrossRef]
  6. Turoff, M.; Bañuls, V.A.; Plotnick, L.; Hiltz, S.R.; Ramírez de la Huerga, M. A collaborative dynamic scenario model for the interaction of critical infrastructures. Futures 2016, 84, 23–42. [Google Scholar] [CrossRef]
  7. European Union. Directive (EU) 2016/1148 of the European Parliament and of the Council Concerning Measures for a High Common Level of Security of Network and Information Systems across the Union. Available online: https://eur-lex.europa.eu/legal-content/EN/TXT/?uri=celex:32016L1148 (accessed on 29 September 2022).
  8. Amanowicz, M. A Shared Cybersecurity Awareness Platform. J. Telecommun. Inf. Technol. 2021, 3, 32–41. [Google Scholar] [CrossRef]
  9. Trucco, P.; Cagno, E.; De Ambroggi, M. Dynamic functional modelling of vulnerability and interoperability of Critical Infrastructures. Reliab. Eng. Syst. Saf. 2012, 105, 51–63. [Google Scholar] [CrossRef]
  10. De Domenico, M.; Solé-Ribalta, A.; Omodei, E.; Gómez, S.; Arenas, A. Ranking in interconnected multilayer networks reveals versatile nodes. Nat. Commun. 2015, 6, 6868. [Google Scholar] [CrossRef] [PubMed] [Green Version]
  11. Zio, E.; Ferrario, E. A framework for the system-of-systems analysis of the risk for a safety-critical plant exposed to external events. Reliab. Eng. Syst. Saf. 2013, 114, 114–125. [Google Scholar] [CrossRef] [Green Version]
  12. Chen, T.; Wu, S.; Yang, J.; Cong, G. Risk Propagation Model and Its Simulation of Emergency Logistics Network Based on Material Reliability. Int. J. Environ. Res. Public Health 2019, 16, 4677. [Google Scholar] [CrossRef] [PubMed]
  13. Li, M.; Wang, Y.; Jia, L.; Cui, Y. Risk propagation analysis of urban rail transit based on network model. Alex. Eng. J. 2020, 59, 1319–1331. [Google Scholar] [CrossRef]
  14. Zhu, B.; Deng, S.; Xu, Y.; Yuan, X.; Zhang, Z. Information Security Risk Propagation Model Based on the SEIR Infectious Disease Model for Smart Grid. Information 2019, 10, 323. [Google Scholar] [CrossRef] [Green Version]
  15. Mao, Q.; Li, N. Assessment of the impact of interdependencies on the resilience of networked critical infrastructure systems. Nat. Hazards 2018, 93, 315–337. [Google Scholar] [CrossRef]
  16. Galbusera, L.; Trucco, P.; Giannopoulos, G. Modeling interdependencies in multi-sectoral critical infrastructure systems: Evolving the DMCI approach. Reliab. Eng. Syst. Saf. 2020, 203, 107072. [Google Scholar] [CrossRef]
  17. Goldbeck, N.; Angeloudis, P.; Ochieng, W.Y. Resilience assessment for interdependent urban infrastructure systems using dynamic network flow models. Reliab. Eng. Syst. Saf. 2019, 188, 62–79. [Google Scholar] [CrossRef]
  18. Stergiopoulos, G.; Dedousis, P.; Gritzalis, D. Automatic analysis of attack graphs for risk mitigation and prioritization on large-scale and complex networks in Industry 4.0. Int. J. Inf. Secur. 2022, 21, 37–59. [Google Scholar] [CrossRef]
  19. Ouyang, M. Review on modeling and simulation of interdependent critical infrastructure systems. Reliab. Eng. Syst. Saf. 2014, 121, 43–60. [Google Scholar] [CrossRef]
  20. Polish Parliament. Act on the National Cybersecurity System. J. Laws 2018, 2018, 1560. Available online: https://isap.sejm.gov.pl/isap.nsf/download.xsp/WDU20180001560/U/D20181560Lj.pdf (accessed on 29 September 2022).
  21. Setola, R.; Rosato, V.; Kyriakides, E.; Rome, E. Managing the Complexity of Critical Infrastructures; Studies in Systems, Decision and Control; Springer International Publishing: Berlin/Heidelberg, Germany, 2016; Volume 90. [Google Scholar] [CrossRef]
  22. Saaty, T. Relative measurement and its generalization in decision making why pairwise comparisons are central in mathematics for the measurement of intangible factors the analytic hierarchy/Network Process. RACSAM Rev. R. Acad. Cien. Serie A Mat. 2008, 102, 251–318. [Google Scholar] [CrossRef]
  23. Janiszewski, M.; Felkner, A.; Lewandowski, P. A Novel Approach to National-level Cyber Risk Assessment Based on Vulnerability Management and Threat Intelligence. J. Telecommun. Inf. Technol. 2019, 2, 5–14. [Google Scholar] [CrossRef]
  24. CVSS Special Interest Group. Common Vulnerability Scoring System Version 3.1: Specification Document. In FIRST—Forum of Incident Response and Security Teams; FIRST: Cary, NC, USA, 2019; Standard; Available online: https://www.first.org/cvss/specification-document (accessed on 29 September 2022).
  25. Kim, A.; Kang, M.H.; Luo, J.Z.; Velasquez, A. A Framework for Event Prioritization in Cyber Network Defense; Technical Report; US Dept. of the Navy: Arlington County, VA, USA, 2014. [Google Scholar] [CrossRef]
Figure 1. Cyberspace of an essential services operator.
Electronics 11 03835 g001
Figure 2. Redundant objects model. Edge attributes are event propagation times: t and ρ are used for source service deterioration, and τ is used for service recovery.
Electronics 11 03835 g002
Figure 3. The principle of calculating the criticality of redundant objects.
Electronics 11 03835 g003
Figure 4. Example of structures for modeling (a) linear and (b) nonlinear service degradation dependencies.
Electronics 11 03835 g004
Figure 5. (a) Example scenario of redundant node failure and activation. (b) Model expansion in the case of resource discretization into compartments.
Electronics 11 03835 g005
Figure 6. View of the operator cyberspace.
Electronics 11 03835 g006
Figure 7. Selected part of the operator cyberspace.
Electronics 11 03835 g007
Figure 8. Visualizing the business criticality of objects.
Electronics 11 03835 g008
Figure 9. Objects availability at time t = 15 s.
Electronics 11 03835 g009
Figure 10. Object availability at time t = 5 min.
Electronics 11 03835 g010
Figure 11. Object availability at time t = 4 h.
Electronics 11 03835 g011
Figure 12. Changes in the object status over time.
Electronics 11 03835 g012
Table 1. Dependency matrix X n j .
V j ( a ) V j ( i ) V j ( c )
V n ( a ) x n j a a x n j a i x n j a c
V n ( i ) x n j i a x n j i i x n j i c
V n ( c ) x n j c a x n j c i x n j c c
Table 2. Example of CVSS value translation [25].
FeatureCVSS ValueNumerical Value
Confidentiality/Integrity/AvailabilityHigh1
Low0.3
None0
Attack VectorNetwork1
Adjacent0.8
Local0.4
Physical0.2
Privileges RequiredHigh1
Low0.3
None0
Table 3. Expected recovery time.
ObjectMinimumMaximum
[min][min]
E S 60240
I S 120720
E X 3480
P2404320
A120120
H240240
L480480
Table 4. Business criticality of objects.
Object υ Object υ Object υ Object υ
ES10.555P30.021A30.021H30.682
ES20.444P40.035A40.072L10.286
IS10.083P50.028A50,27L20.286
IS20.116P60.056A60.005EX10.083
IS30.035P70.056A70.008EX20.008
IS40.083P80.056A80.011EX30.172
IS50.116P90.056A90.056EX40.086
IS60.116P100.116A100.2EX50.057
IS70.116P110.132A110.034
P10.132A10.066H10.389
P20.122A20.179H20.389
Publisher’s Note: MDPI stays neutral with regard to jurisdictional claims in published maps and institutional affiliations.

